Downloaded 11 times

![ζ-potential
Zeta potential is a scientific term for electrokinetic potential in colloidal
dispersions, is usually denoted ζ-potential. From a theoretical
viewpoint, the zeta potential is the electric potential in the interfacial
double layer (DL) at the location of the slipping plane relative to a point
in the bulk fluid away from the interface.
It is widely used for quantification of the magnitude of the charge. The
zeta potential is a key indicator of the stability of colloidal dispersions.
Zeta potential [mV] Stability
from 0 to ±5, Rapid coagulation or flocculation
from ±10 to ±30 Incipient instability
from ±30 to ±40 Moderate stability
from ±40 to ±60 Good stability
more than ±61 Excellent stability
Zeta potential is not measurable directly but it can be calculated using
theoretical models and an experimentally-determined electrophoretic
mobility or dynamic electrophoretic mobility.](https://image.slidesharecdn.com/1acharacterization-141203235902-conversion-gate02/75/1a-characterization-13-2048.jpg)
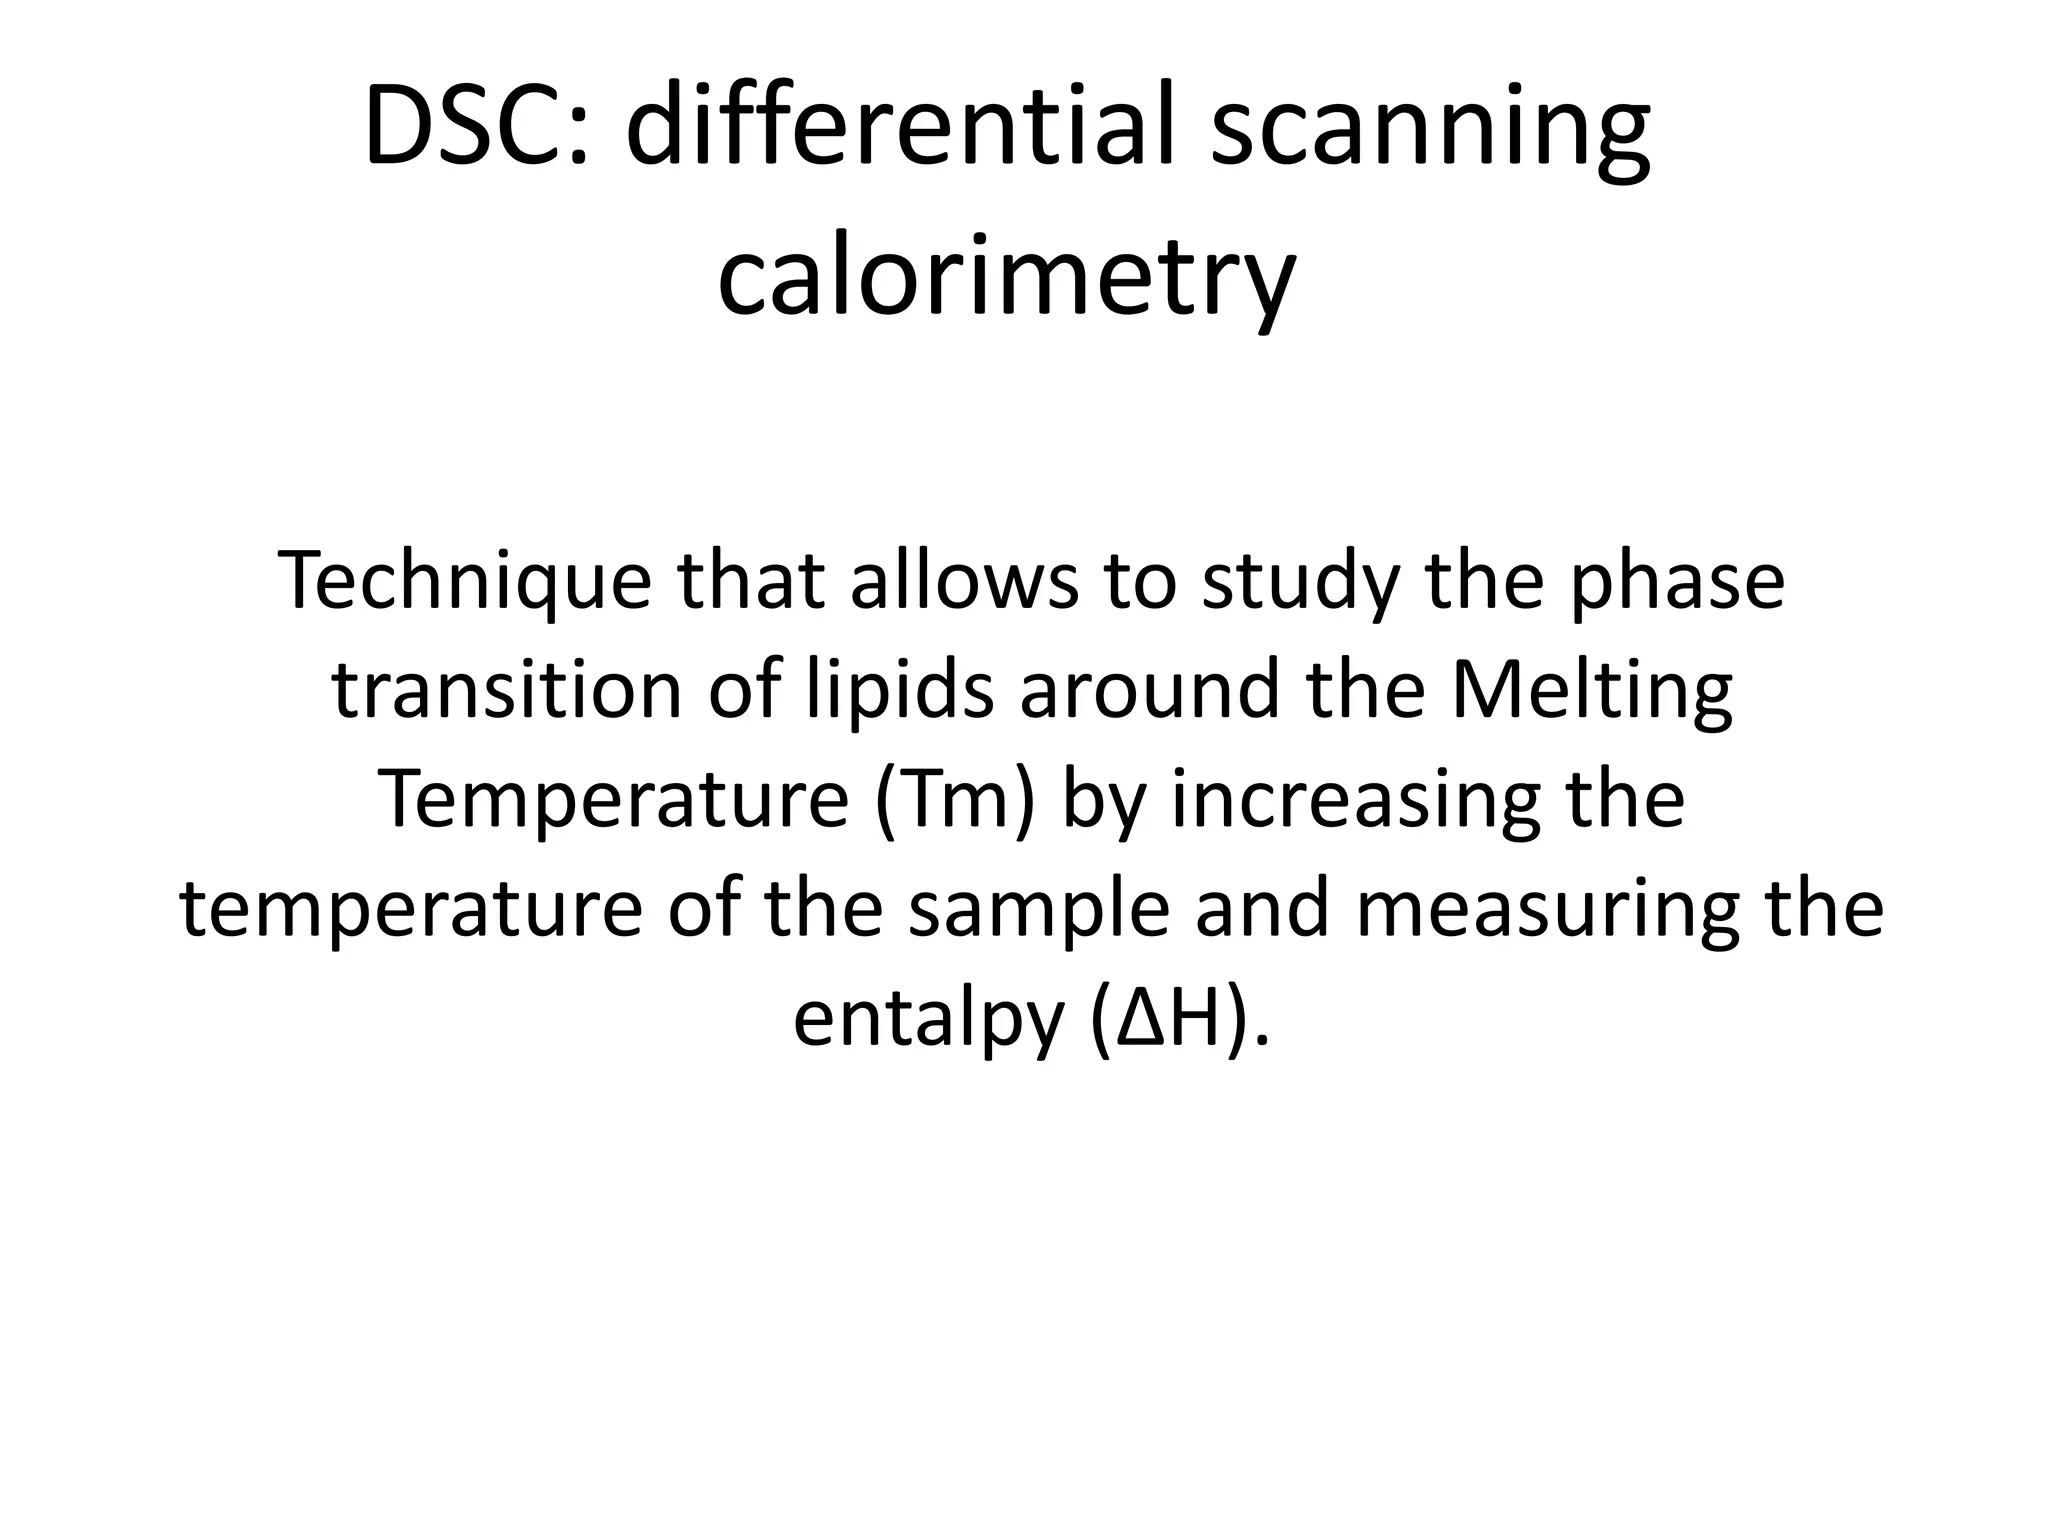
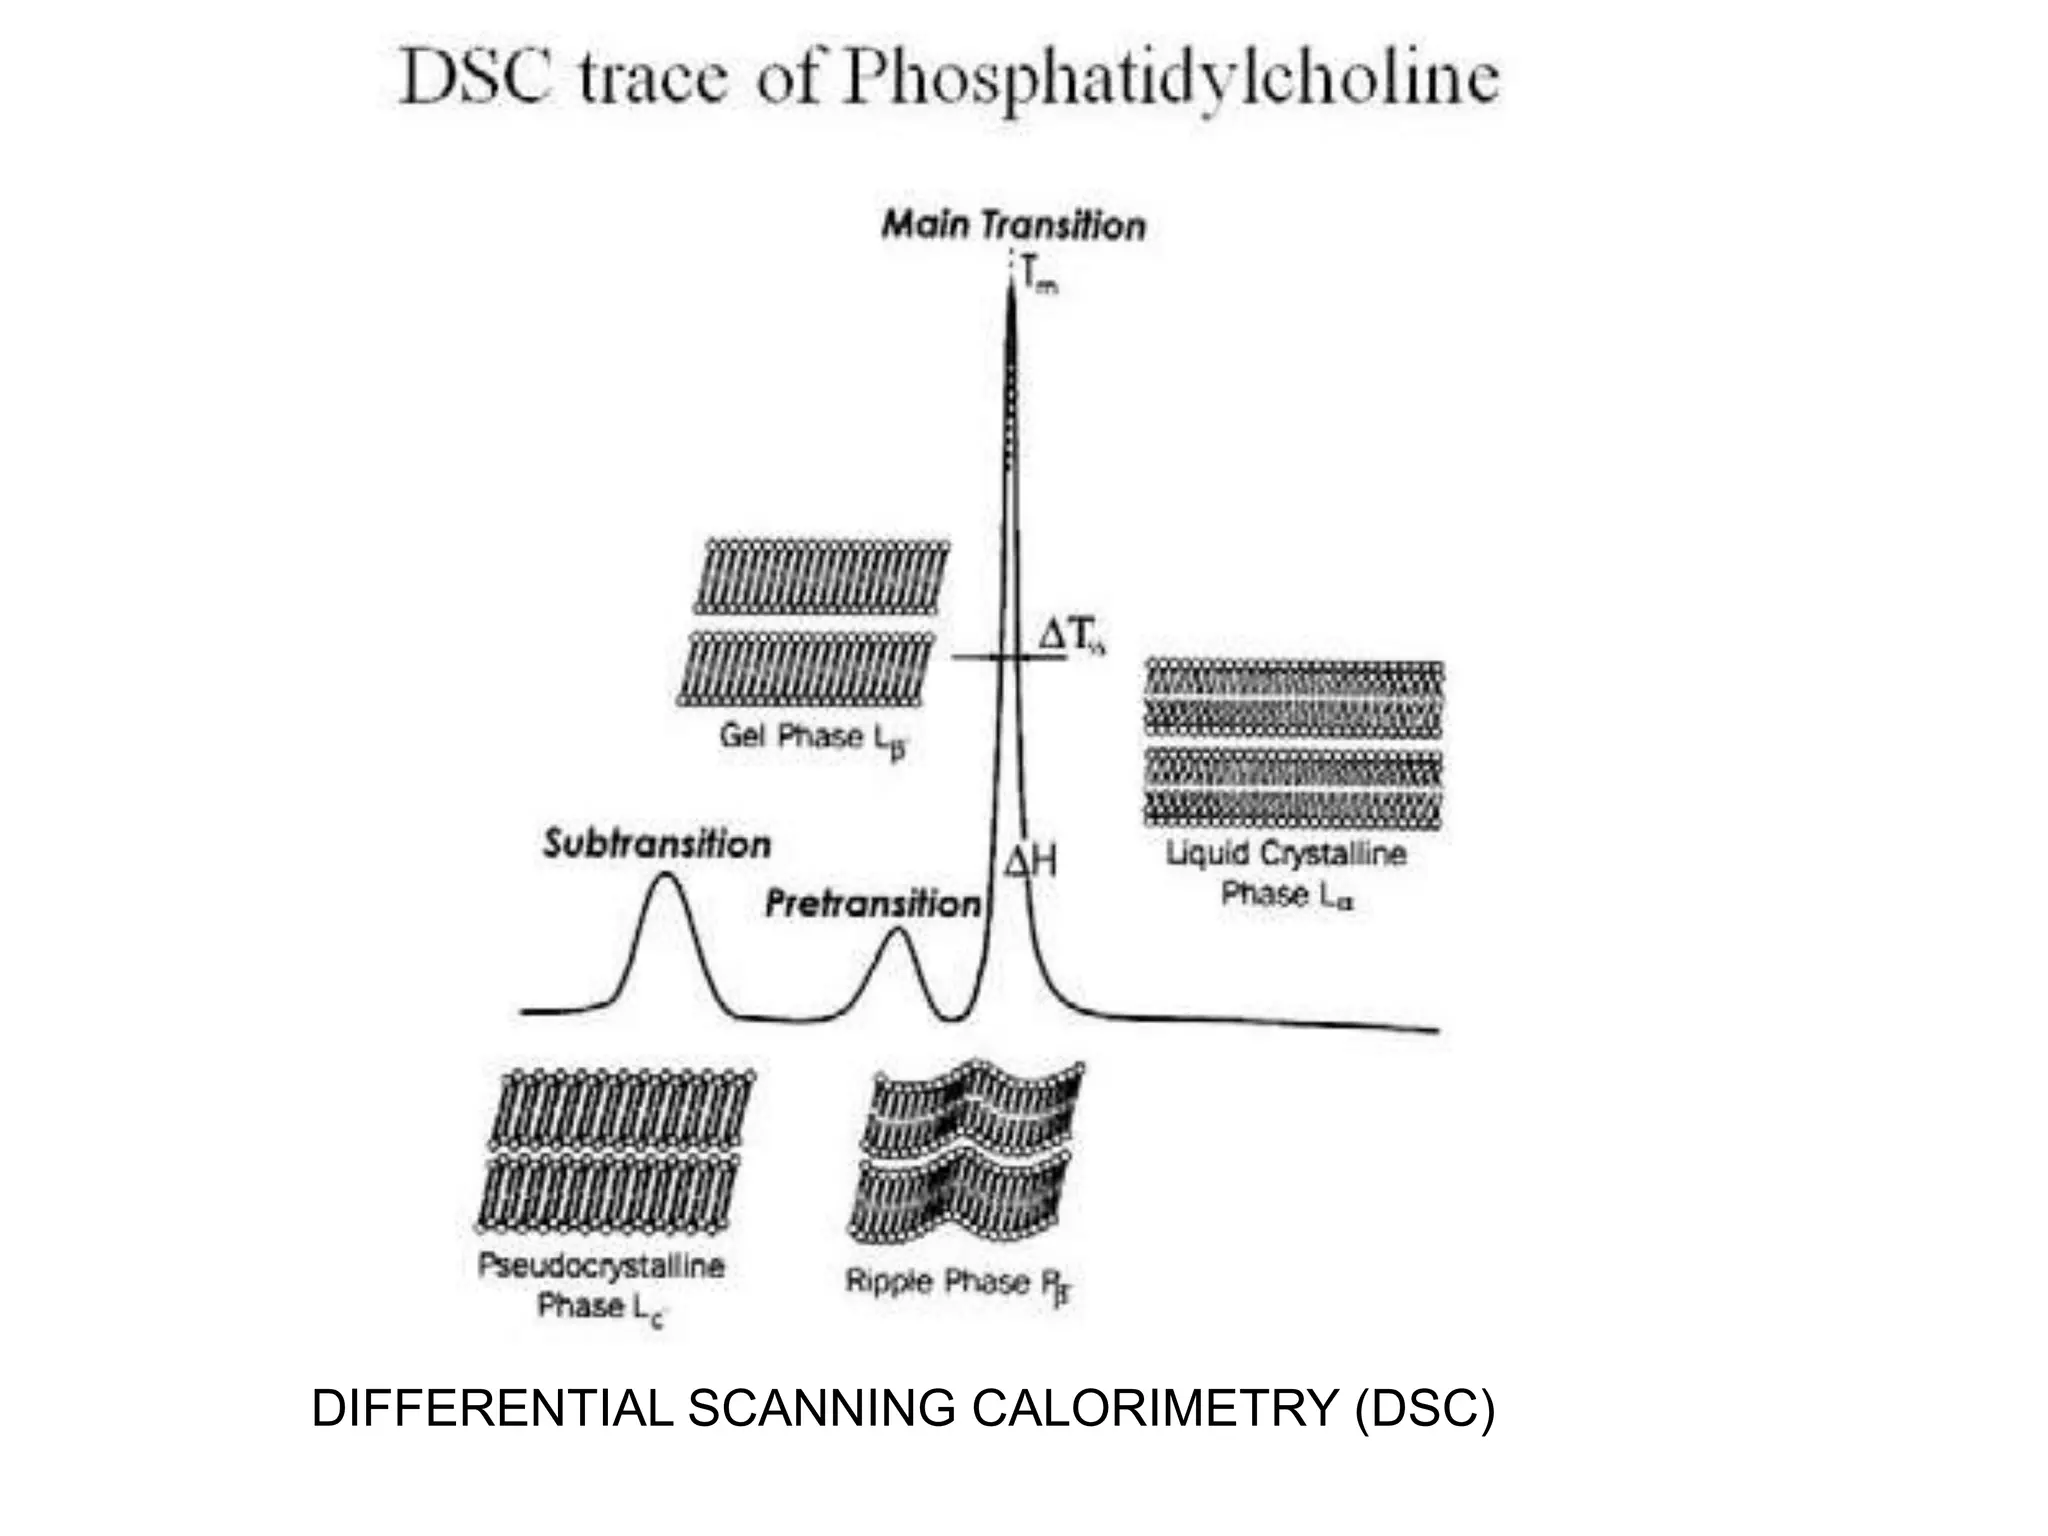

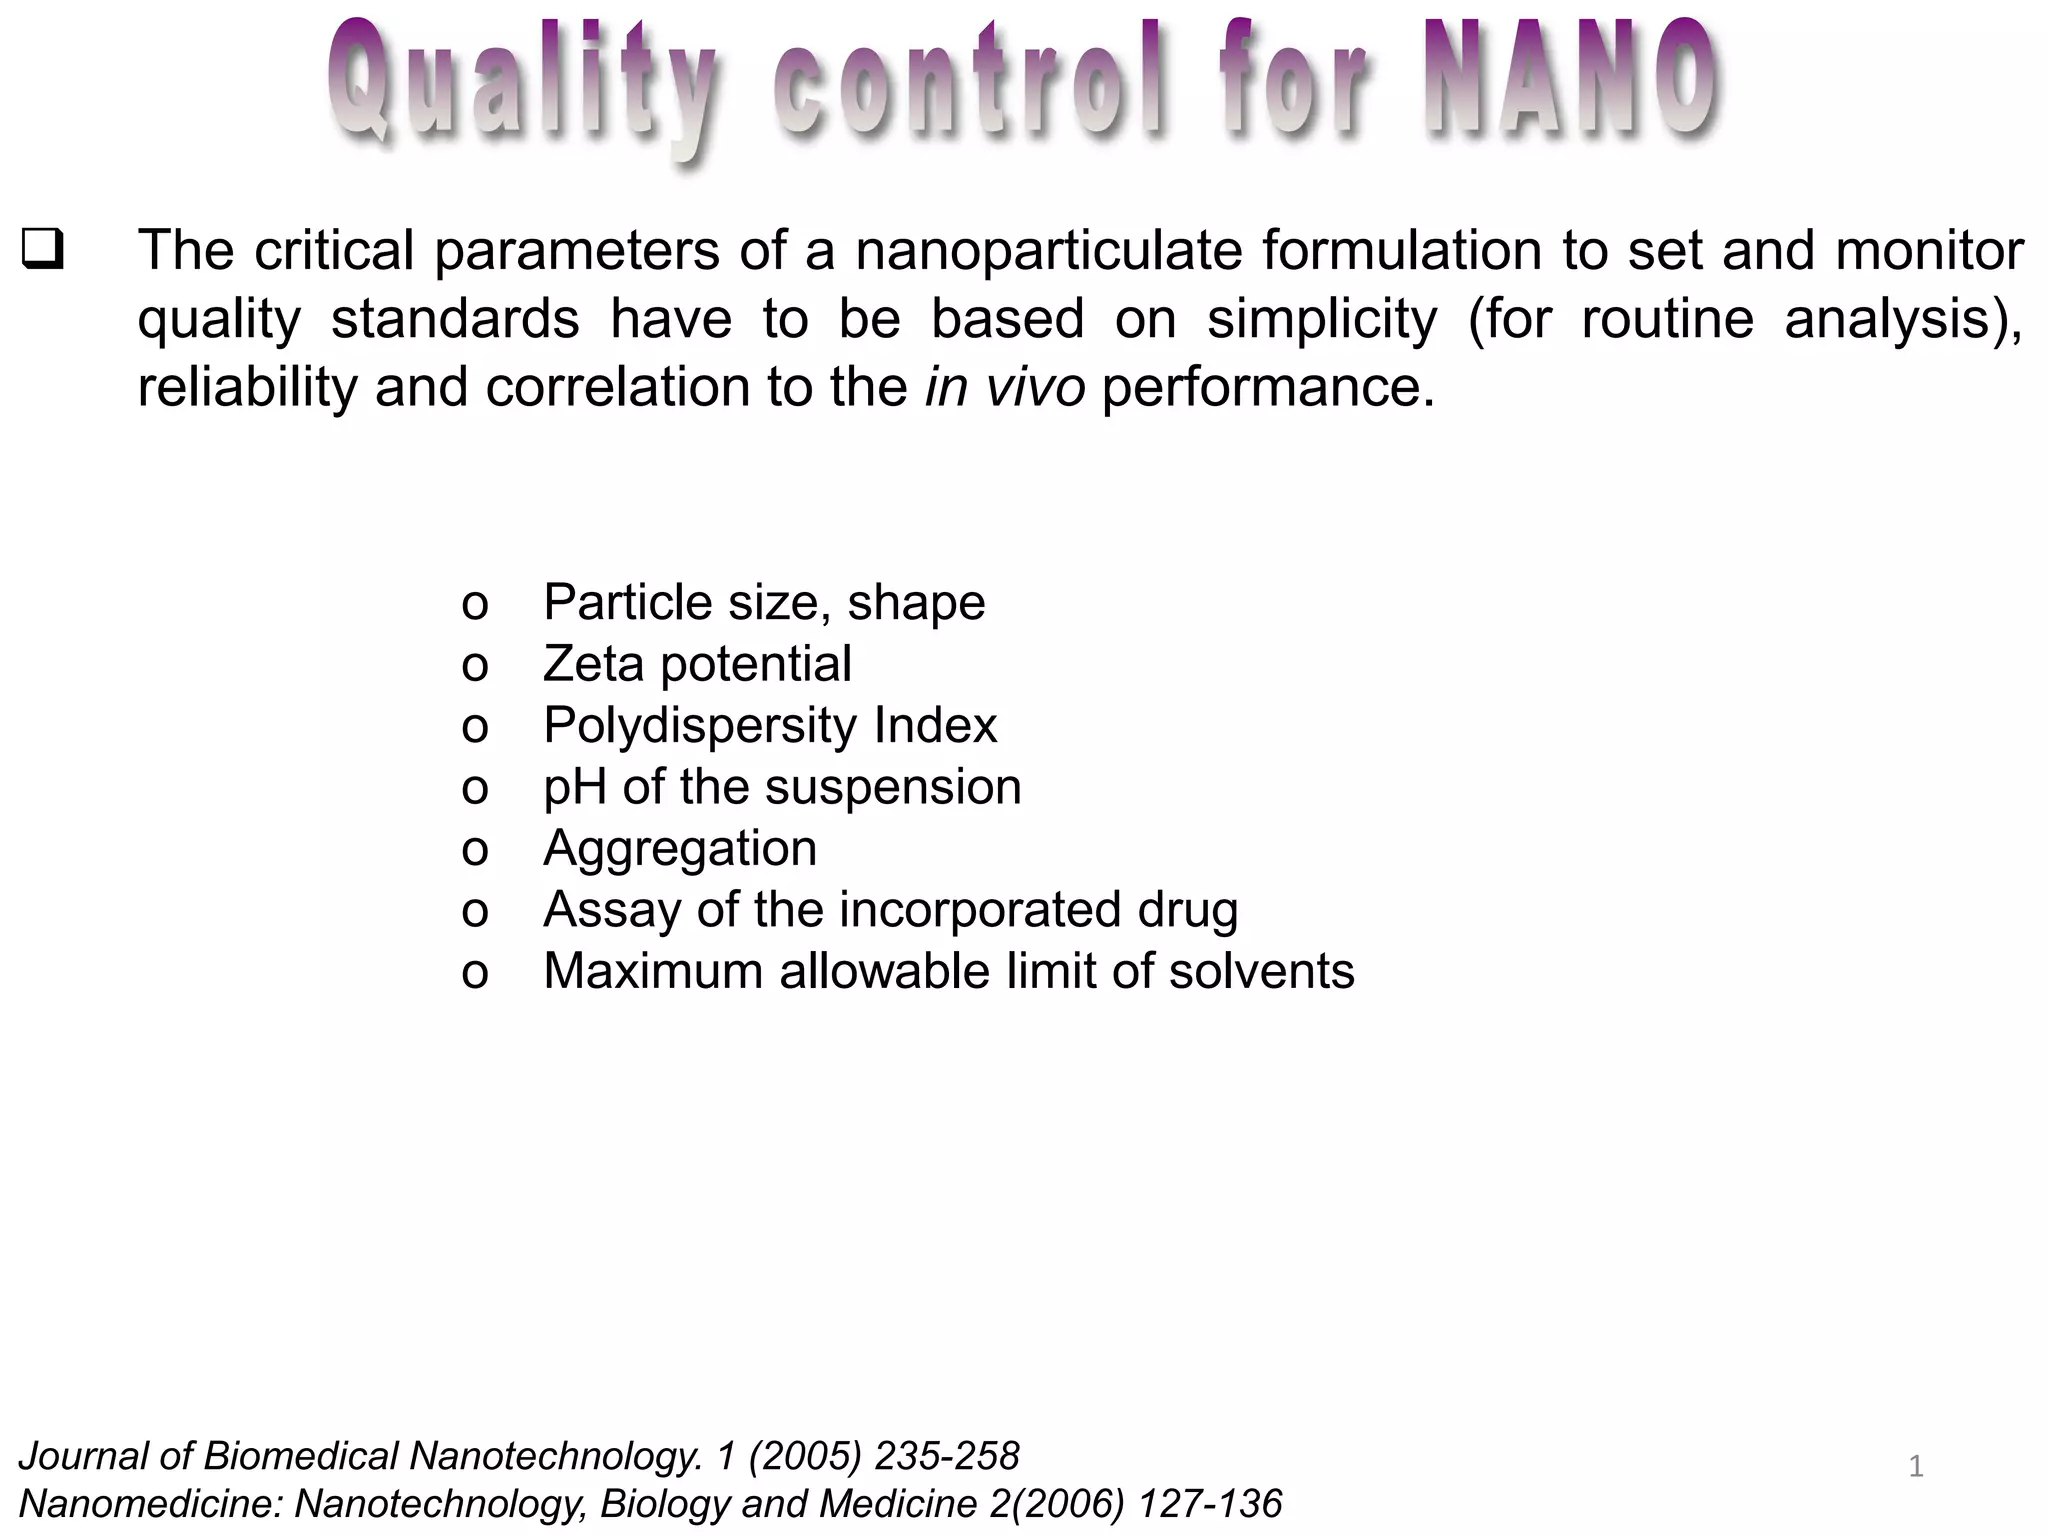
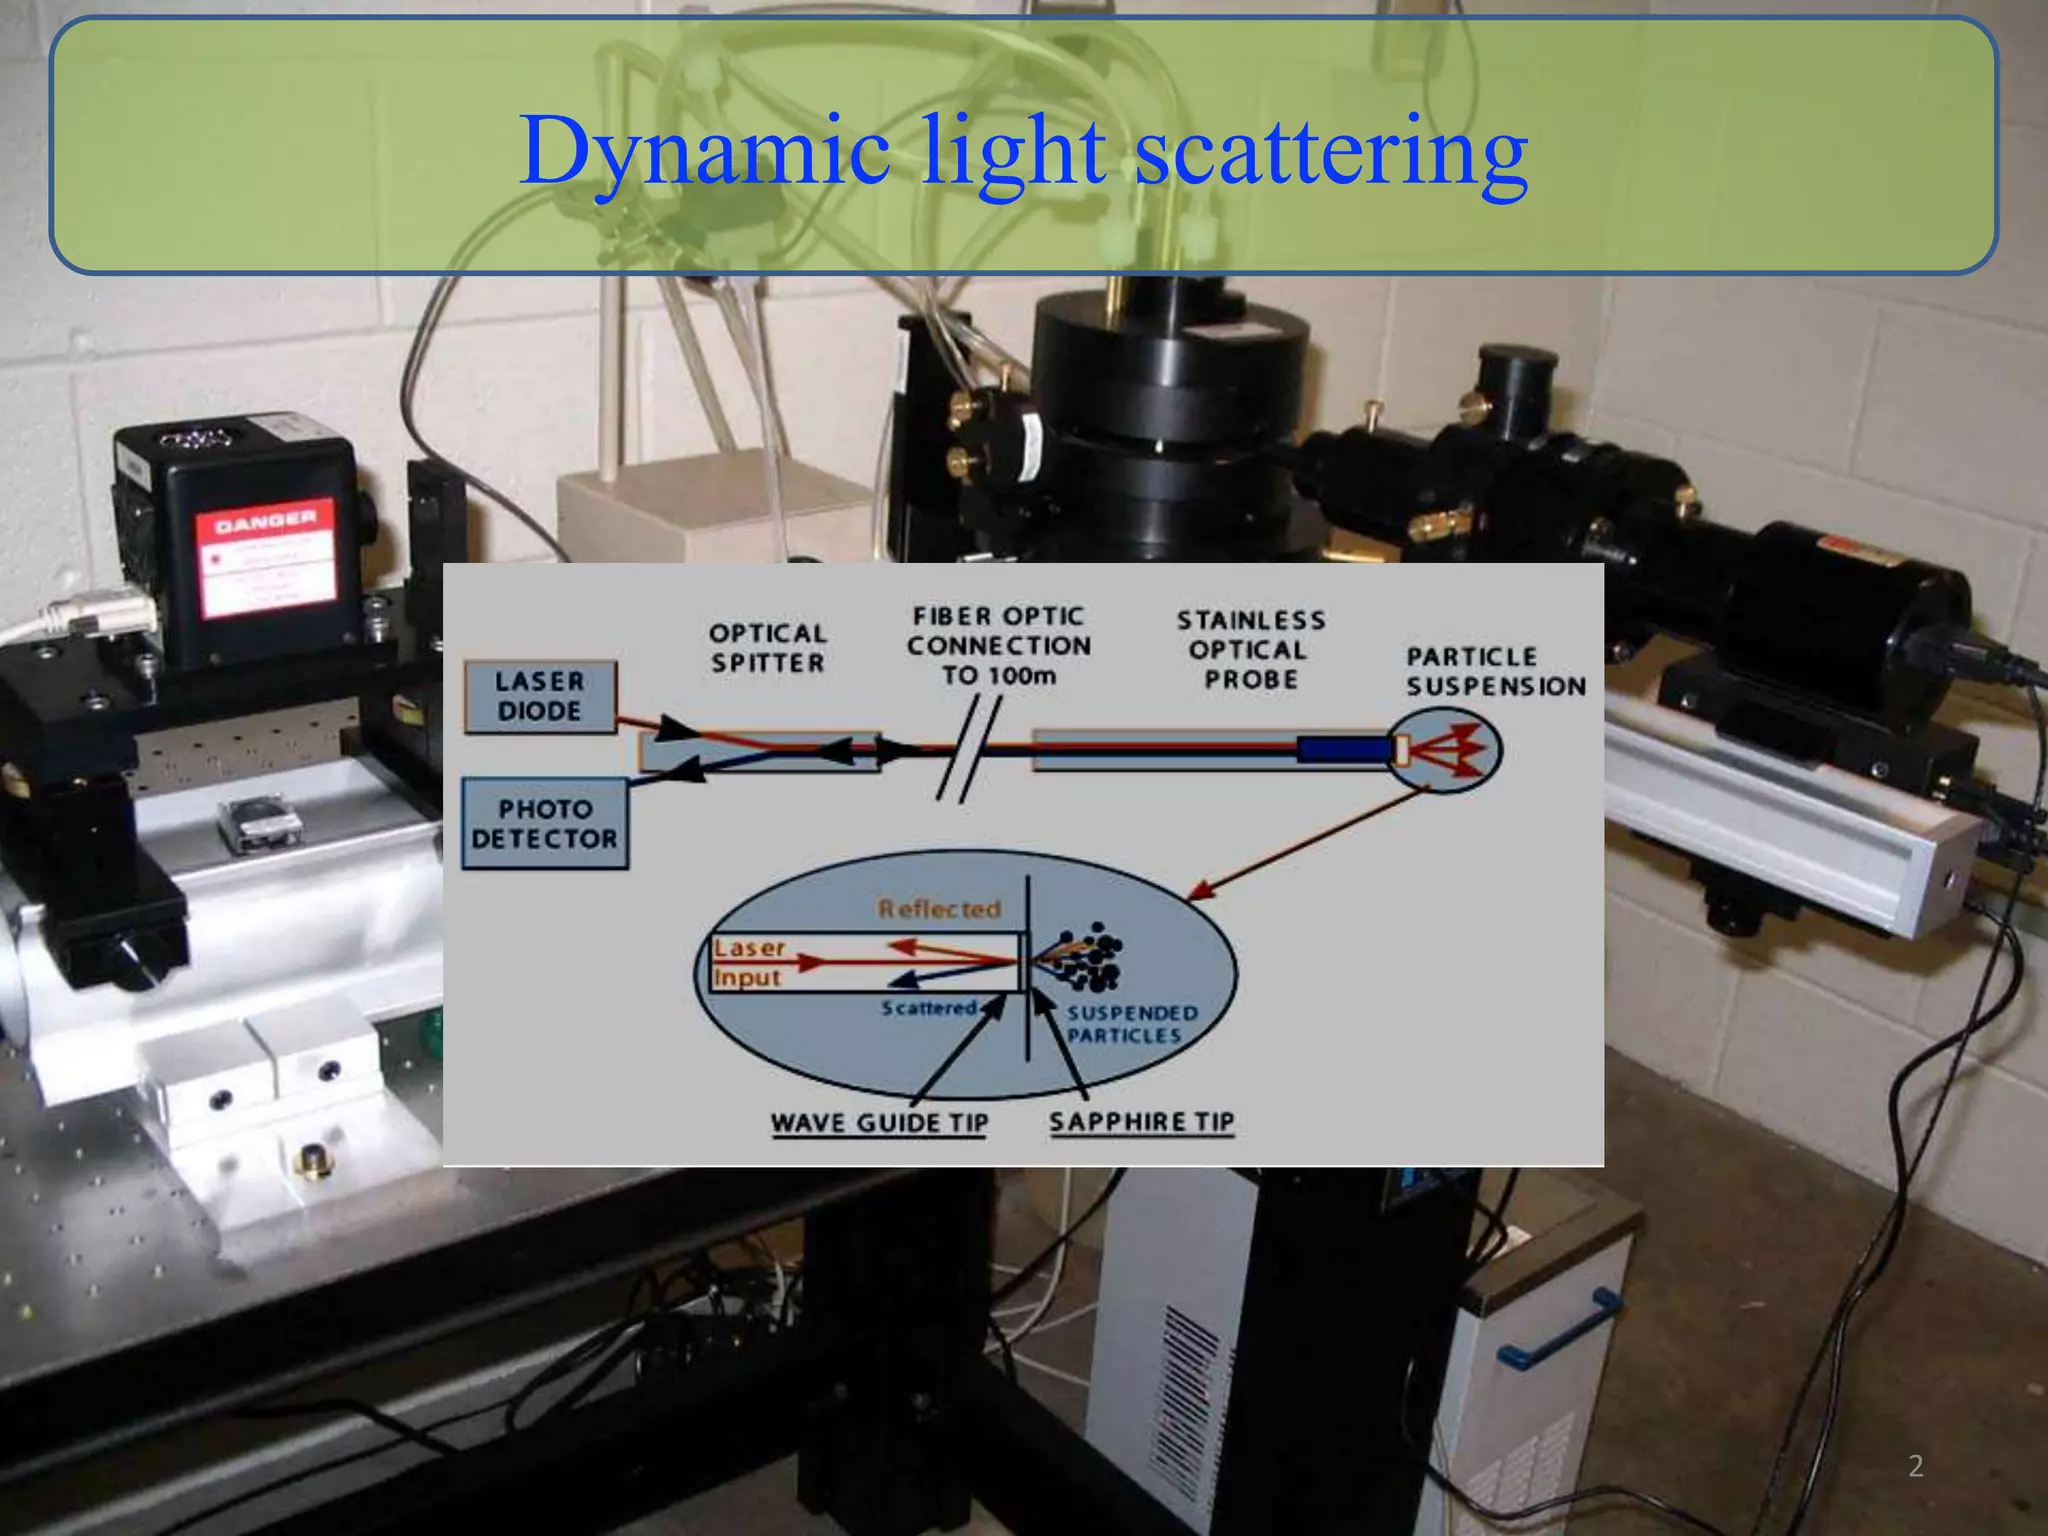
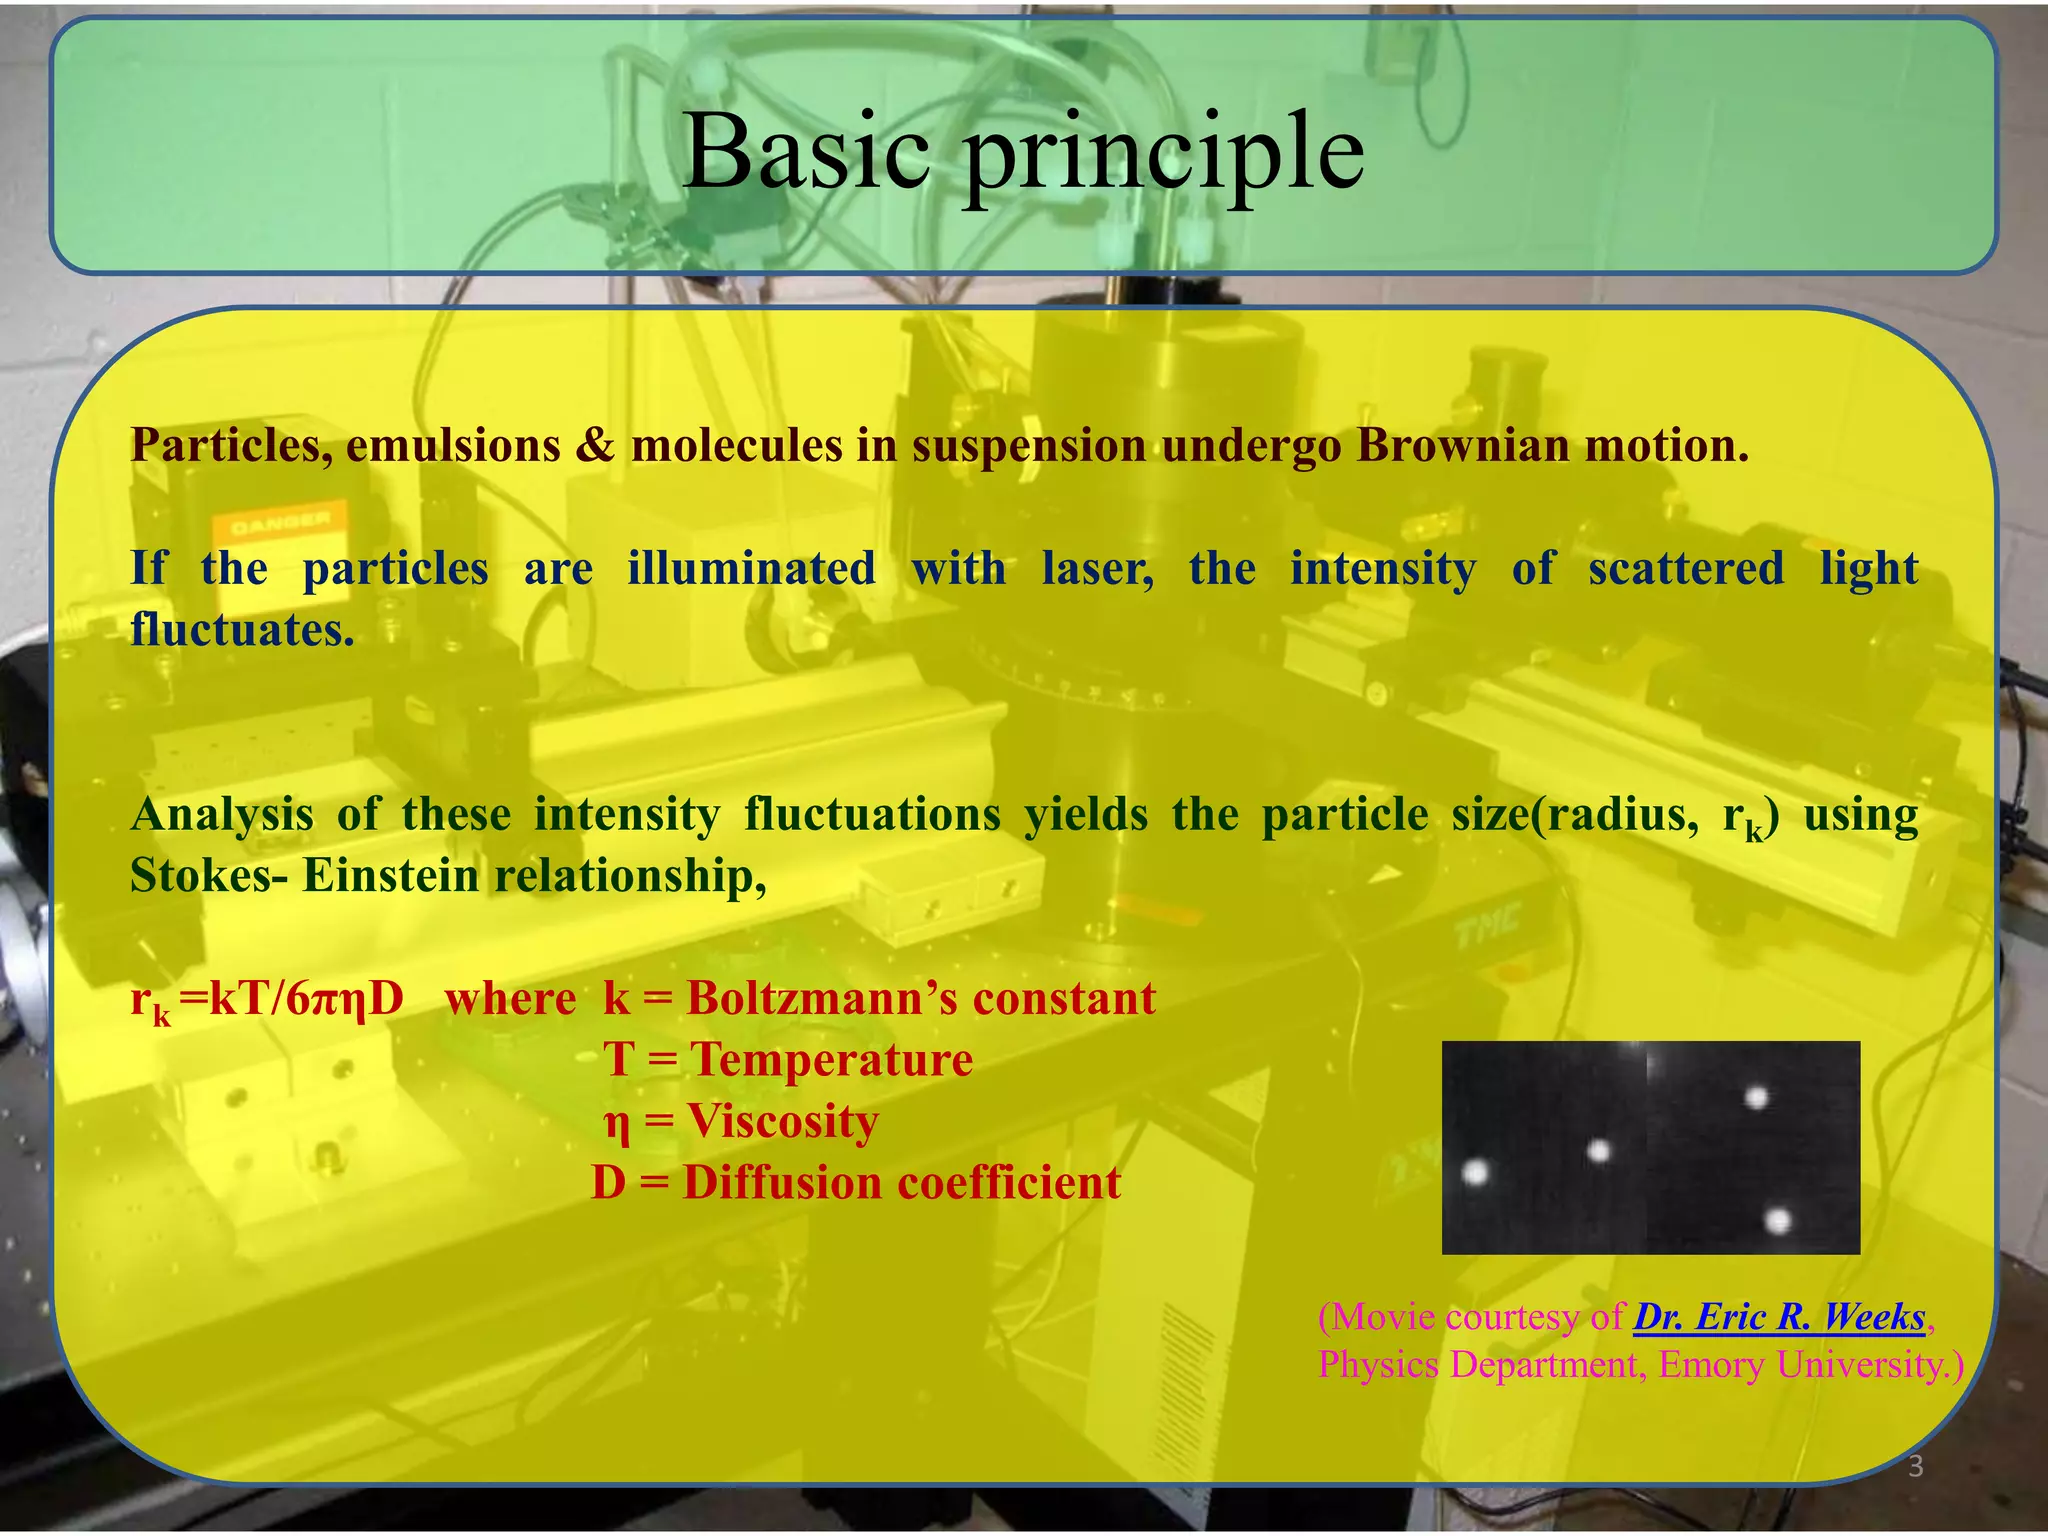
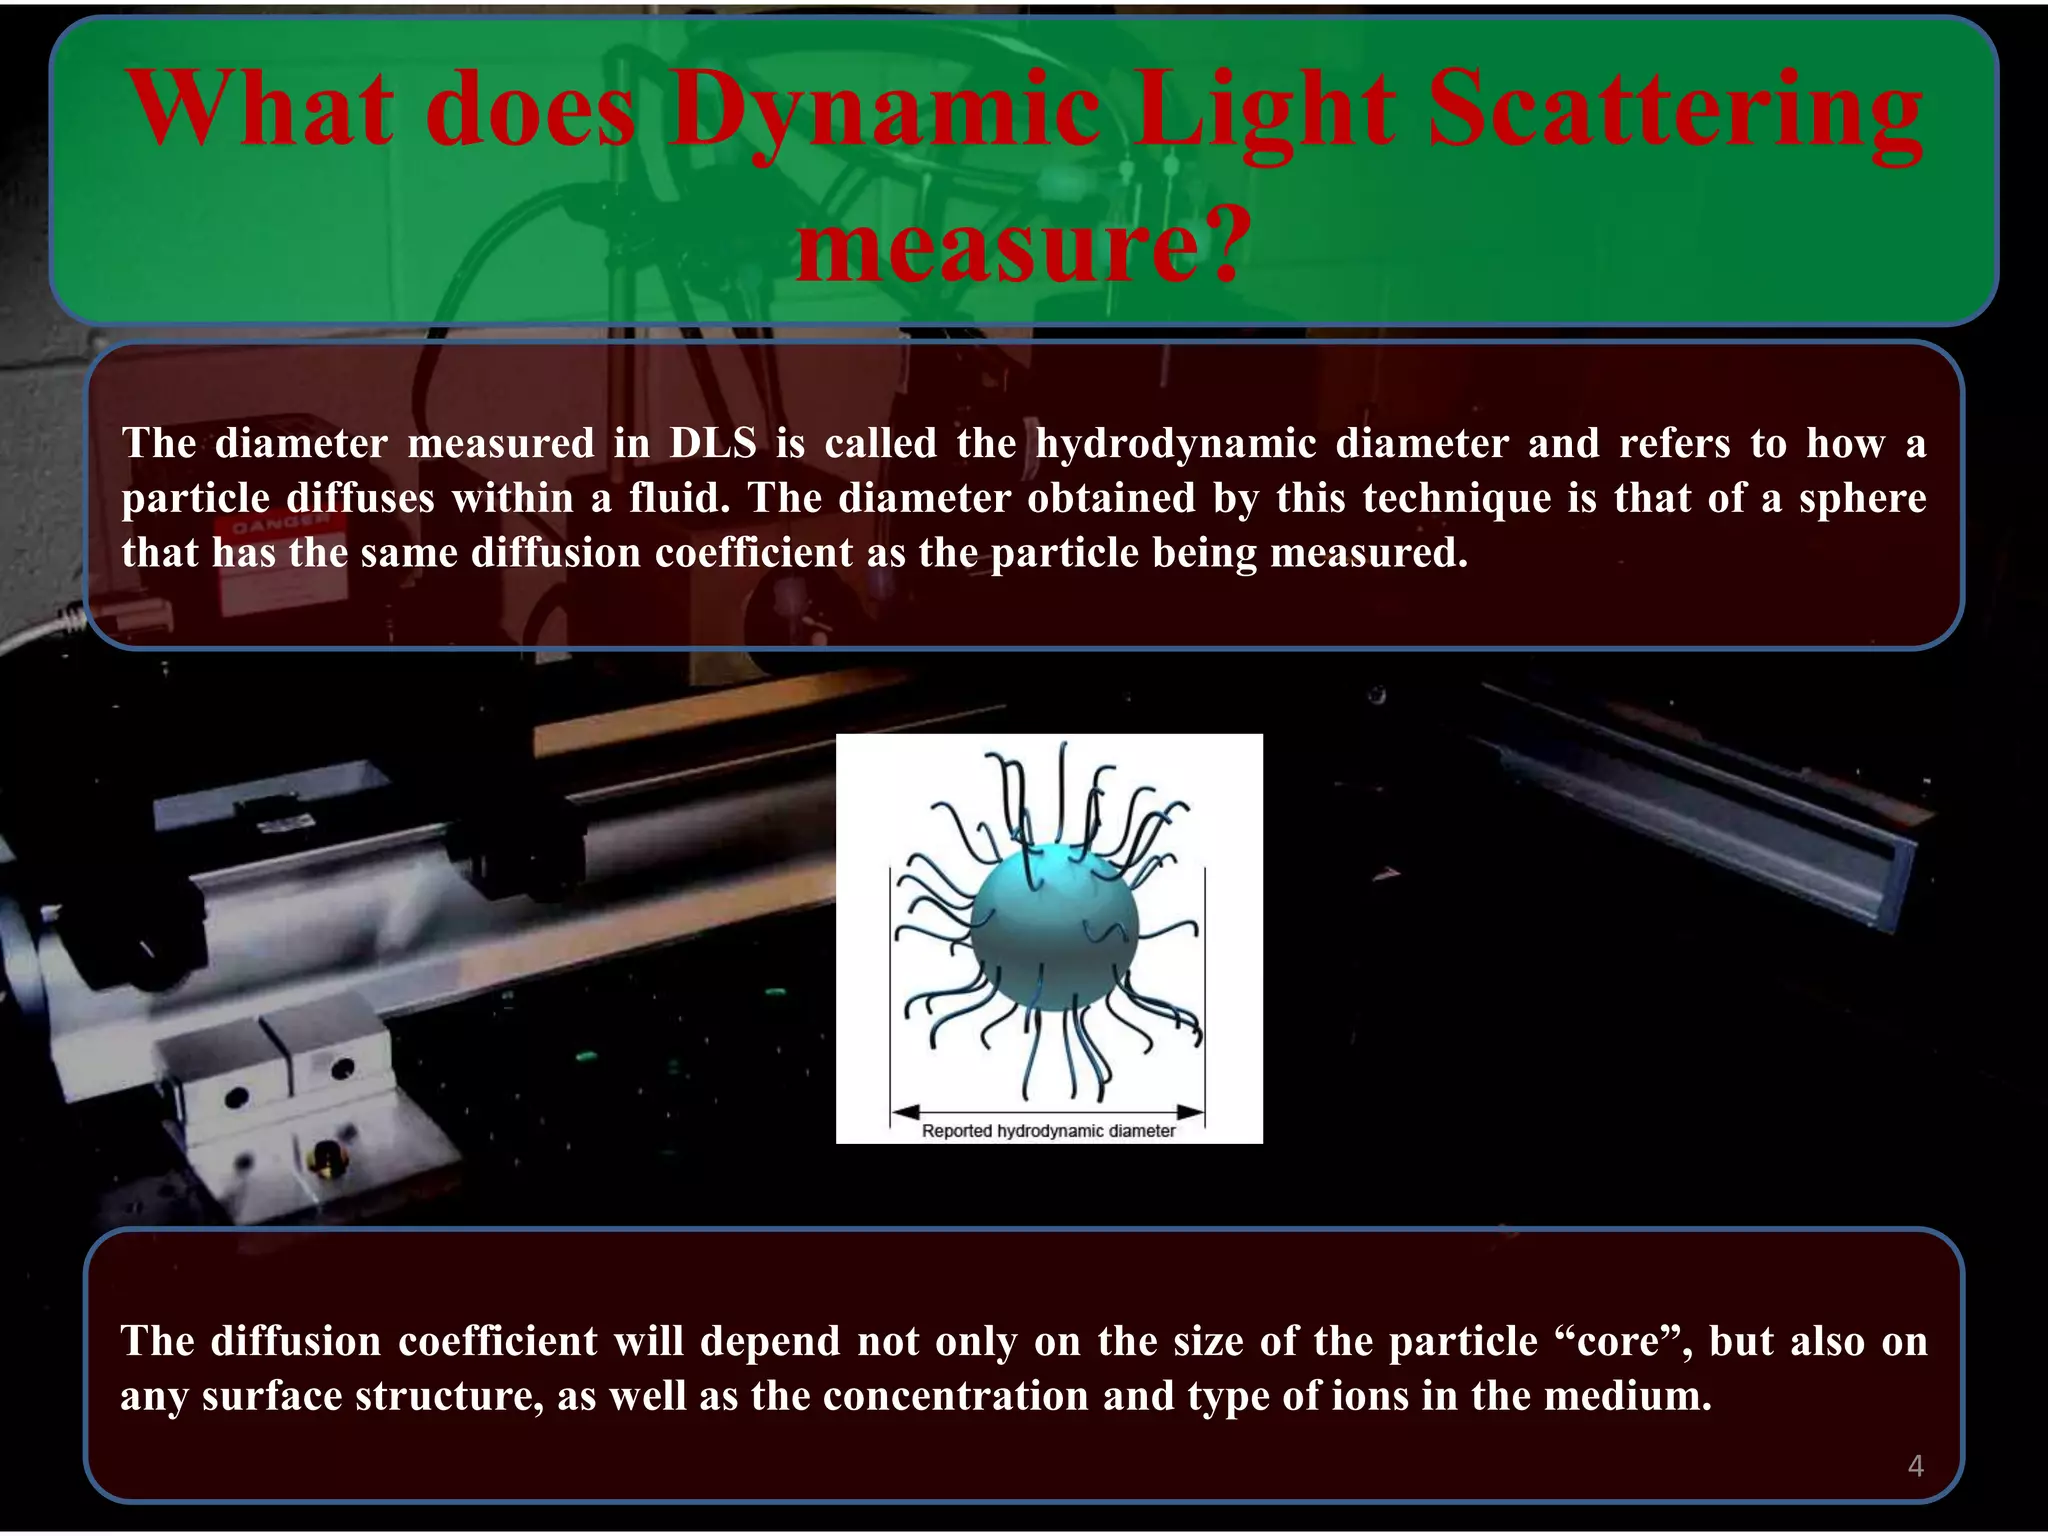
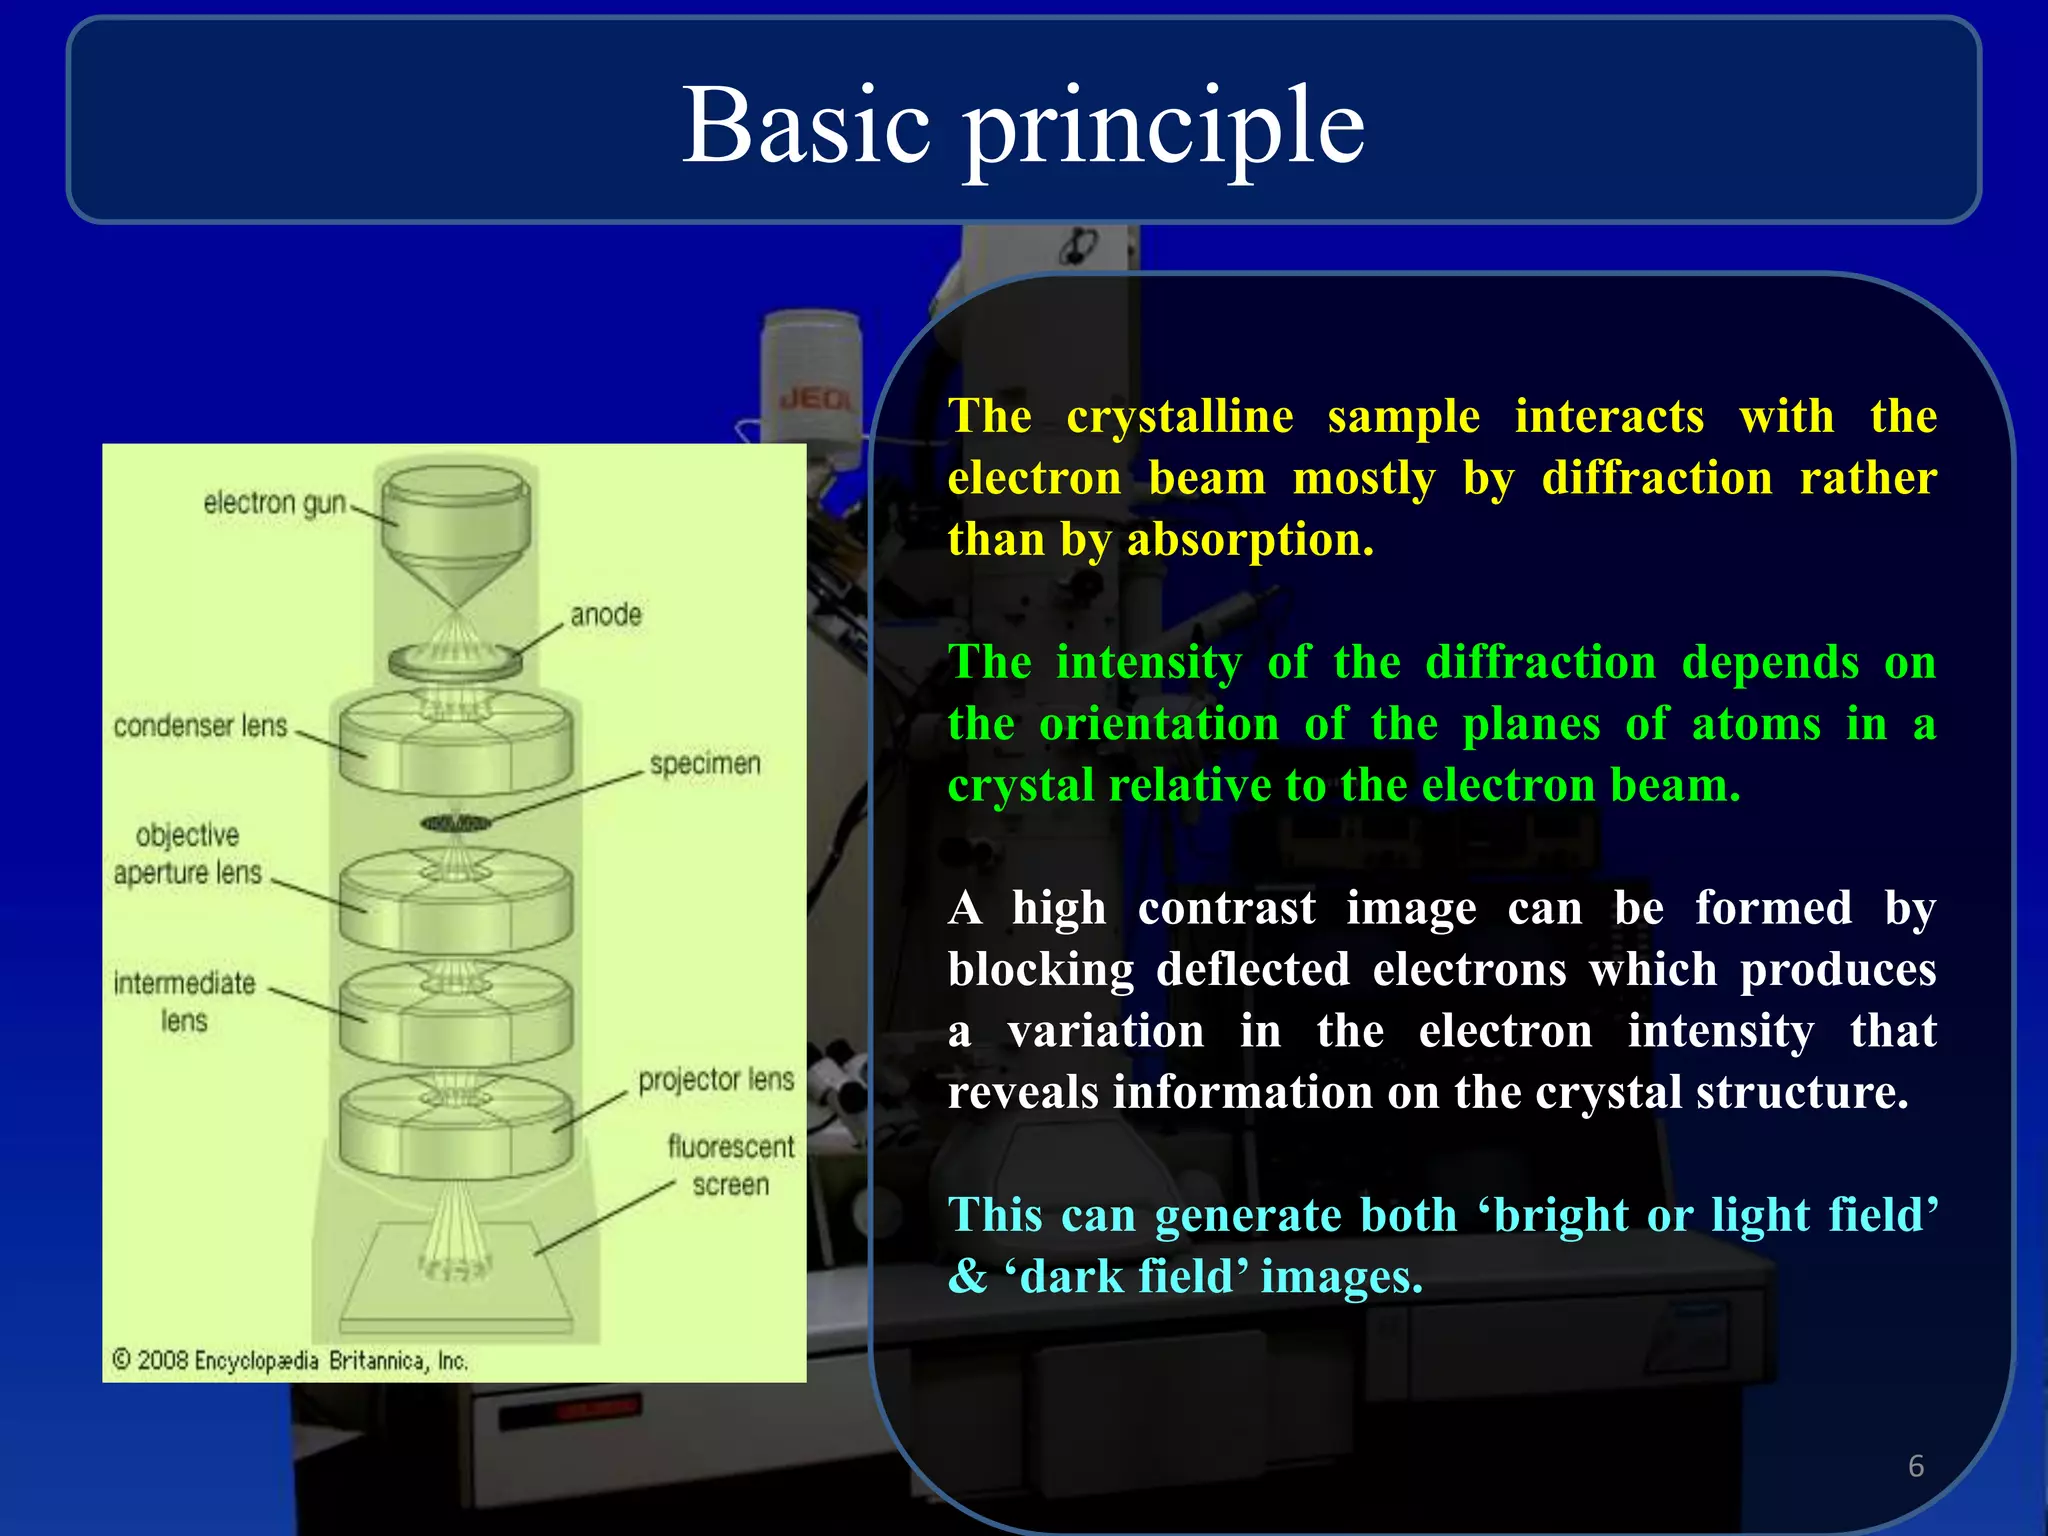
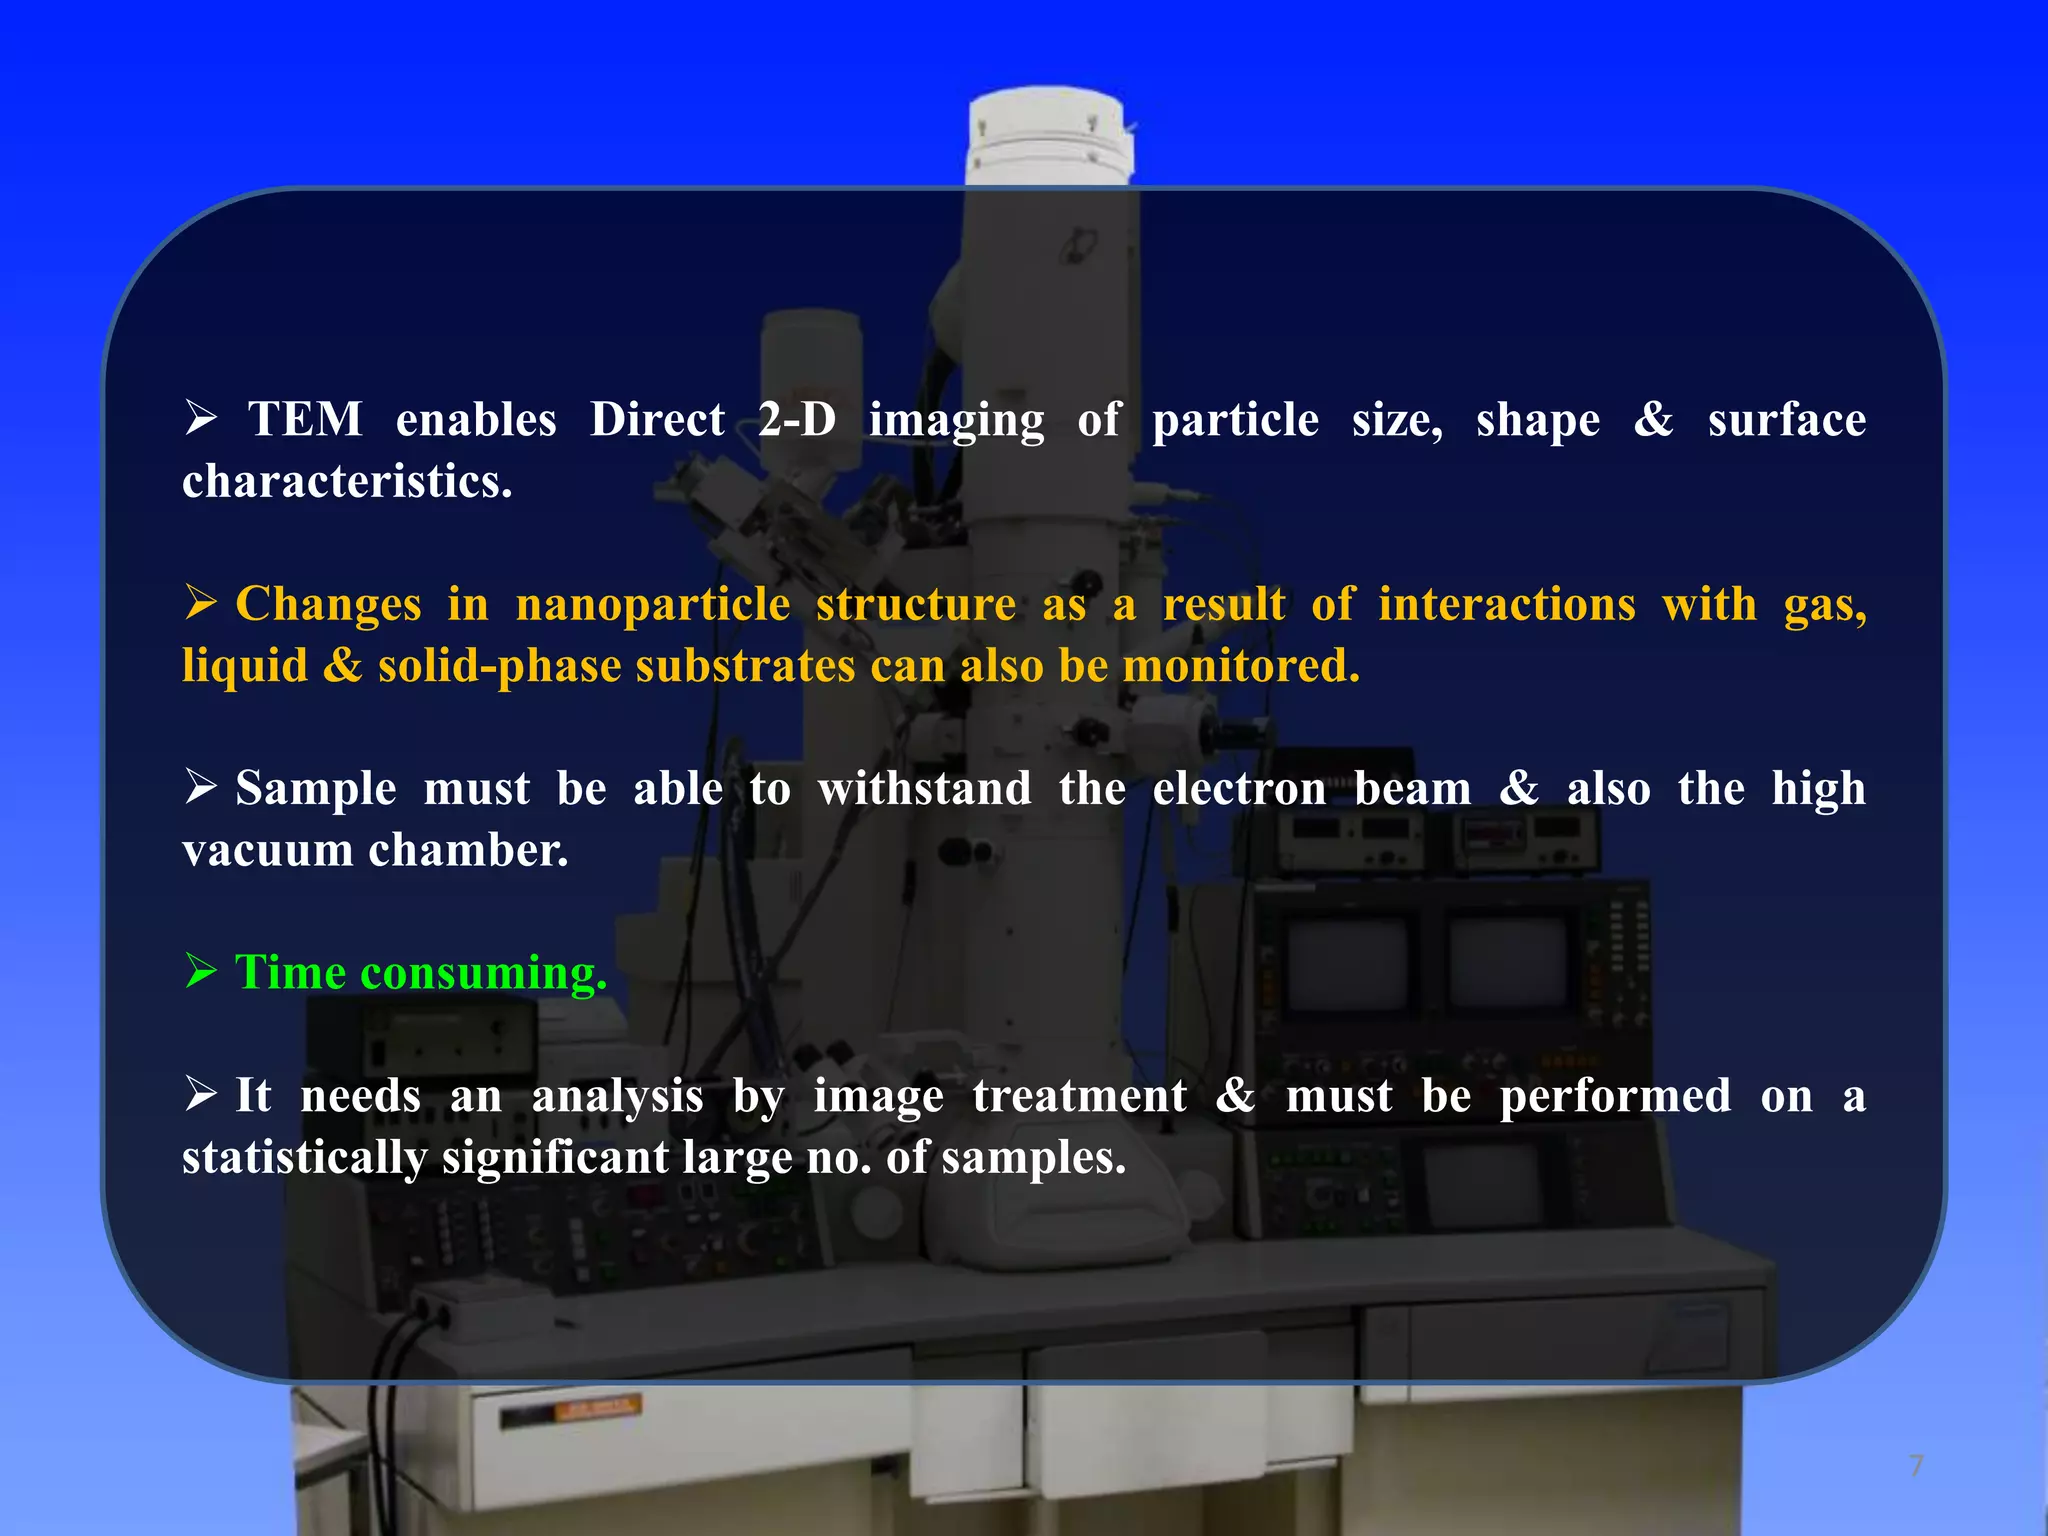
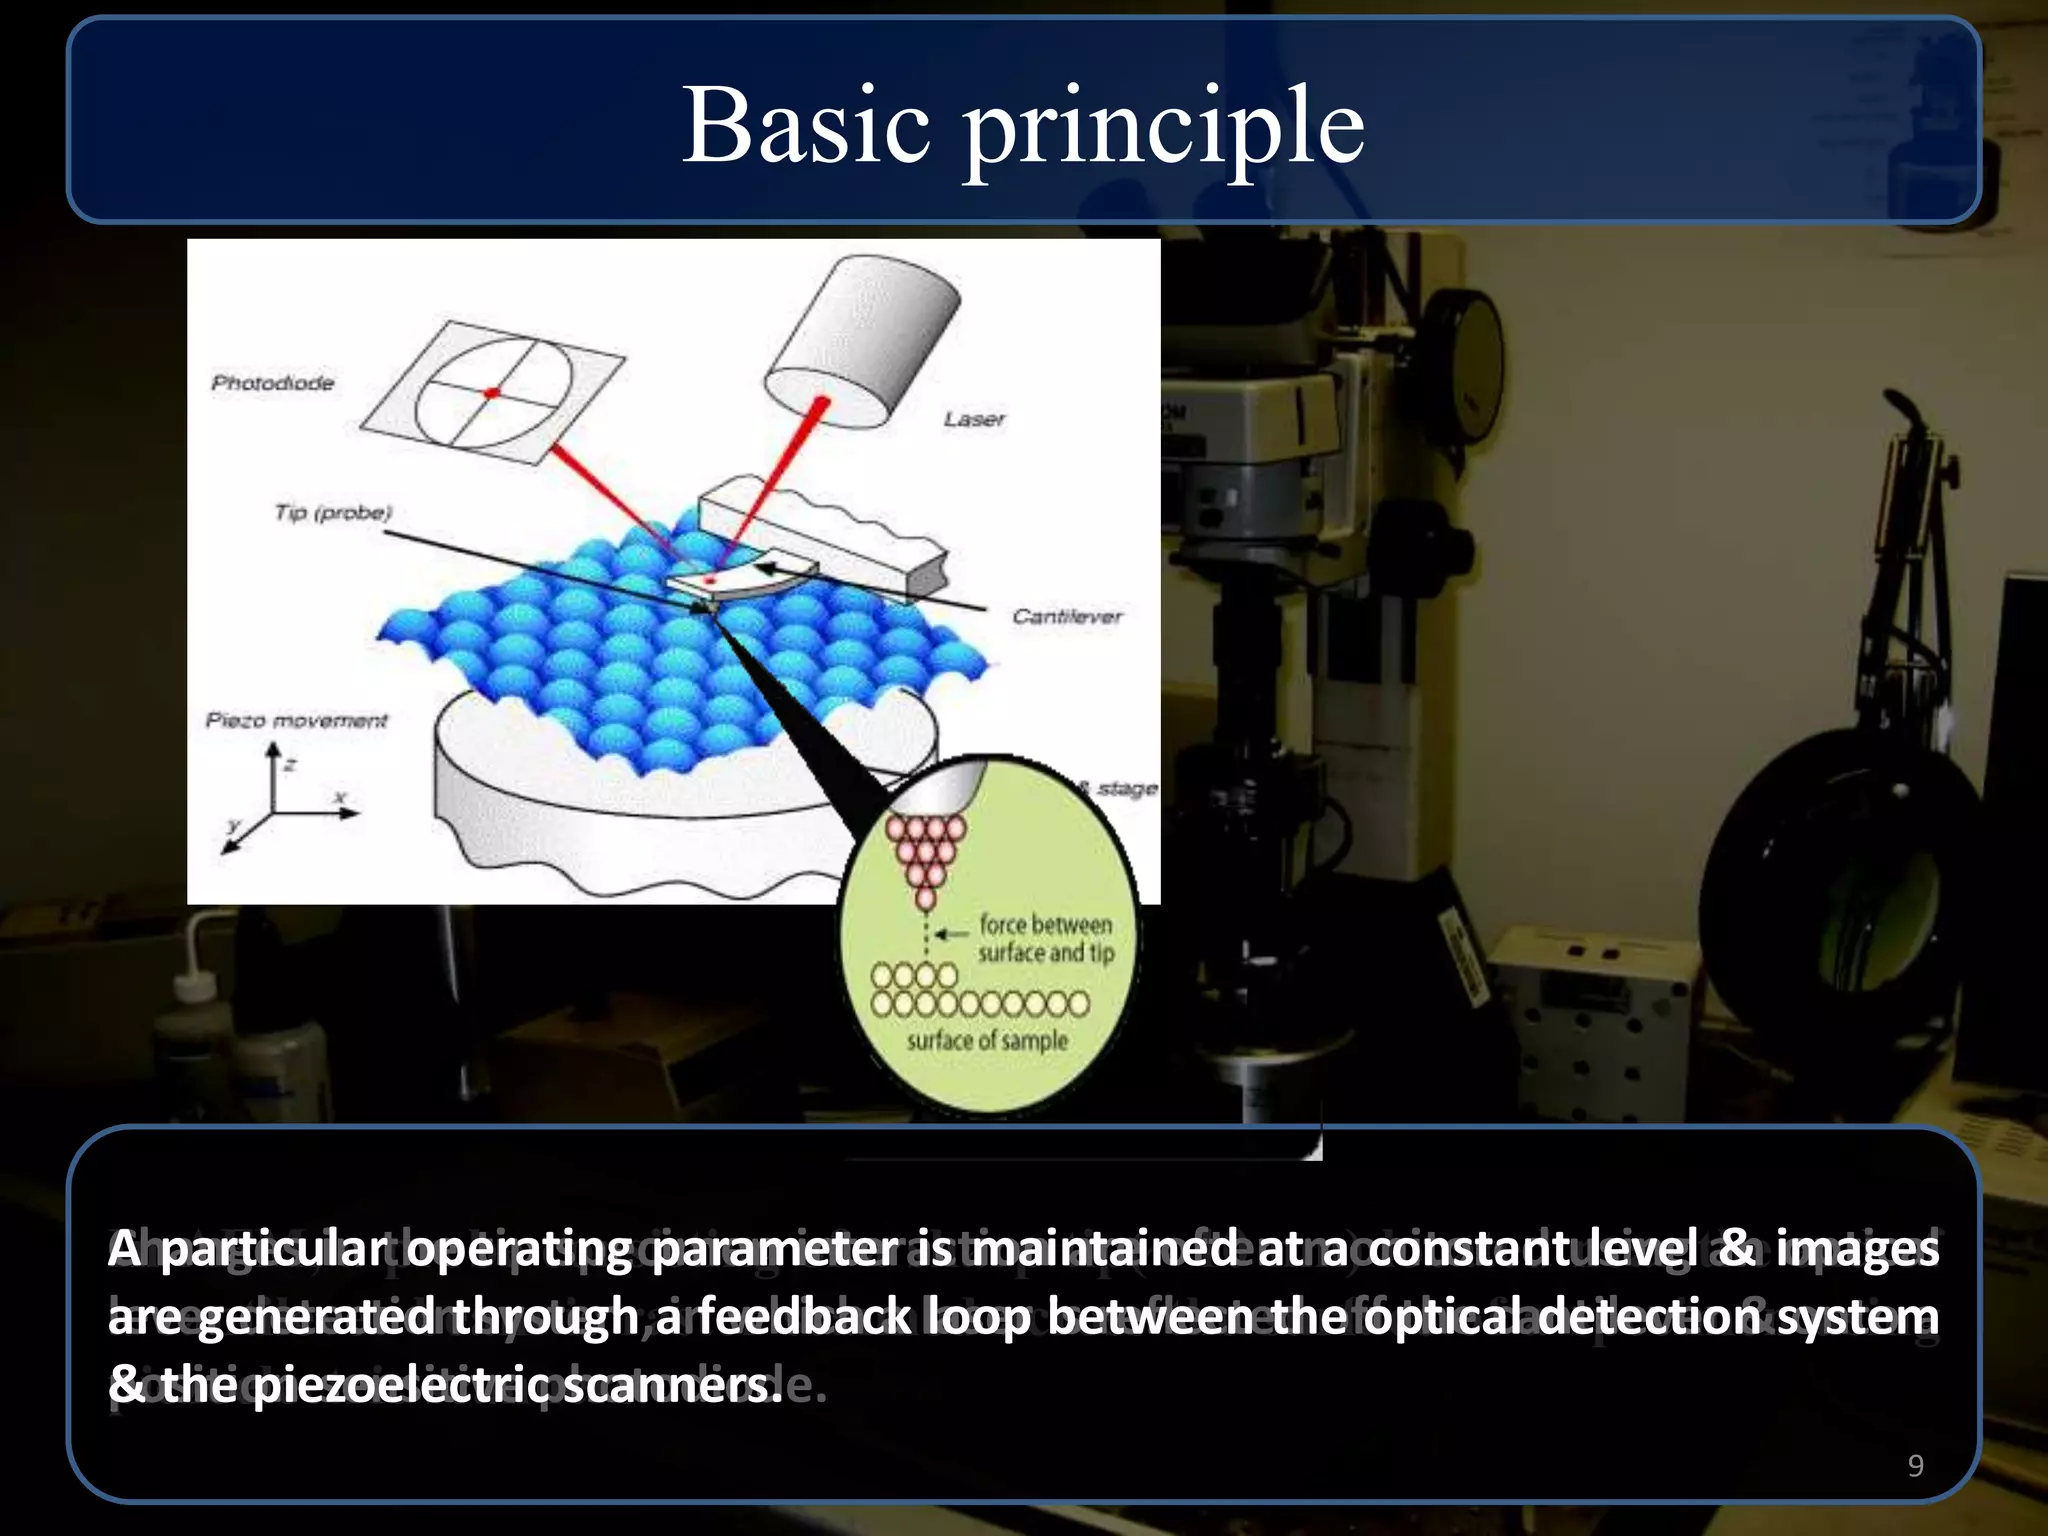
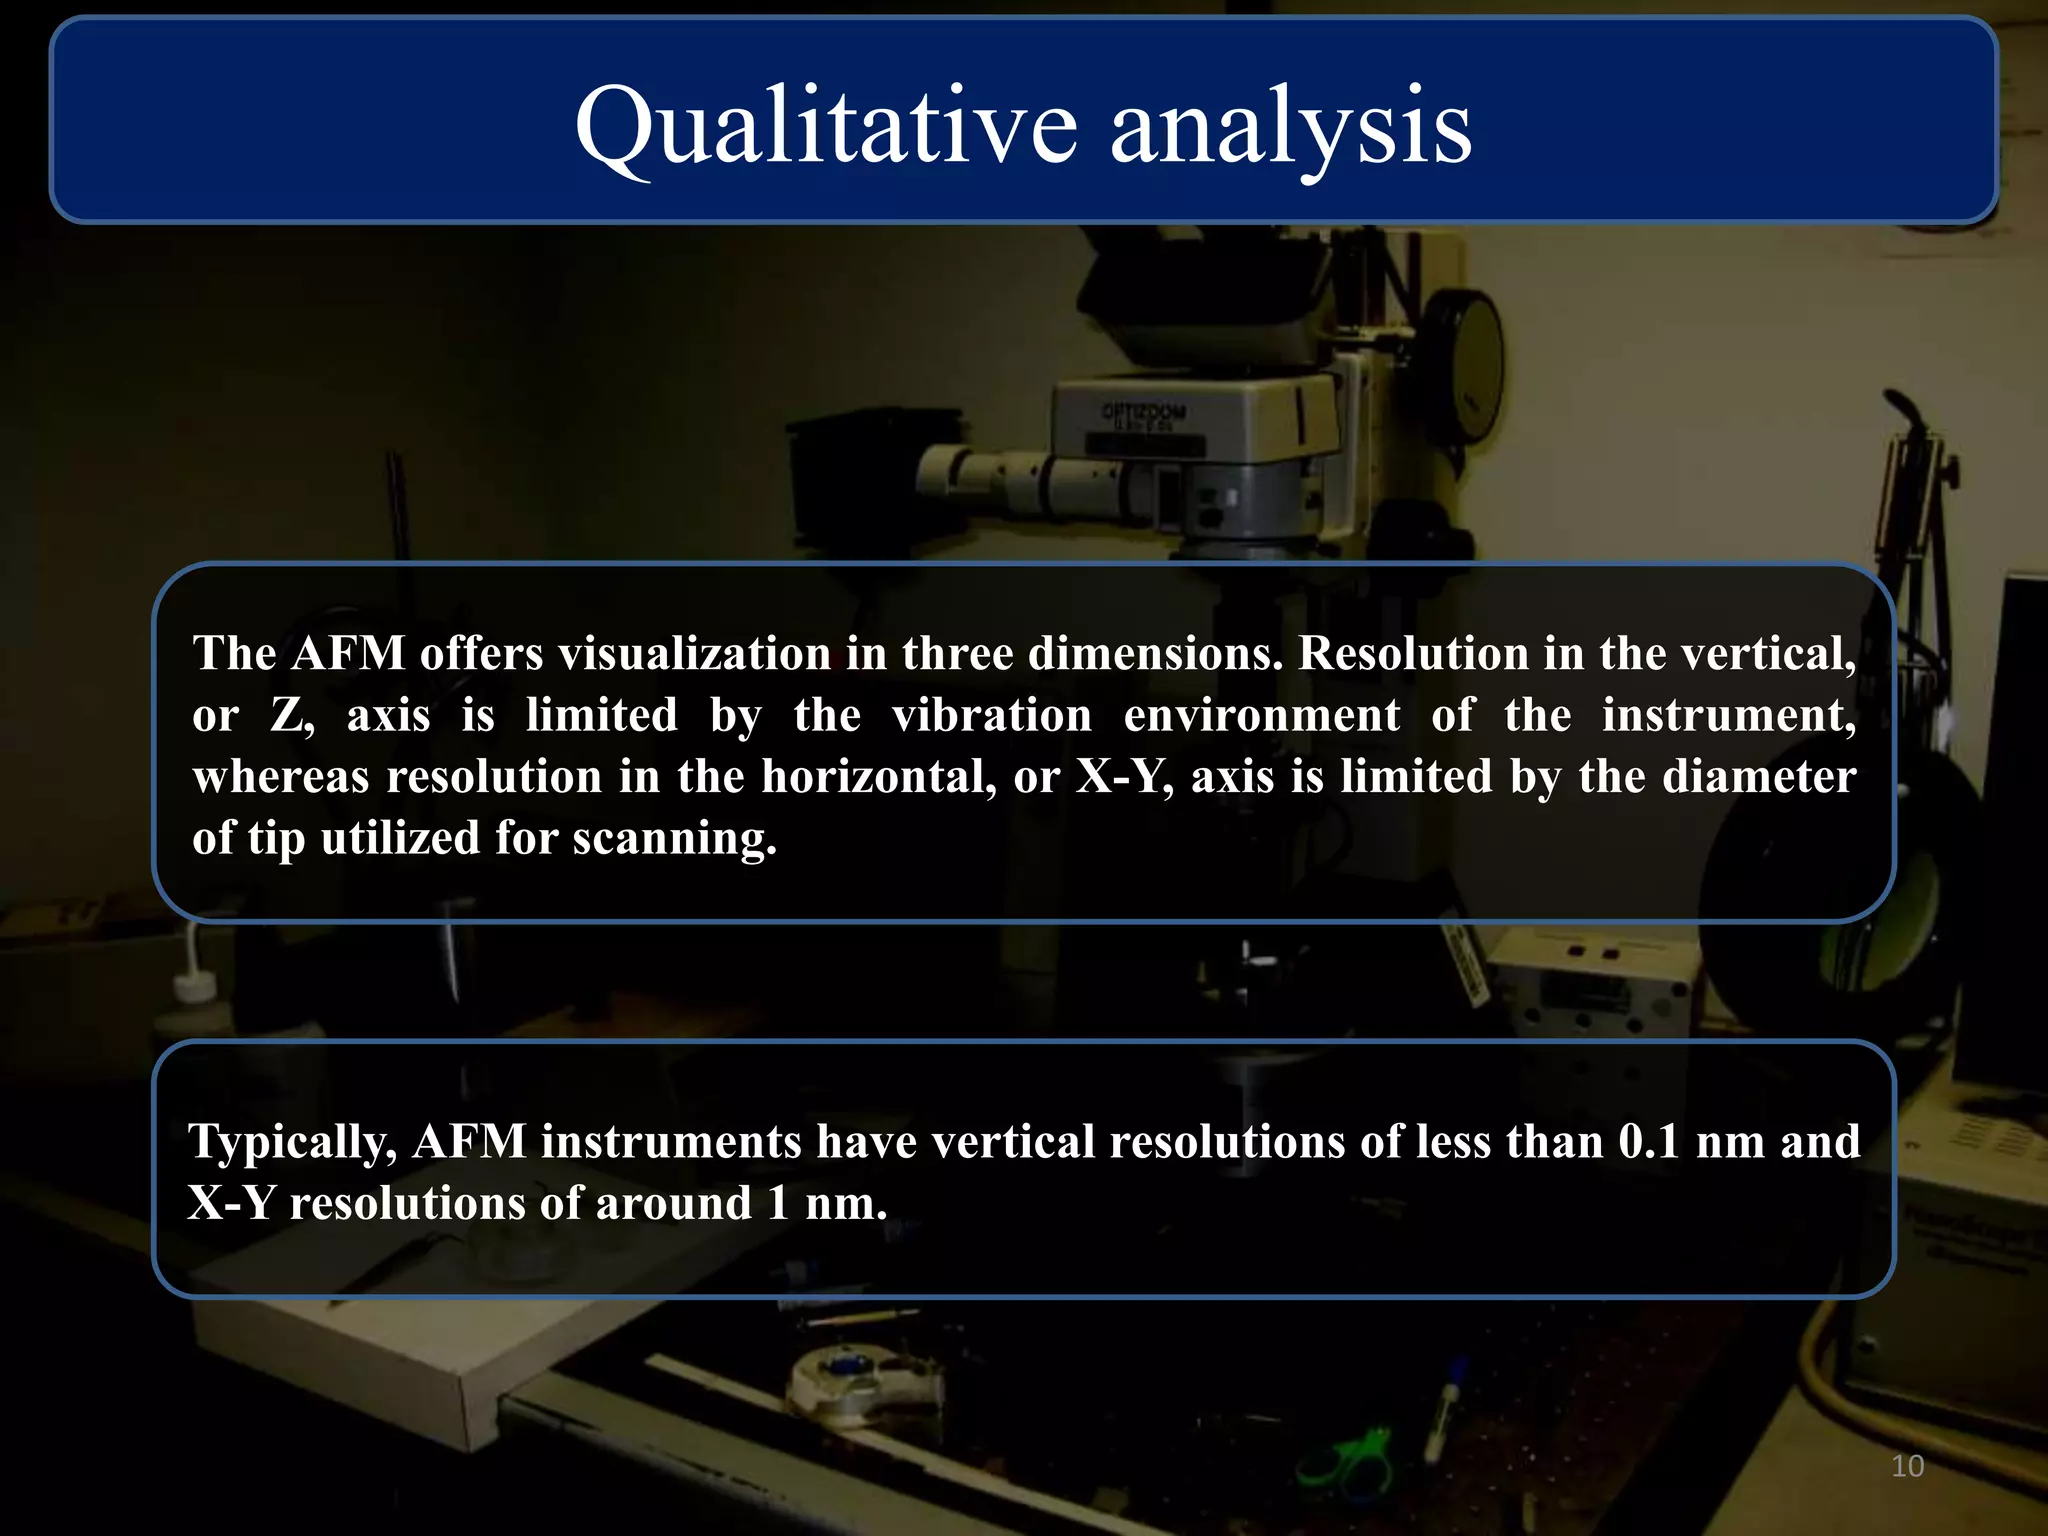
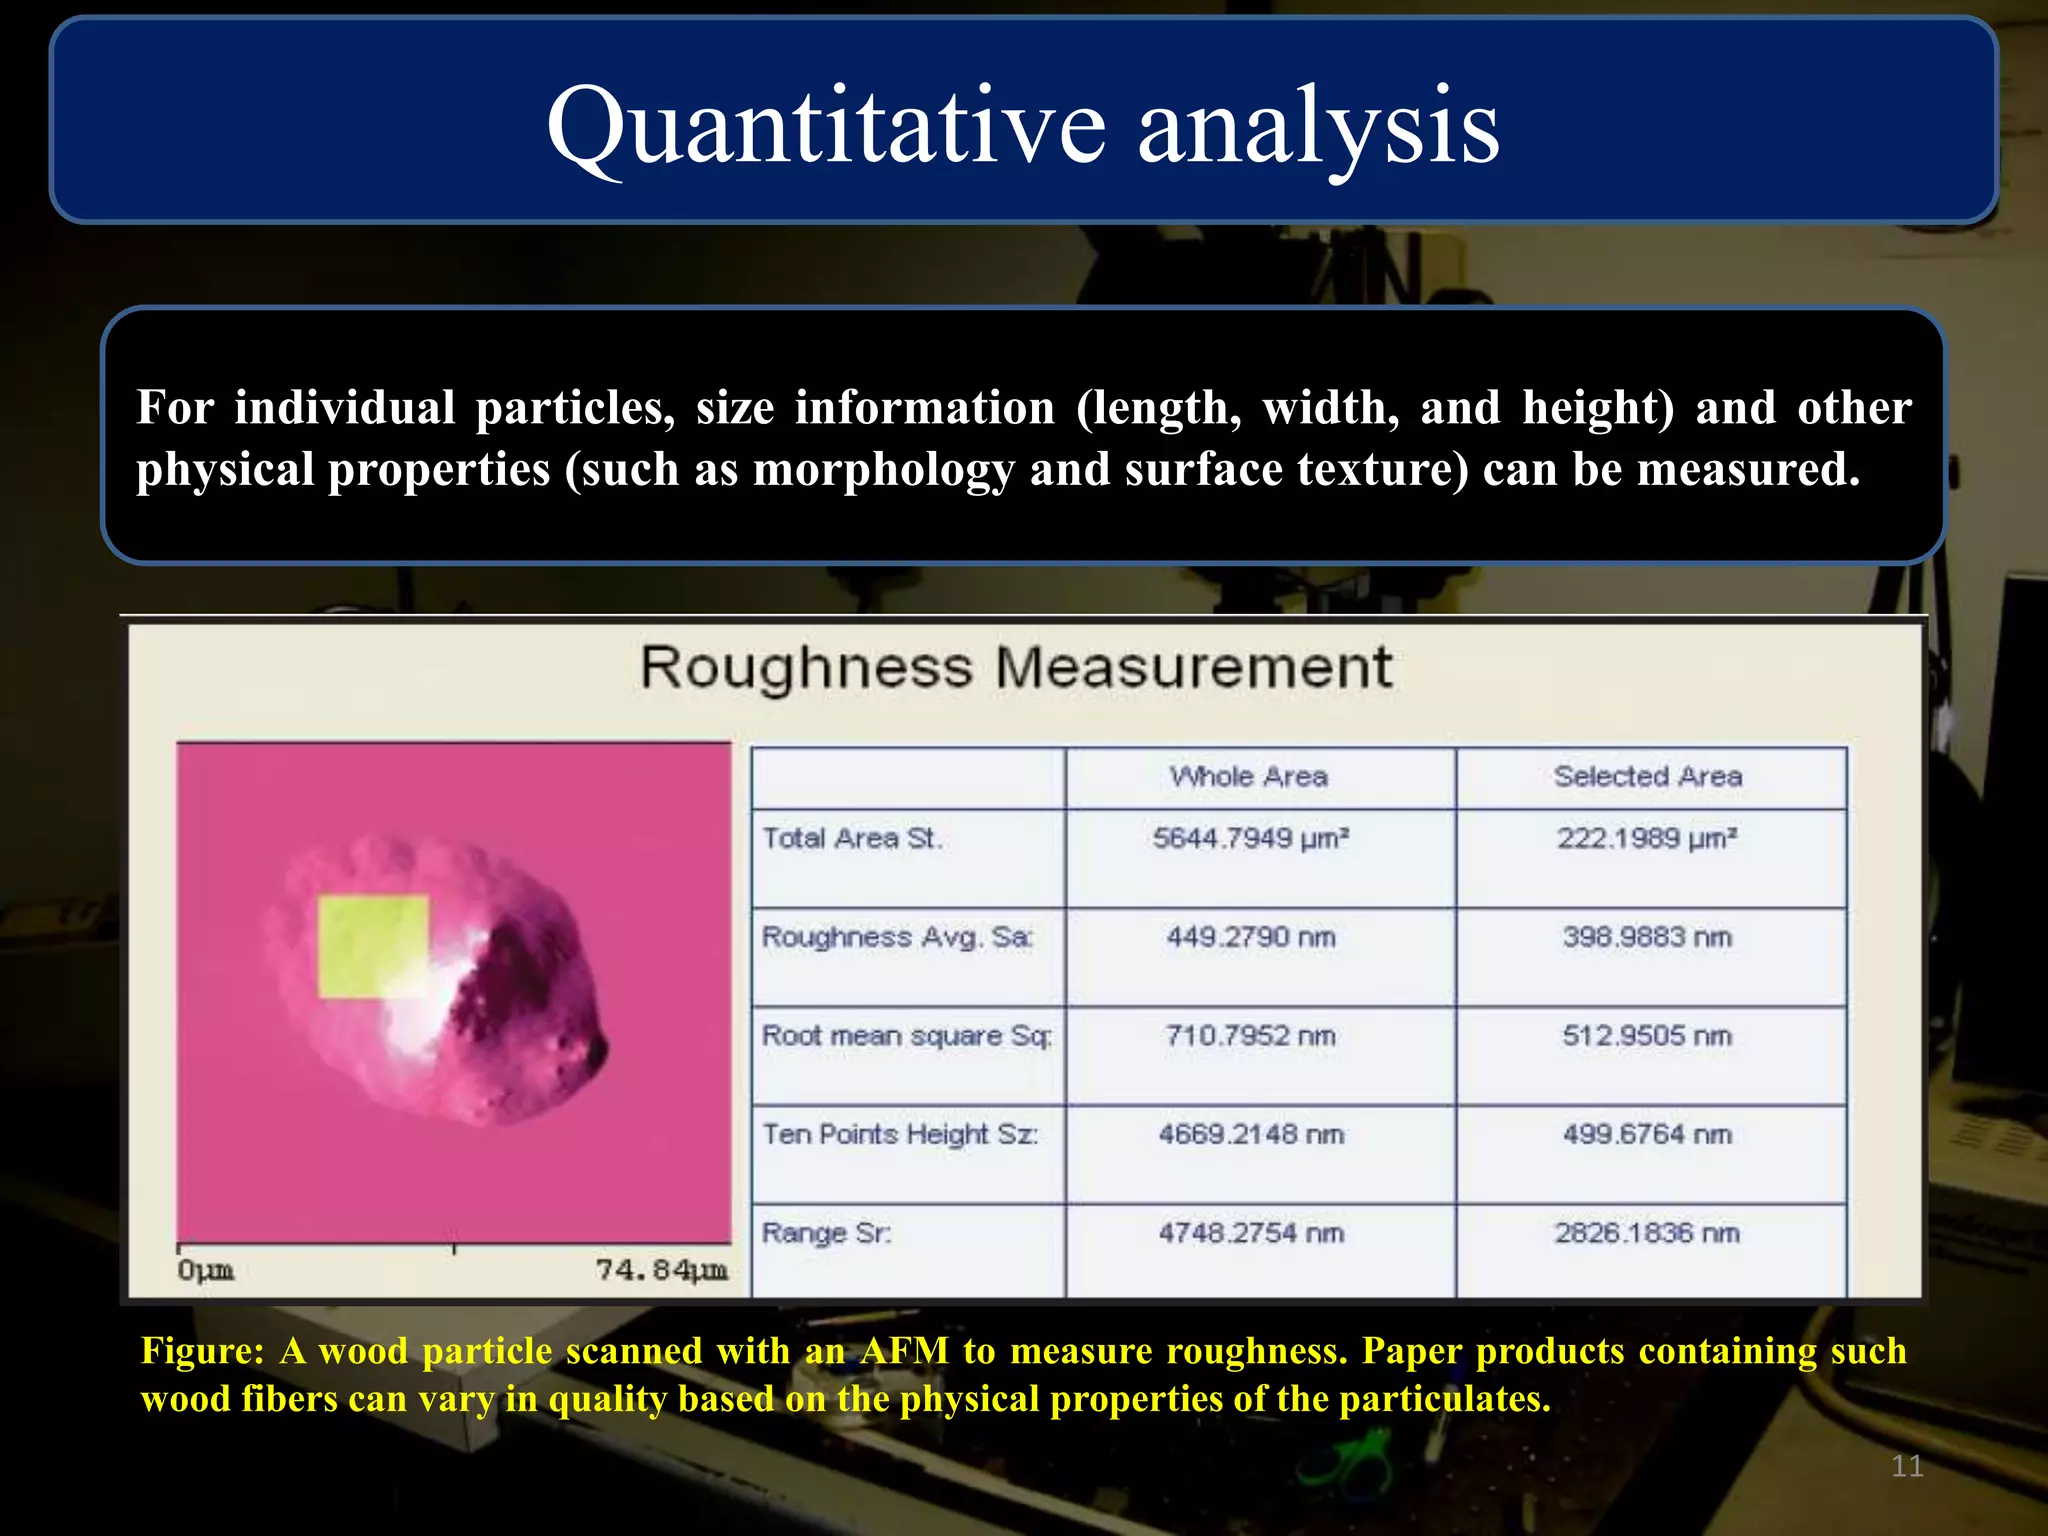
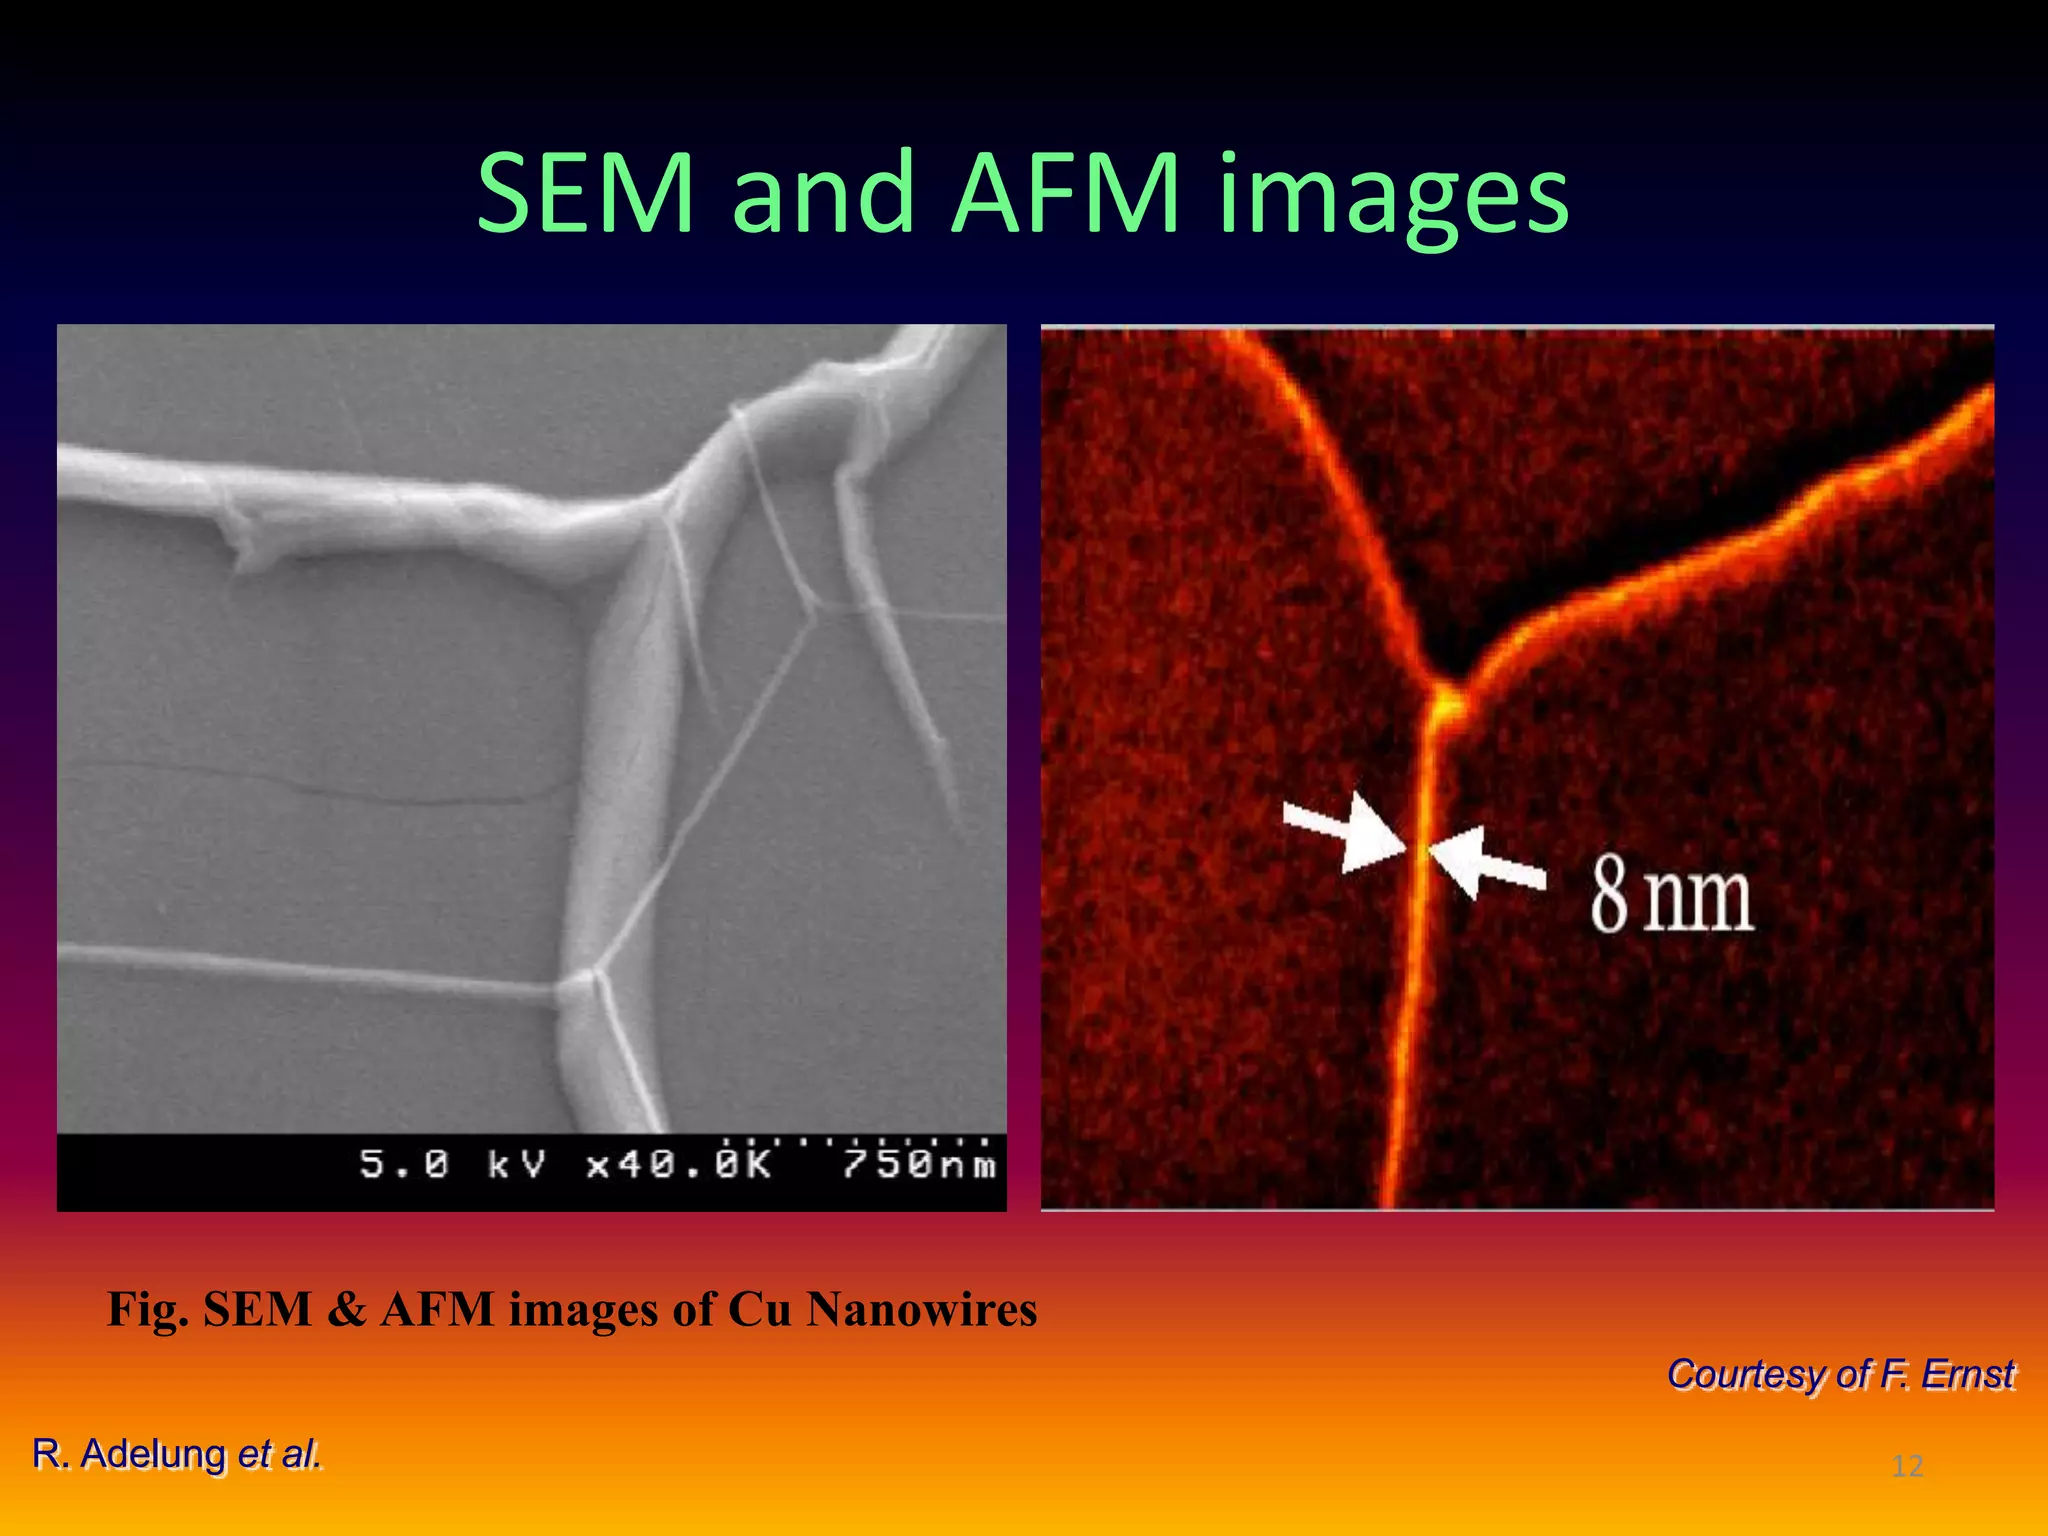
The critical parameters for evaluating nanoparticle formulations include particle size, shape, zeta potential, polydispersity index, pH, aggregation, drug content, and solvent levels. Dynamic light scattering measures hydrodynamic diameter to assess size, while transmission electron microscopy and atomic force microscopy directly image particles for size, shape, and surface characteristics. Zeta potential indicates stability, and differential scanning calorimetry analyzes phase transitions by measuring enthalpy changes with temperature. Together, these techniques set quality standards and predict in vivo performance of nanoparticle drugs.


