Download as PDF, PPTX

The document discusses dynamic light scattering (DLS), a technique used for measuring particle and molecular sizes based on light scattering data. It outlines the principles of DLS, importance of various parameters like temperature and viscosity, and compares DLS to other methods for particle size determination. Additionally, it addresses issues such as sample concentration effects and provides insights into interpreting results for effective analysis.
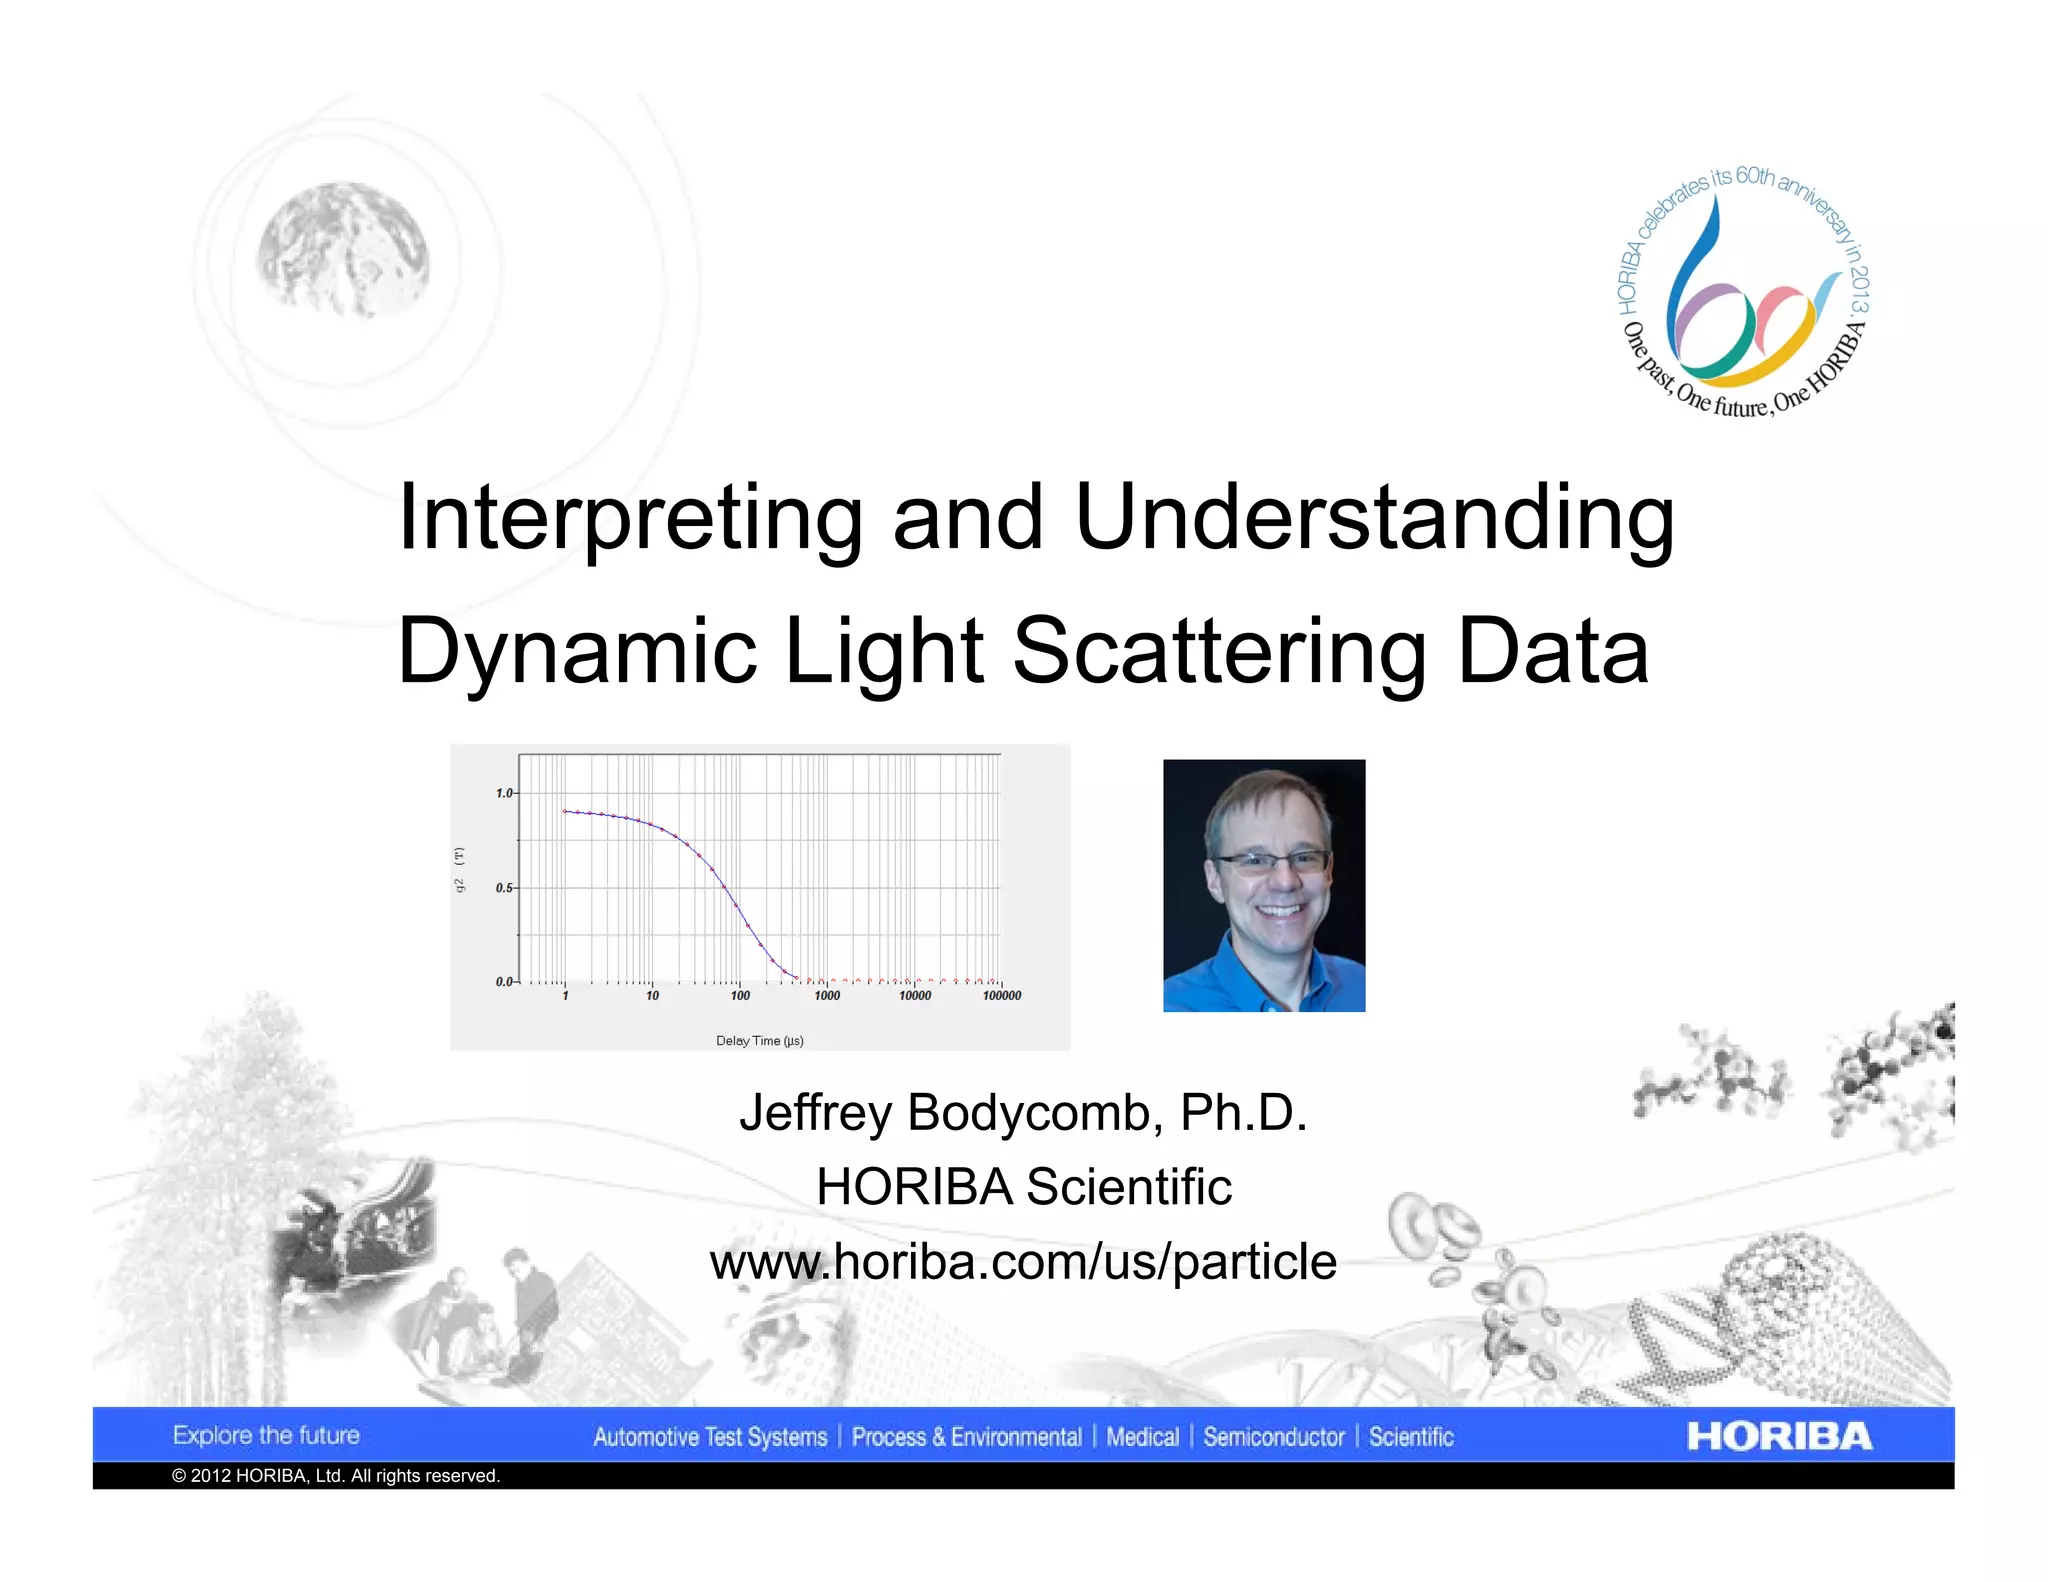
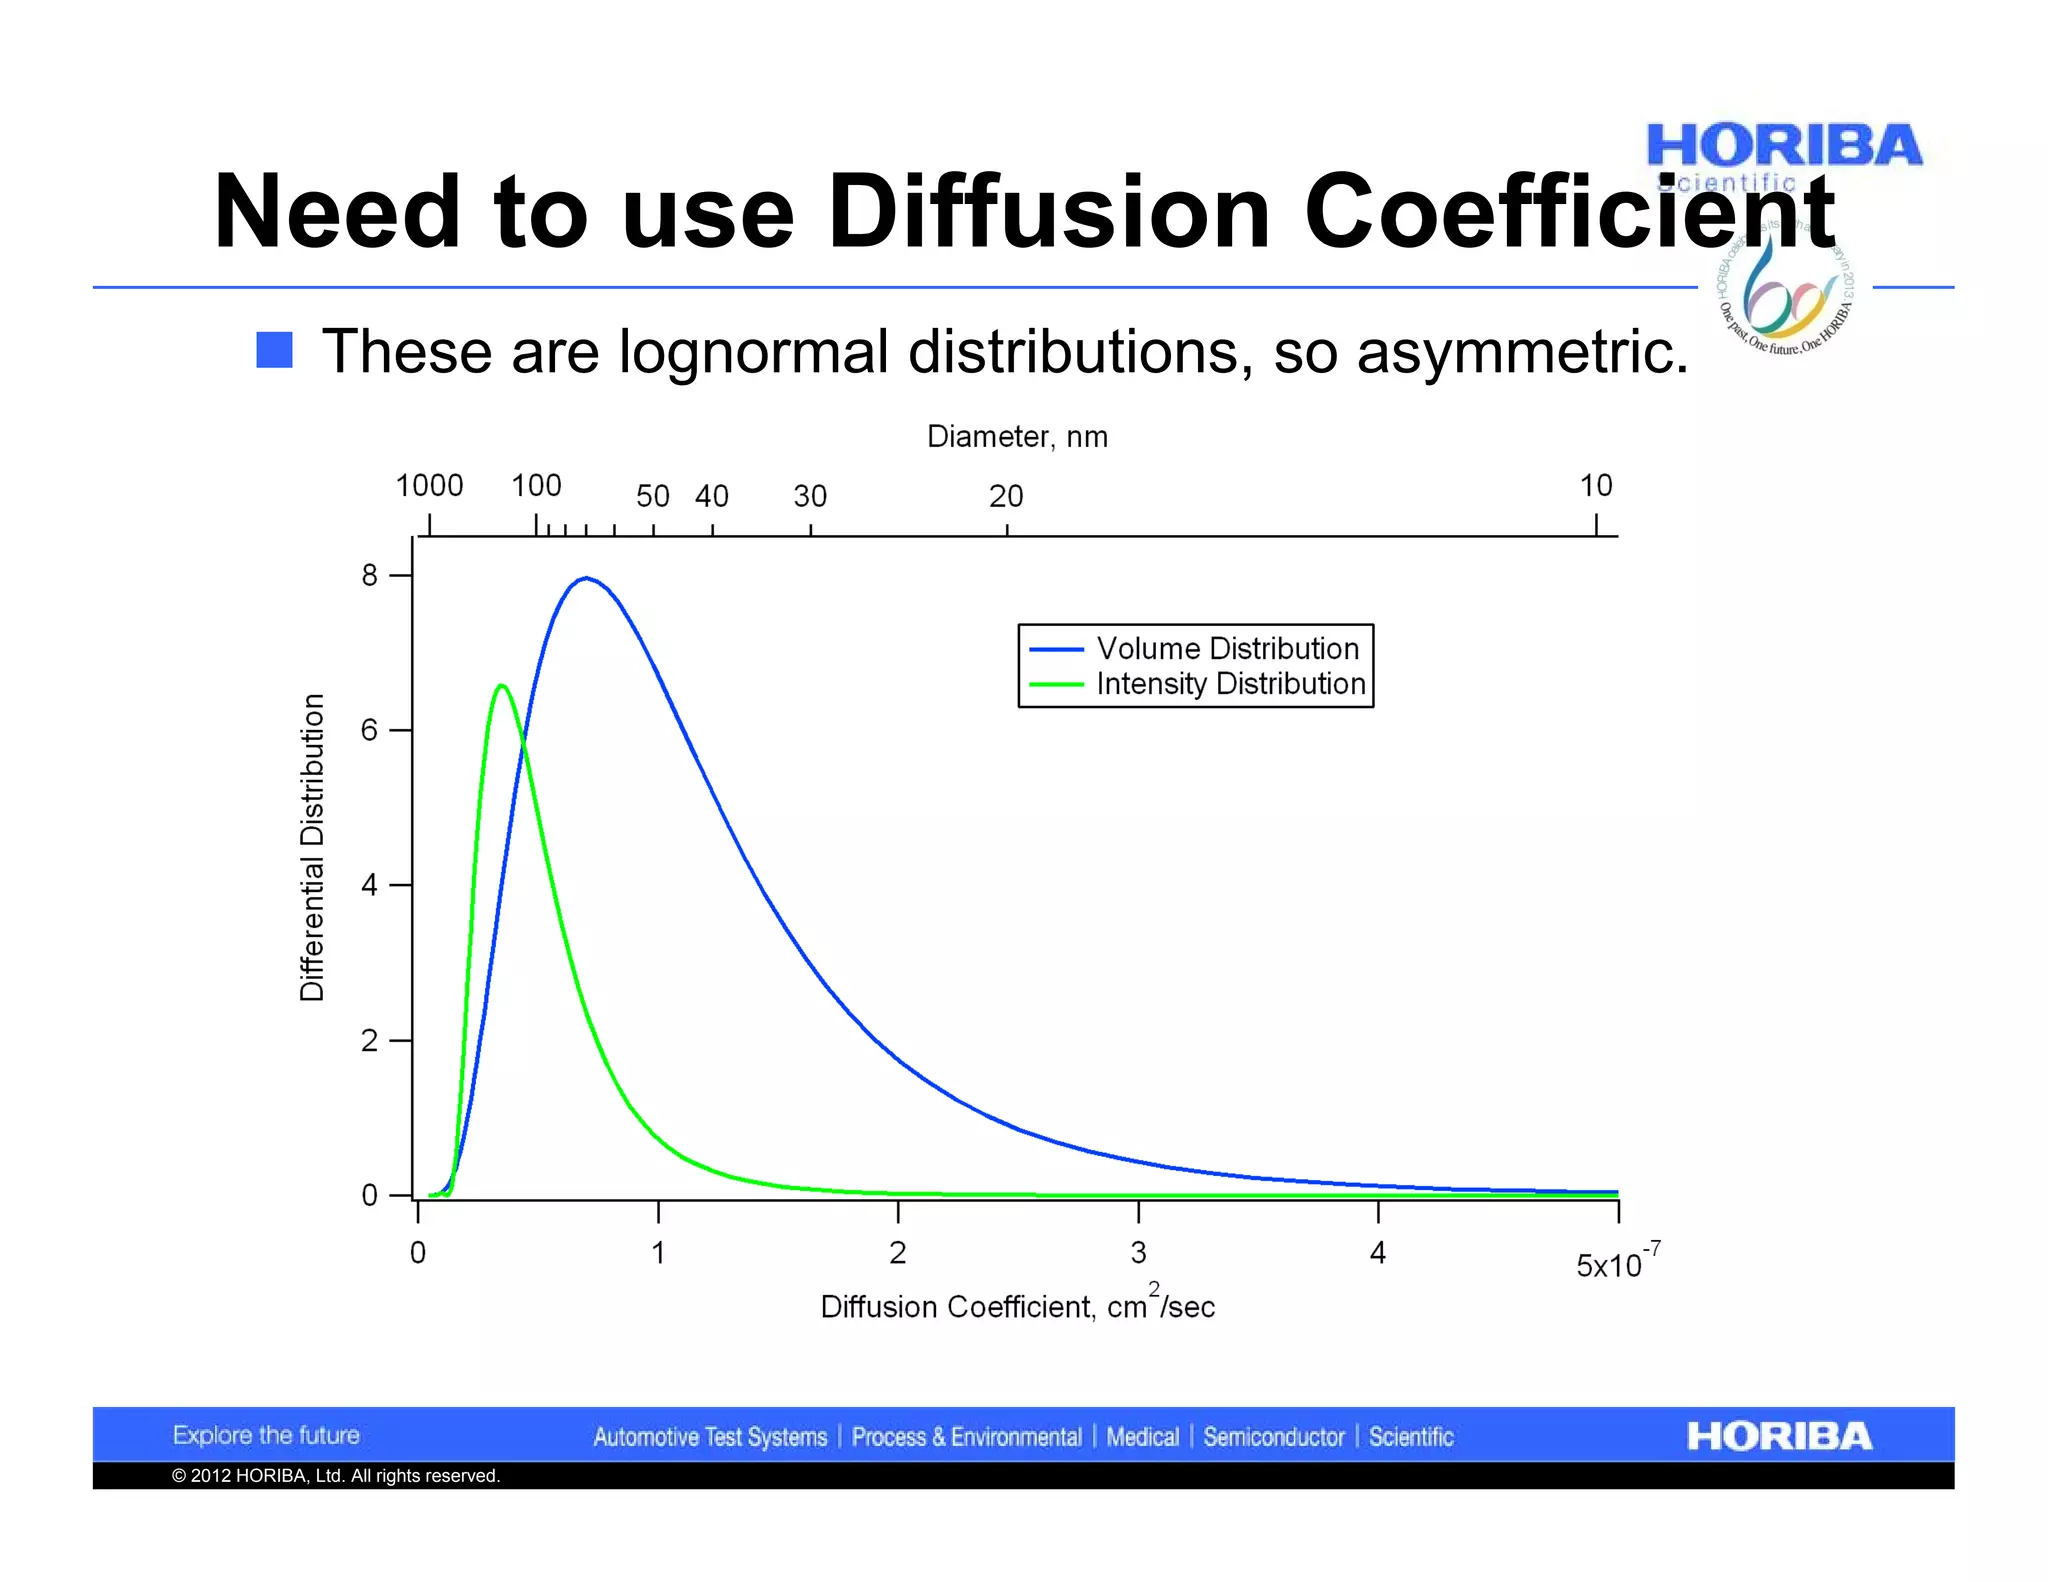
Introduction to DLS and its applications in measuring particle size and distribution.
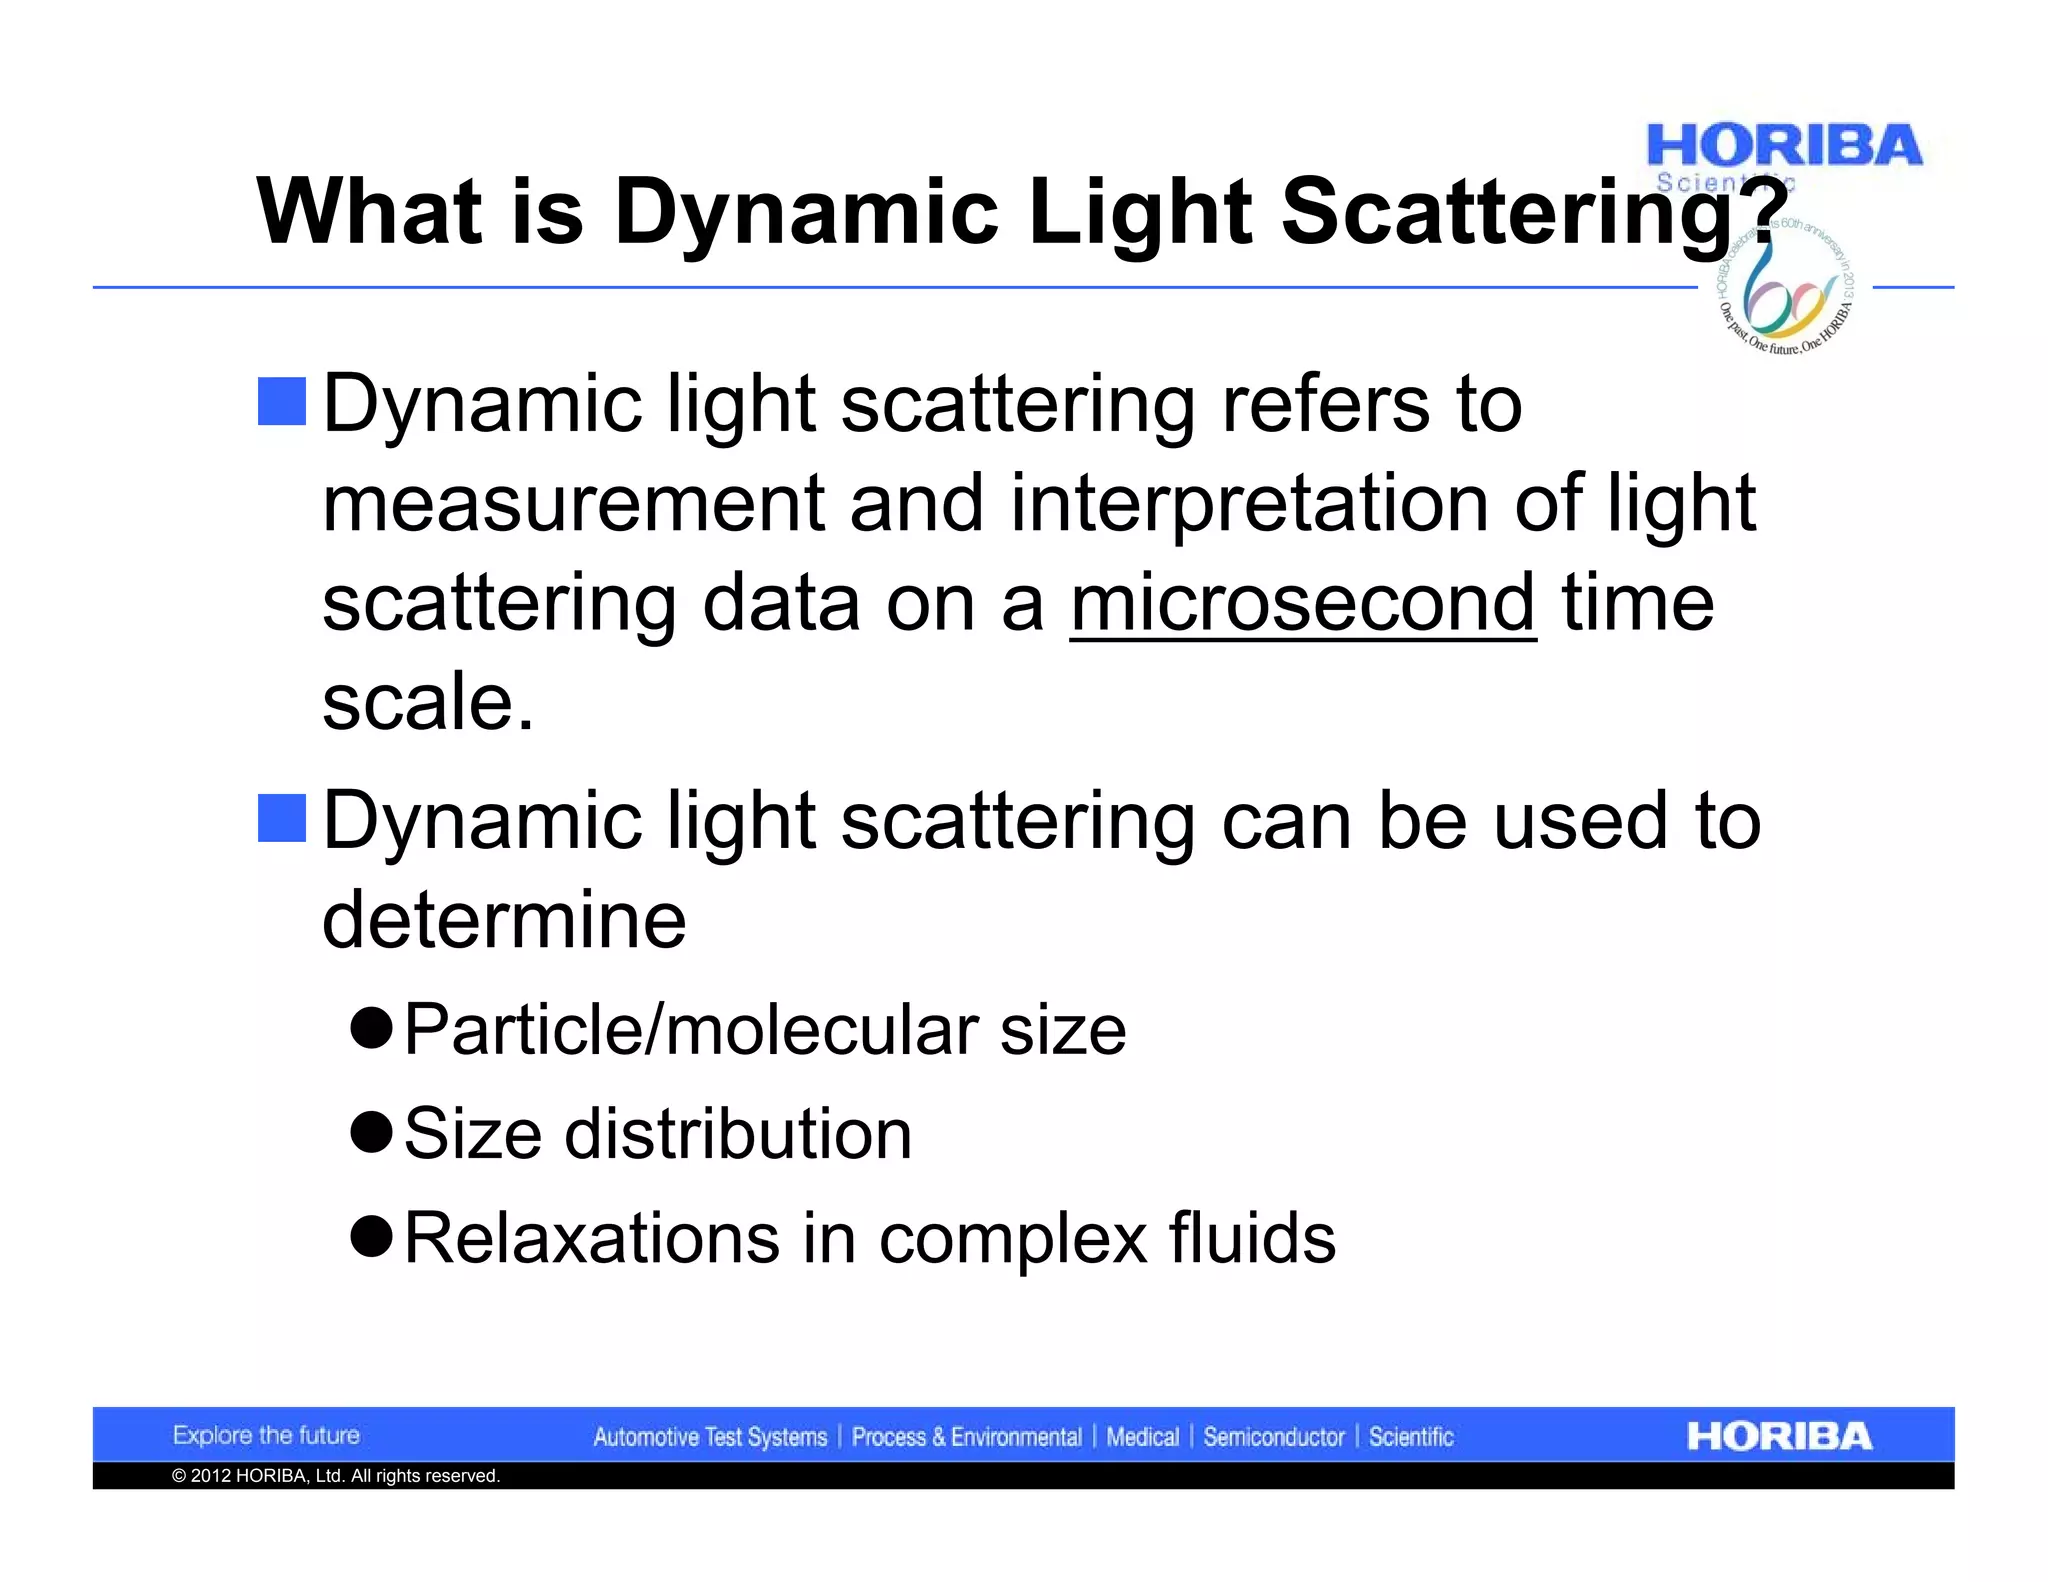
Definition and measures of DLS; overview of techniques for particle size analysis.
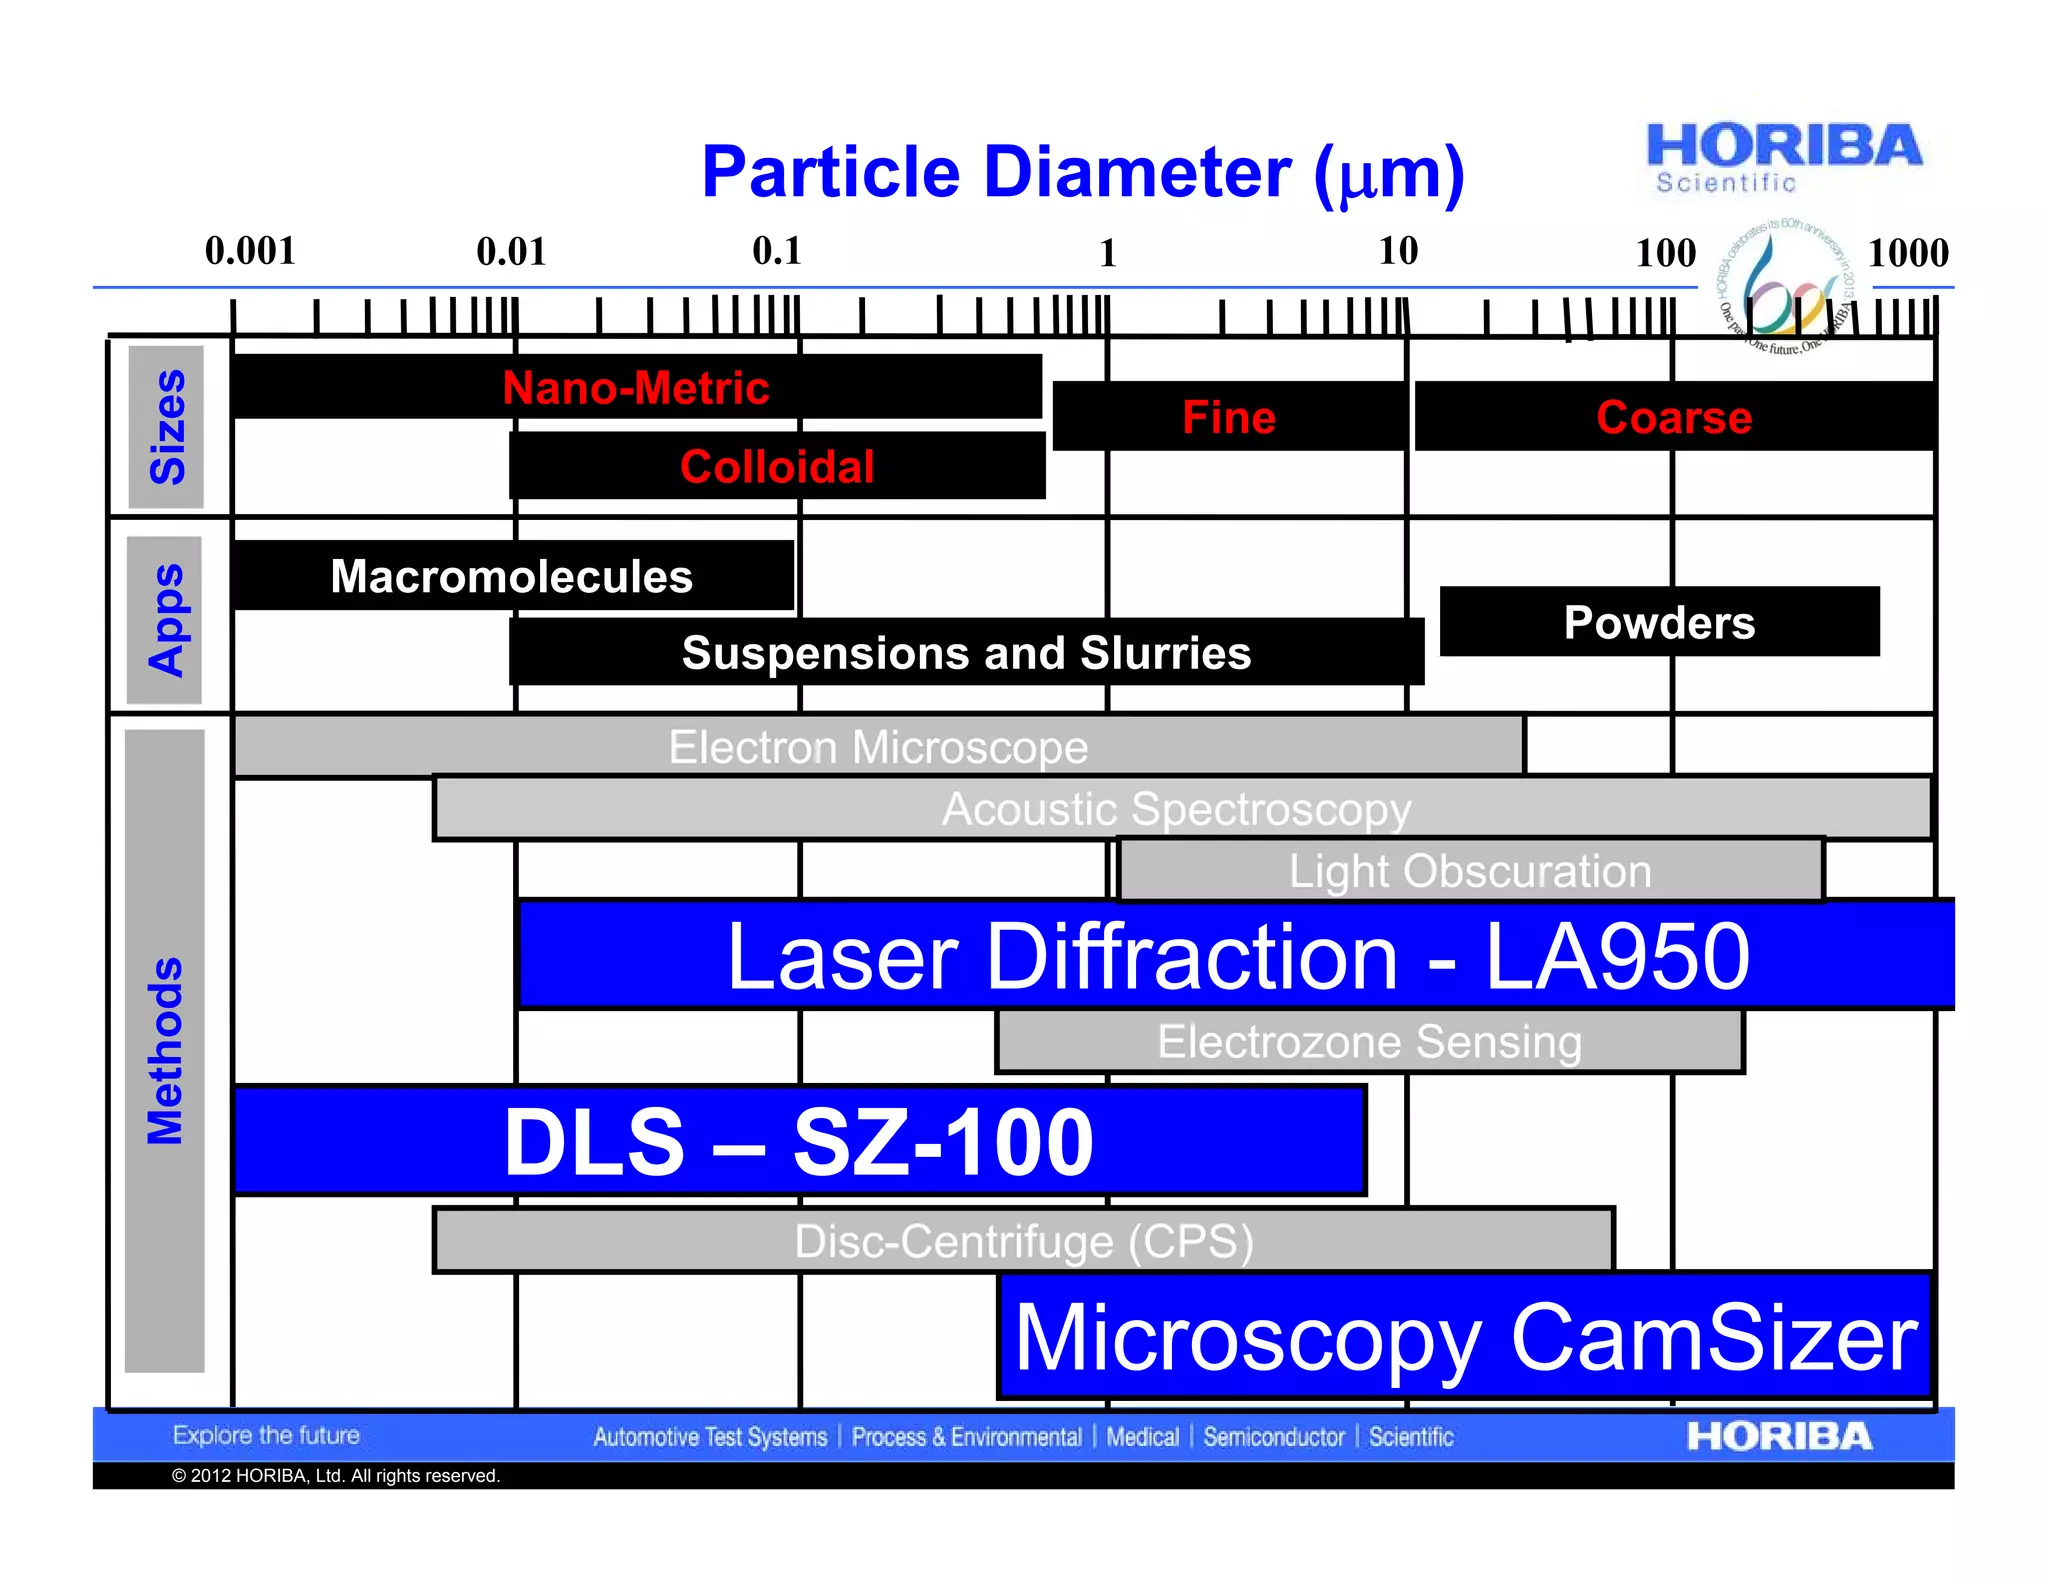
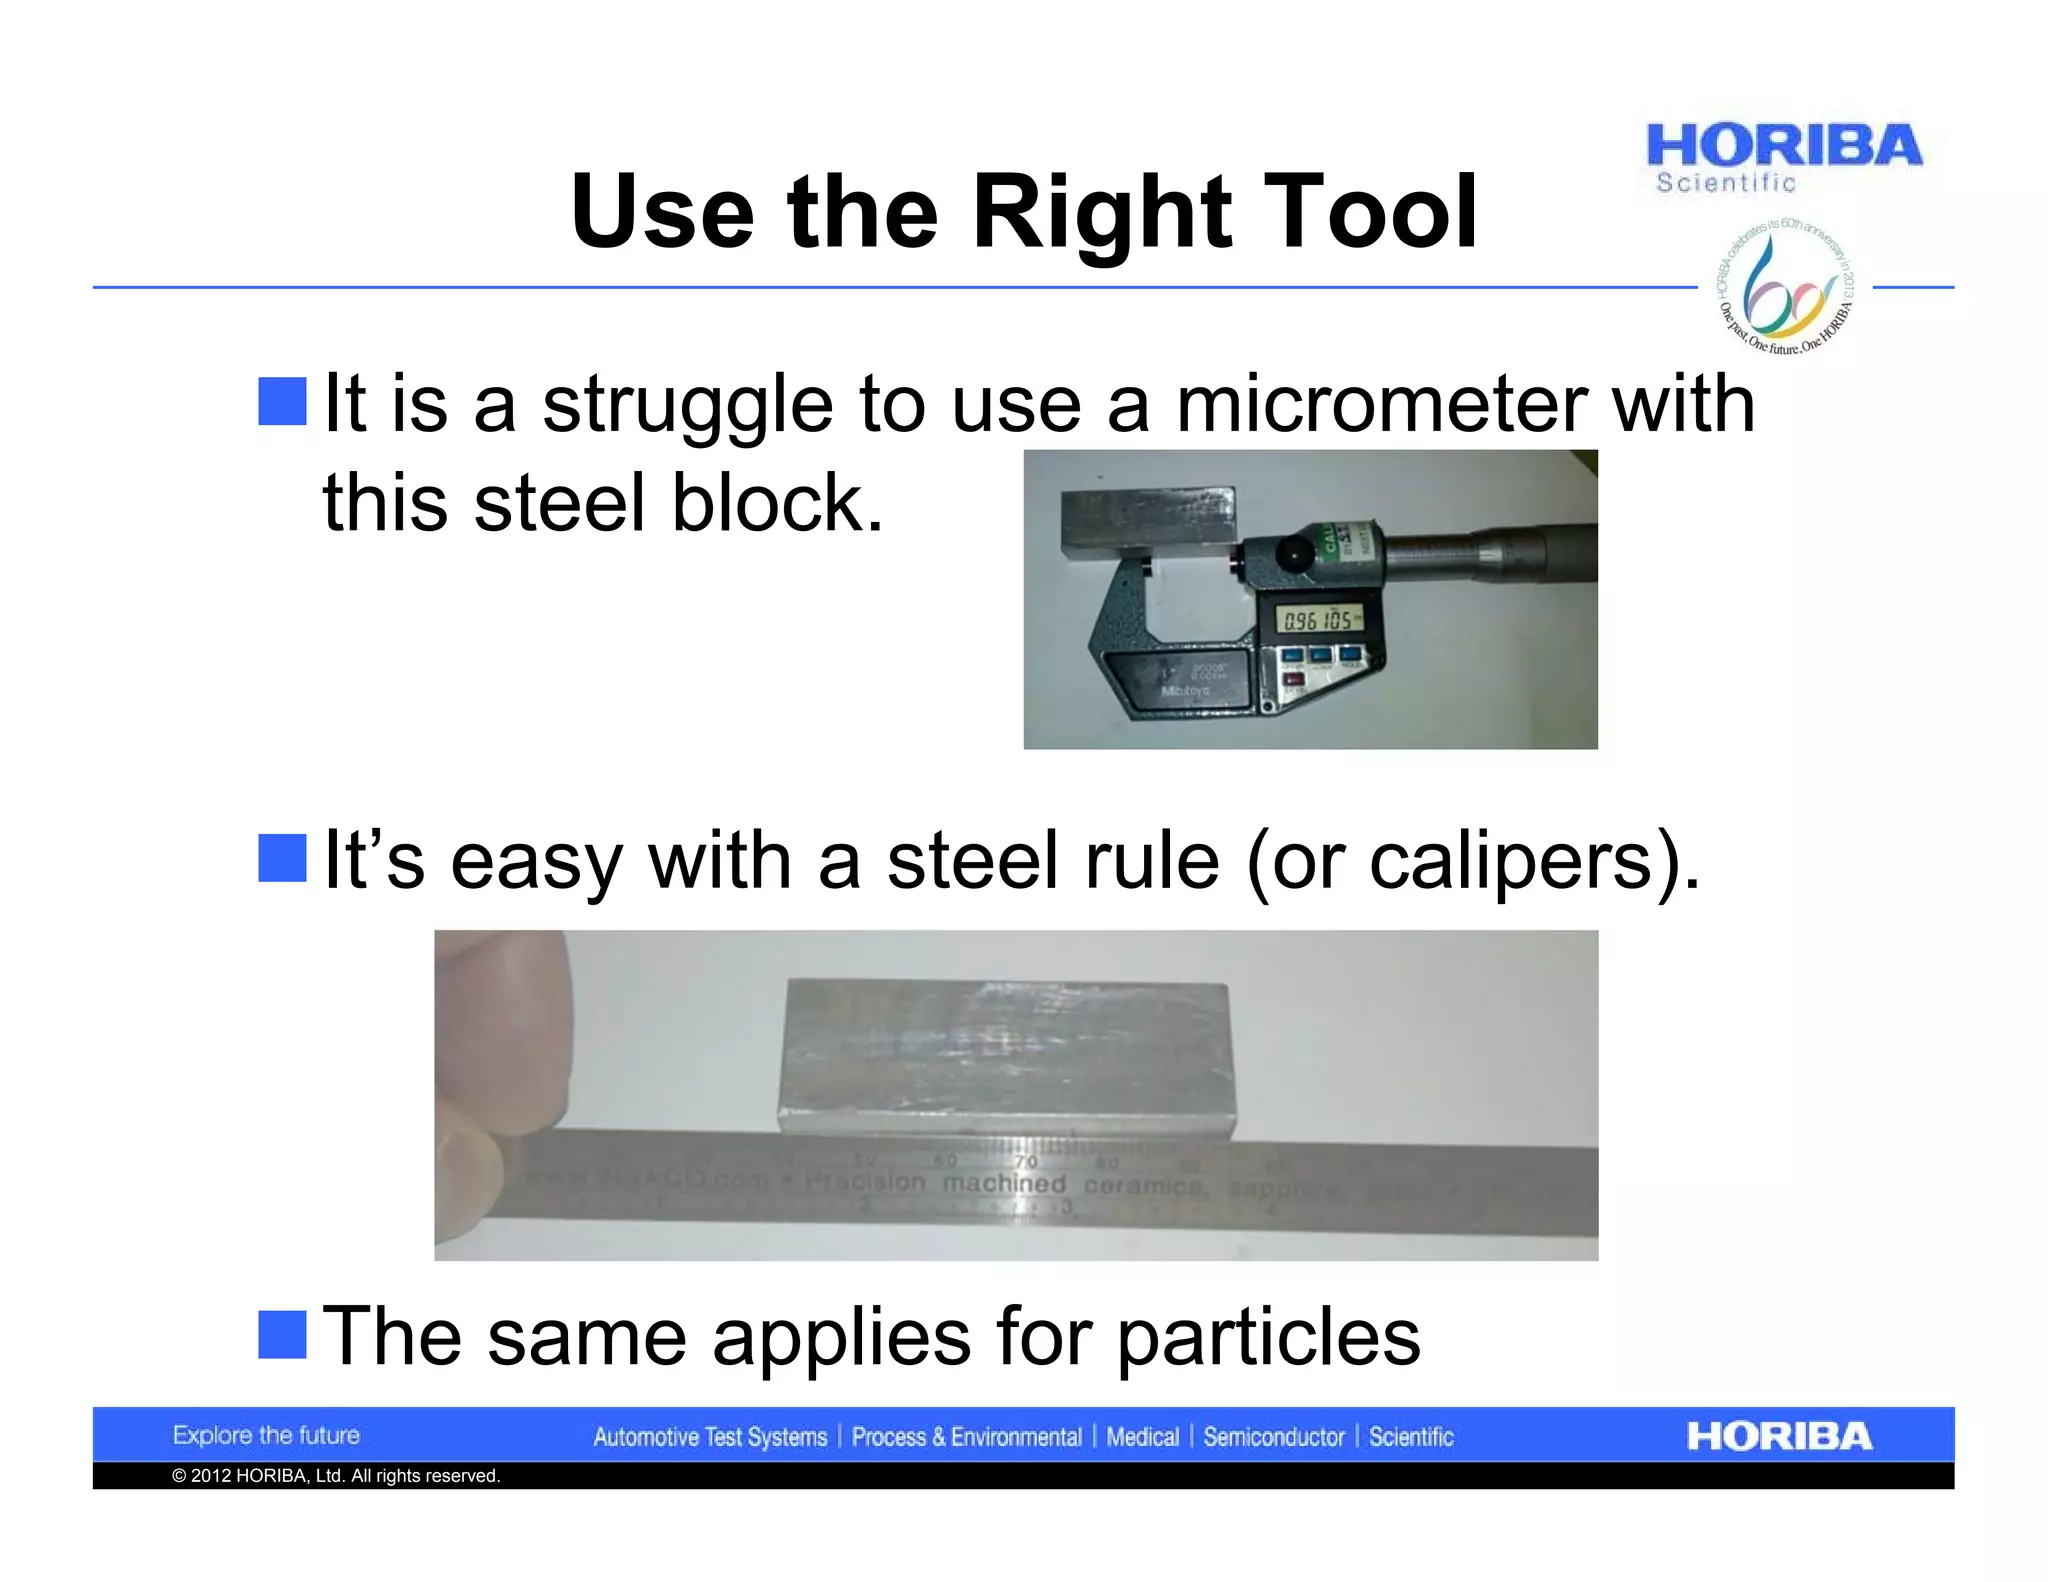
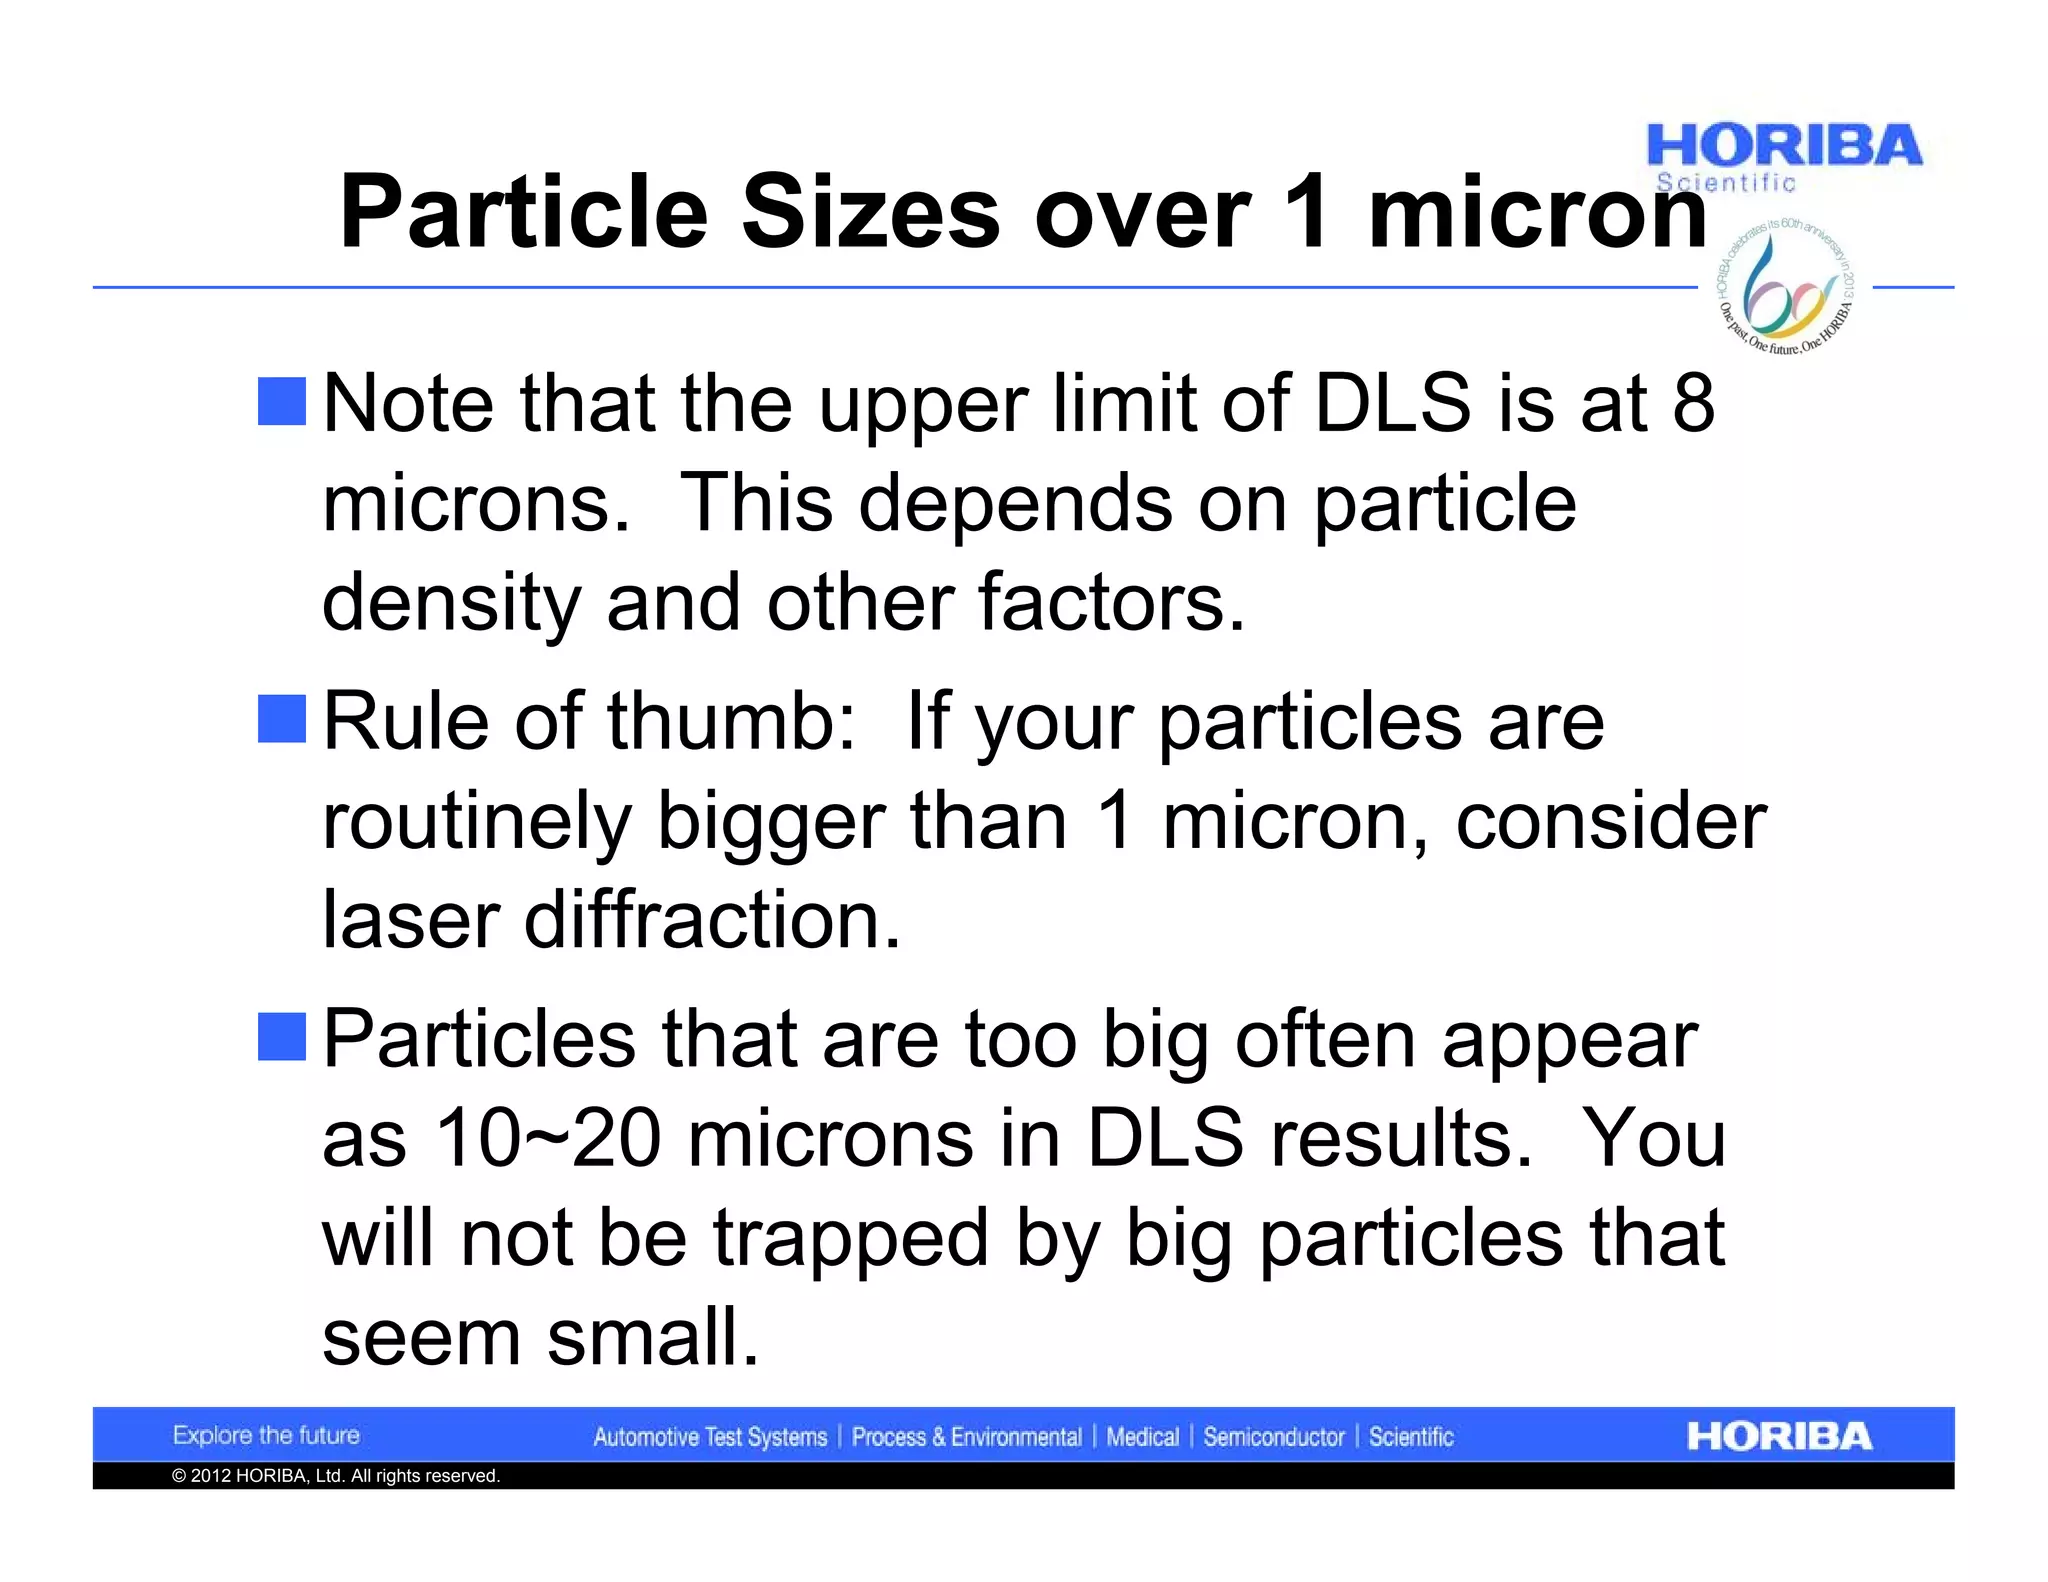
Importance of using appropriate measurement techniques for particles over 1 micron in size.
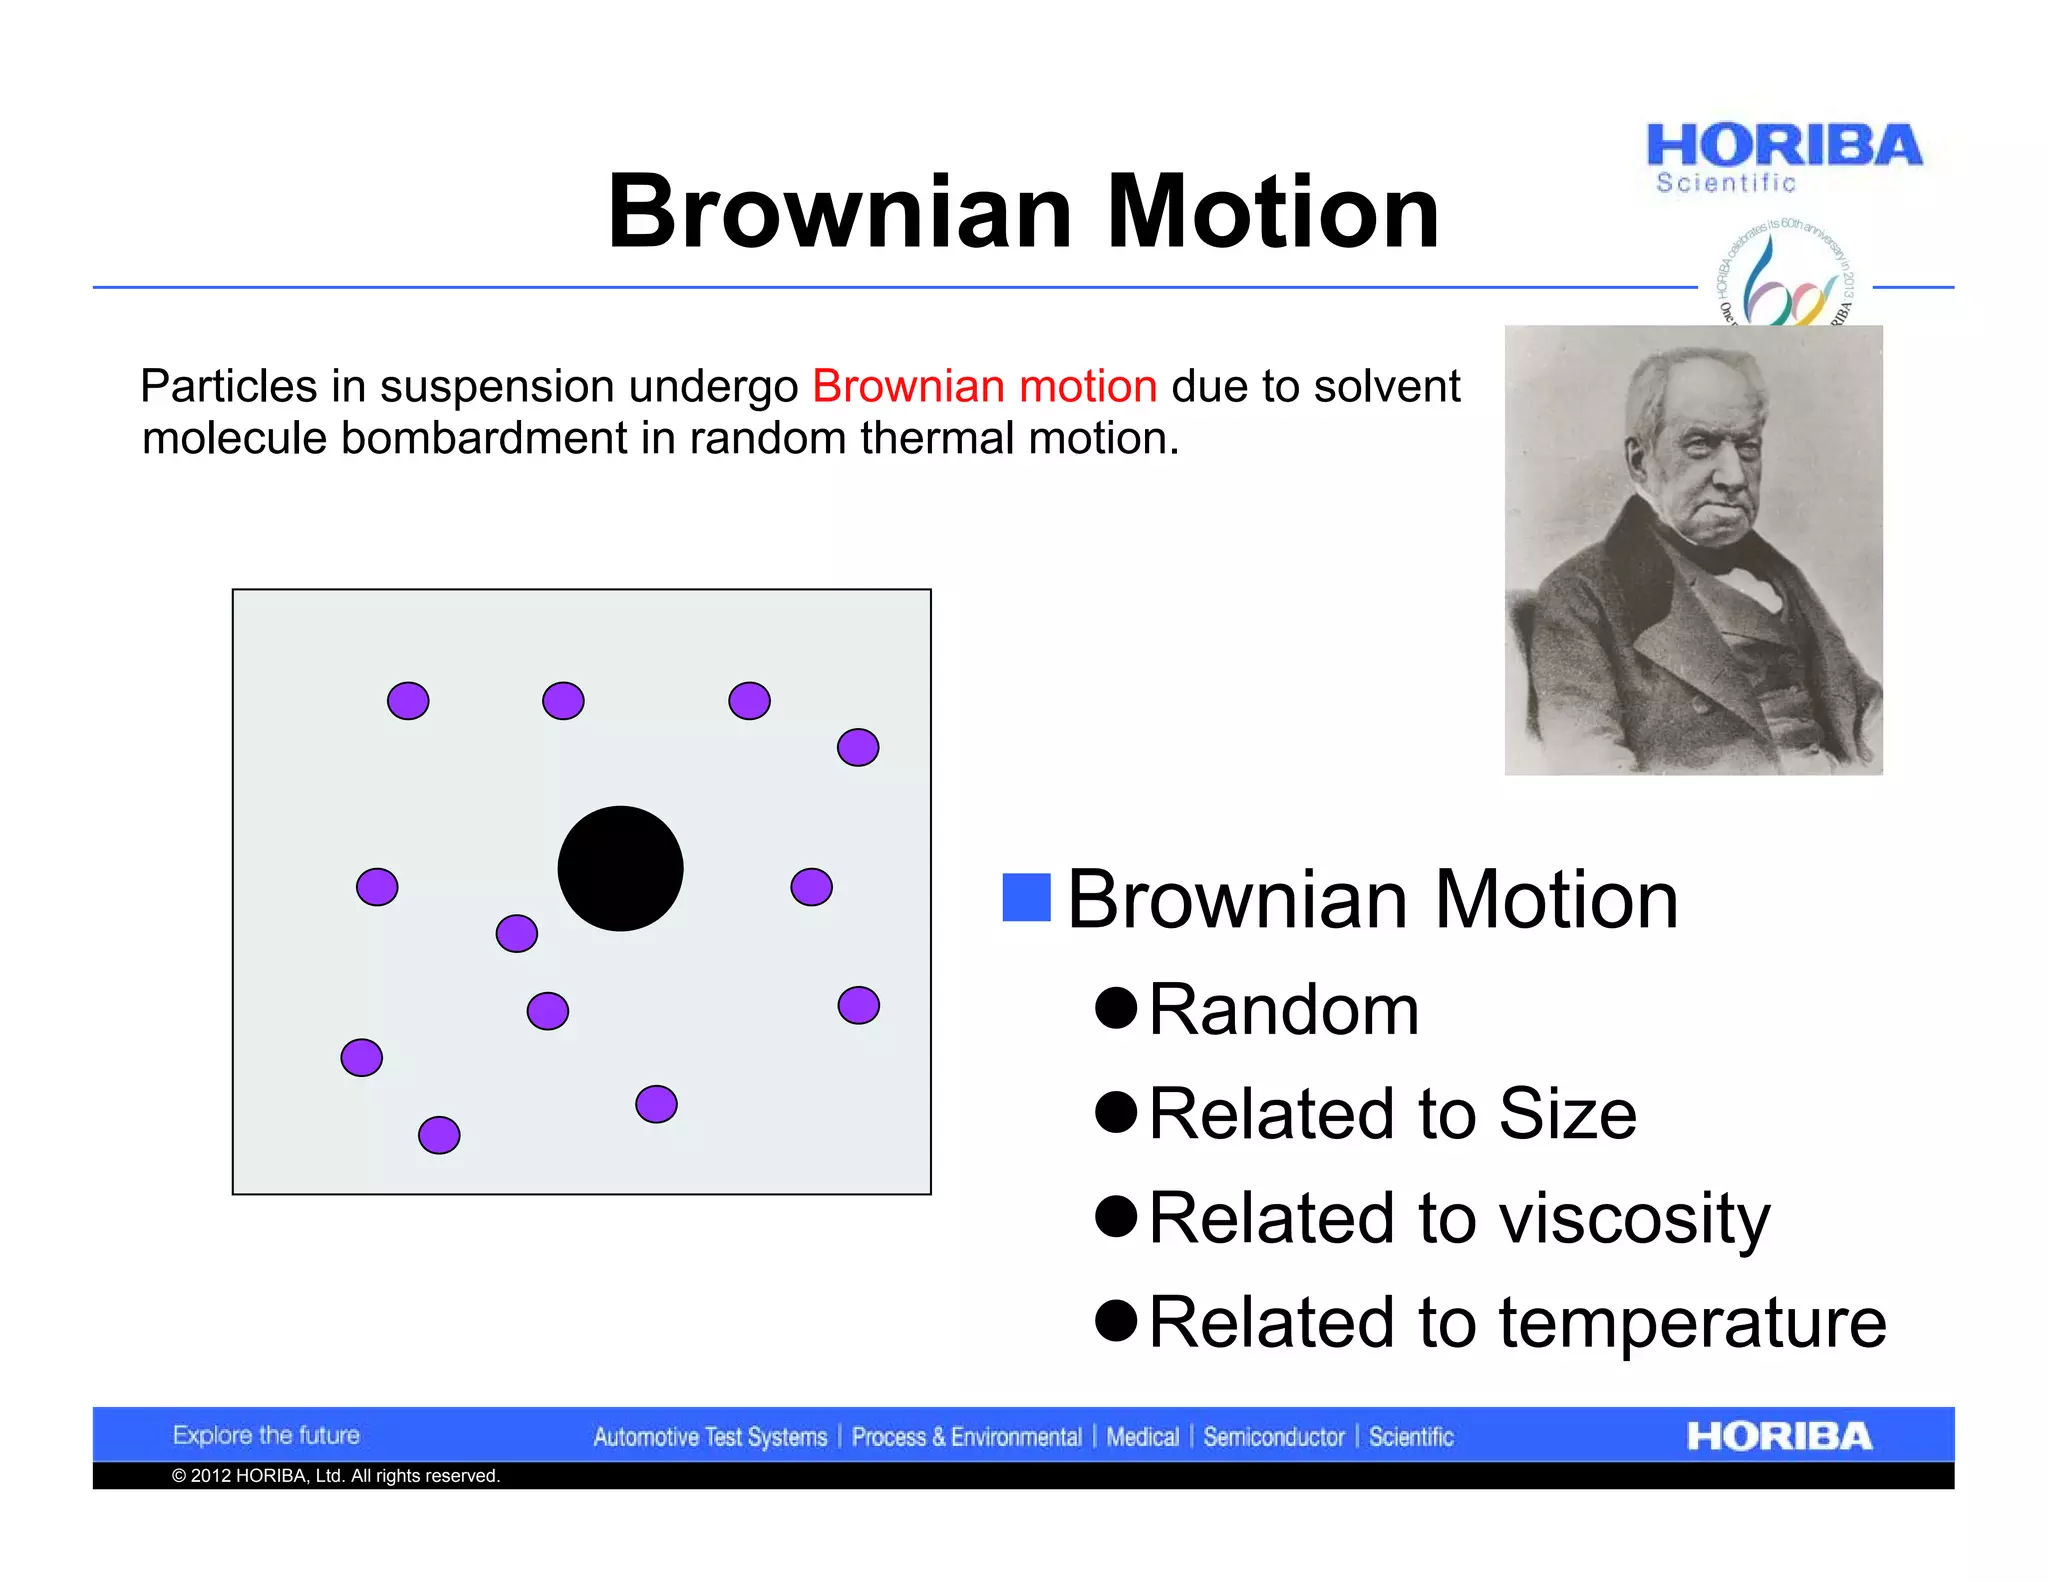
Brownian motion is essential for particle analysis in DLS, affecting size and behavior.
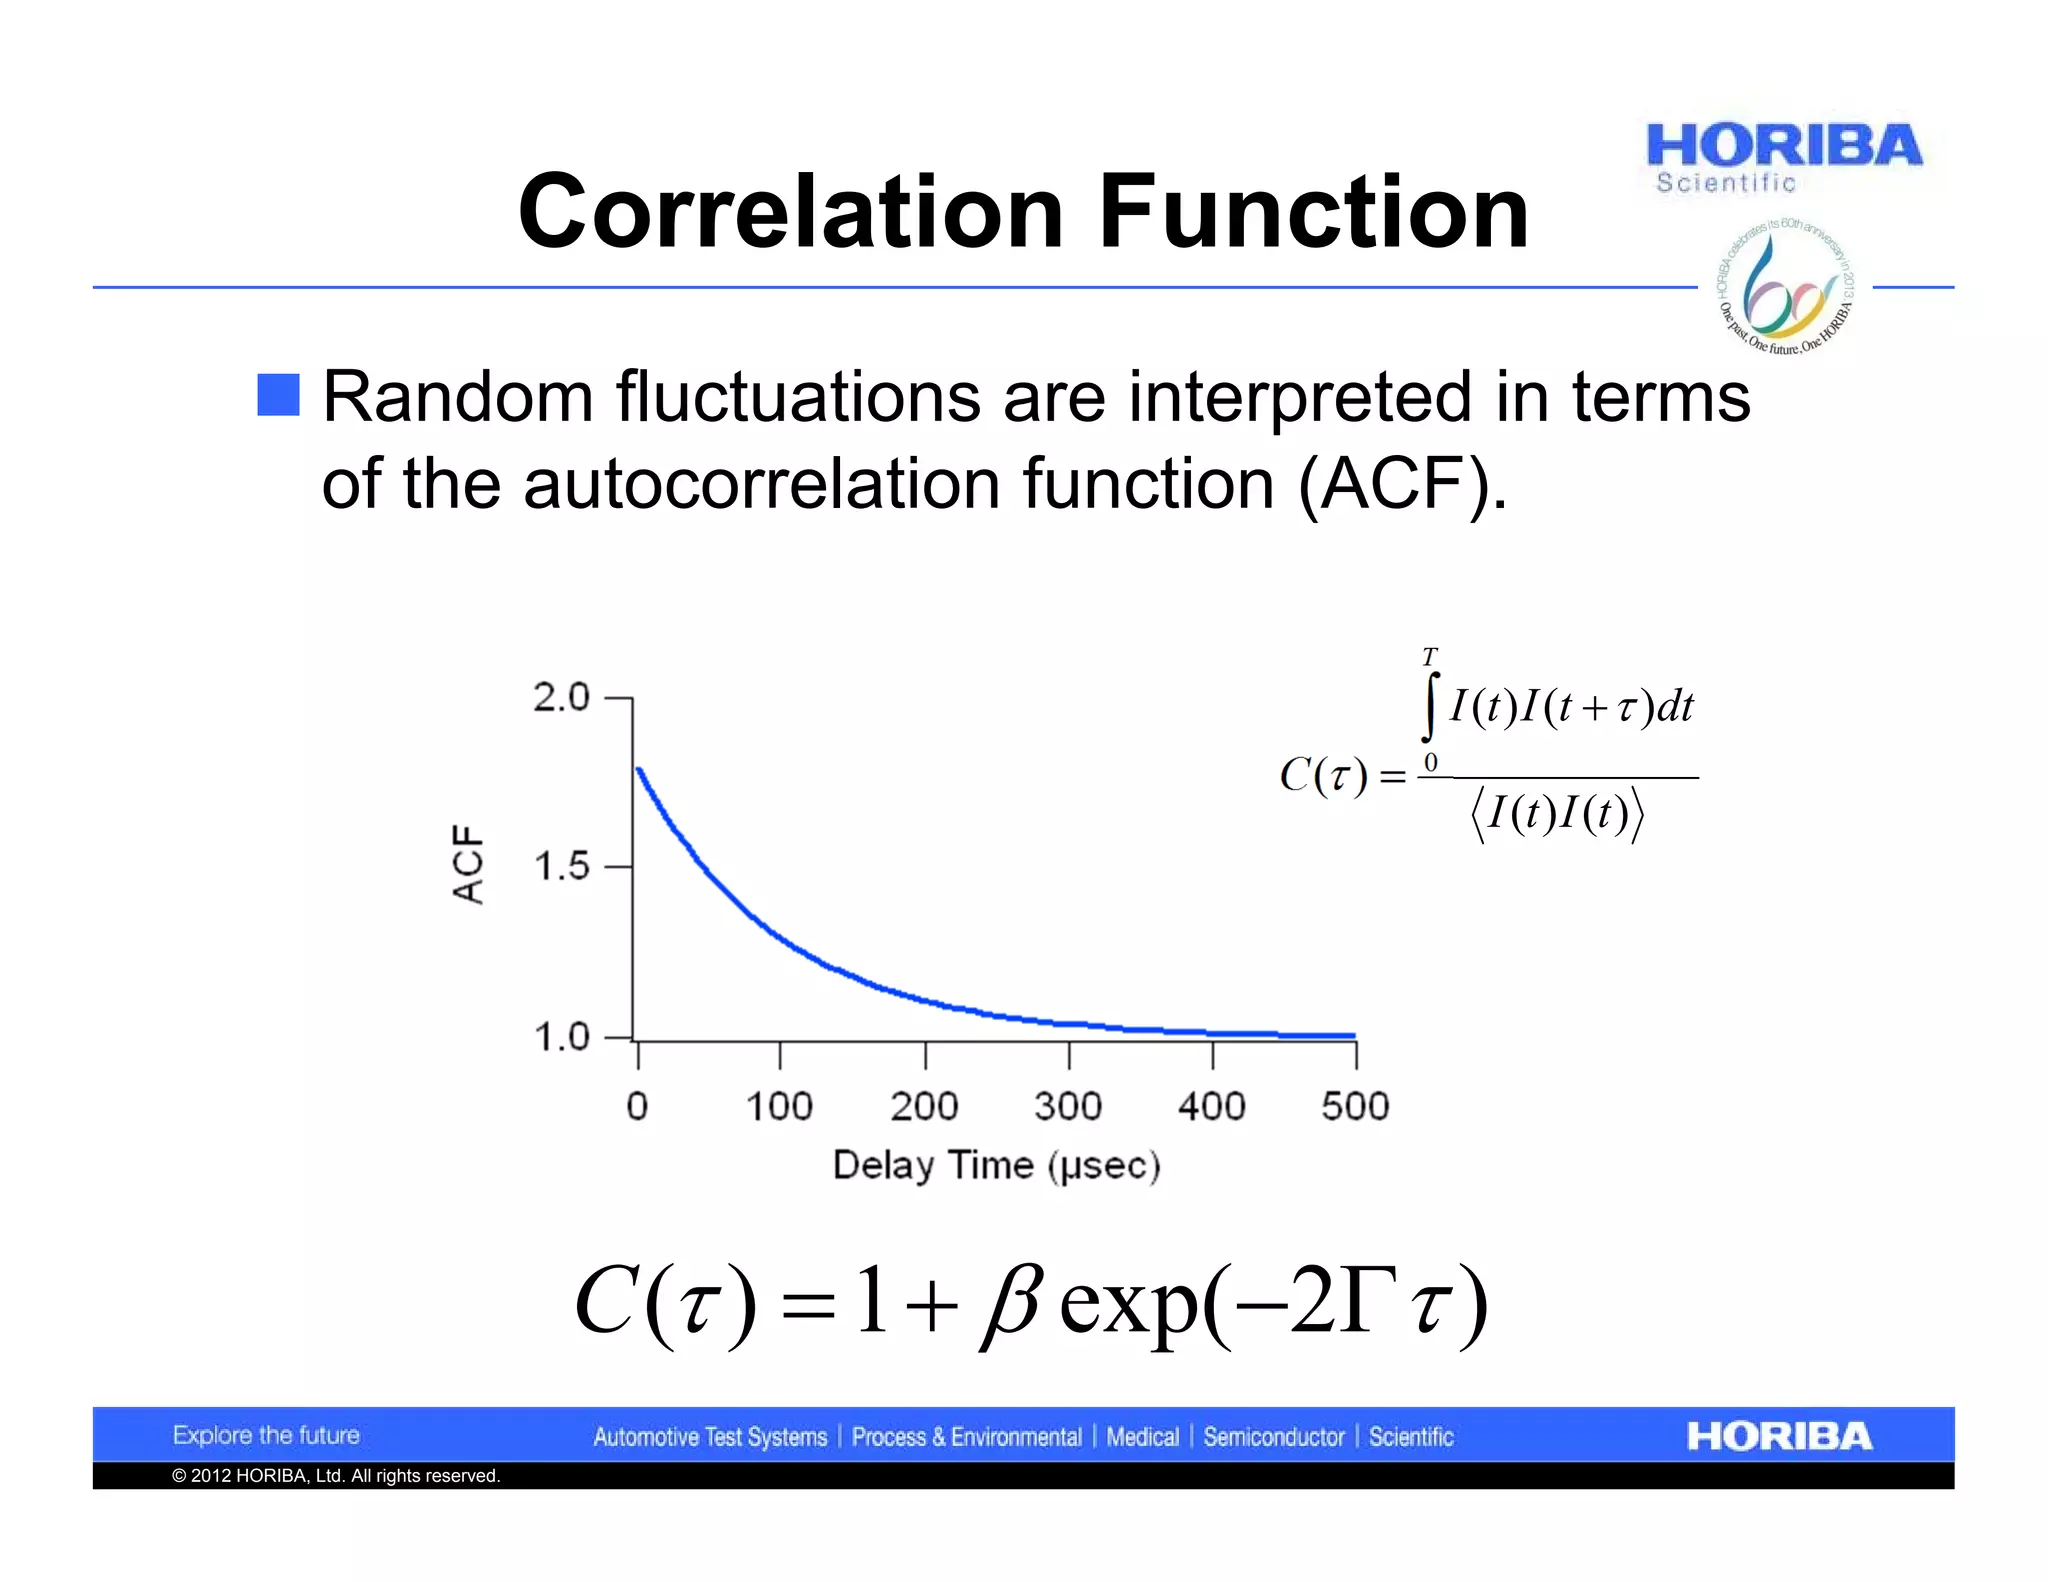
Description of autocorrelation function in DLS and its impact on interpretation of size.
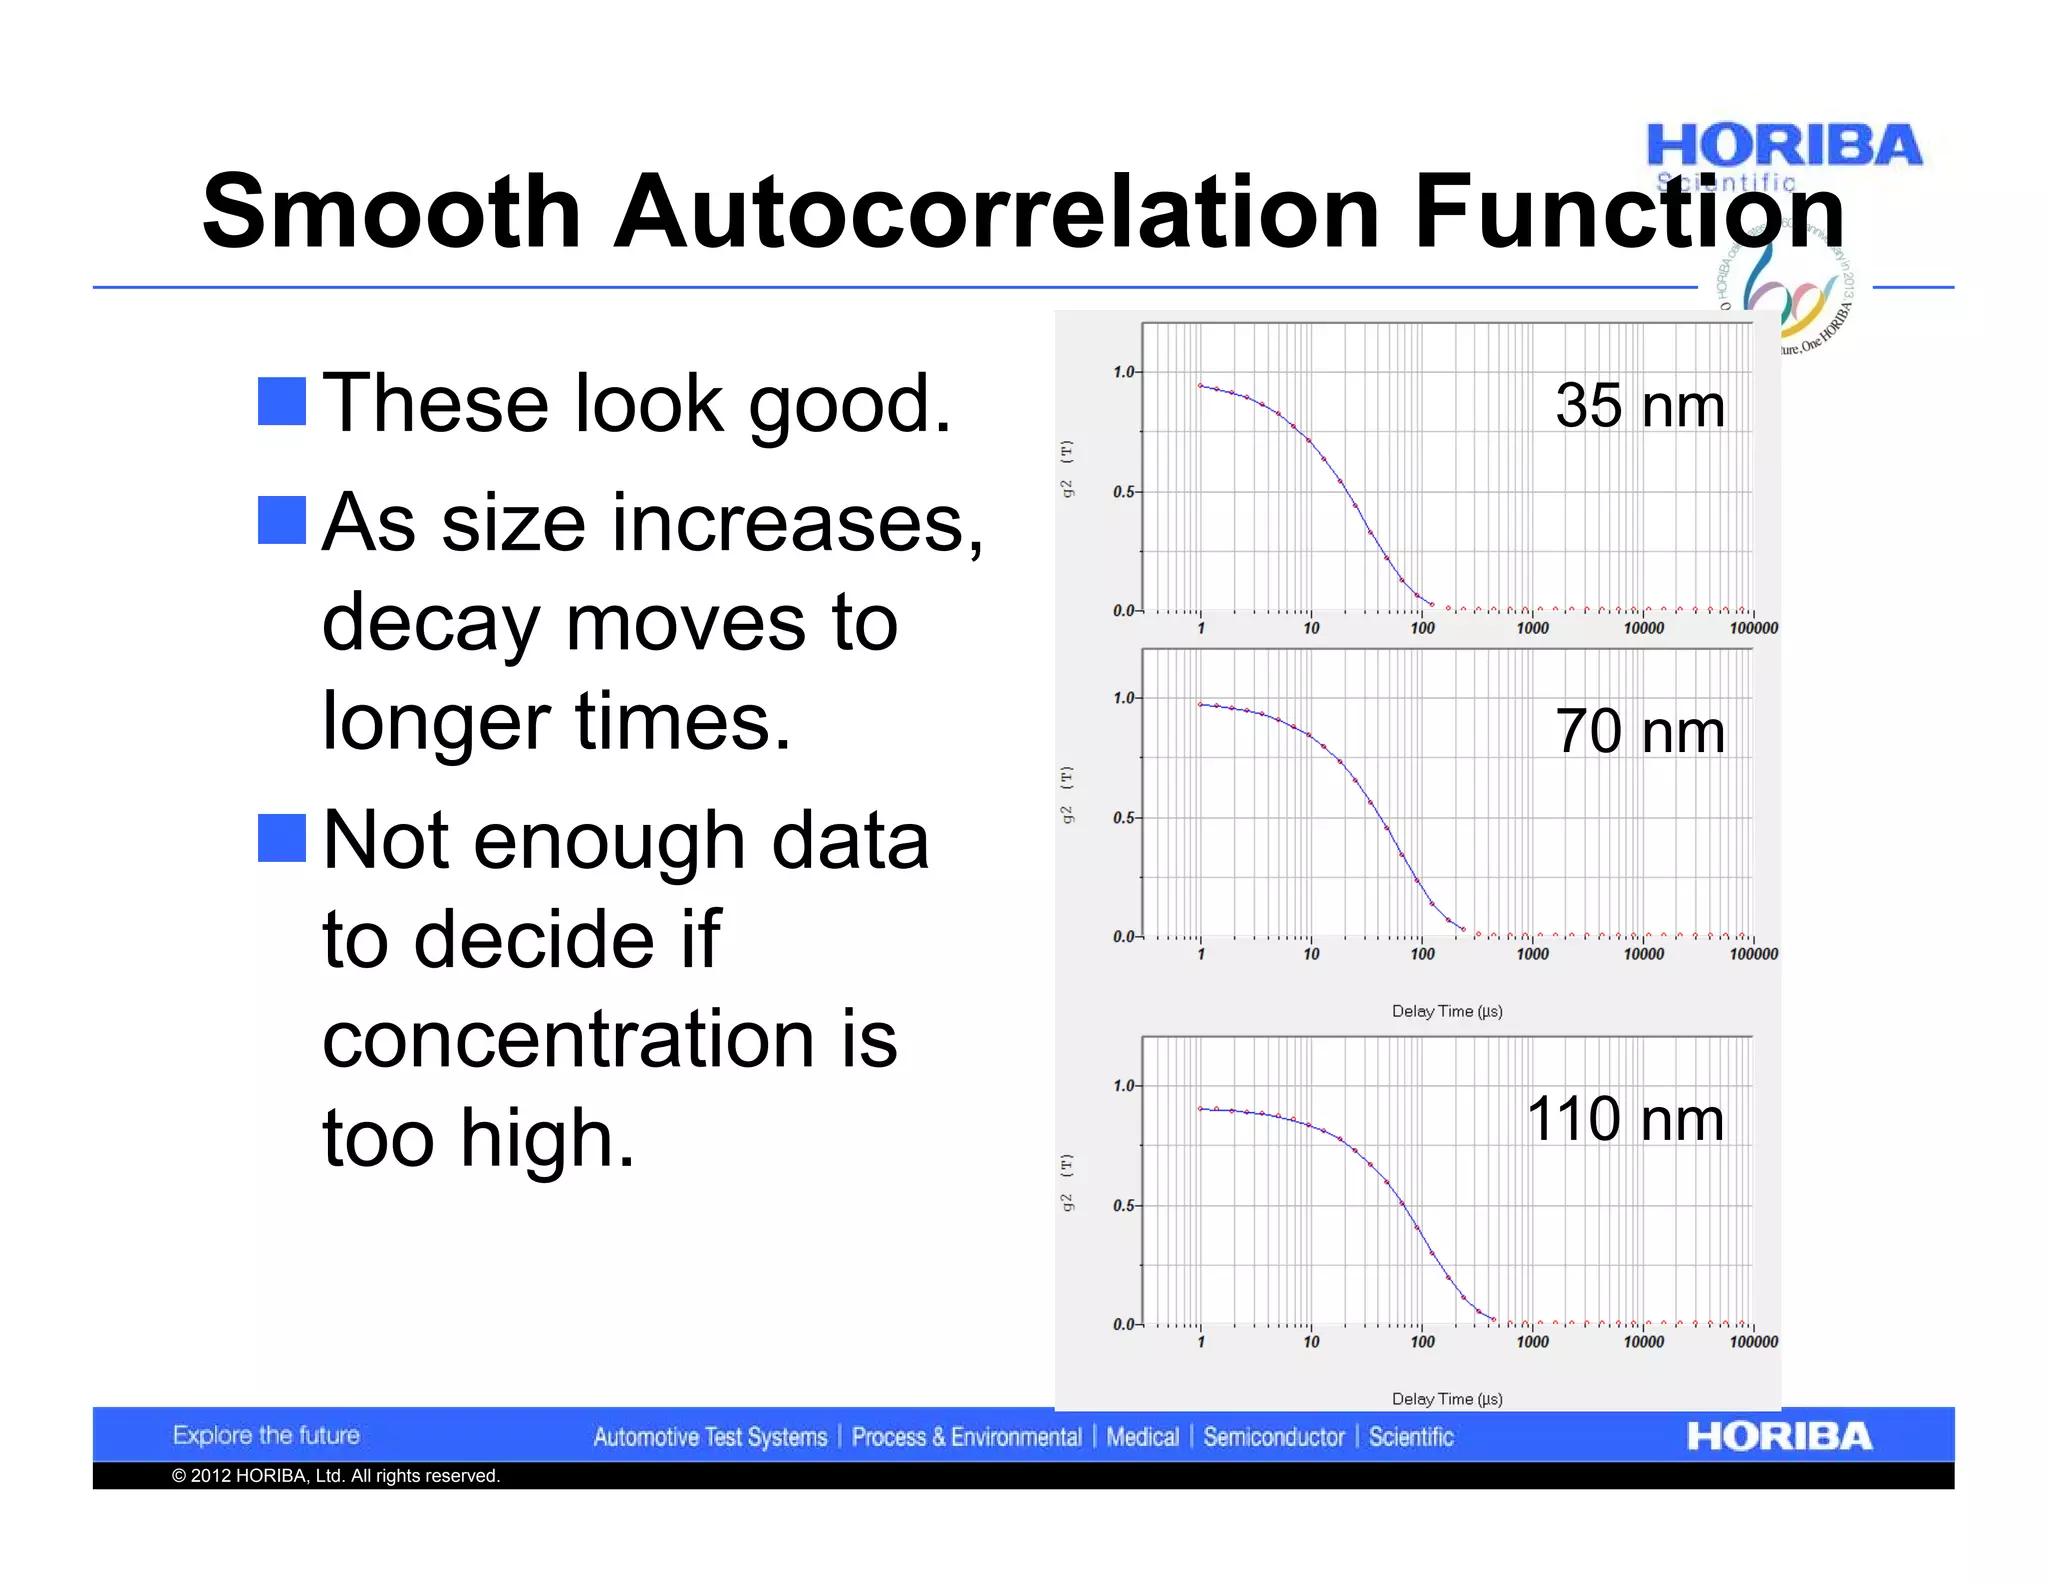
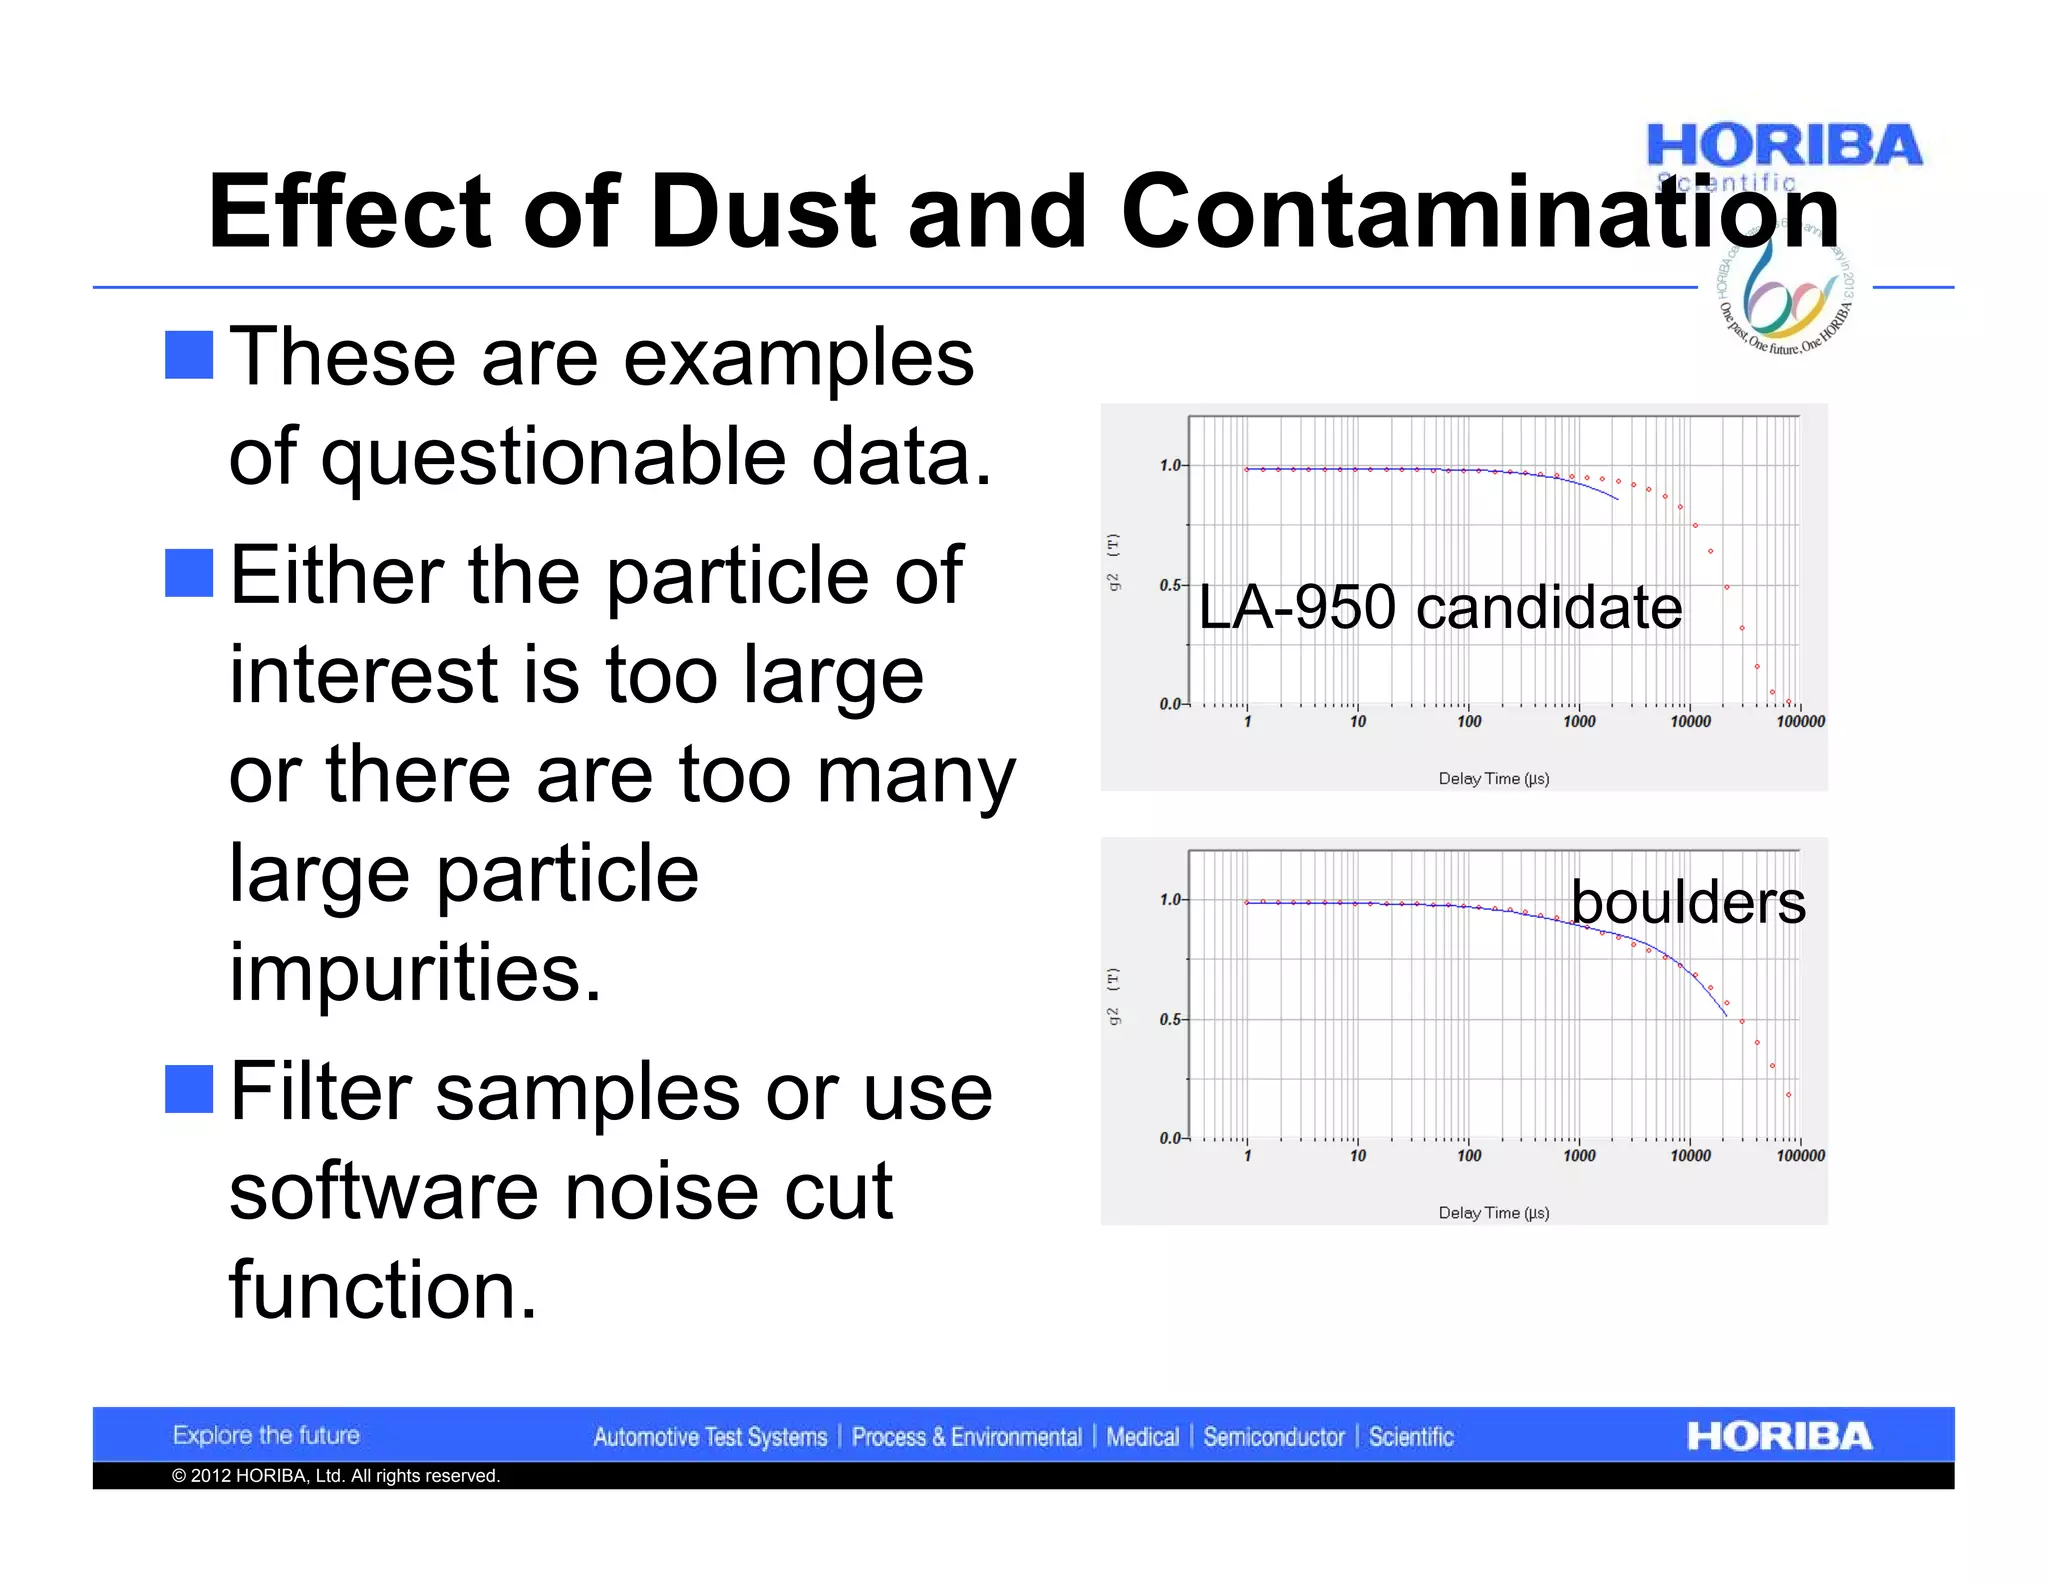
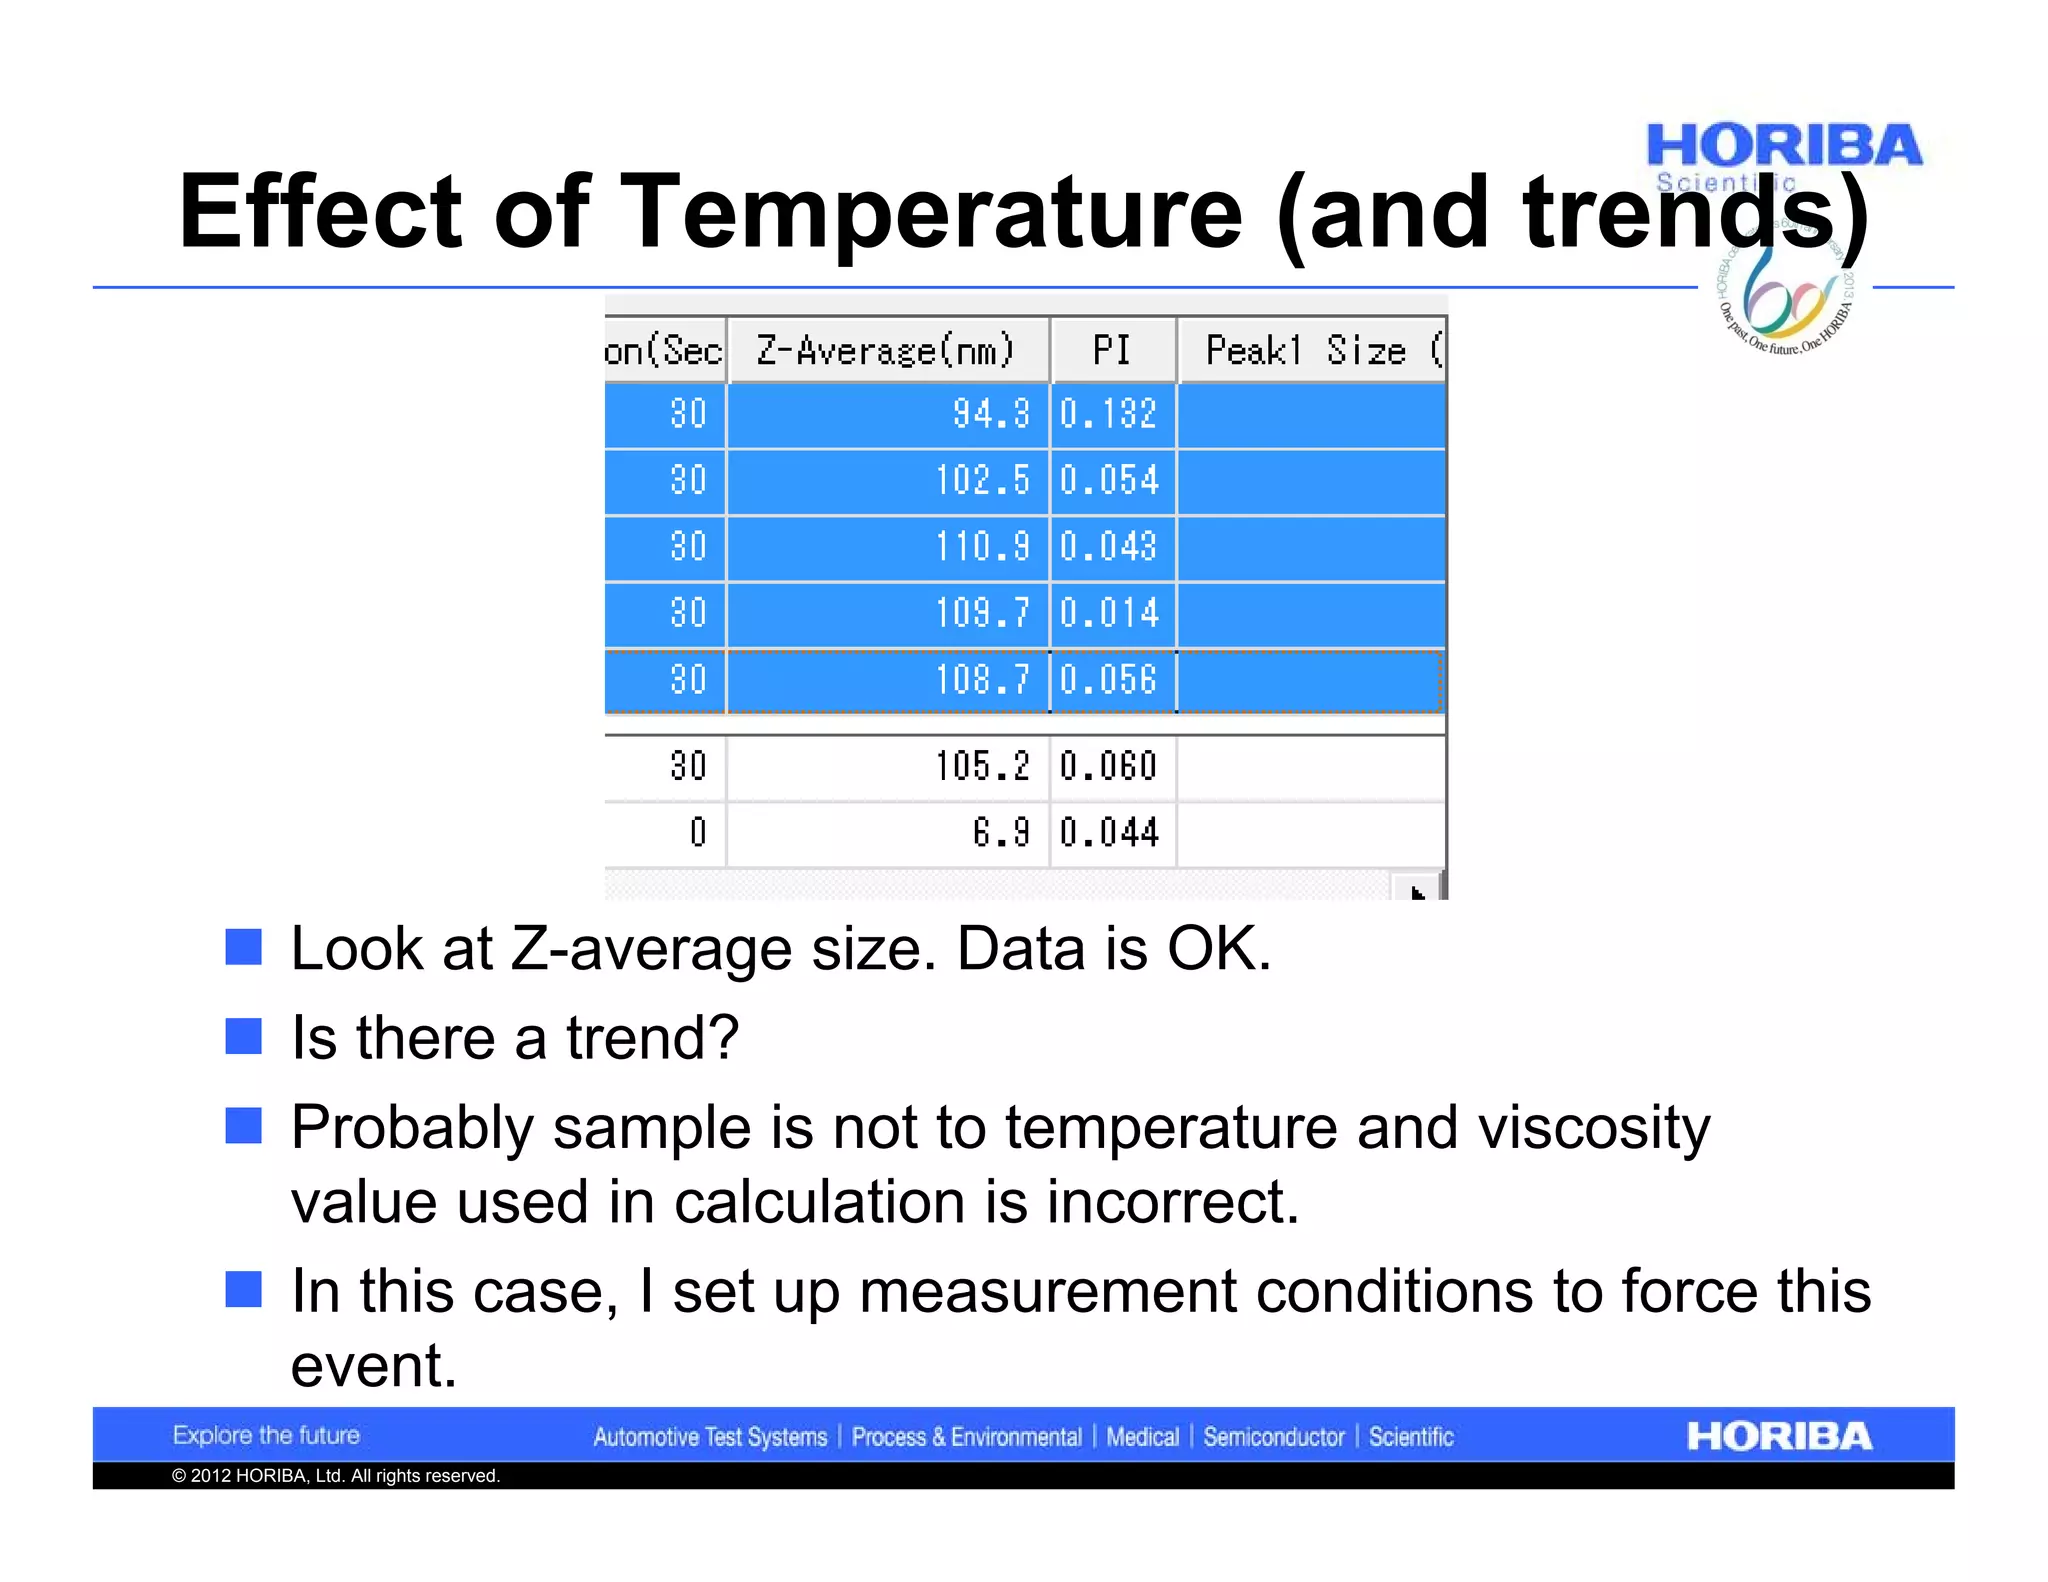
Importance of clean samples; impact of temperature and characteristics of DLS results.
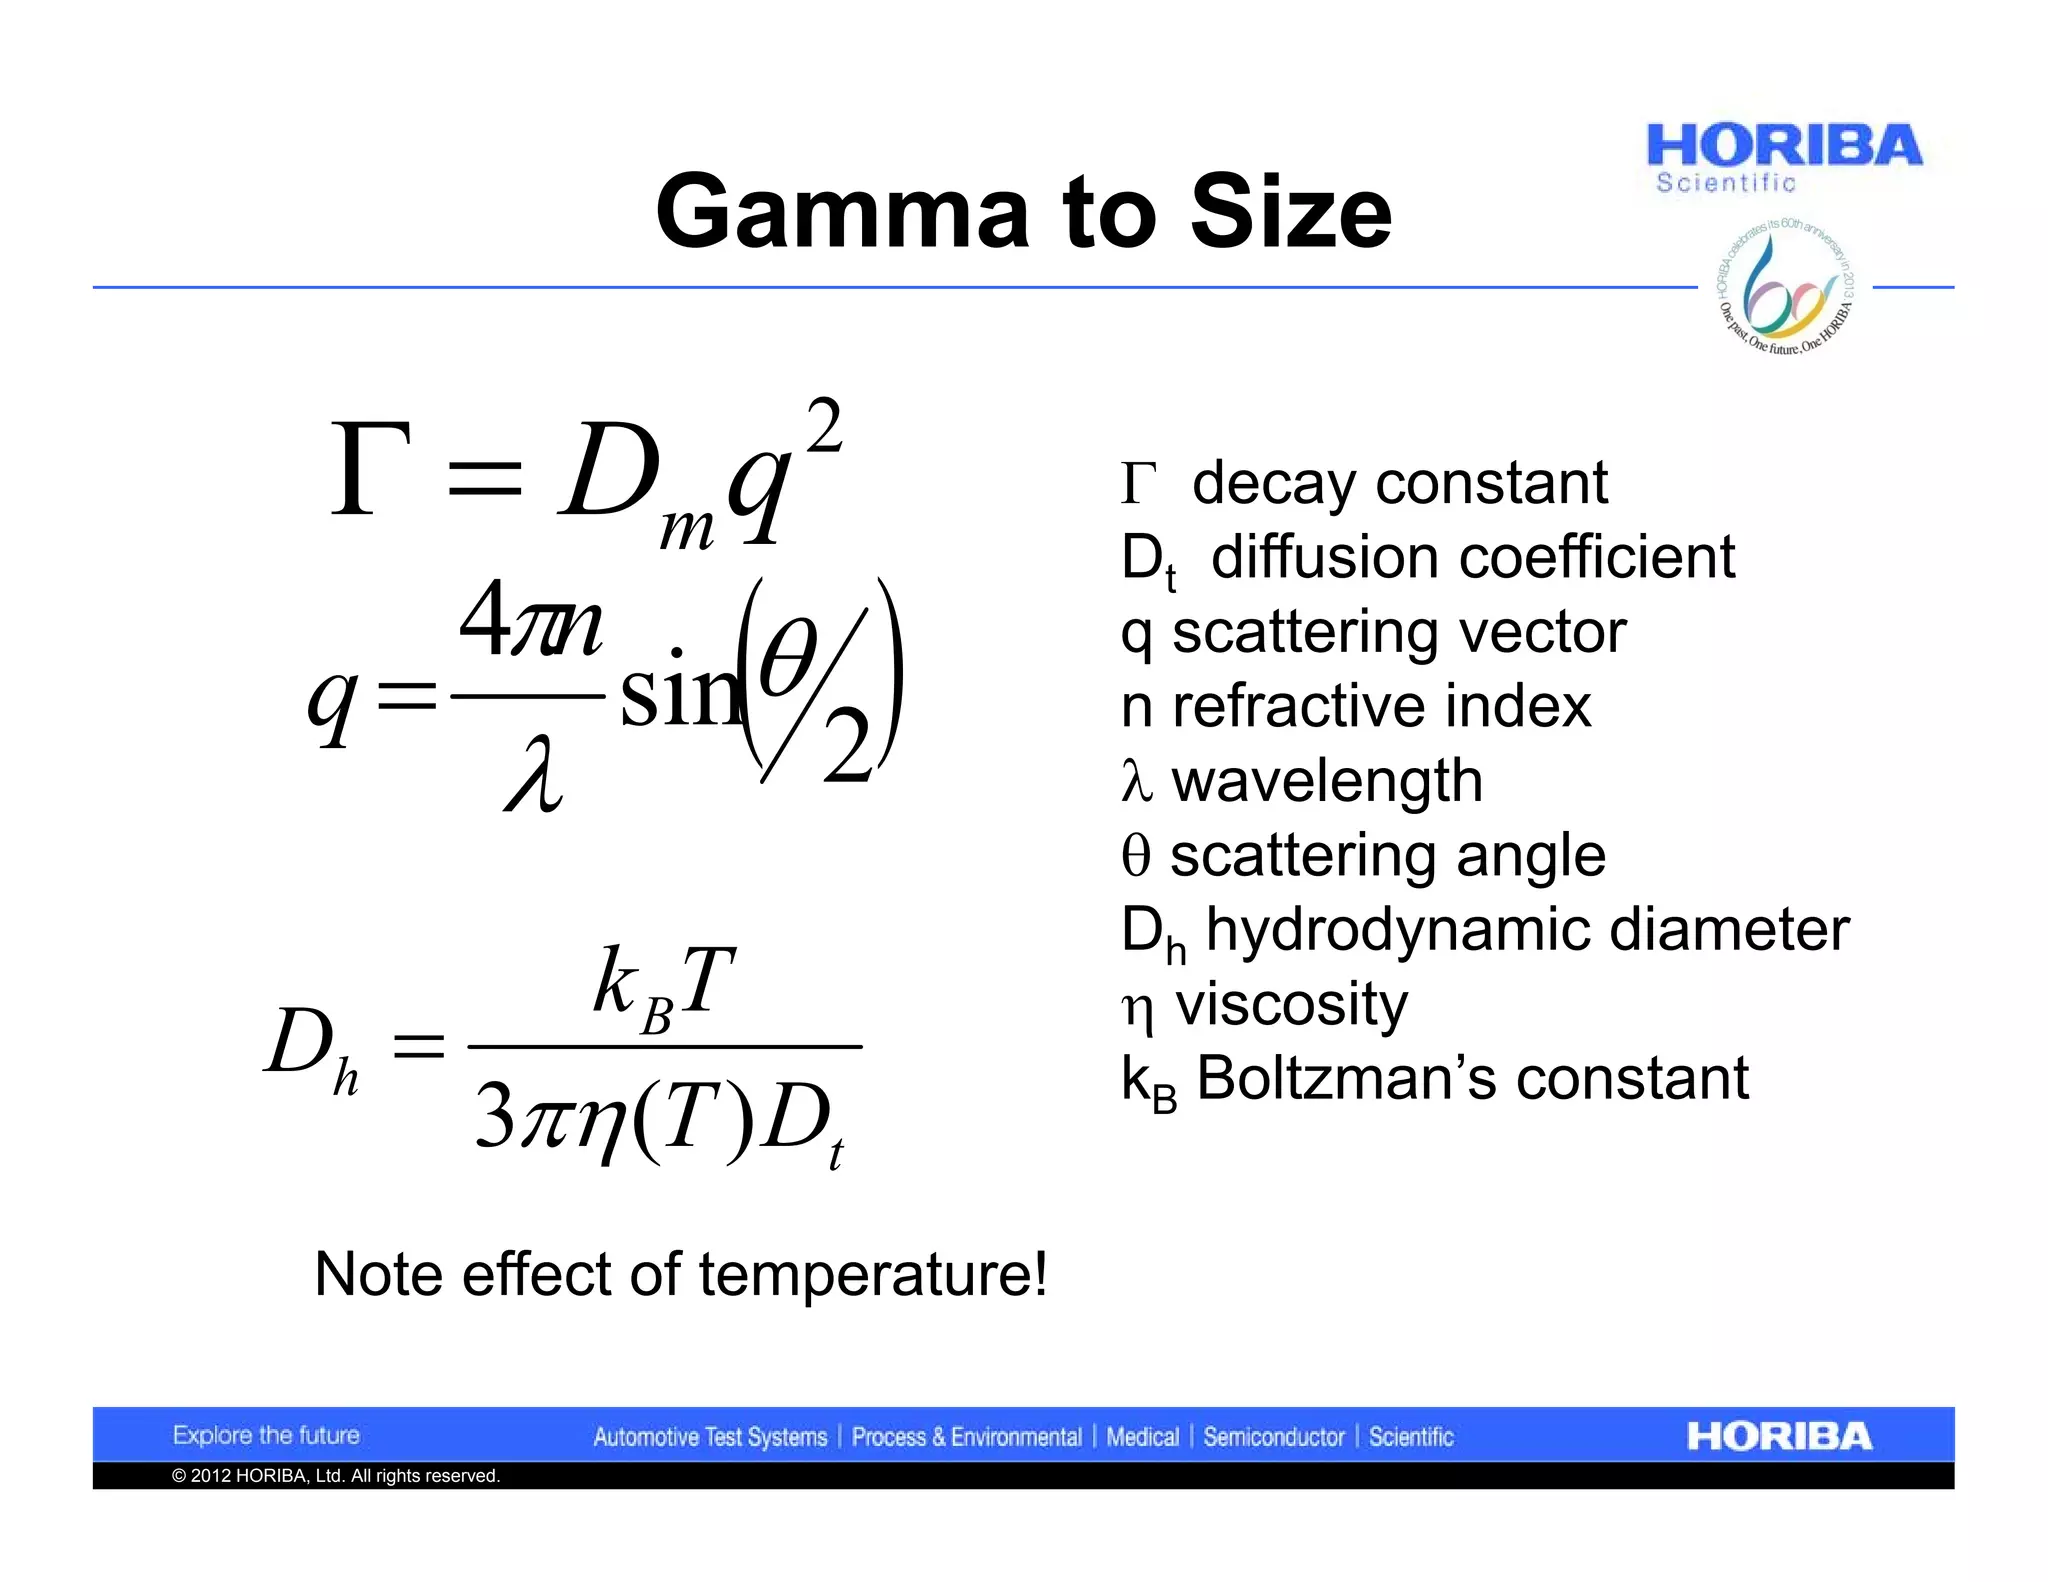
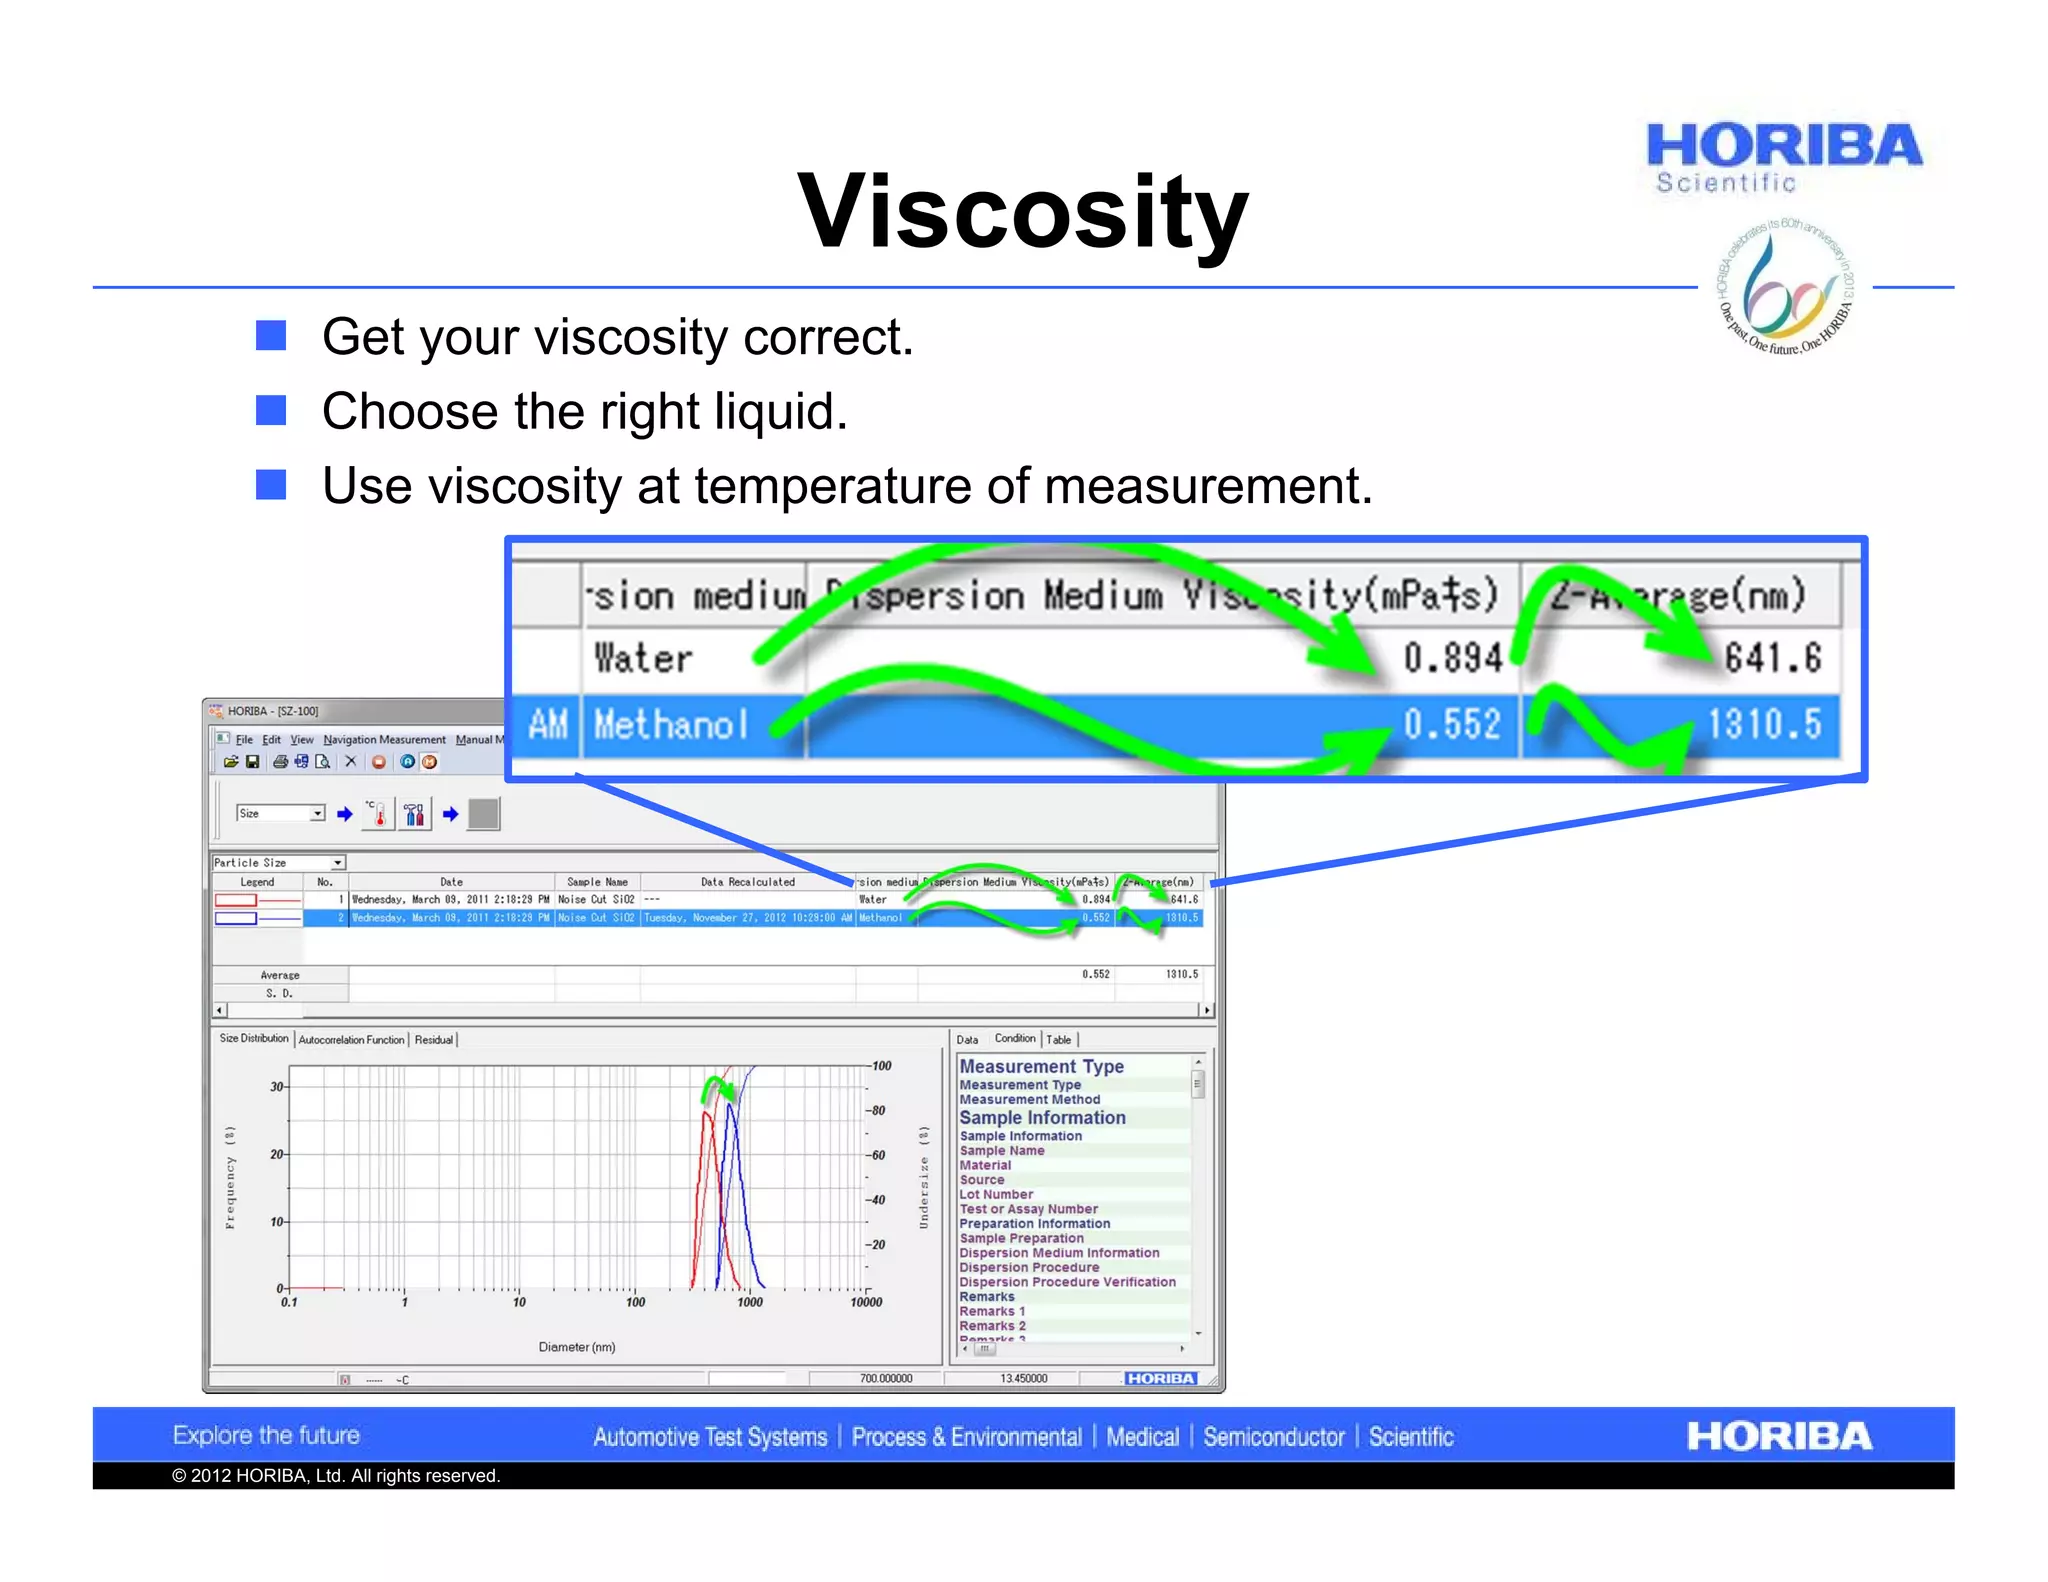
The role of temperature and accurate viscosity selection in obtaining reliable DLS data.
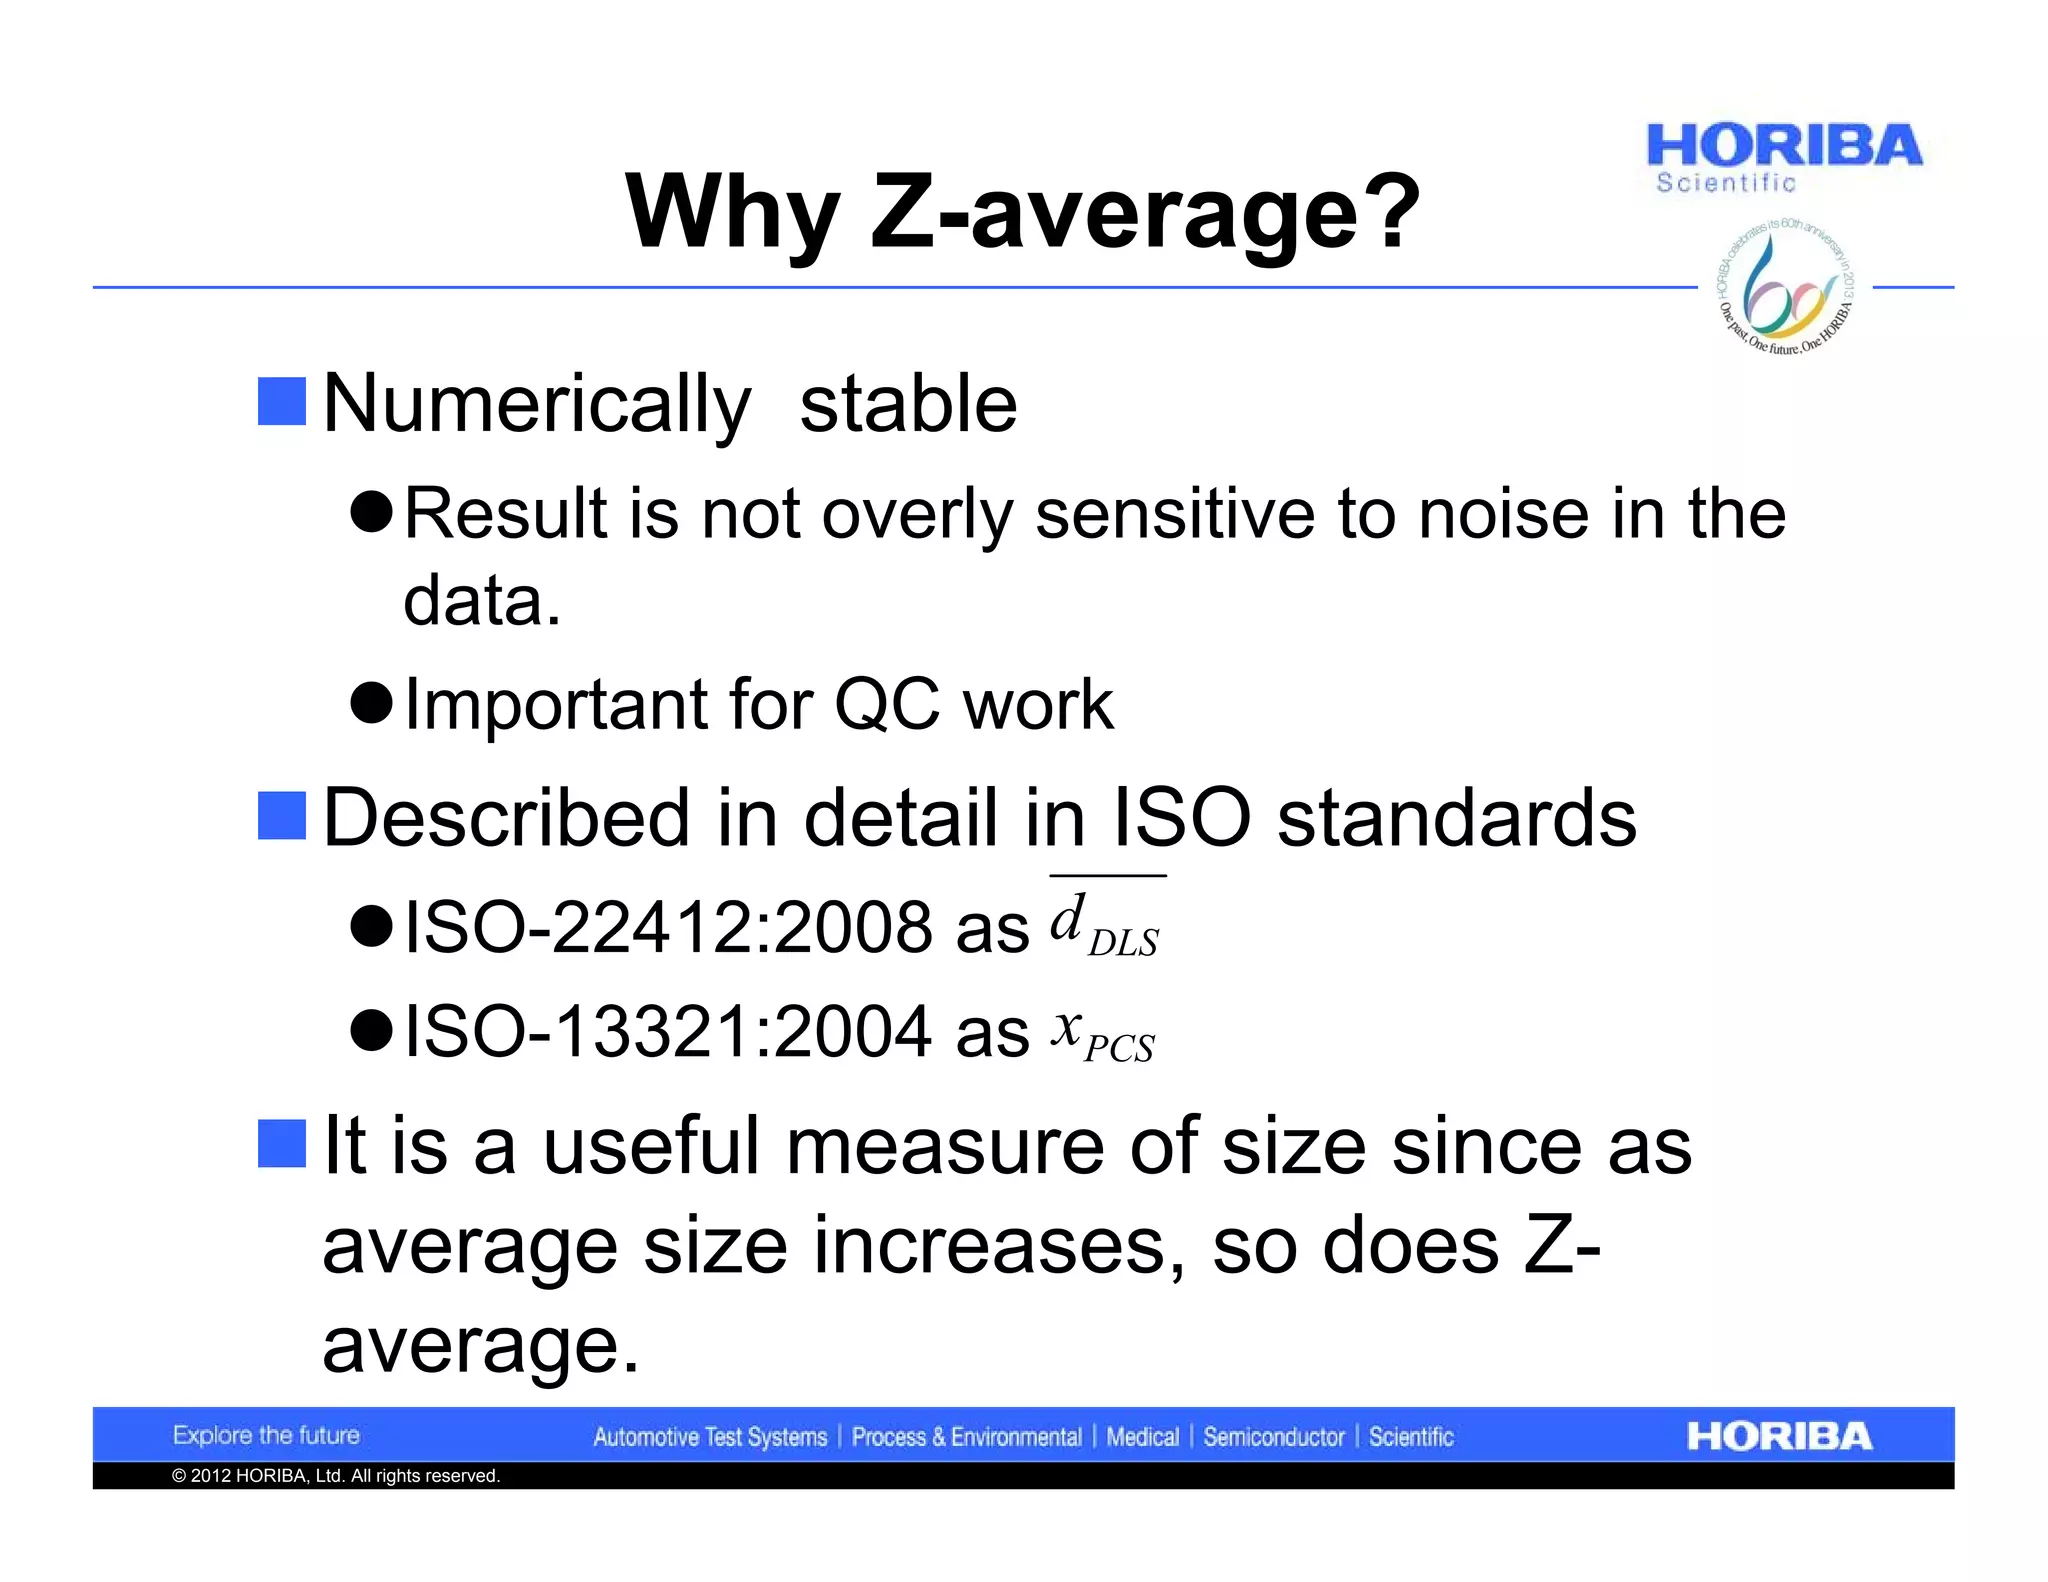
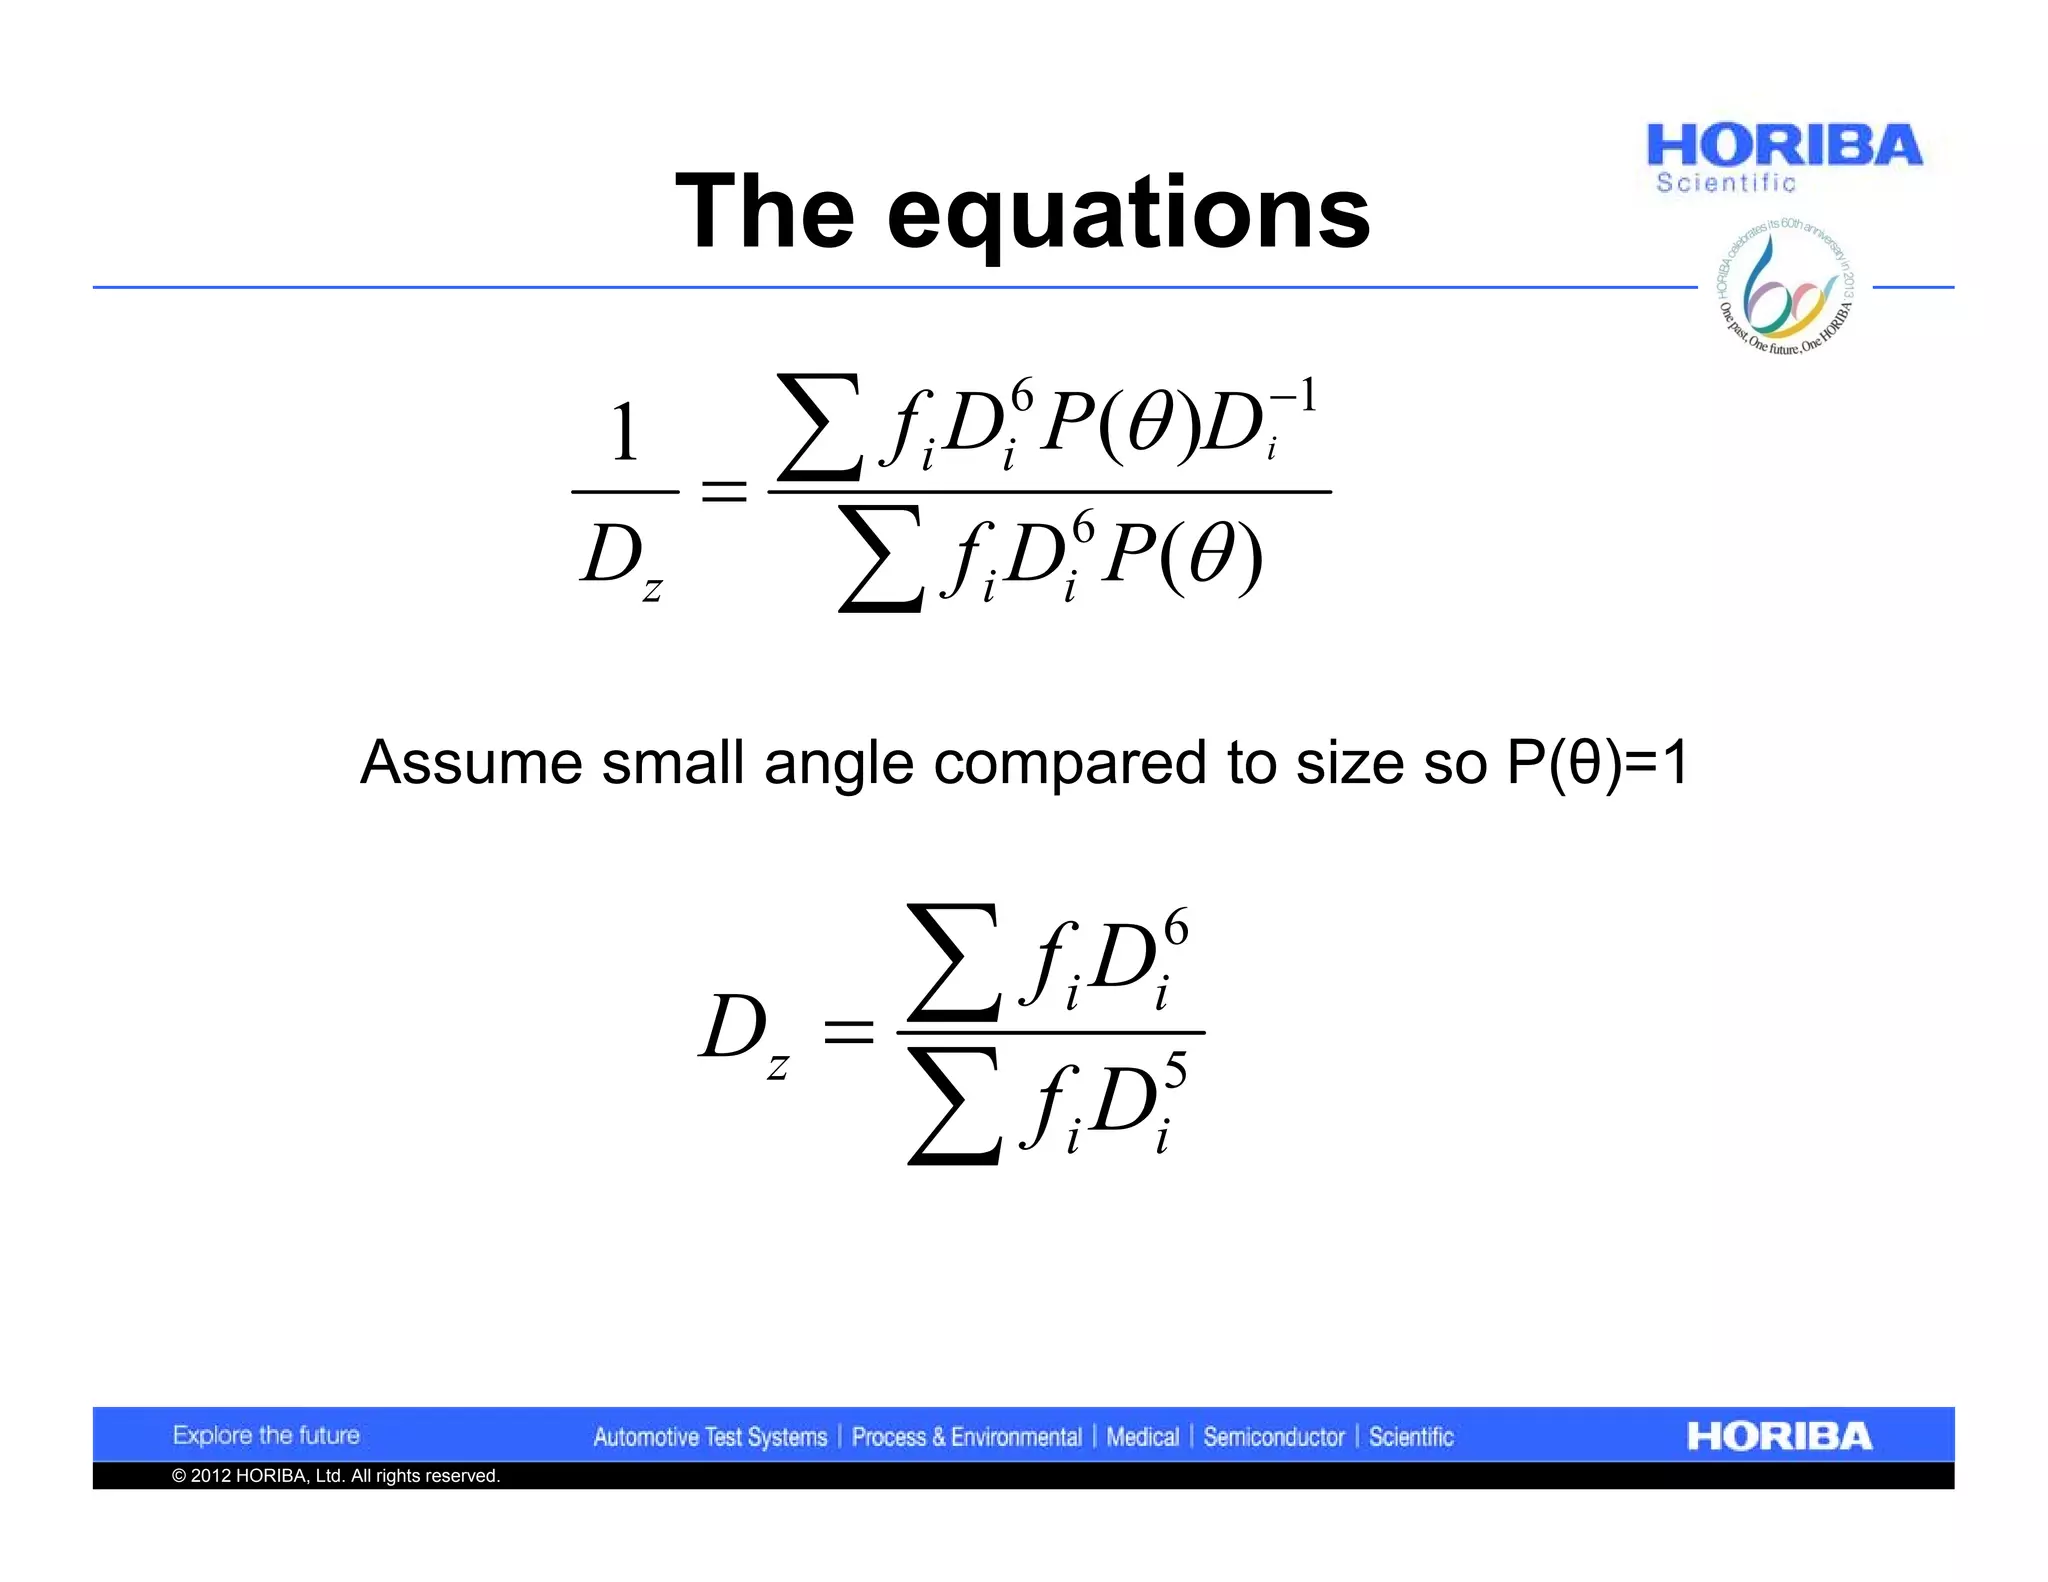
Z-average is a stable measure of particle size, affected by noise and averaging methods.
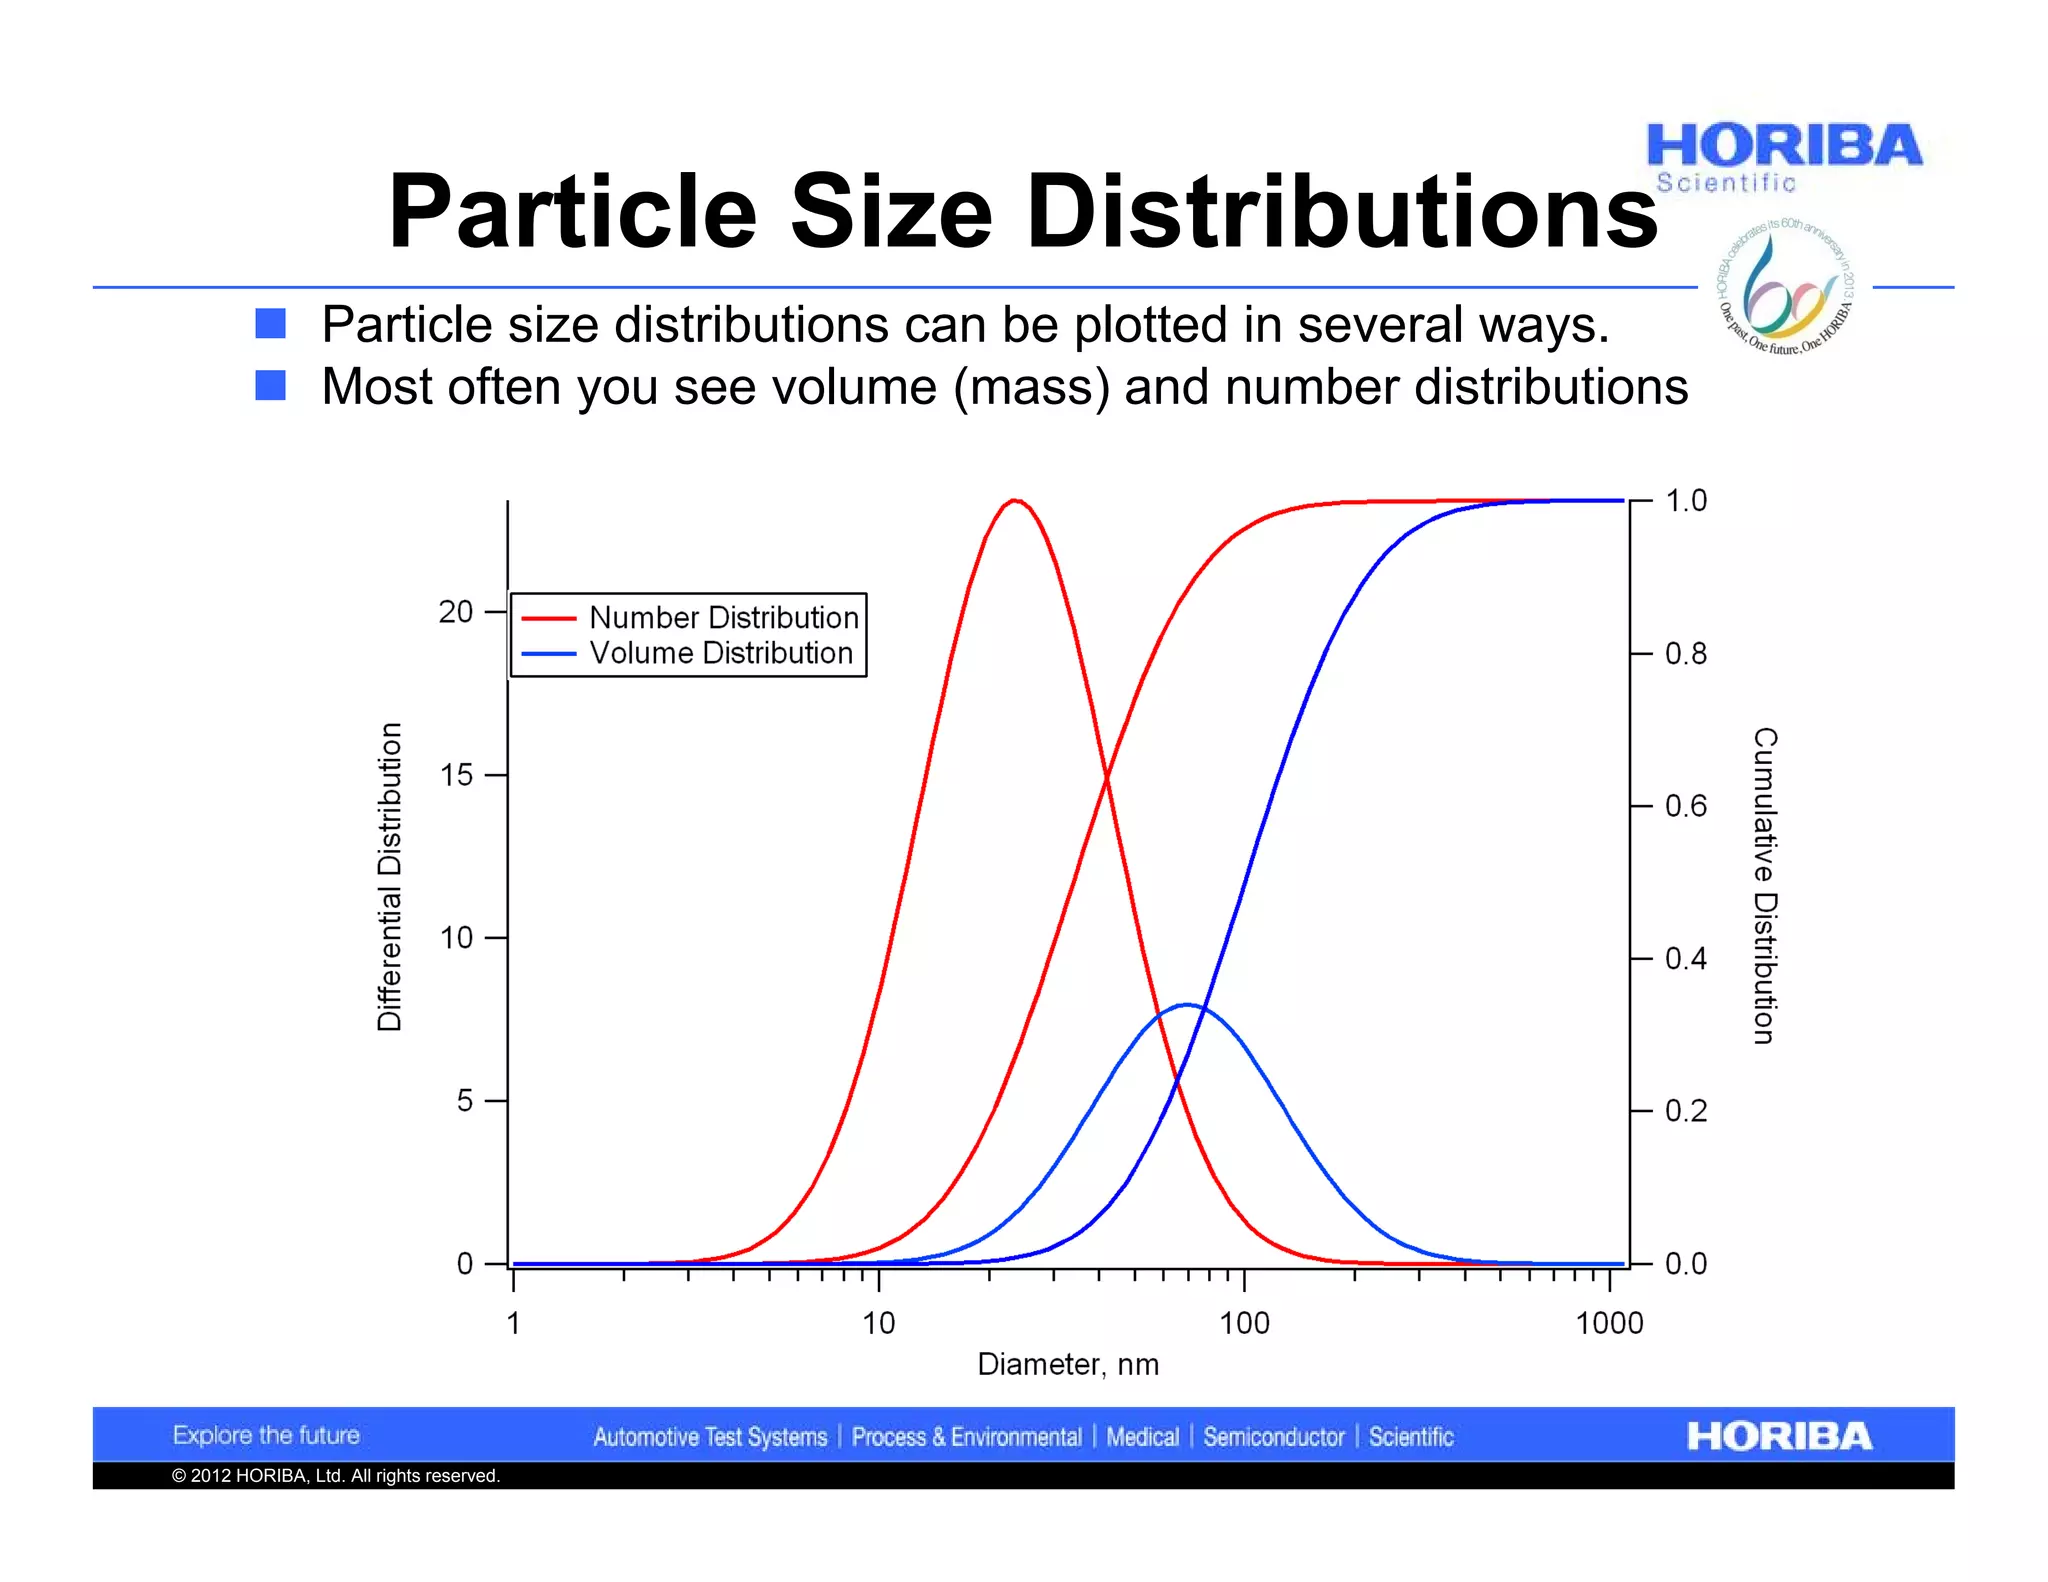
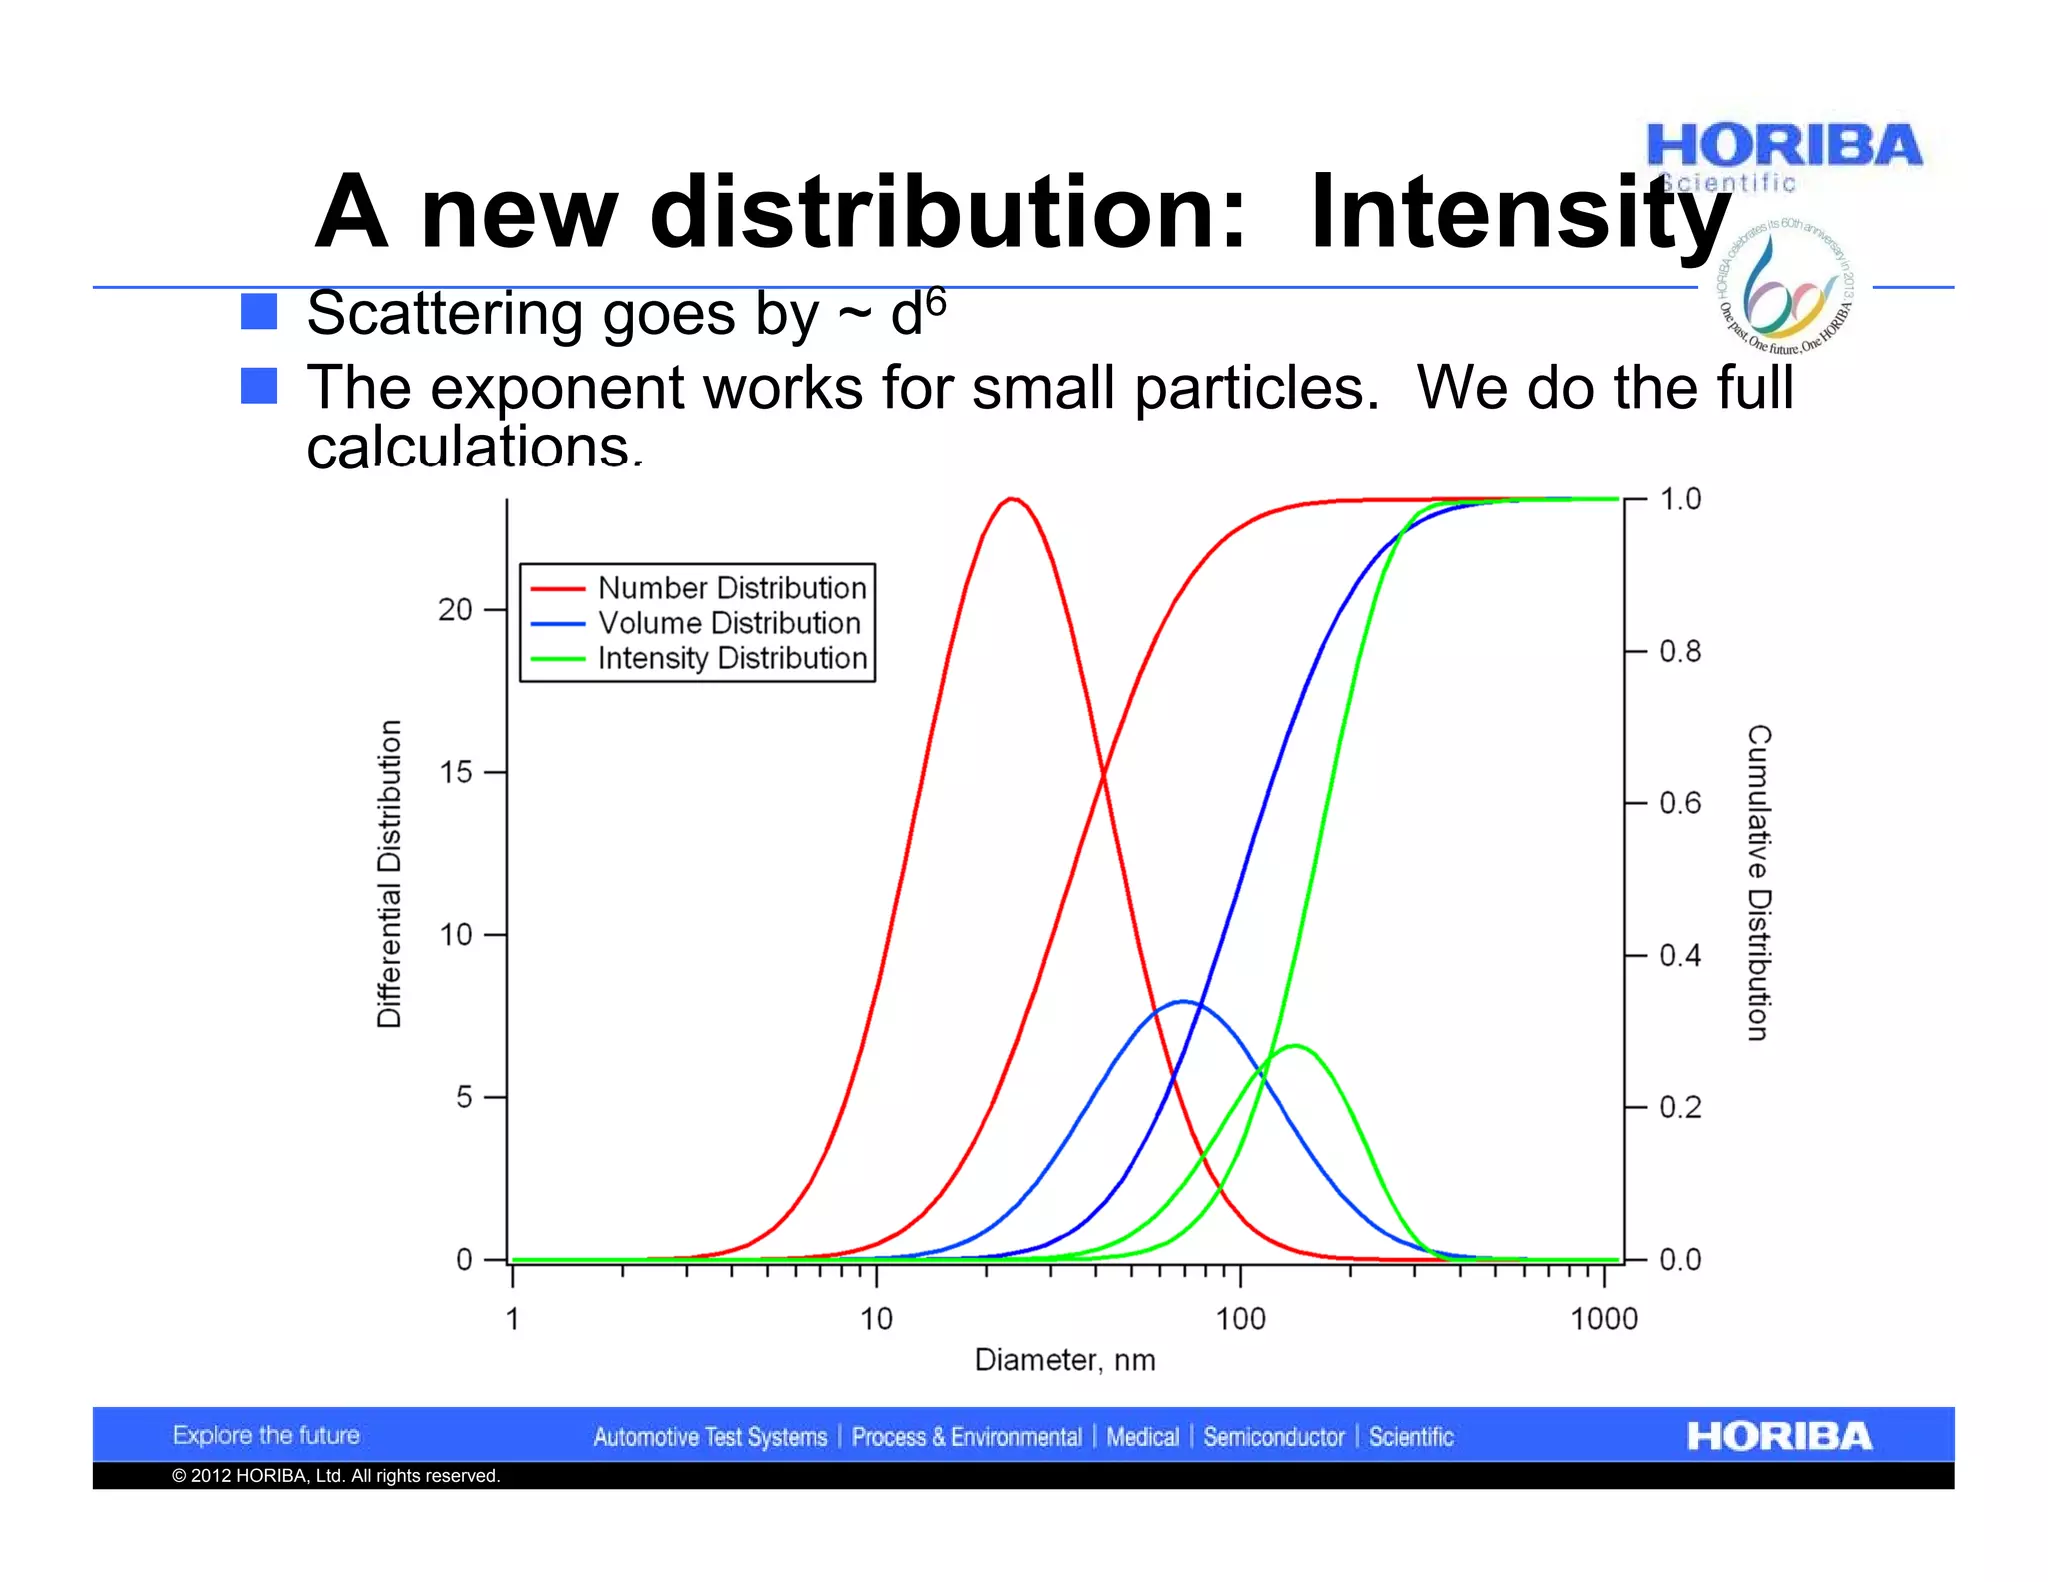
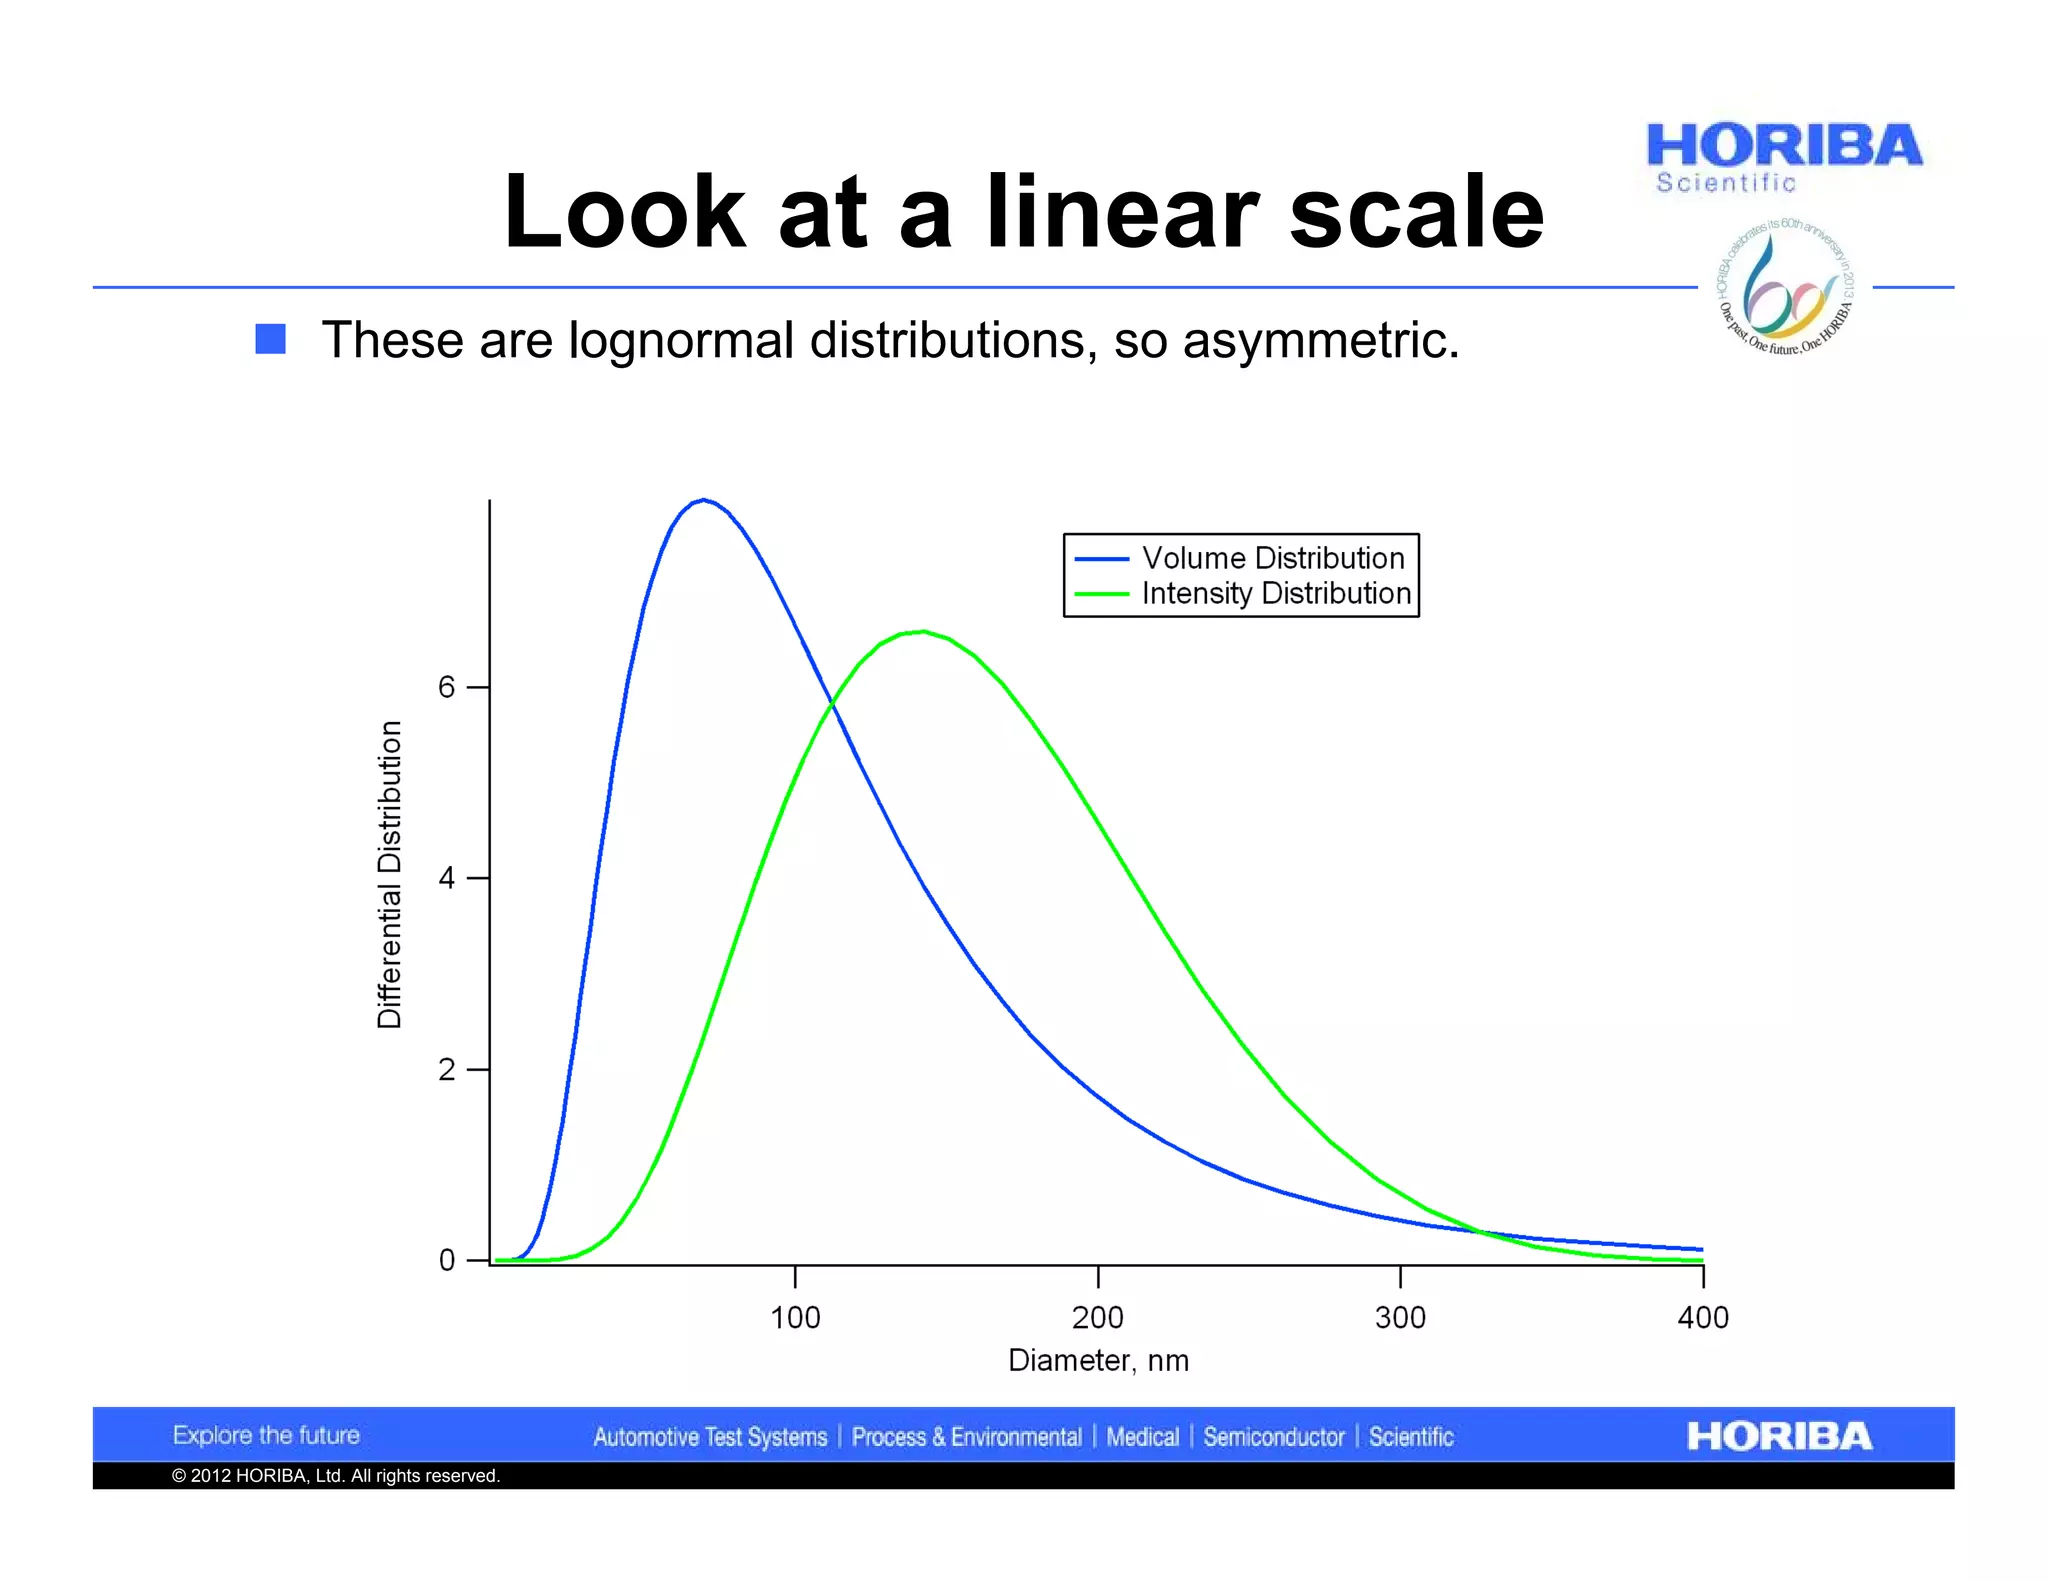
Different size distribution representations; maximally precise z-average results and their variability.
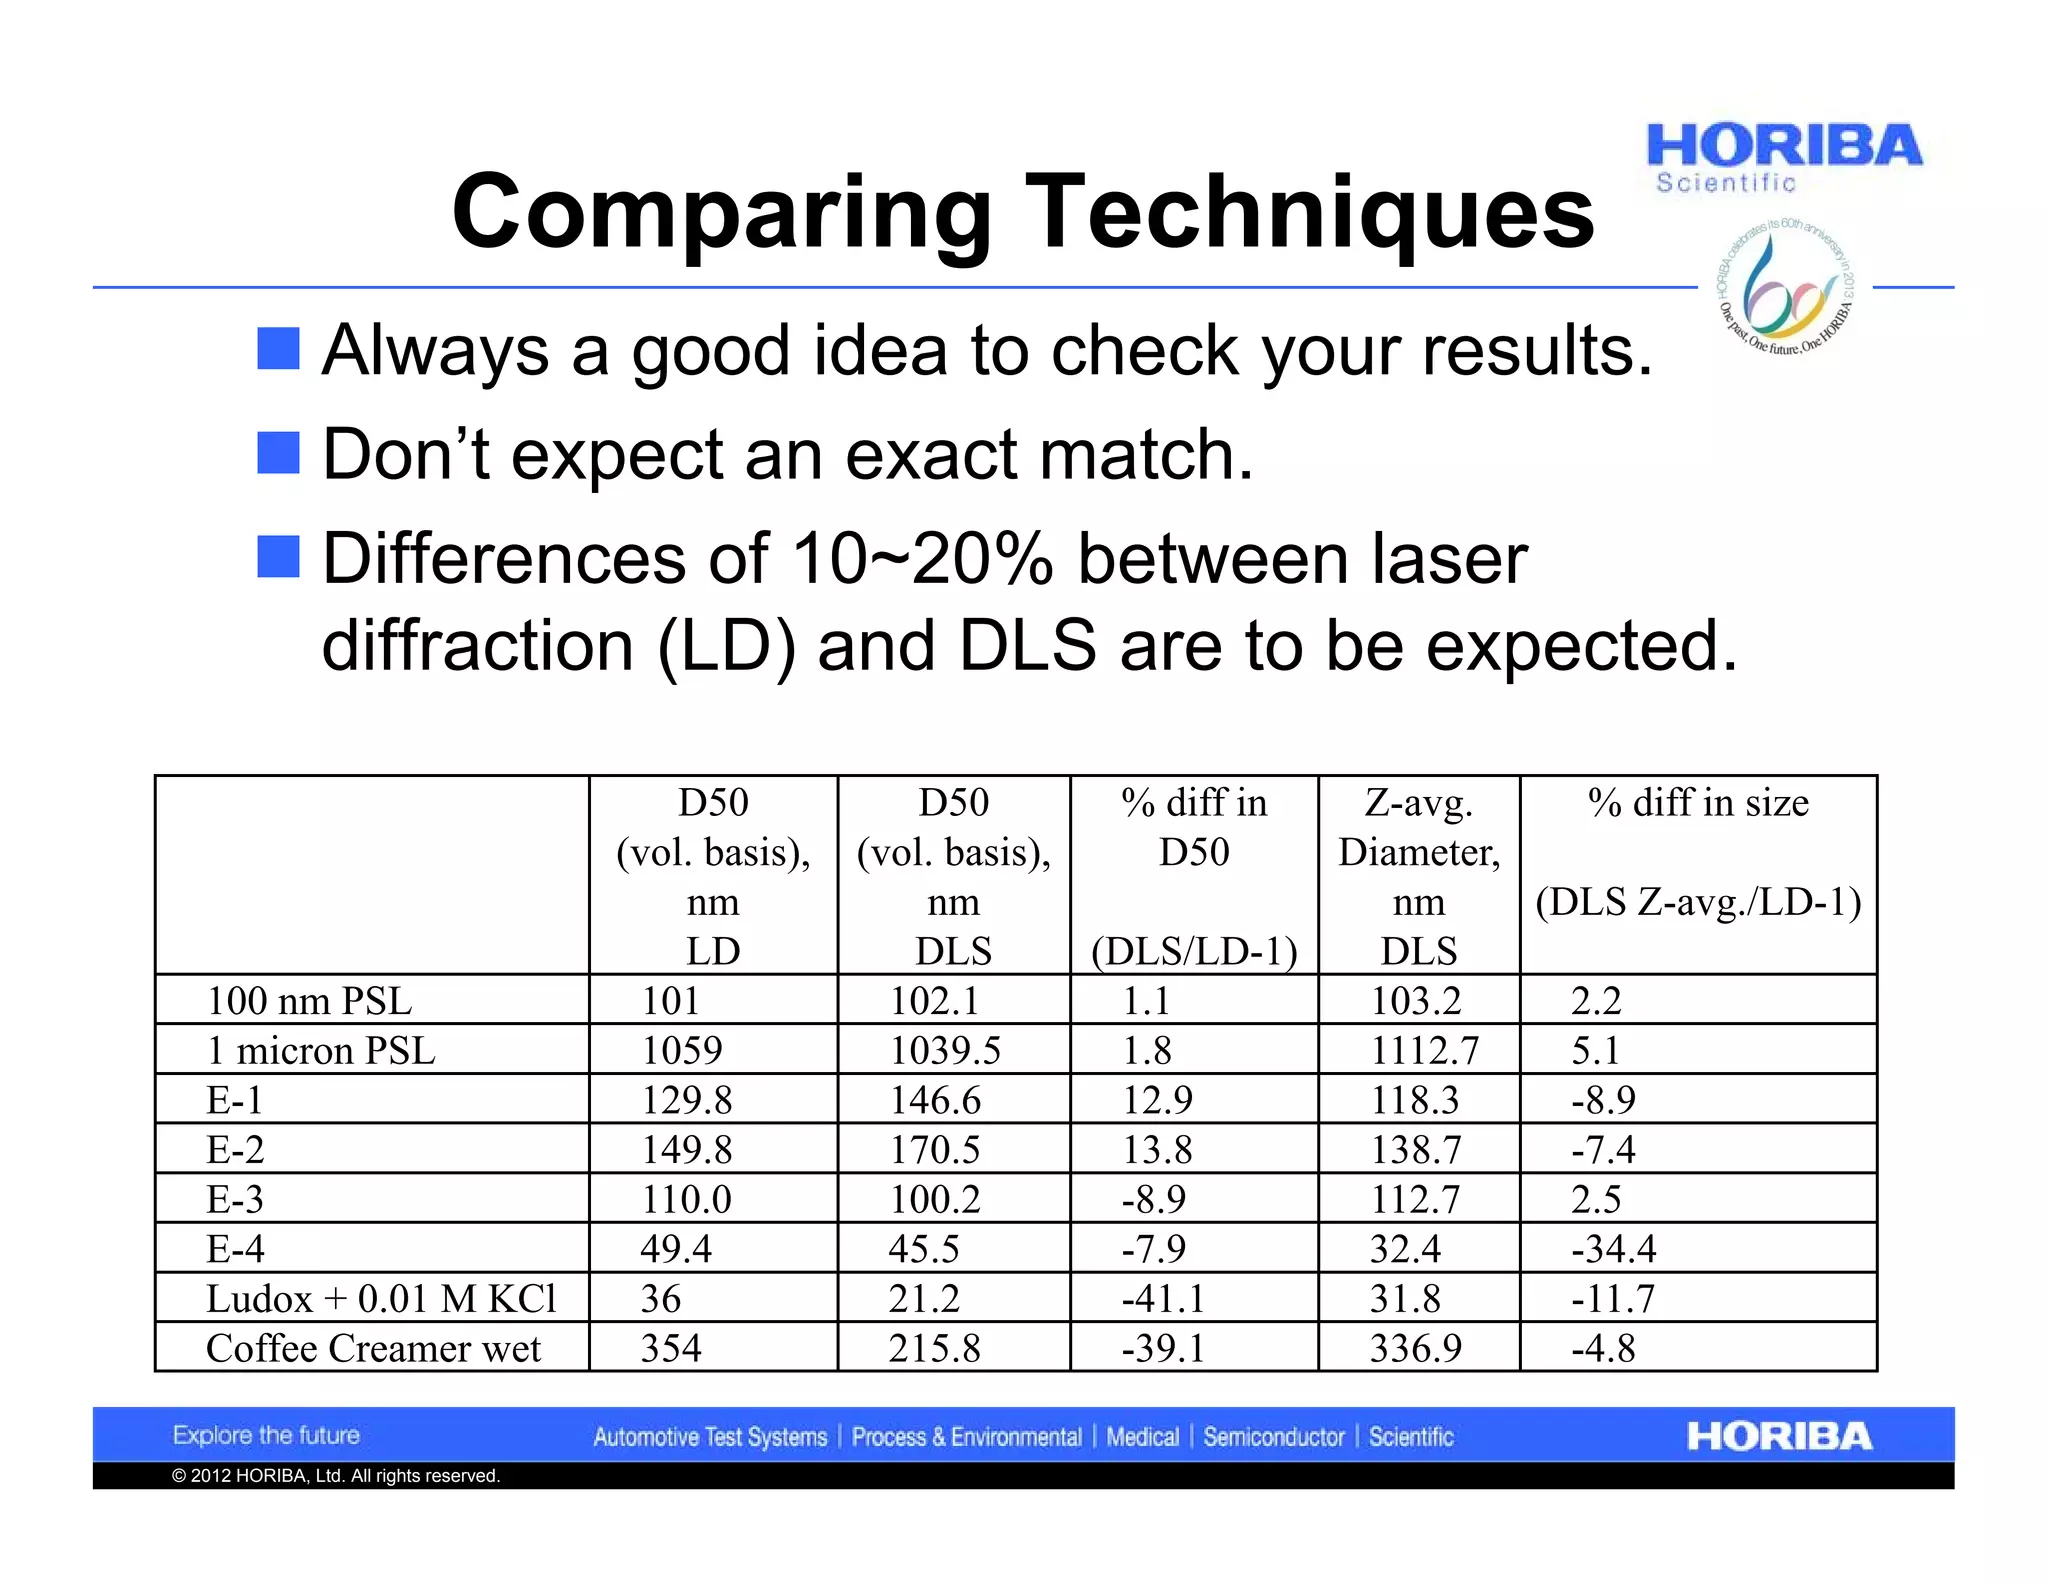
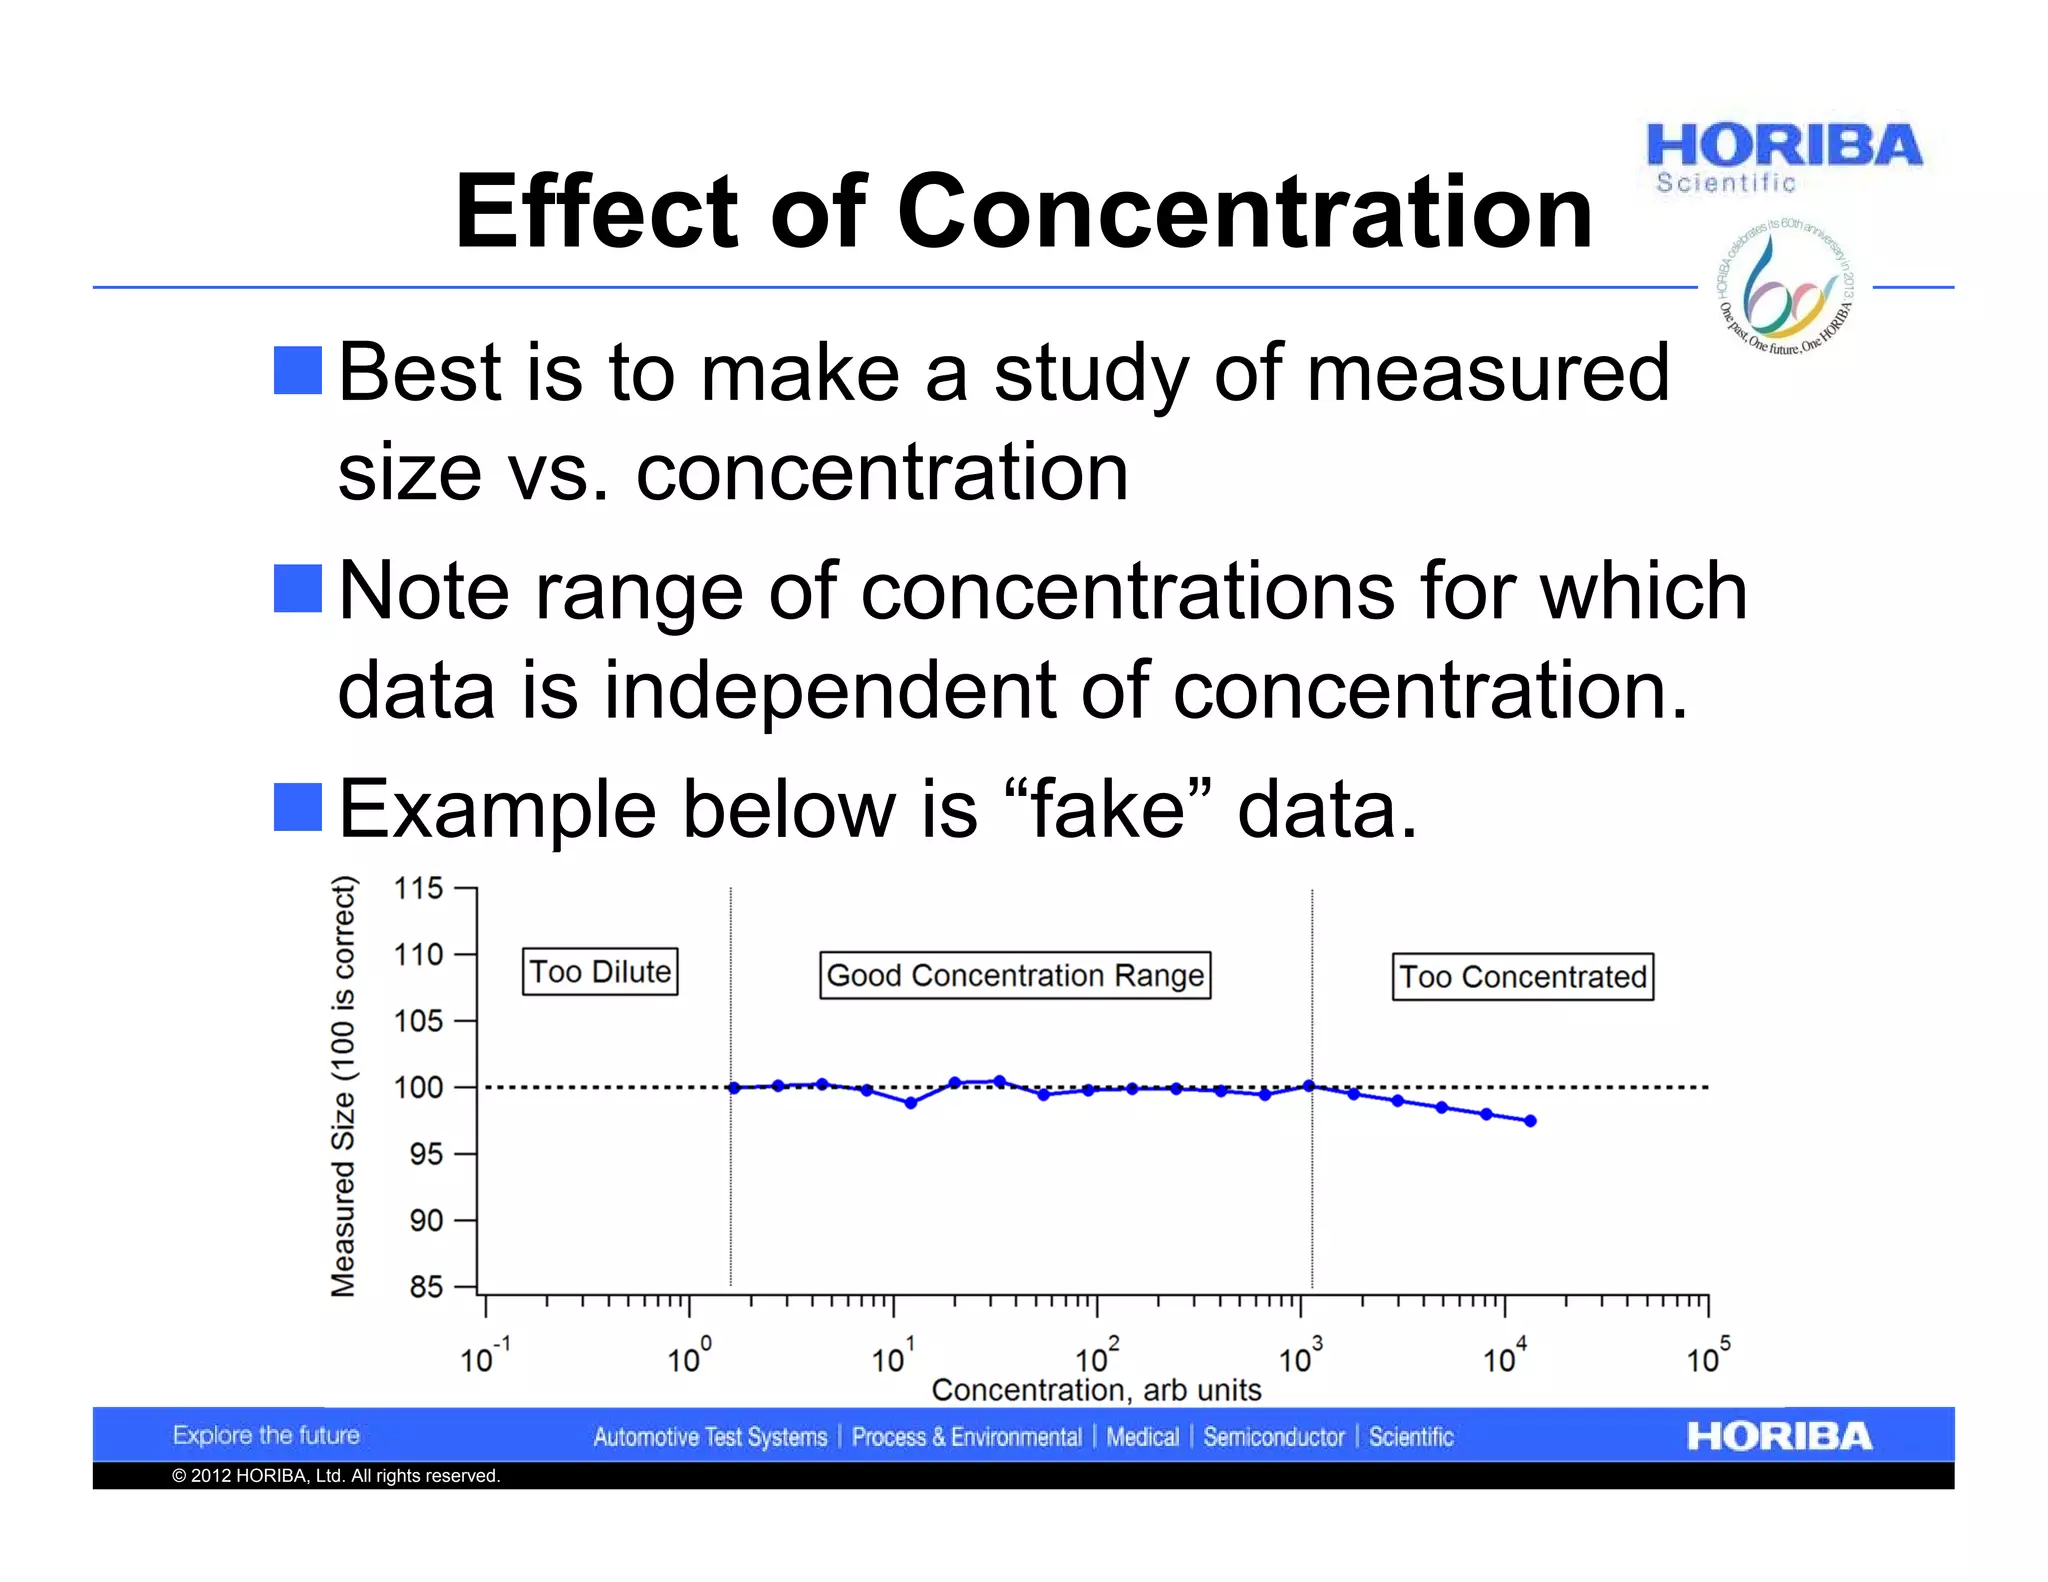
Comparison of DLS and laser diffraction; concentration effects on measured particle size.
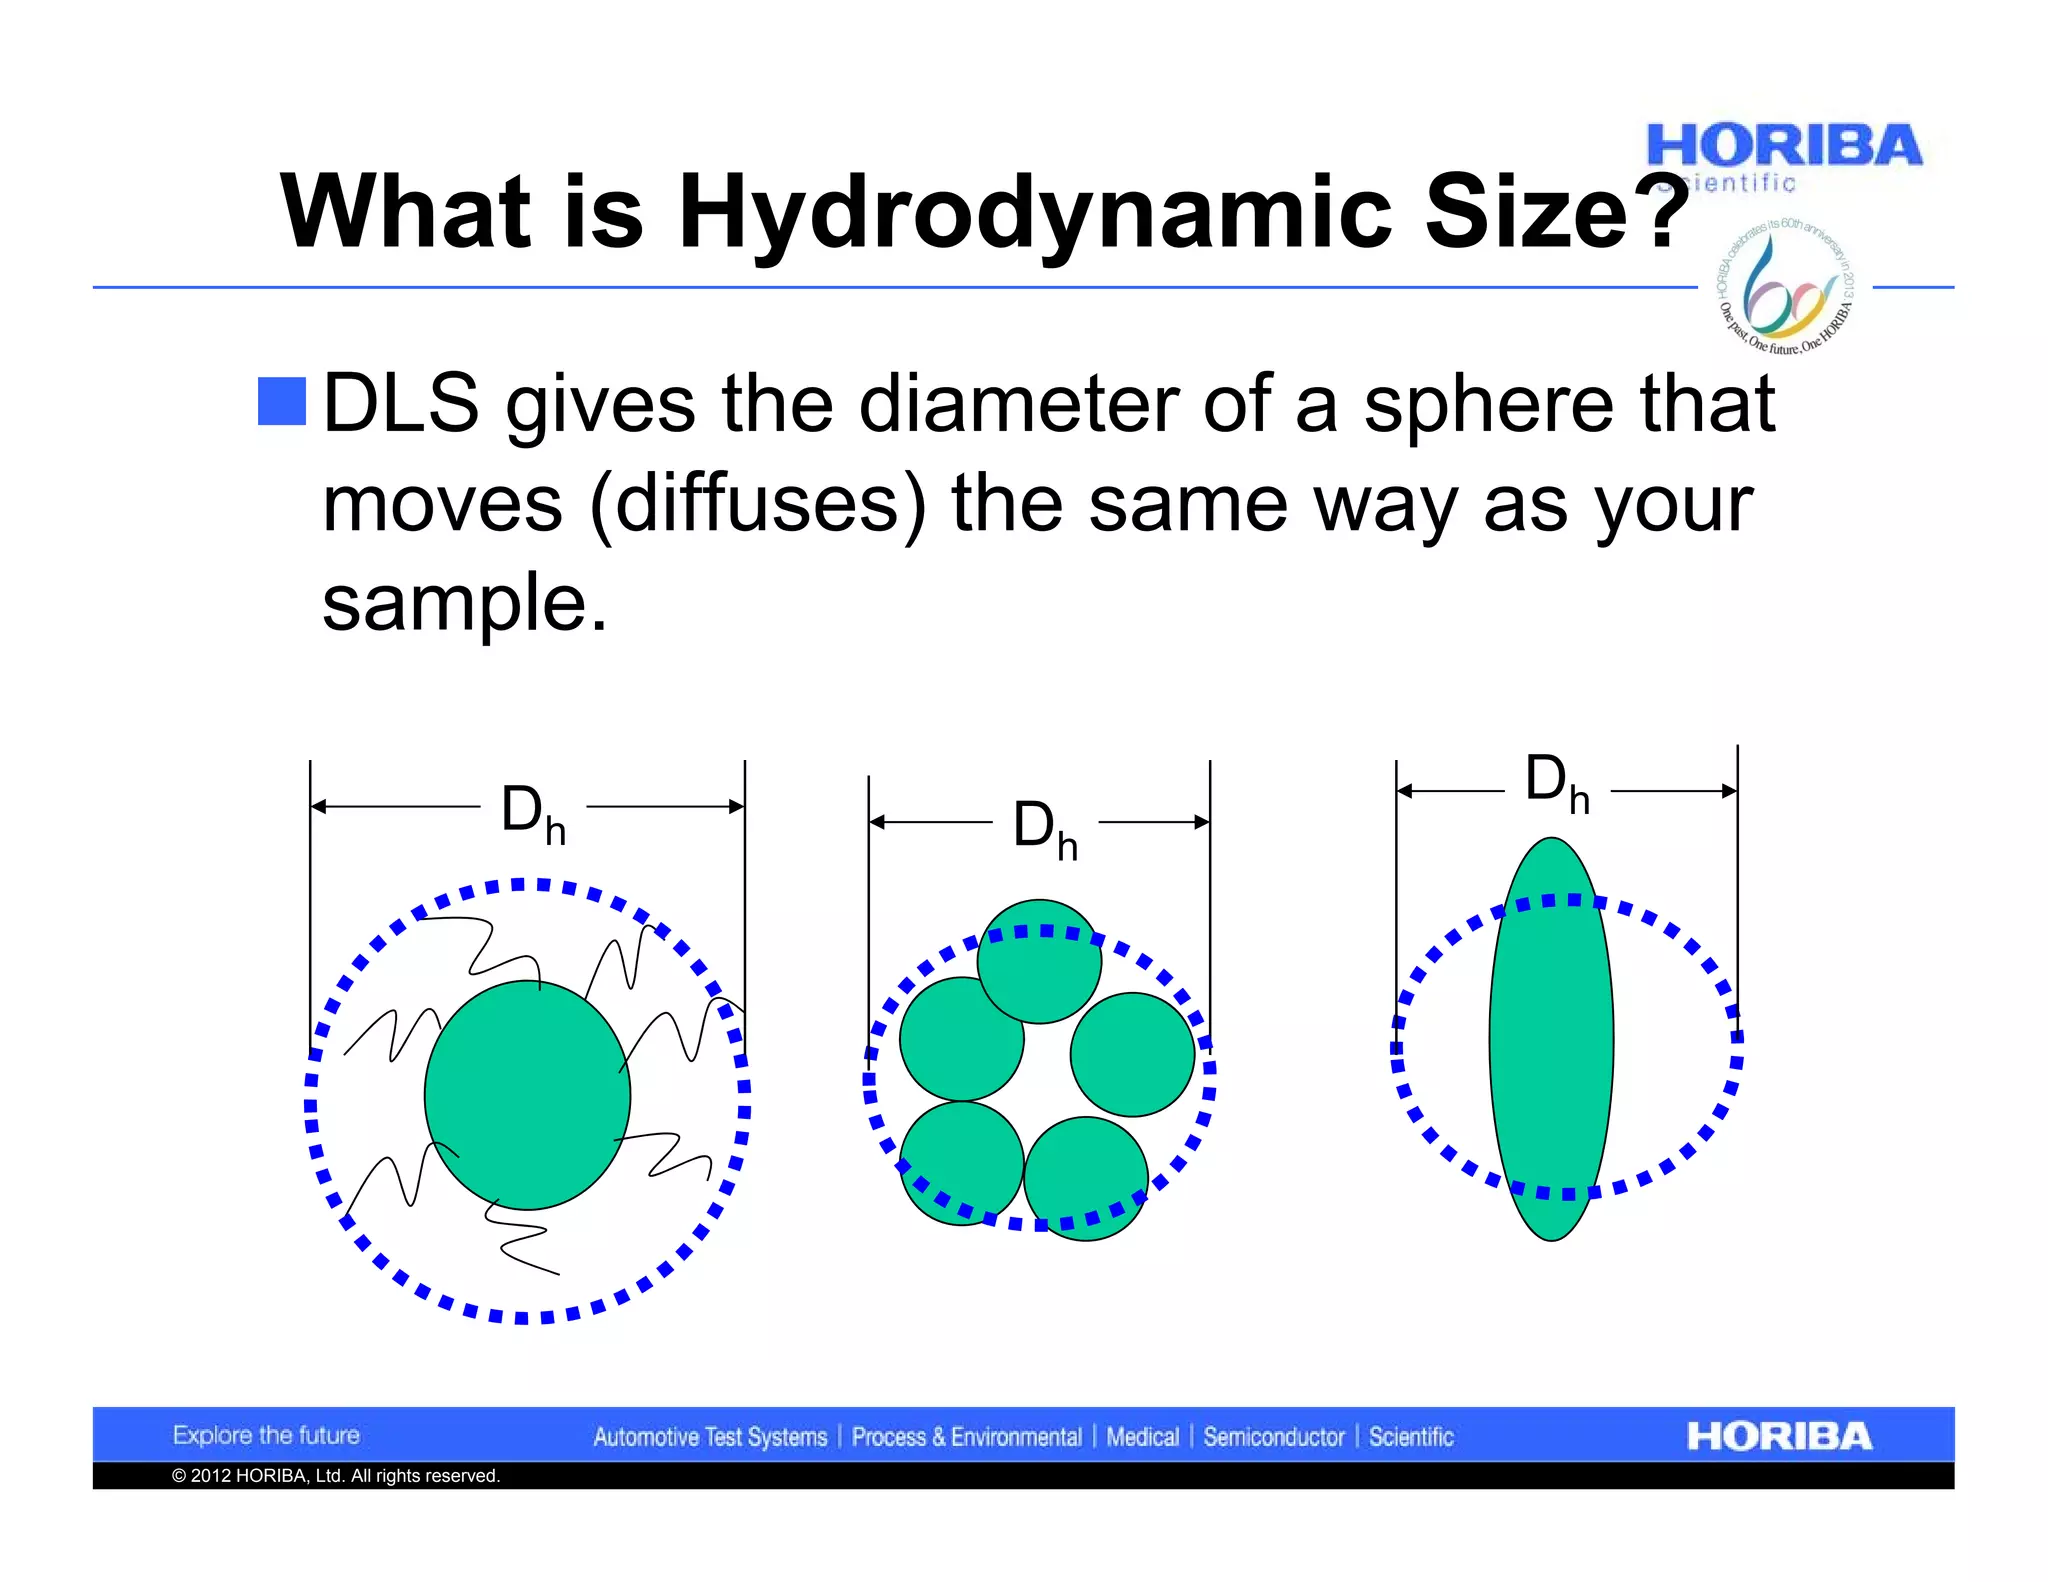
Definition of hydrodynamic size in relation to DLS measurements and advantages of DLS.
Summary of the DLS method and an invitation for further questions.


![Vibe Coding vs. Spec-Driven Development [Free Meetup]](https://cdn.slidesharecdn.com/ss_thumbnails/vibecodingvsspecdrivendevelopment-251209105622-43f455e7-thumbnail.jpg?width=640&height=640&fit=bounds)


