INTRODUCTION
Nanoparticles :
The prefix "nano" comes from the ancient Greek vavoc through the Latin nanus
meaning very small.
Nanoparticles are sub-nanosized colloidal structures composed of synthetic or
semi synthetic polymers.
The drug is dissolved, entrapped, encapsulated or attached to a nanoparticle
matrix.
The term nanoparticle is a combined name for both nanospheres and
nanocapsules.
4.
CHARACTERIZATION OF NANOPARTICLES
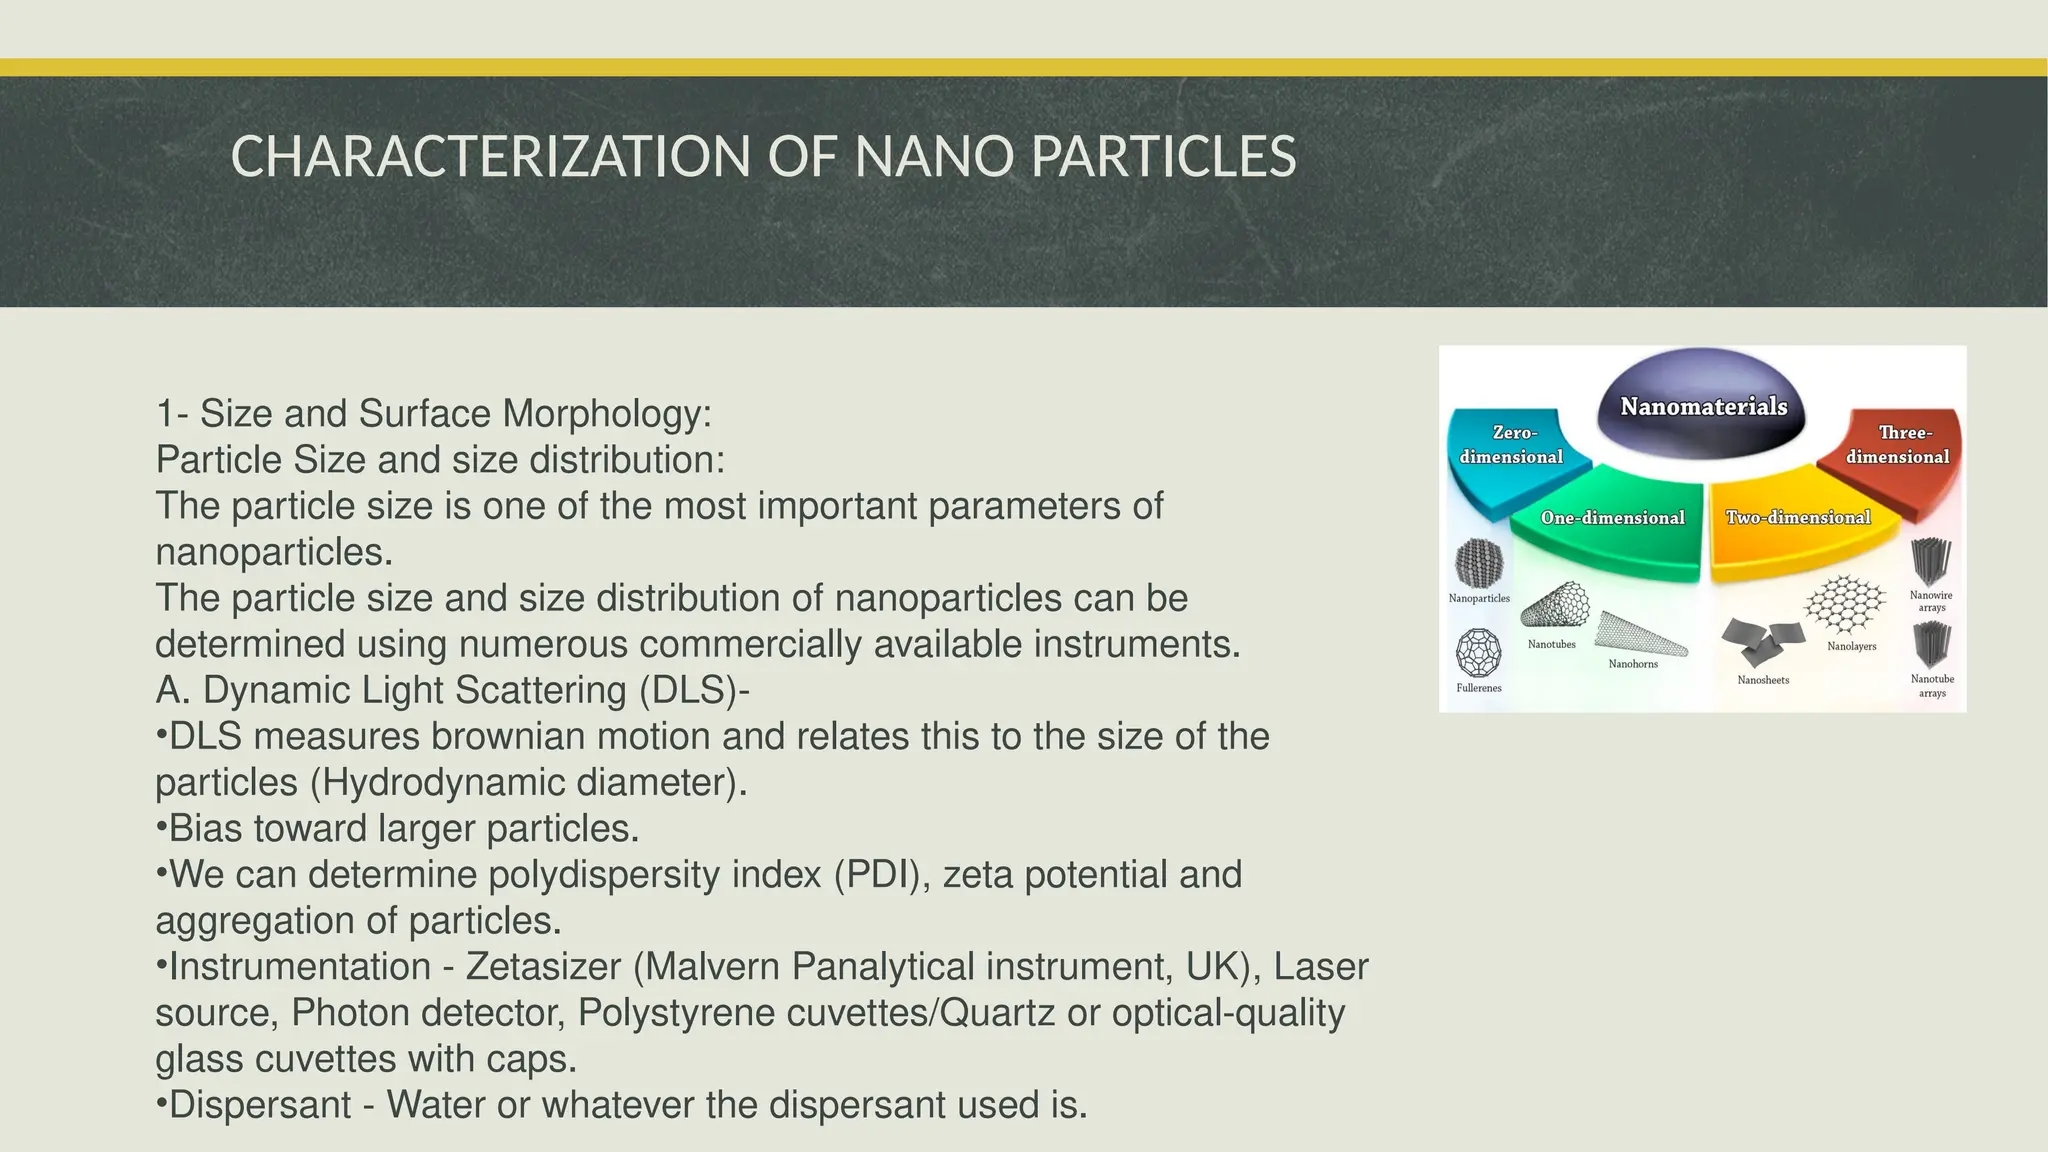
1- Size and Surface Morphology:
Particle Size and size distribution:
The particle size is one of the most important parameters of
nanoparticles.
The particle size and size distribution of nanoparticles can be
determined using numerous commercially available instruments.
A. Dynamic Light Scattering (DLS)-
•DLS measures brownian motion and relates this to the size of the
particles (Hydrodynamic diameter).
•Bias toward larger particles.
•We can determine polydispersity index (PDI), zeta potential and
aggregation of particles.
•Instrumentation - Zetasizer (Malvern Panalytical instrument, UK), Laser
source, Photon detector, Polystyrene cuvettes/Quartz or optical-quality
glass cuvettes with caps.
•Dispersant - Water or whatever the dispersant used is.
5.
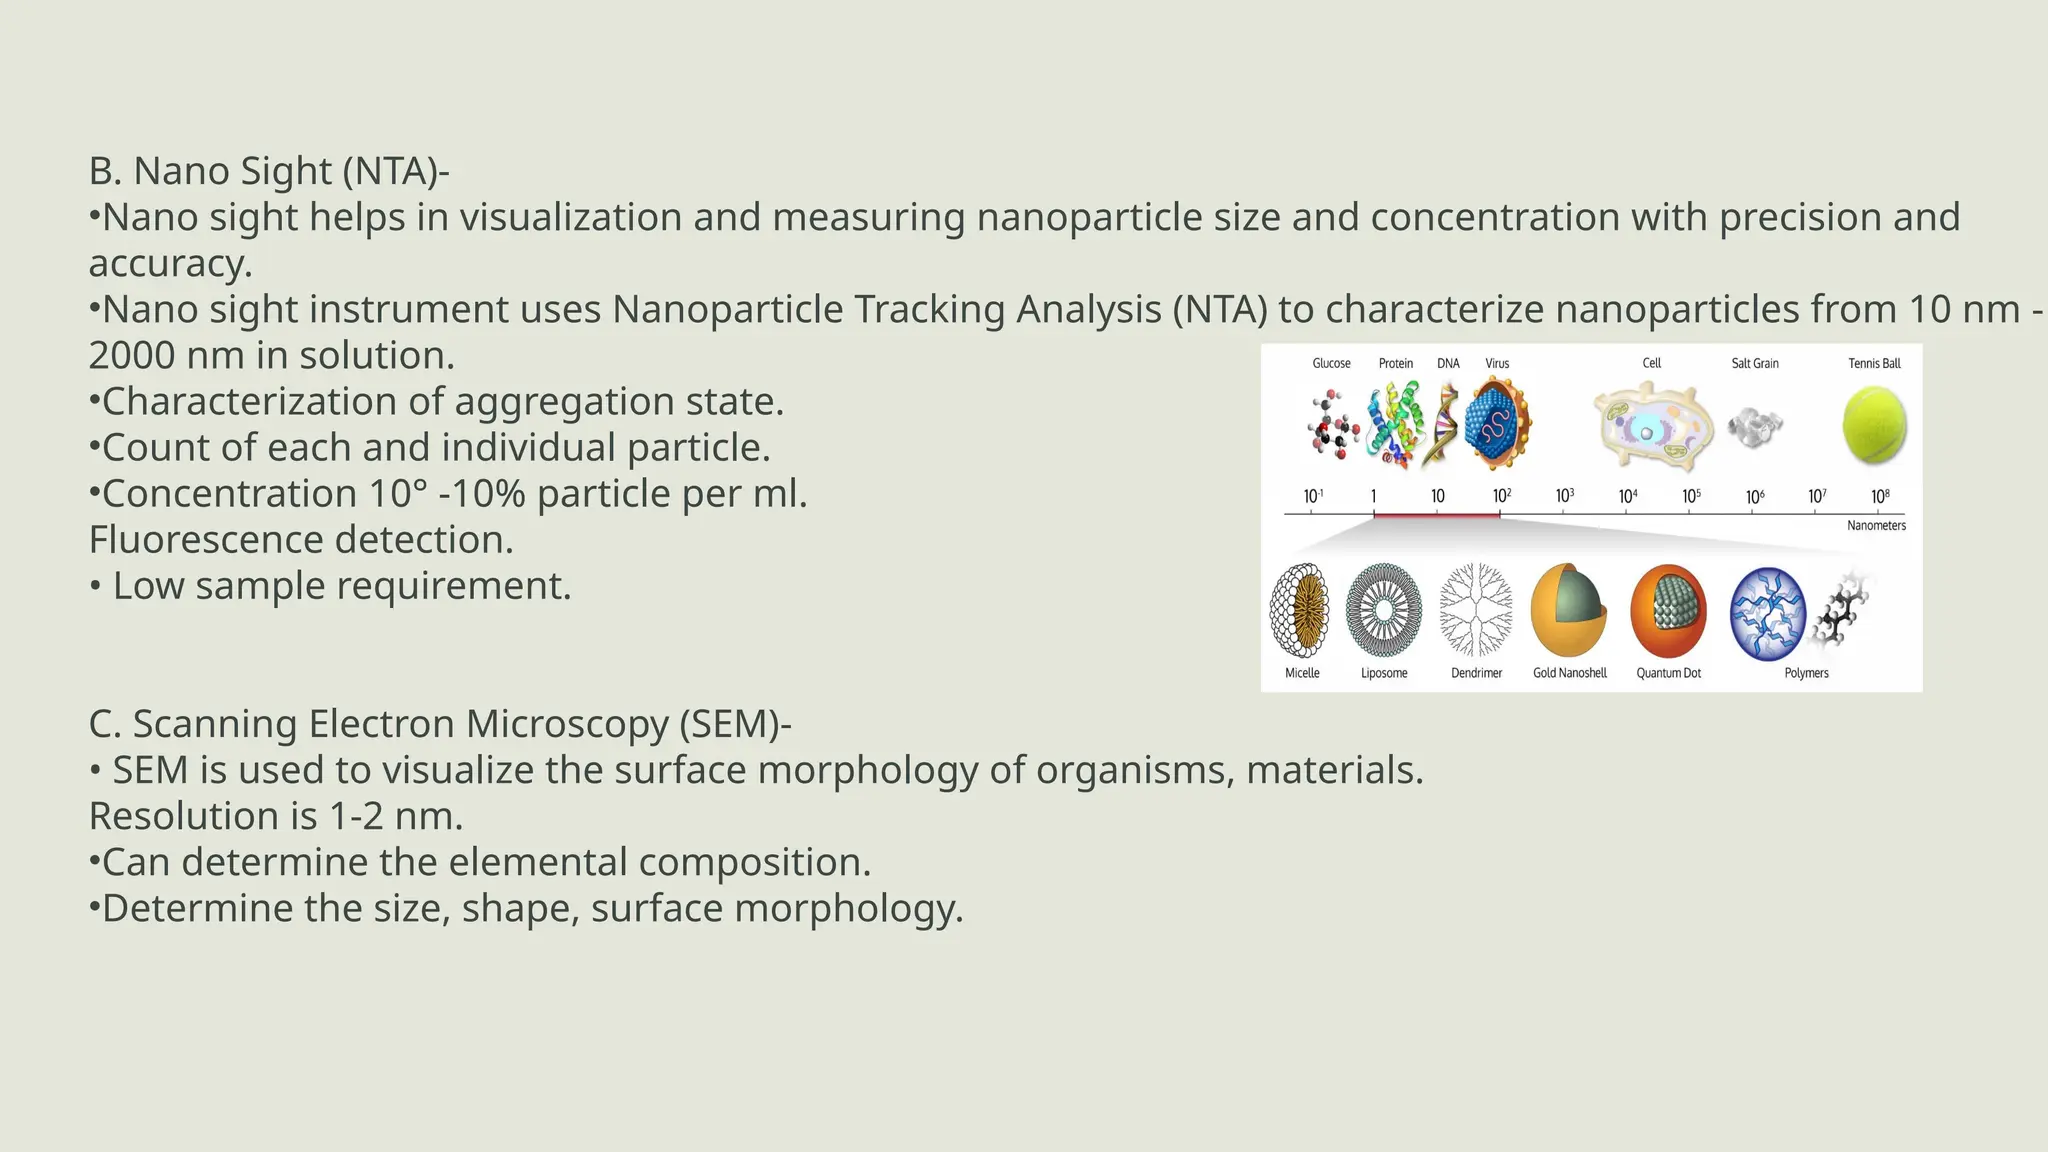
B. Nano Sight(NTA)-
•Nano sight helps in visualization and measuring nanoparticle size and concentration with precision and
accuracy.
•Nano sight instrument uses Nanoparticle Tracking Analysis (NTA) to characterize nanoparticles from 10 nm -
2000 nm in solution.
•Characterization of aggregation state.
•Count of each and individual particle.
•Concentration 10° -10% particle per ml.
Fluorescence detection.
• Low sample requirement.
C. Scanning Electron Microscopy (SEM)-
• SEM is used to visualize the surface morphology of organisms, materials.
Resolution is 1-2 nm.
•Can determine the elemental composition.
•Determine the size, shape, surface morphology.
6.
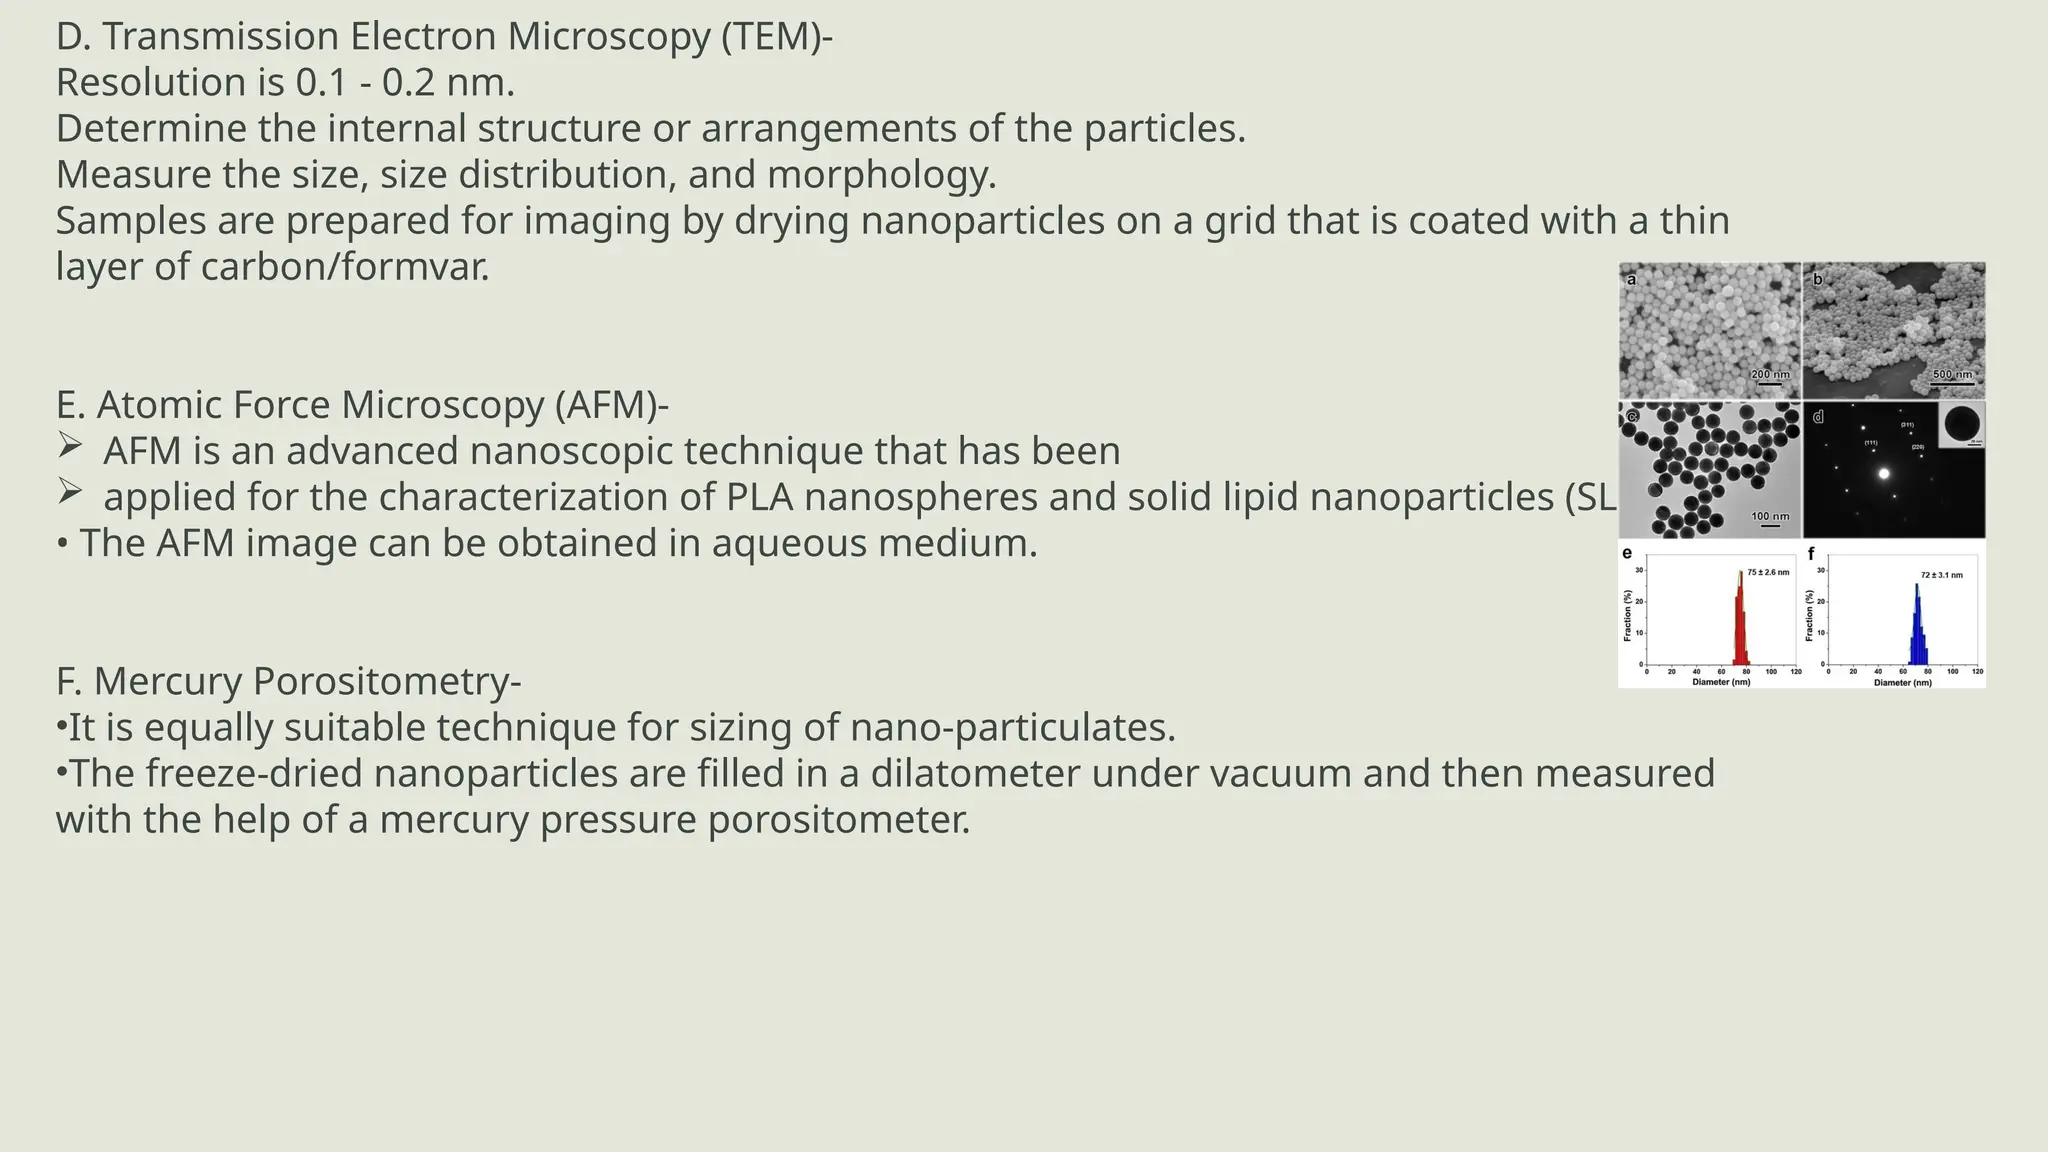
D. Transmission ElectronMicroscopy (TEM)-
Resolution is 0.1 - 0.2 nm.
Determine the internal structure or arrangements of the particles.
Measure the size, size distribution, and morphology.
Samples are prepared for imaging by drying nanoparticles on a grid that is coated with a thin
layer of carbon/formvar.
E. Atomic Force Microscopy (AFM)-
AFM is an advanced nanoscopic technique that has been
applied for the characterization of PLA nanospheres and solid lipid nanoparticles (SLN).
• The AFM image can be obtained in aqueous medium.
F. Mercury Porositometry-
•It is equally suitable technique for sizing of nano-particulates.
•The freeze-dried nanoparticles are filled in a dilatometer under vacuum and then measured
with the help of a mercury pressure porositometer.
7.
KEY PARAMETERS ANDOUTPUT:
PARTICLE SHAPE
A. Scanning Electron Microscopy (SEM)-
> Resolution is 1-2 nm.
• SEM is used to visualize the surface morphology of organisms, cells and materials.
> Determine the size, shape, surface morphology.
B. Transmission Electron Microscopy (TEM)-
•Resolution is 0.1 - 0.2 nm.
•Determine the shape of the particles.
Determine the internal structure or arrangements of the particles.
•Measure the size, size distribution, and morphology.
Crystallinity :
A. X-Ray Diffraction (XRD)-
• X-ray diffraction (XRD) is a powerful
method for the study of
nanomaterials (materials
with structural
features of at least one
dimension in the range of 1-100 nm).
•XRD is also used to determine the thickness of thin films, as well as the atomic arrangements in amorphous m
such as polymers.
•It is a powerful and rapid technique for identification of an unknown material
8.
ADVANTAGES
Differential Scanning Calorimeter(DSC)-
•DSC is one of the most frequently used technique in the field of thermal characterization of solid and liquid
•DSC measurement information-
1.Polymorphism
2.Degree of crystallinity
3.urity determination
4.Decomposition bchaviour
5.Melting/Crystallization behaviour
2- SPECIFIC SURFACE AREA
Brunauer Emmett Teller (BET)-
•Gas adsorption or Nitrogen adsorption.
•Measure the specific surface area of nanoparticles including pore size distribution.
•Determine porosity.
3- Surface Charge and Electrophoratio
Mobility
• The nature and intensity of the surface charge of nanoparticles is very important
it determines their interaction with the biological environment.
.The surface charge of colloidal particles in general and nanoparticles in particular can be determined by me
electric field.
. Laser light Scattering technique, i.e. Laser Doppler Anemometry or Velocimetry used for velocity determin
.The colloidal stability is analyzed through
potential nanoparticles. This potential is an indirect measure of the surface
charge.
9.
4- Surface Hydrophobicity
•Thesurface hydrophobicity of nanoparticles has an important influence on the interaction of colloidal particle
with the biological environment.
•Surface hydrophobicity can be determined by several techniques such as-
i)Hydrophobic interaction chromatography,
ii)Biphasic partitioning,
iii)Adsorption of probes,
iv)Contact angle measurements etc.
• X - ray photon correlation spectroscopy permits the identification of specific chemical groups on the surface o
nanoparticles.
6- Molecular weight measurement of Nanoparticles
Molecular weight of the polymer and its distribution in the matrix can be evaluated by gel permeation
chromatography (GPC) using a refractive index detector.
7- Drug Entrapment efficiency
• After centrifugation amount of drug present in supernatant (w) determined by UV spectrophotometery.
After that standard calibration curve plotted.
•Then amount of drug present in supernatant subtracted from the total amount used in the preparation of
nanoparticles (W).
•(W-w) is the amount of drug entrapped. % drug entrapment calculated by formula-
10.
LIMITATIONS
8- Kinetic Study
Forestimation of the kinetic and mechanism of drug release, the result of in vitro drug release study of nan
with various kinetic equation like-
i. zero order (cumulative % release vs. time) ii. first order (log% drug remaining vs time)
iii. Higuchi's model (cumulative % drug release vs. square root of time).
9- Stability of Nanoparticles
Stability studies of prepared nanoparticles determined by storing optimized formulation at 4°C #1°C and 30
chamber for 90 days.
The samples were analyzed after a time period like at 0, 1, 2, and 3 months for their drug content, drug rele
changes in their physical appearance (ICH QIA (R2).
10- Drug-Excipient compatibility studies
The drug- excipient compatibility studies was performed by using FT-IR spectrophotometer.
The FT-IR spectra of drug, polymer and formulations were analysed separately and then correlated for incom
11- In-Vitro release studies
Release from nano-sized dosage forms can be assessed using one of the following methods-
•USP I (basket type)
•USP II (paddle type)
•USP IV (flow through cell)
•Franz diffusion cell
•Dialysis method
(1) New Methods -
i.Electrochemical methods - Repetitive square-wave voltammetric technique, differential pulse polarograph
11.
Add a SlideTitle - 5
12- Lamellarity
• Lamellarity of vesicle i.e. numbers of bilayers present in liposomes is determined using Freeze-Fracture
electron microscopy and P-31 nuclear magnetic resonance analysis.
13- Phase Behaviour
•Liposomes and lipid bilayers exhibit various phase transition that are studied for their role in drug release.
•Phase behaviour of liposomal membrane determines properties such as permeability, fusion, aggregation an
protein binding.
•Evaluated using Freeze-Fracture electron microscopy .
•They are more comprehensively verified by DSC.
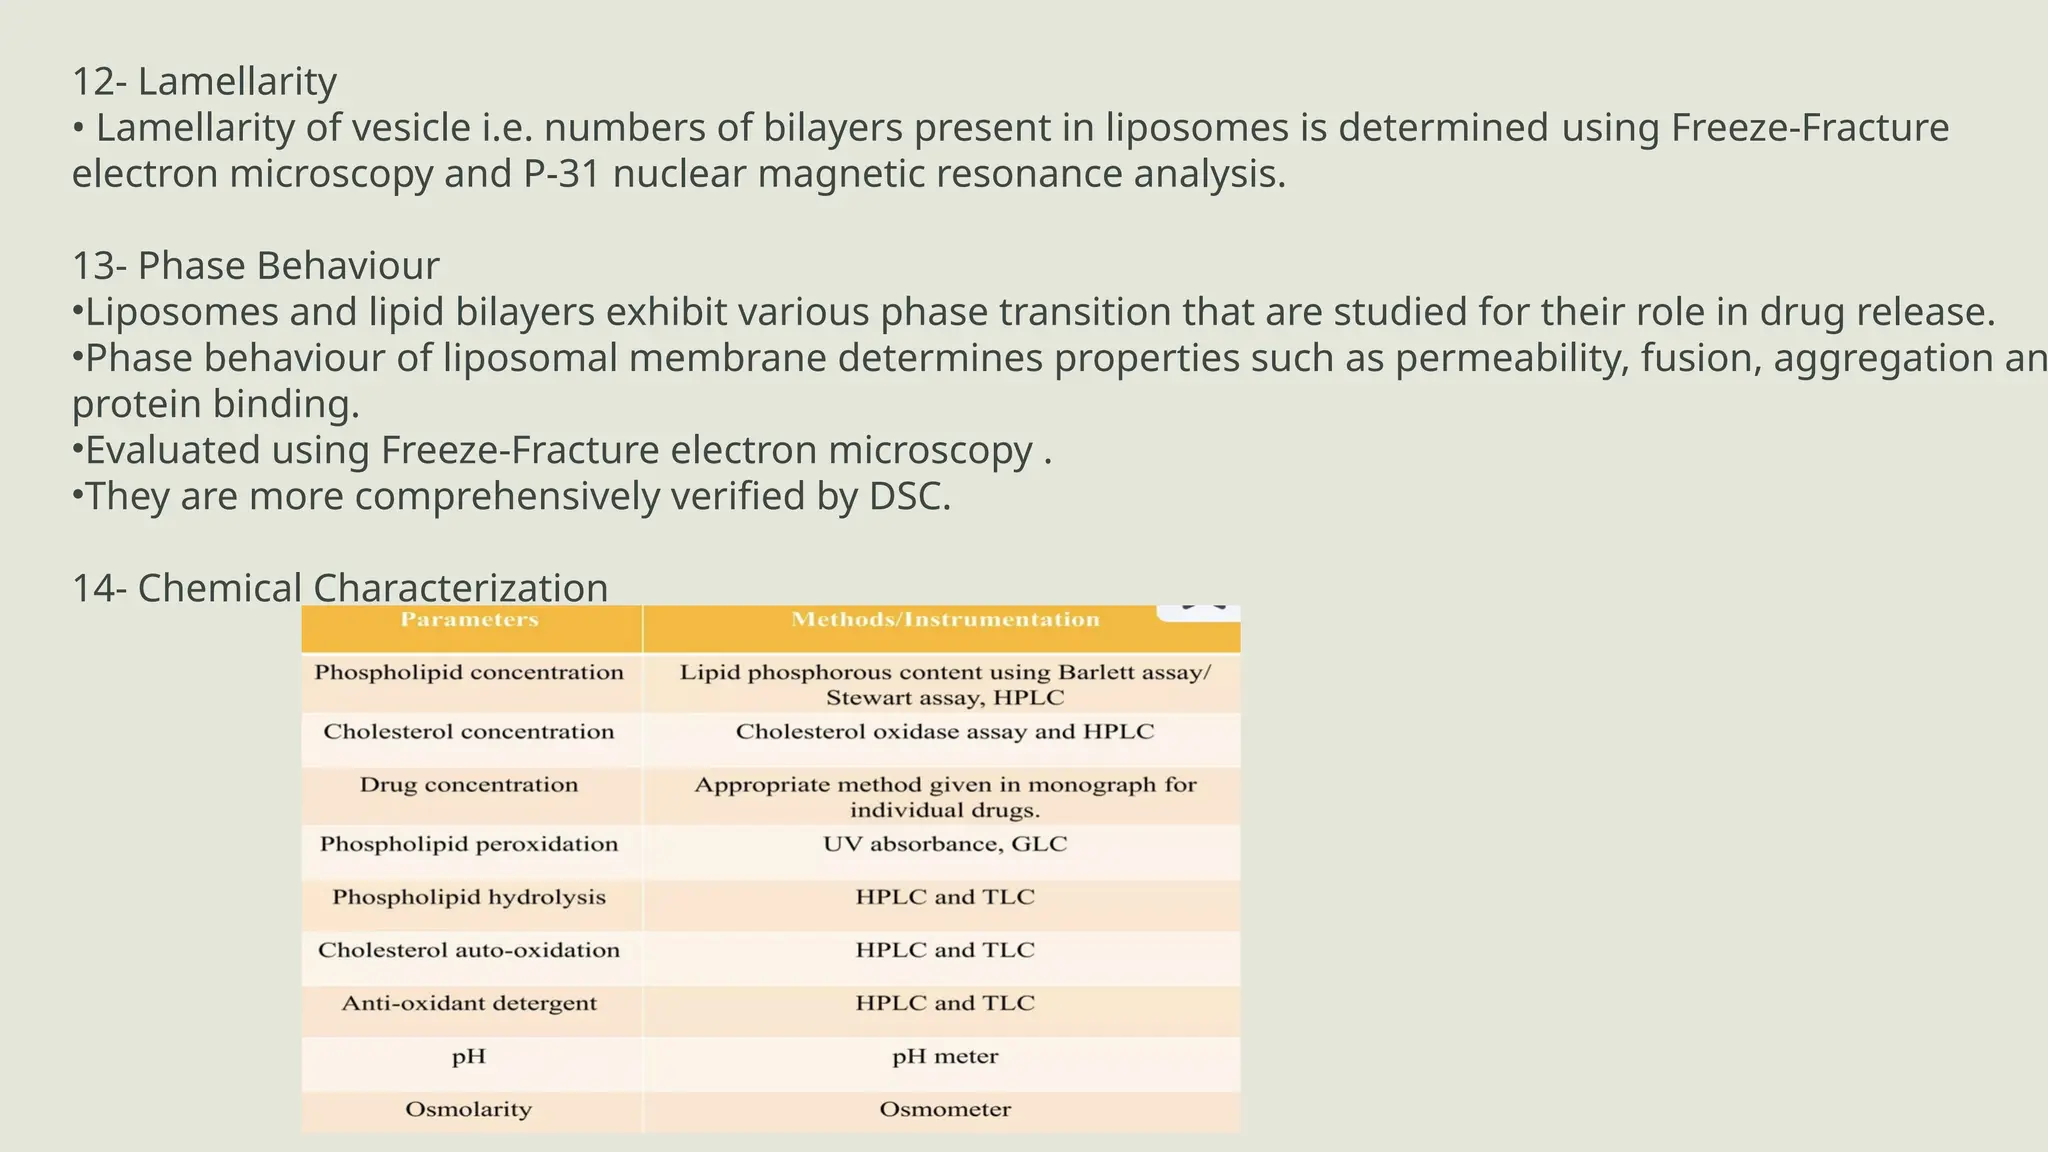
14- Chemical Characterization
12.
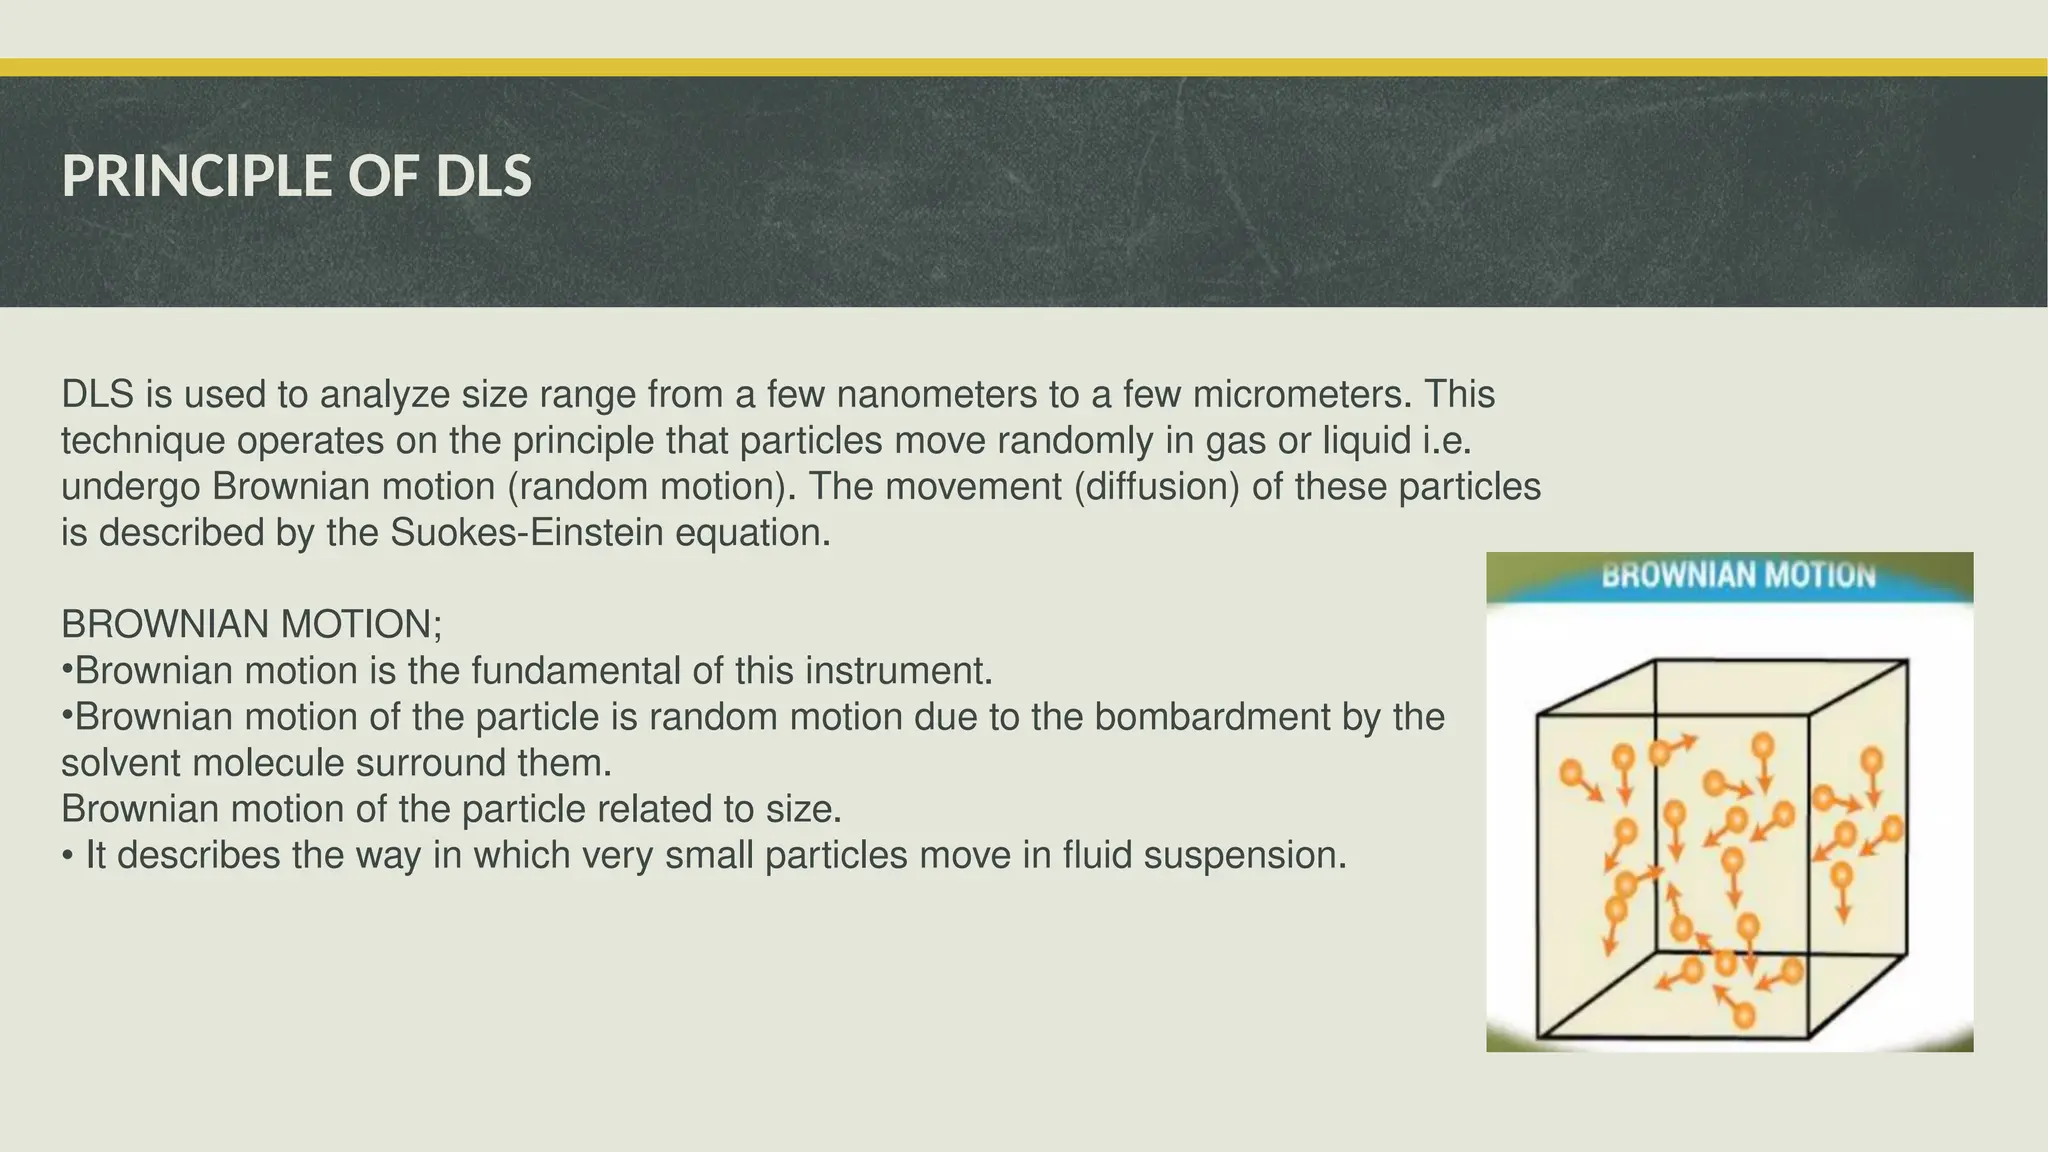
PRINCIPLE OF DLS
DLSis used to analyze size range from a few nanometers to a few micrometers. This
technique operates on the principle that particles move randomly in gas or liquid i.e.
undergo Brownian motion (random motion). The movement (diffusion) of these particles
is described by the Suokes-Einstein equation.
BROWNIAN MOTION;
•Brownian motion is the fundamental of this instrument.
•Brownian motion of the particle is random motion due to the bombardment by the
solvent molecule surround them.
Brownian motion of the particle related to size.
• It describes the way in which very small particles move in fluid suspension.
13.
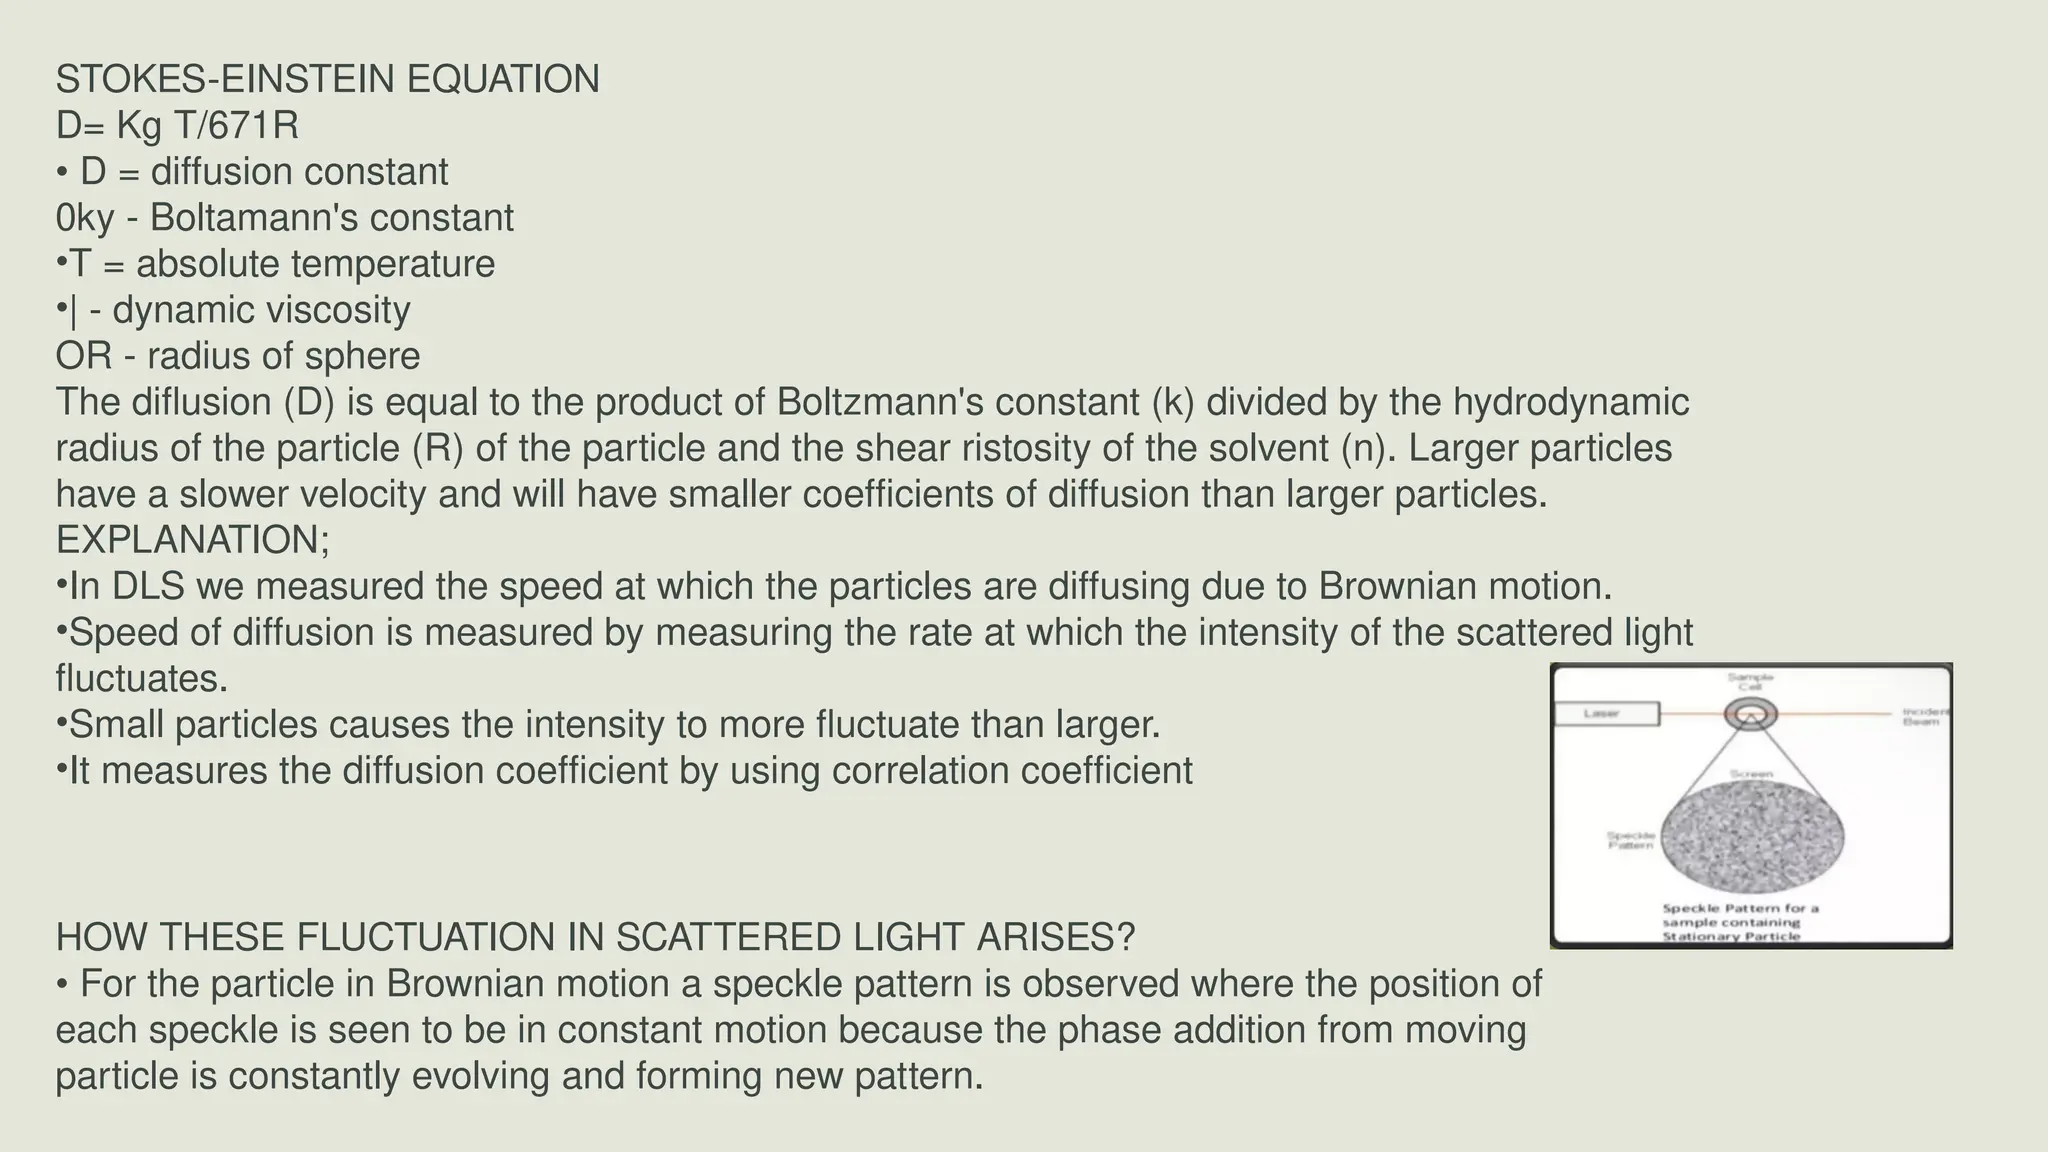
STOKES-EINSTEIN EQUATION
D= KgT/671R
• D = diffusion constant
0ky - Boltamann's constant
•T = absolute temperature
•| - dynamic viscosity
OR - radius of sphere
The diflusion (D) is equal to the product of Boltzmann's constant (k) divided by the hydrodynamic
radius of the particle (R) of the particle and the shear ristosity of the solvent (n). Larger particles
have a slower velocity and will have smaller coefficients of diffusion than larger particles.
EXPLANATION;
•In DLS we measured the speed at which the particles are diffusing due to Brownian motion.
•Speed of diffusion is measured by measuring the rate at which the intensity of the scattered light
fluctuates.
•Small particles causes the intensity to more fluctuate than larger.
•It measures the diffusion coefficient by using correlation coefficient
HOW THESE FLUCTUATION IN SCATTERED LIGHT ARISES?
• For the particle in Brownian motion a speckle pattern is observed where the position of
each speckle is seen to be in constant motion because the phase addition from moving
particle is constantly evolving and forming new pattern.
14.
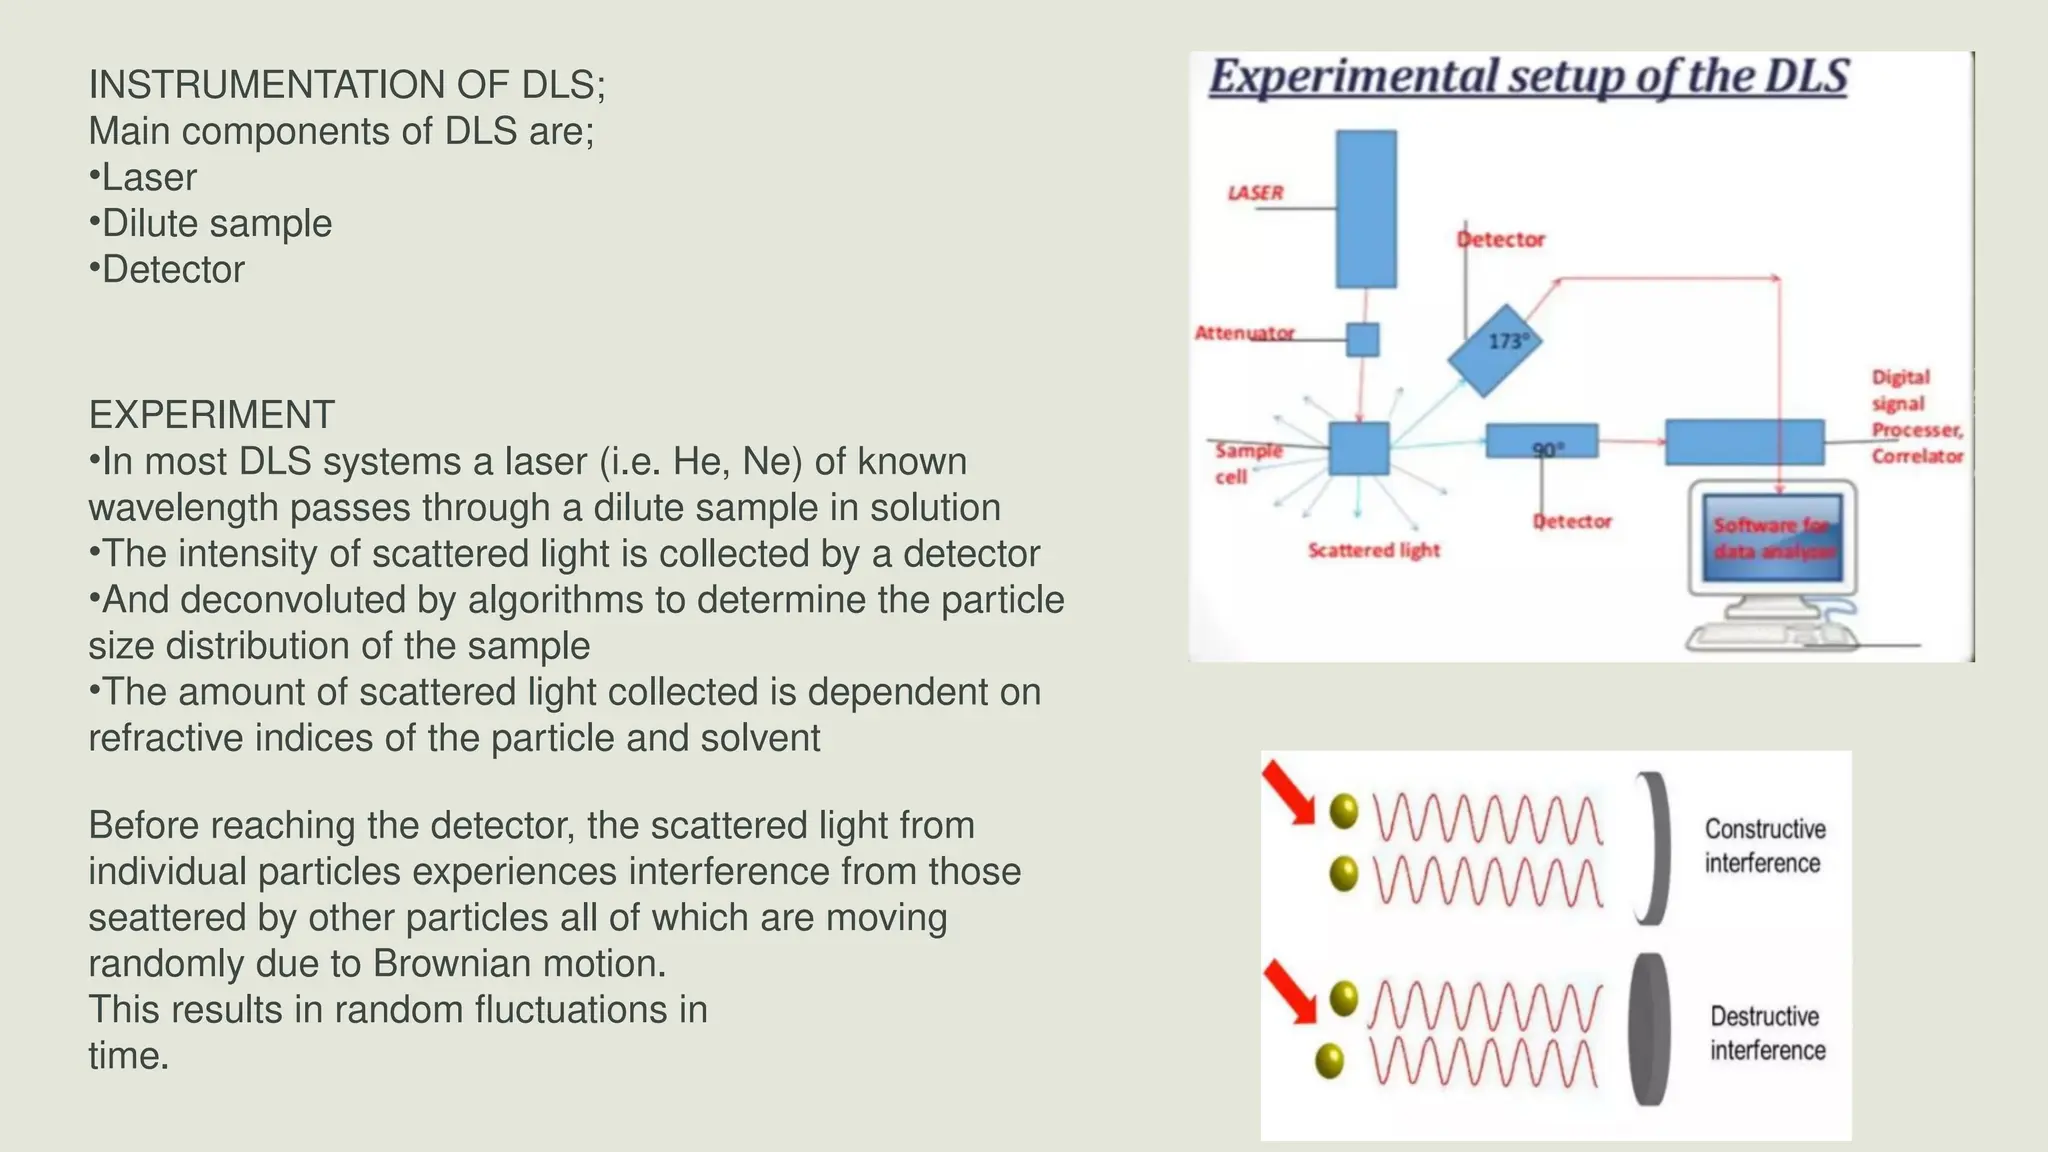
INSTRUMENTATION OF DLS;
Maincomponents of DLS are;
•Laser
•Dilute sample
•Detector
EXPERIMENT
•In most DLS systems a laser (i.e. He, Ne) of known
wavelength passes through a dilute sample in solution
•The intensity of scattered light is collected by a detector
•And deconvoluted by algorithms to determine the particle
size distribution of the sample
•The amount of scattered light collected is dependent on
refractive indices of the particle and solvent
Before reaching the detector, the scattered light from
individual particles experiences interference from those
seattered by other particles all of which are moving
randomly due to Brownian motion.
This results in random fluctuations in
time.
15.
APPLICATIONS
• CHARACTERIZE SIZEOF VARIOUS PARTICLES:
DLS is used to characterize size of various particles including proteins, polymers, micelles, vesicles,
carbohydrates, nanoparticles, biological cells and gels.
• AGGREGATION OF PARTICLES:
This technique is best for detecting the aggregation of particles.
• DETERMINATION OF EFFECTIVE DIAMETER;
If the system is not disperse in size, the mean effective diameter of the particles can be determined. This
measurement depends on the size of the particle core, the size of surface structures, particle concentration, and
the type of ions in the medium.
• DETERMINATION OF DIFFUSION COEFFICIENT:
DLS essentially measures fluctuations in scattered light intensity due to diffusing particles, the diffusion coefficient
of the particles can be determined.
DISPLAYS PARTICLE POPULATION;
DLS software of commercial instruments typically displays the particle population at
different diameters. If the system is monodisperse, there should only be one population,
whereas a polydisperse system would show multiple particle populations.
*ANALYSIS OF STABILITY;
Stability studies can be done conveniently using DLS. In some DLS, machines, stability
depending on temperature can be analyzed by controlling the temperature in situ. We can
study stability of Naño particles as function of time.
16.
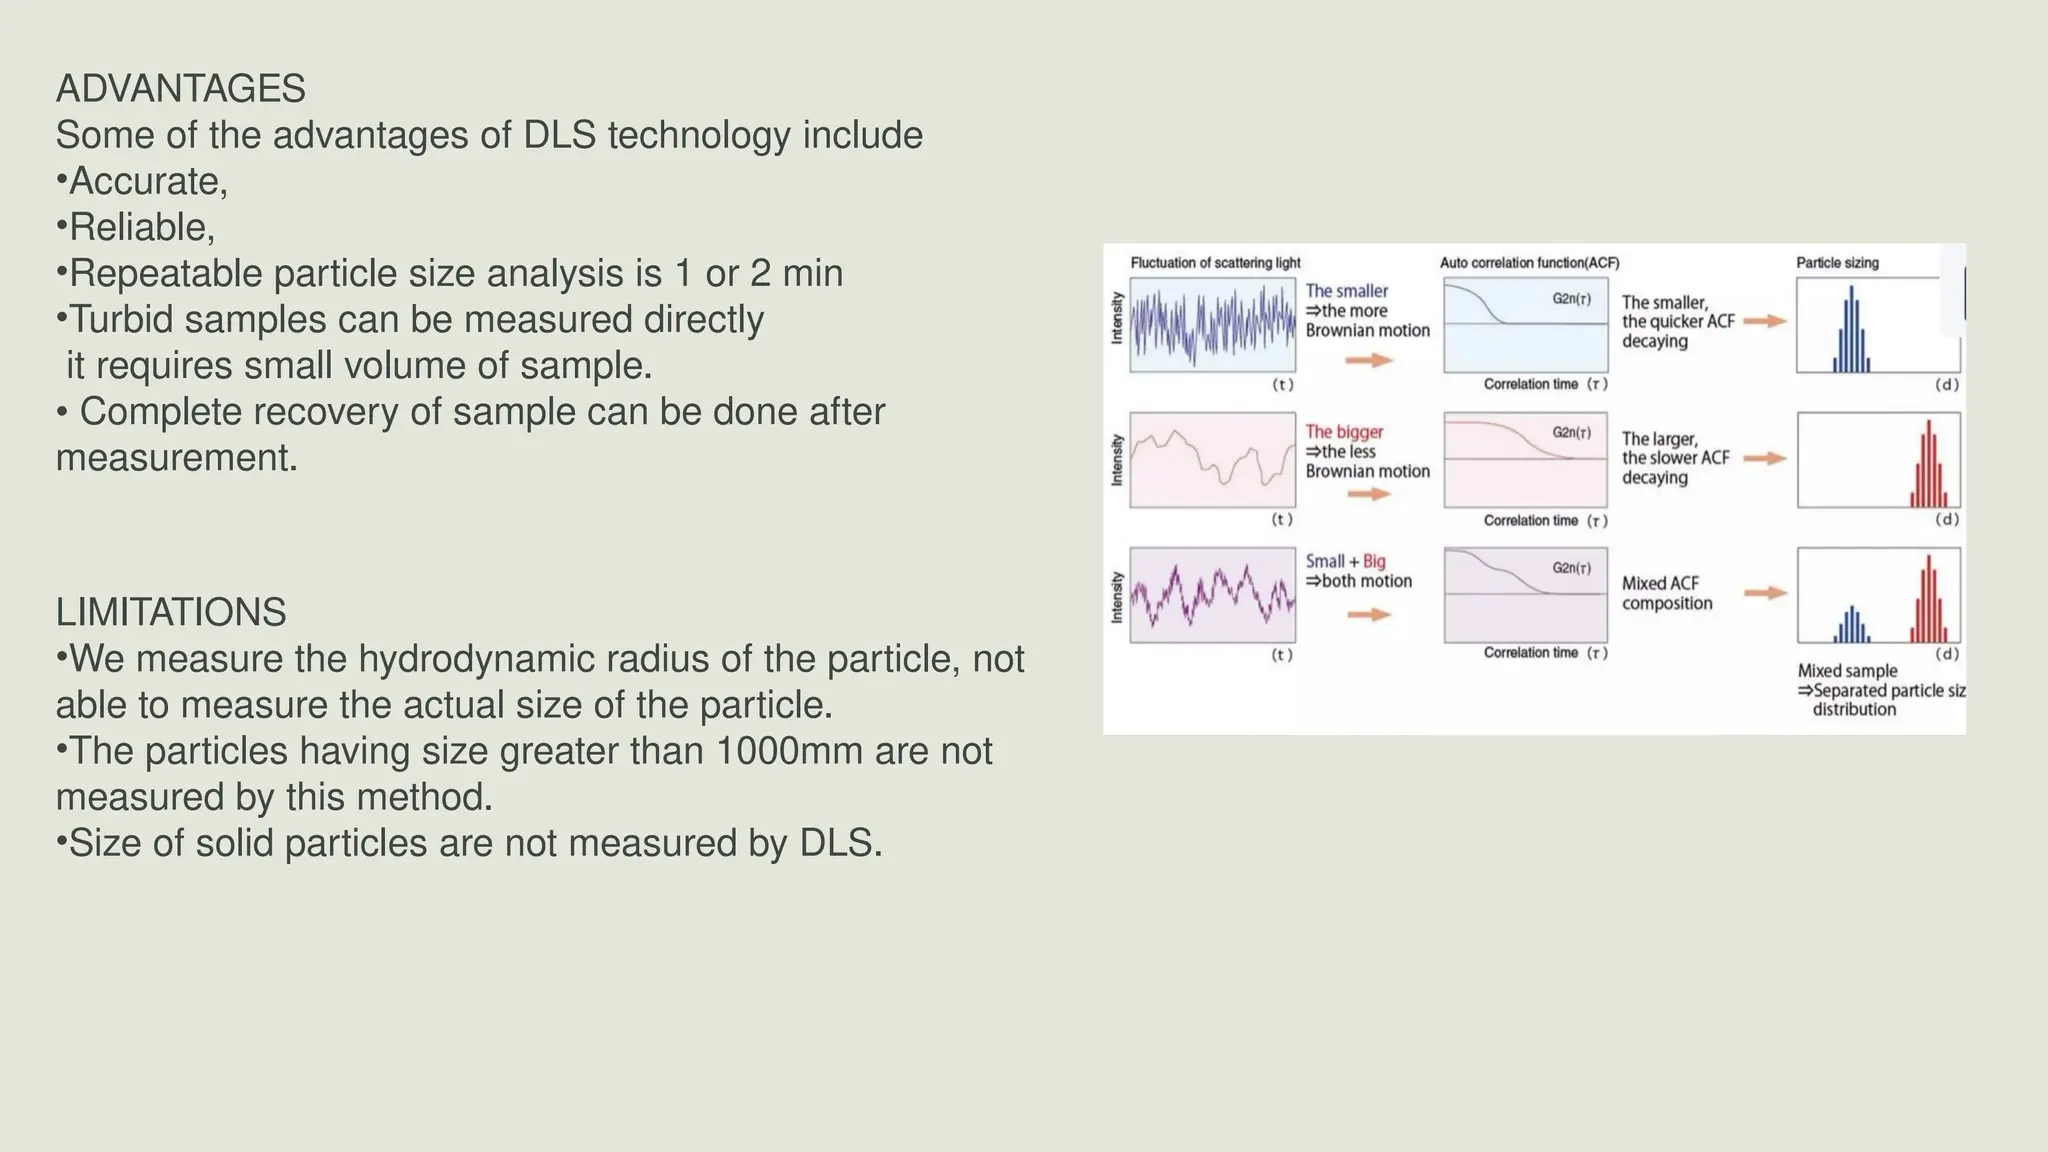
ADVANTAGES
Some of theadvantages of DLS technology include
•Accurate,
•Reliable,
•Repeatable particle size analysis is 1 or 2 min
•Turbid samples can be measured directly
it requires small volume of sample.
• Complete recovery of sample can be done after
measurement.
LIMITATIONS
•We measure the hydrodynamic radius of the particle, not
able to measure the actual size of the particle.
•The particles having size greater than 1000mm are not
measured by this method.
•Size of solid particles are not measured by DLS.
17.
References
1.Vyas S.P., KharR.K., "Targeted and Controlled Drug Delivery Novel Carrier
System", 1st Edition, 2007, CBS Publishers and Distributors,
New Delhi, Page no-206,331,356-359.
2.Khar R.K., Vyas S.P., Ahmad F.J., Jain G.K., "The Theory and Practice of
Industrial Pharmacy:, 4th Edition, 2013, CBS Publishers and Distributors, New
Delhi, Page no- 887.
3.Tiruwa R. A review on nanoparticles - preparation and evaluation parameters.
Indian Journal of Pharmaceutical and Biological Research (IJPBR) 2015; 4(2):27-
31.
4.Langevin, D., Lozano, O., Salvati, A., Kestens, V., Monopoli, M., Raspaud, E., ...
& Haase, A.(2018). Inter-laboratory comparison of nanoparticle size
measurements using dynamic light scattering and differential centrifugal
sedimentation. Nanolmpact, 10, 97-107.
5.Augstein, B., Coyne, J., Wiggins, A., Sears, B., Harding, S., Schaefer, D., &
Simpson, (2018). Characterization of Dynamic Light Scattering Instrumentation
to Determine Nanoparticle Size. Bulletin of the American Physical Society.