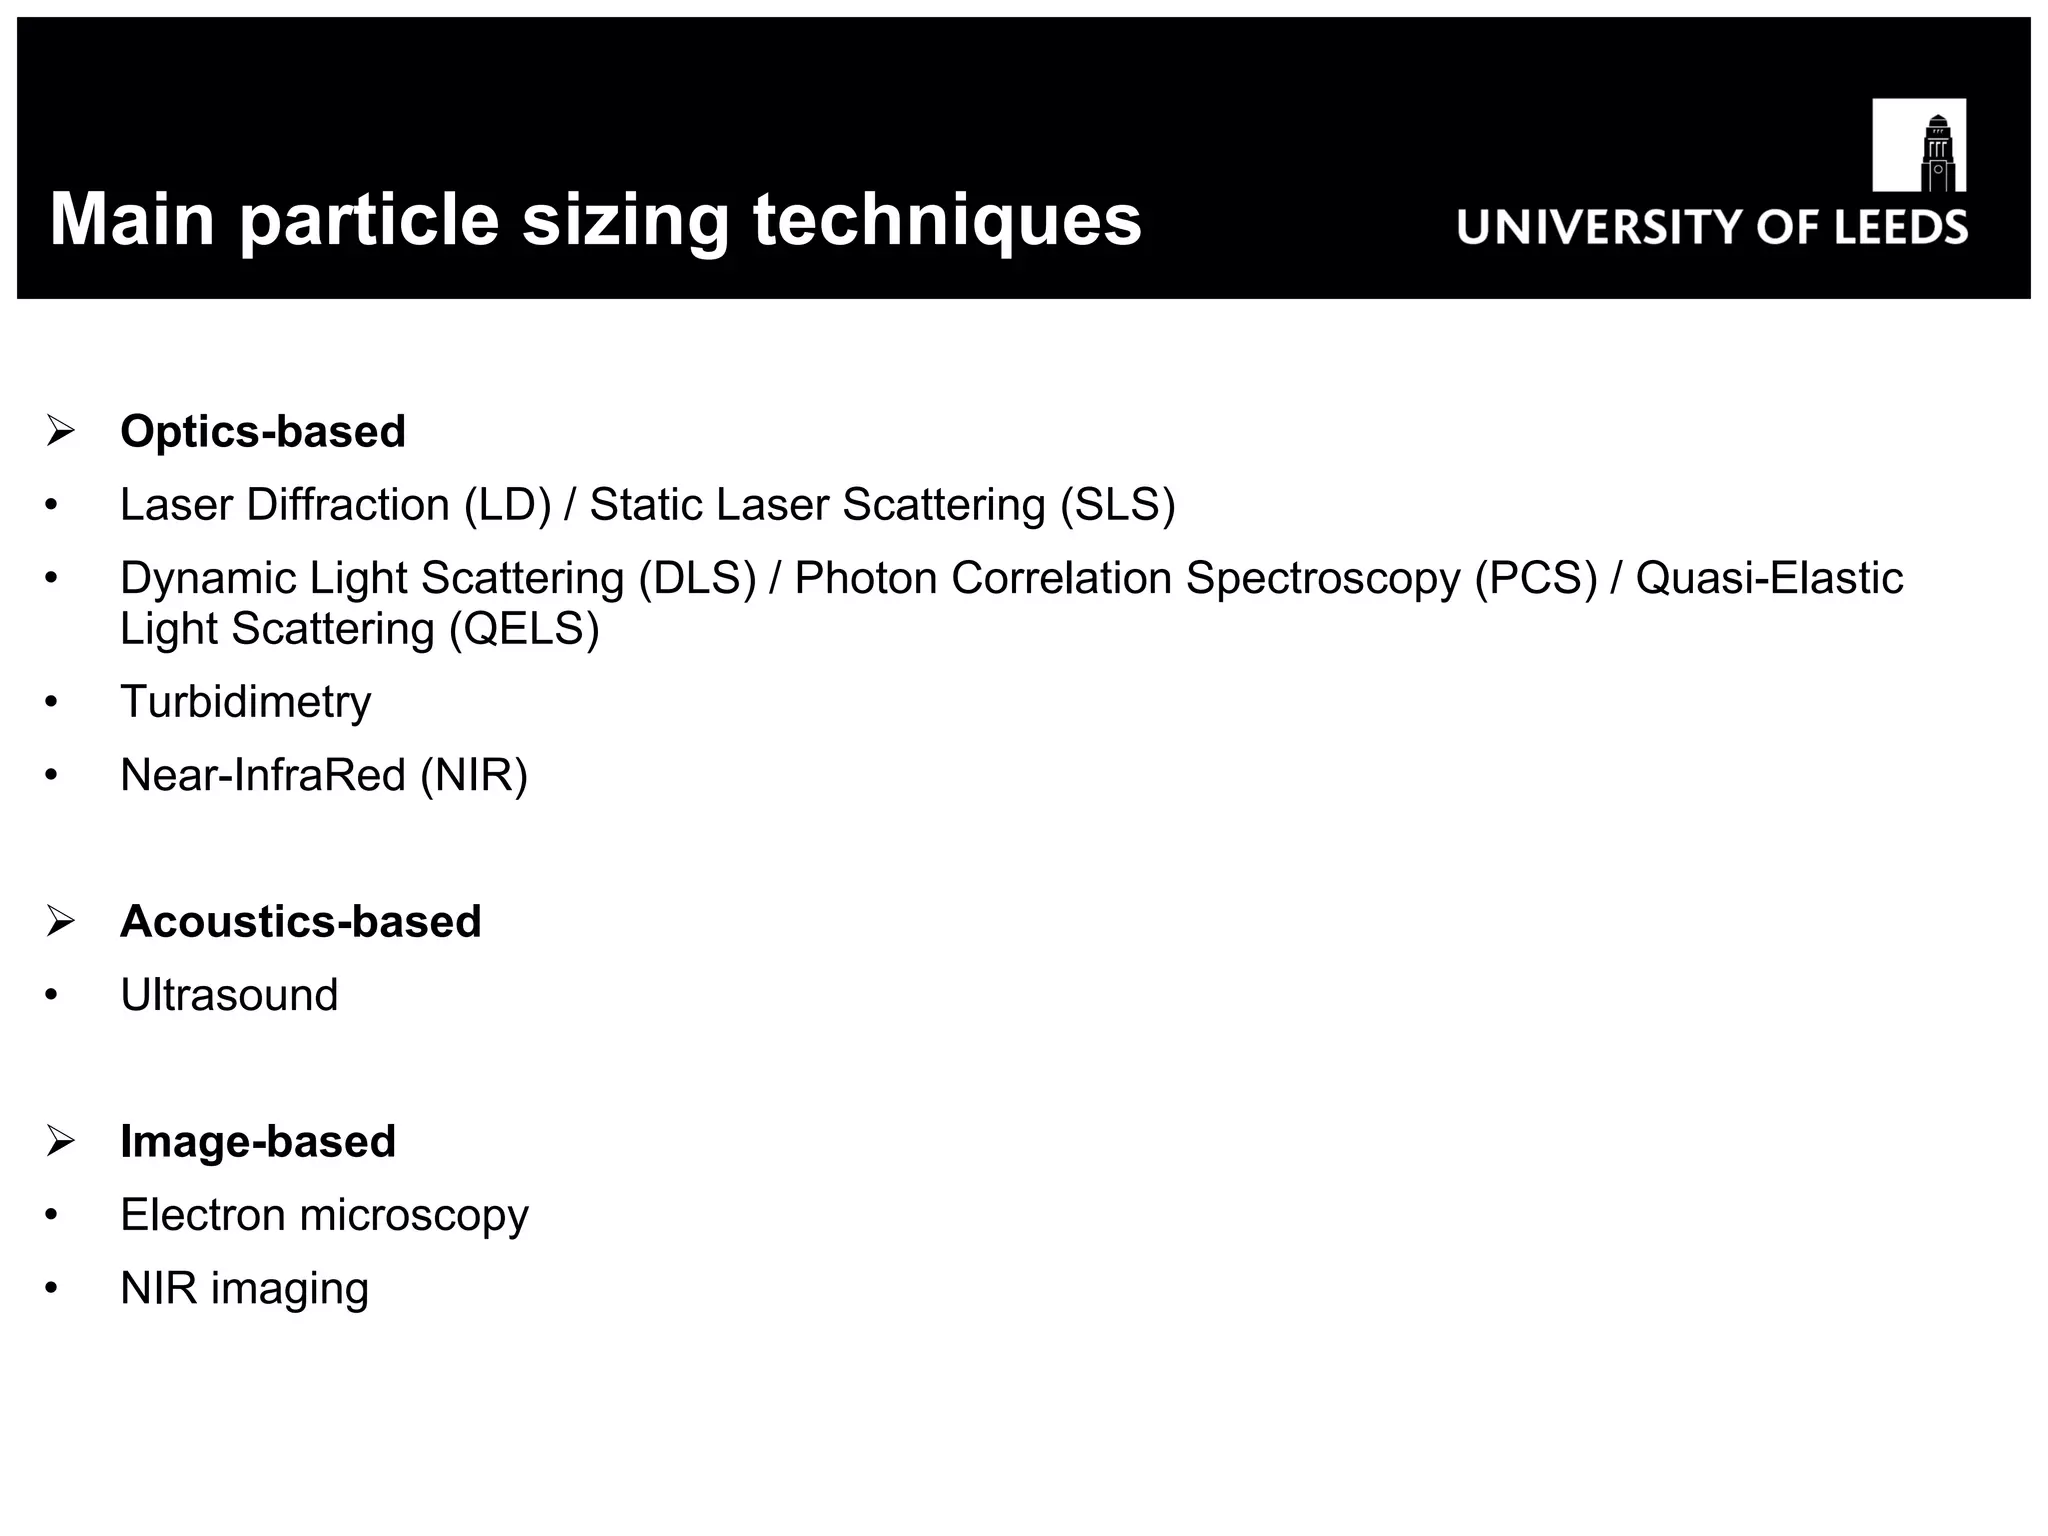
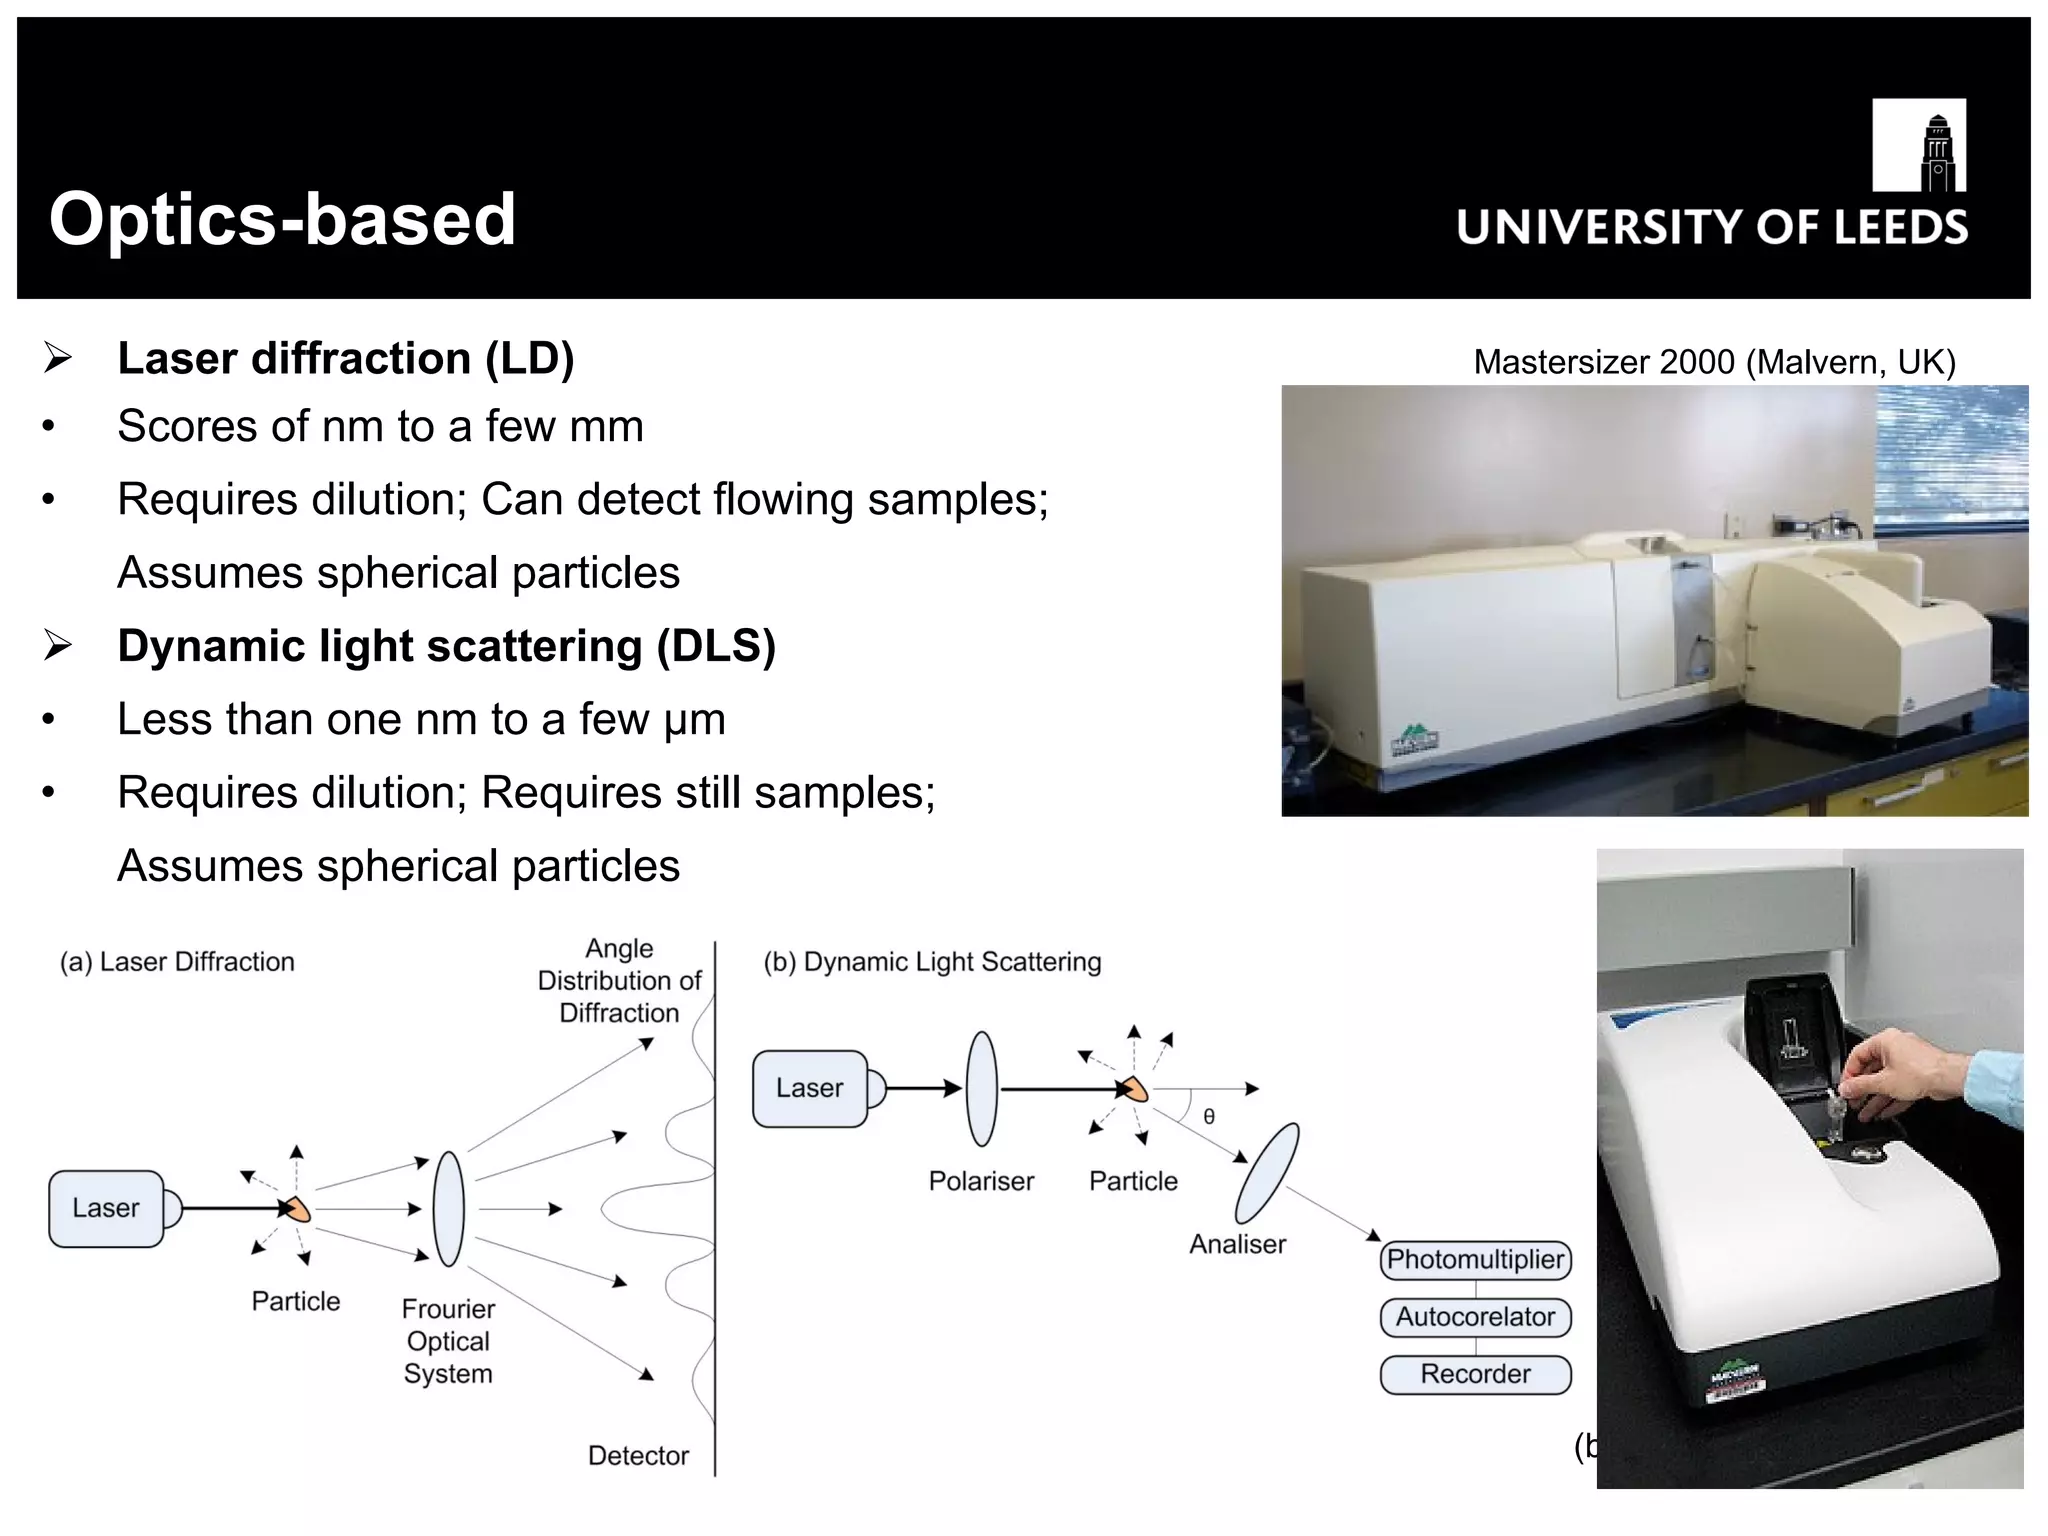
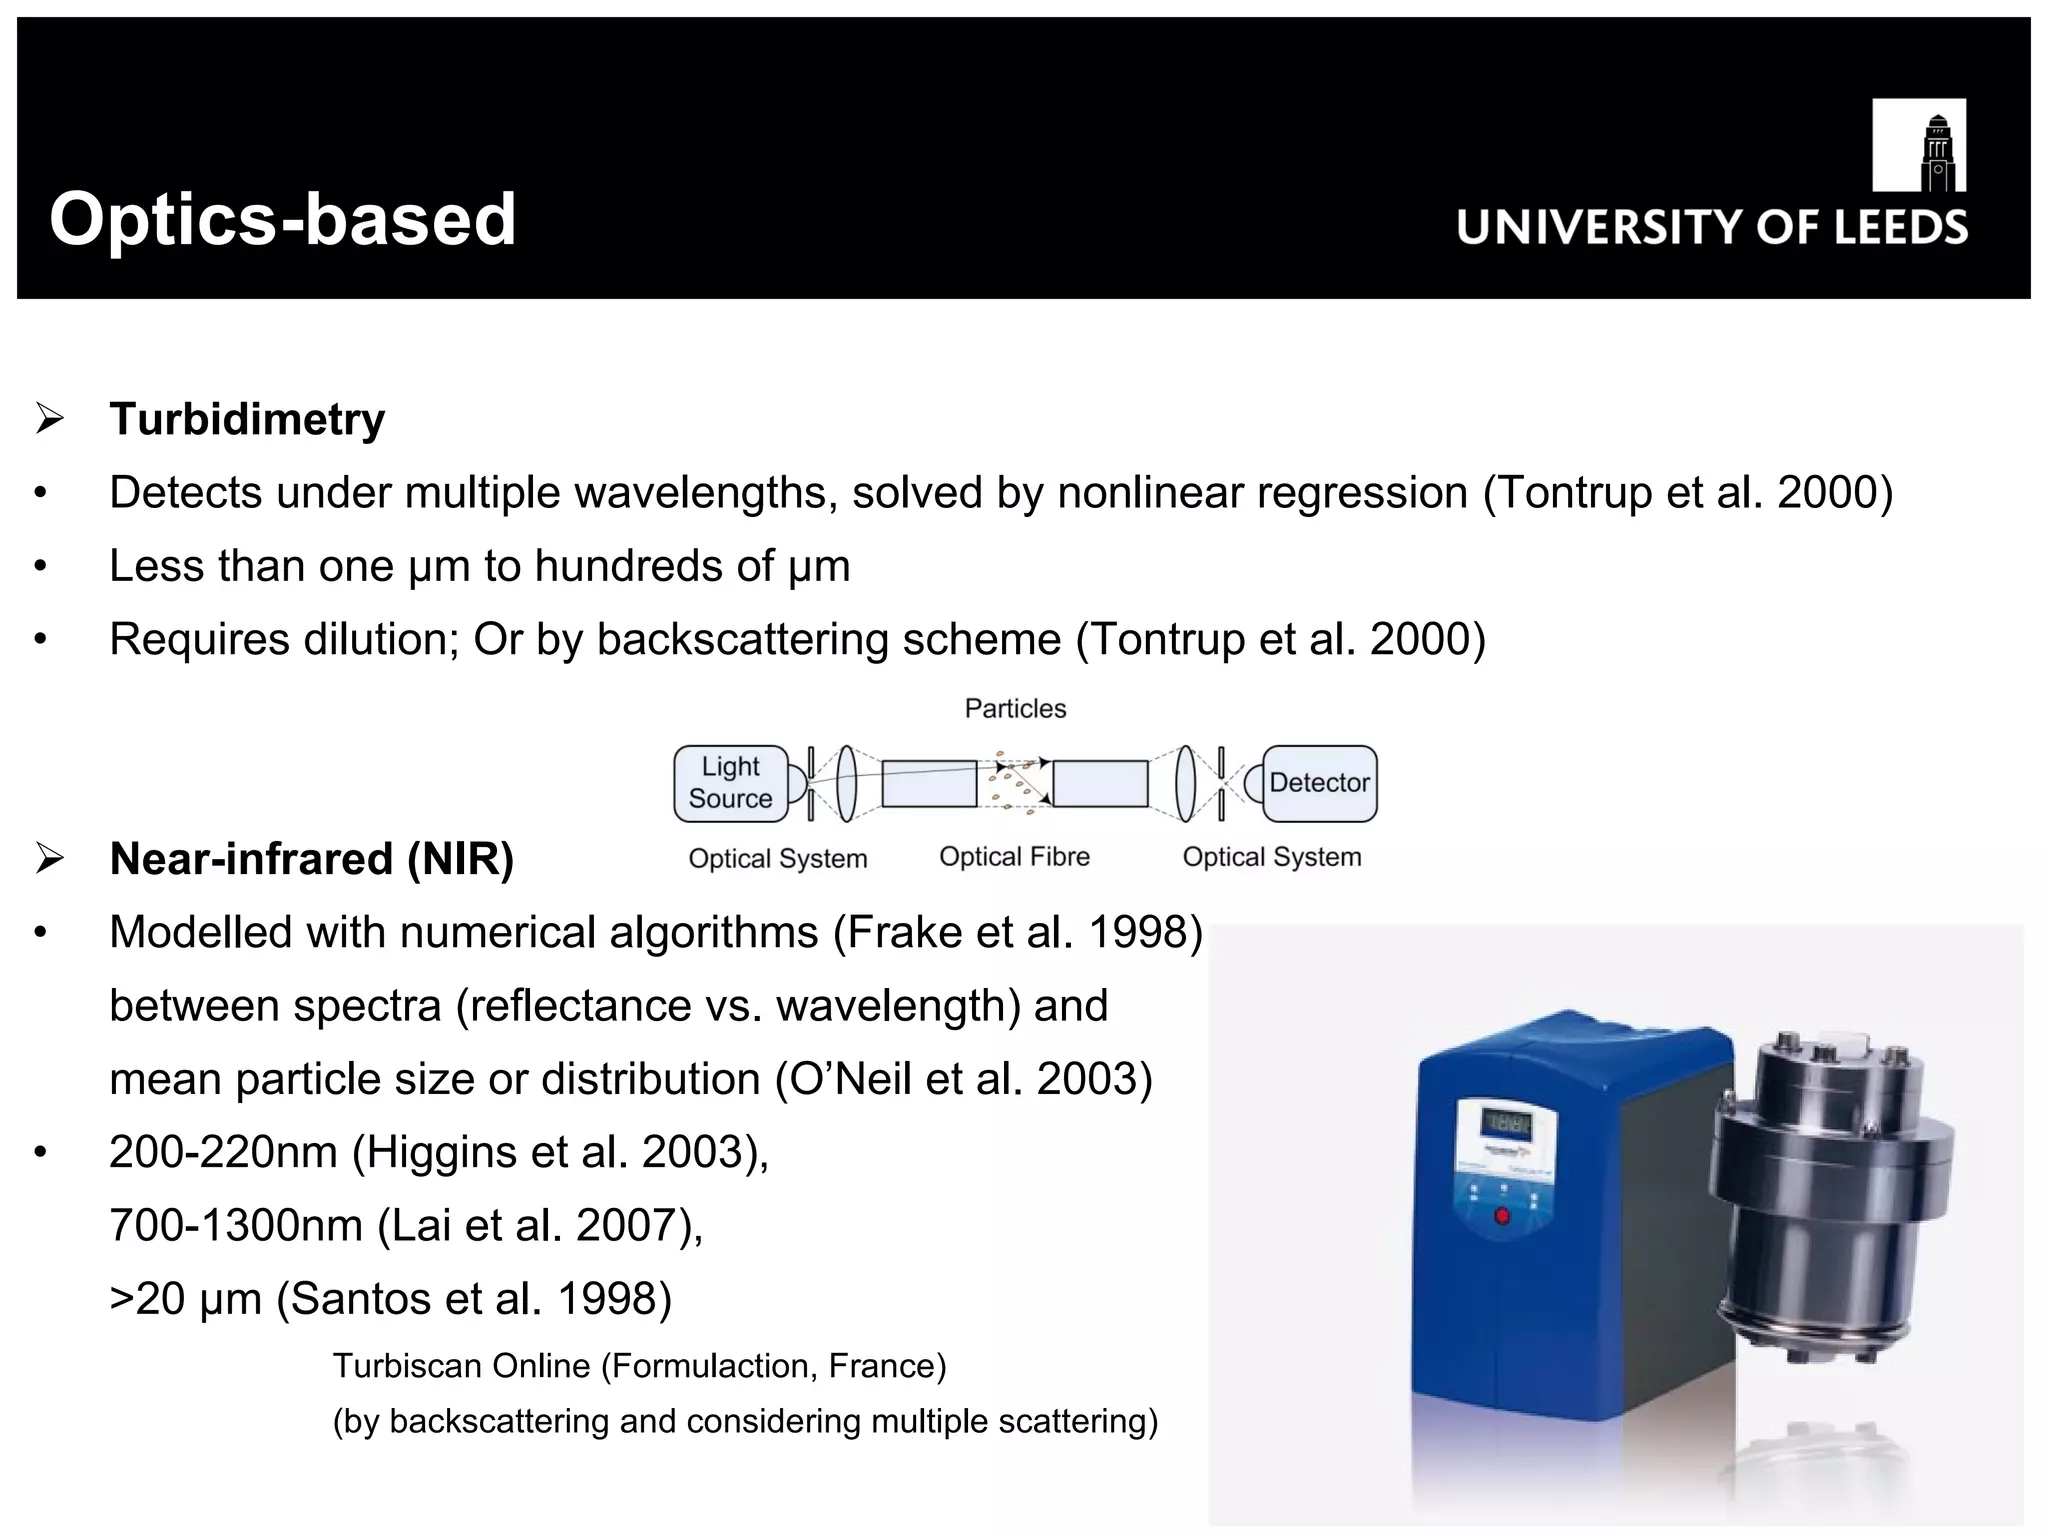
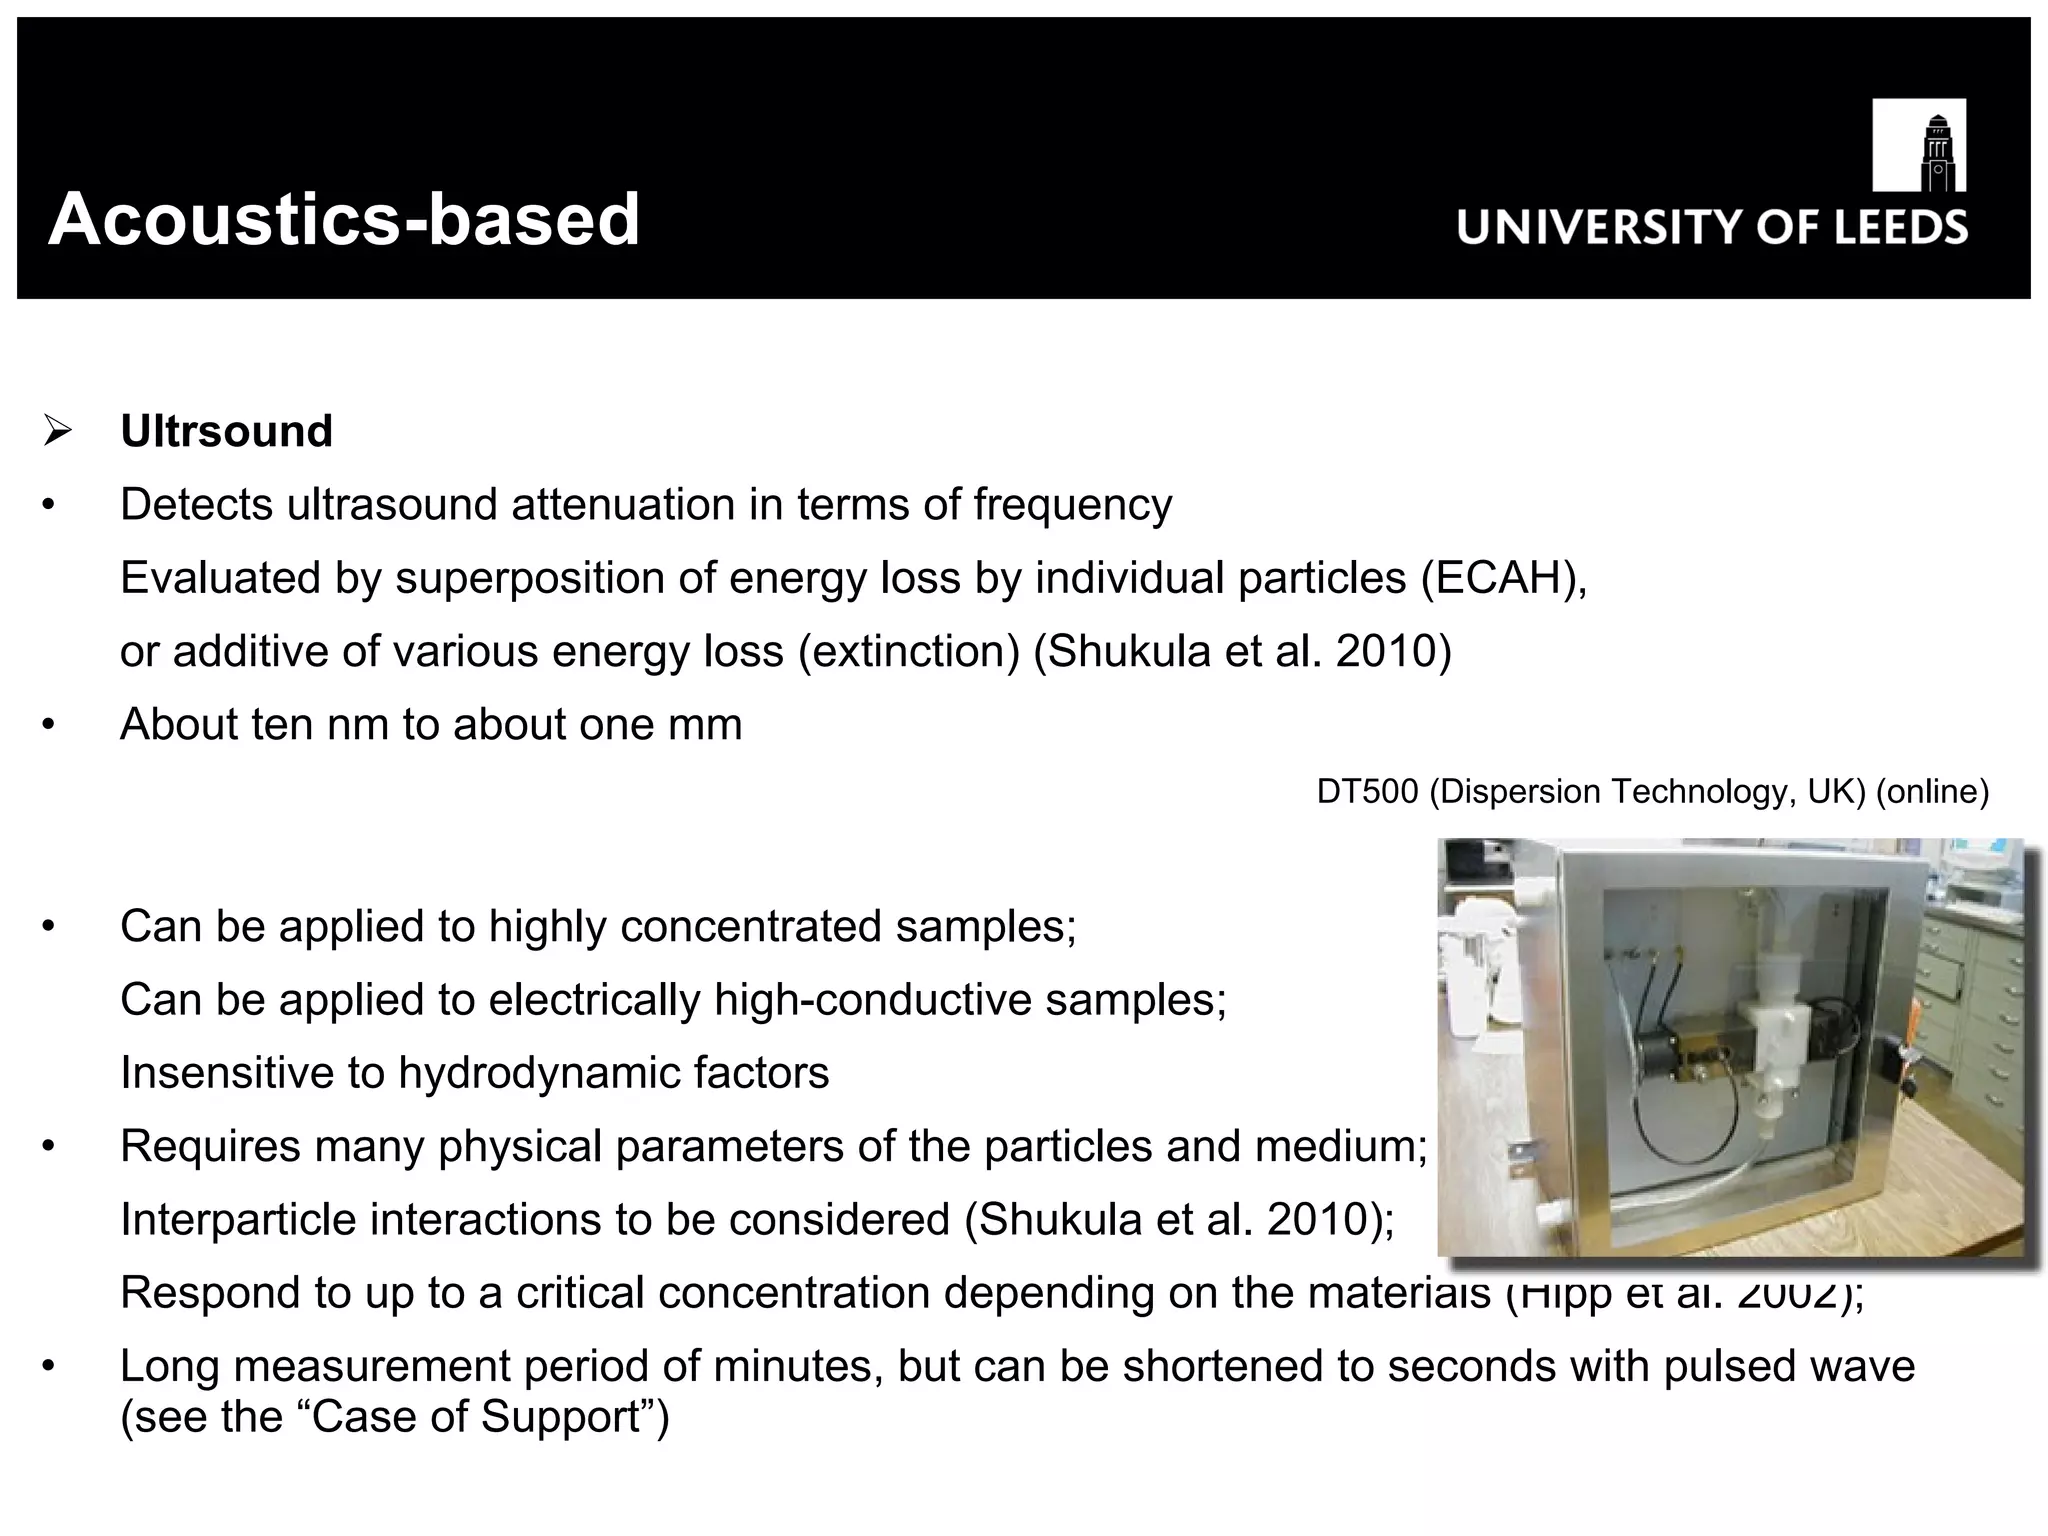
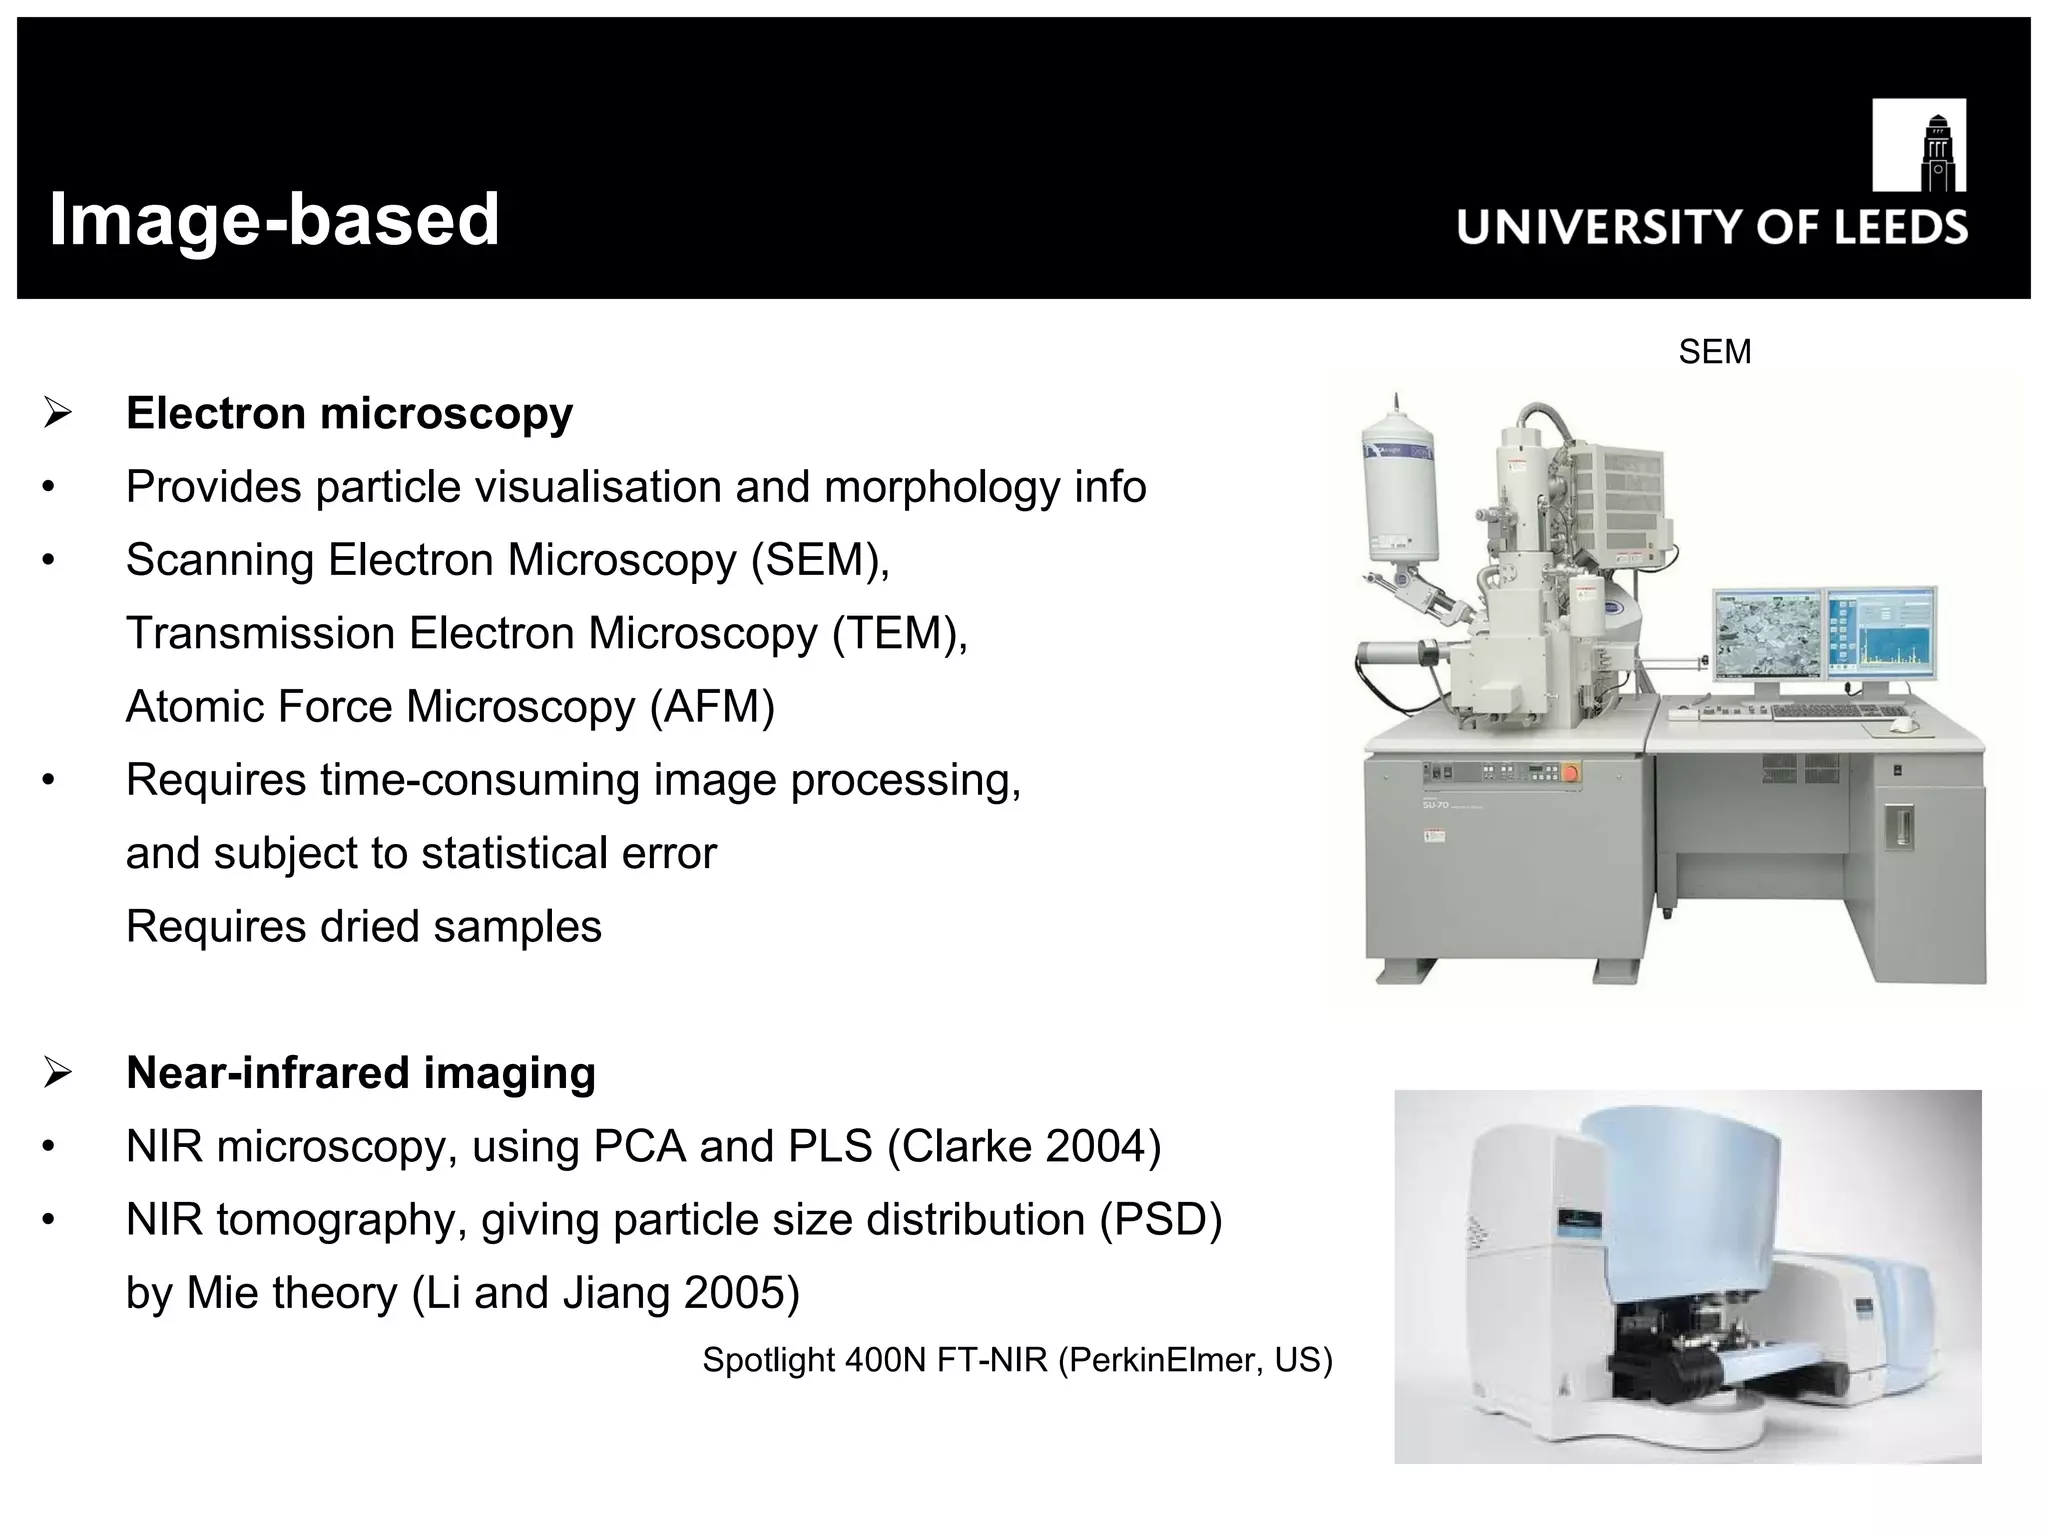
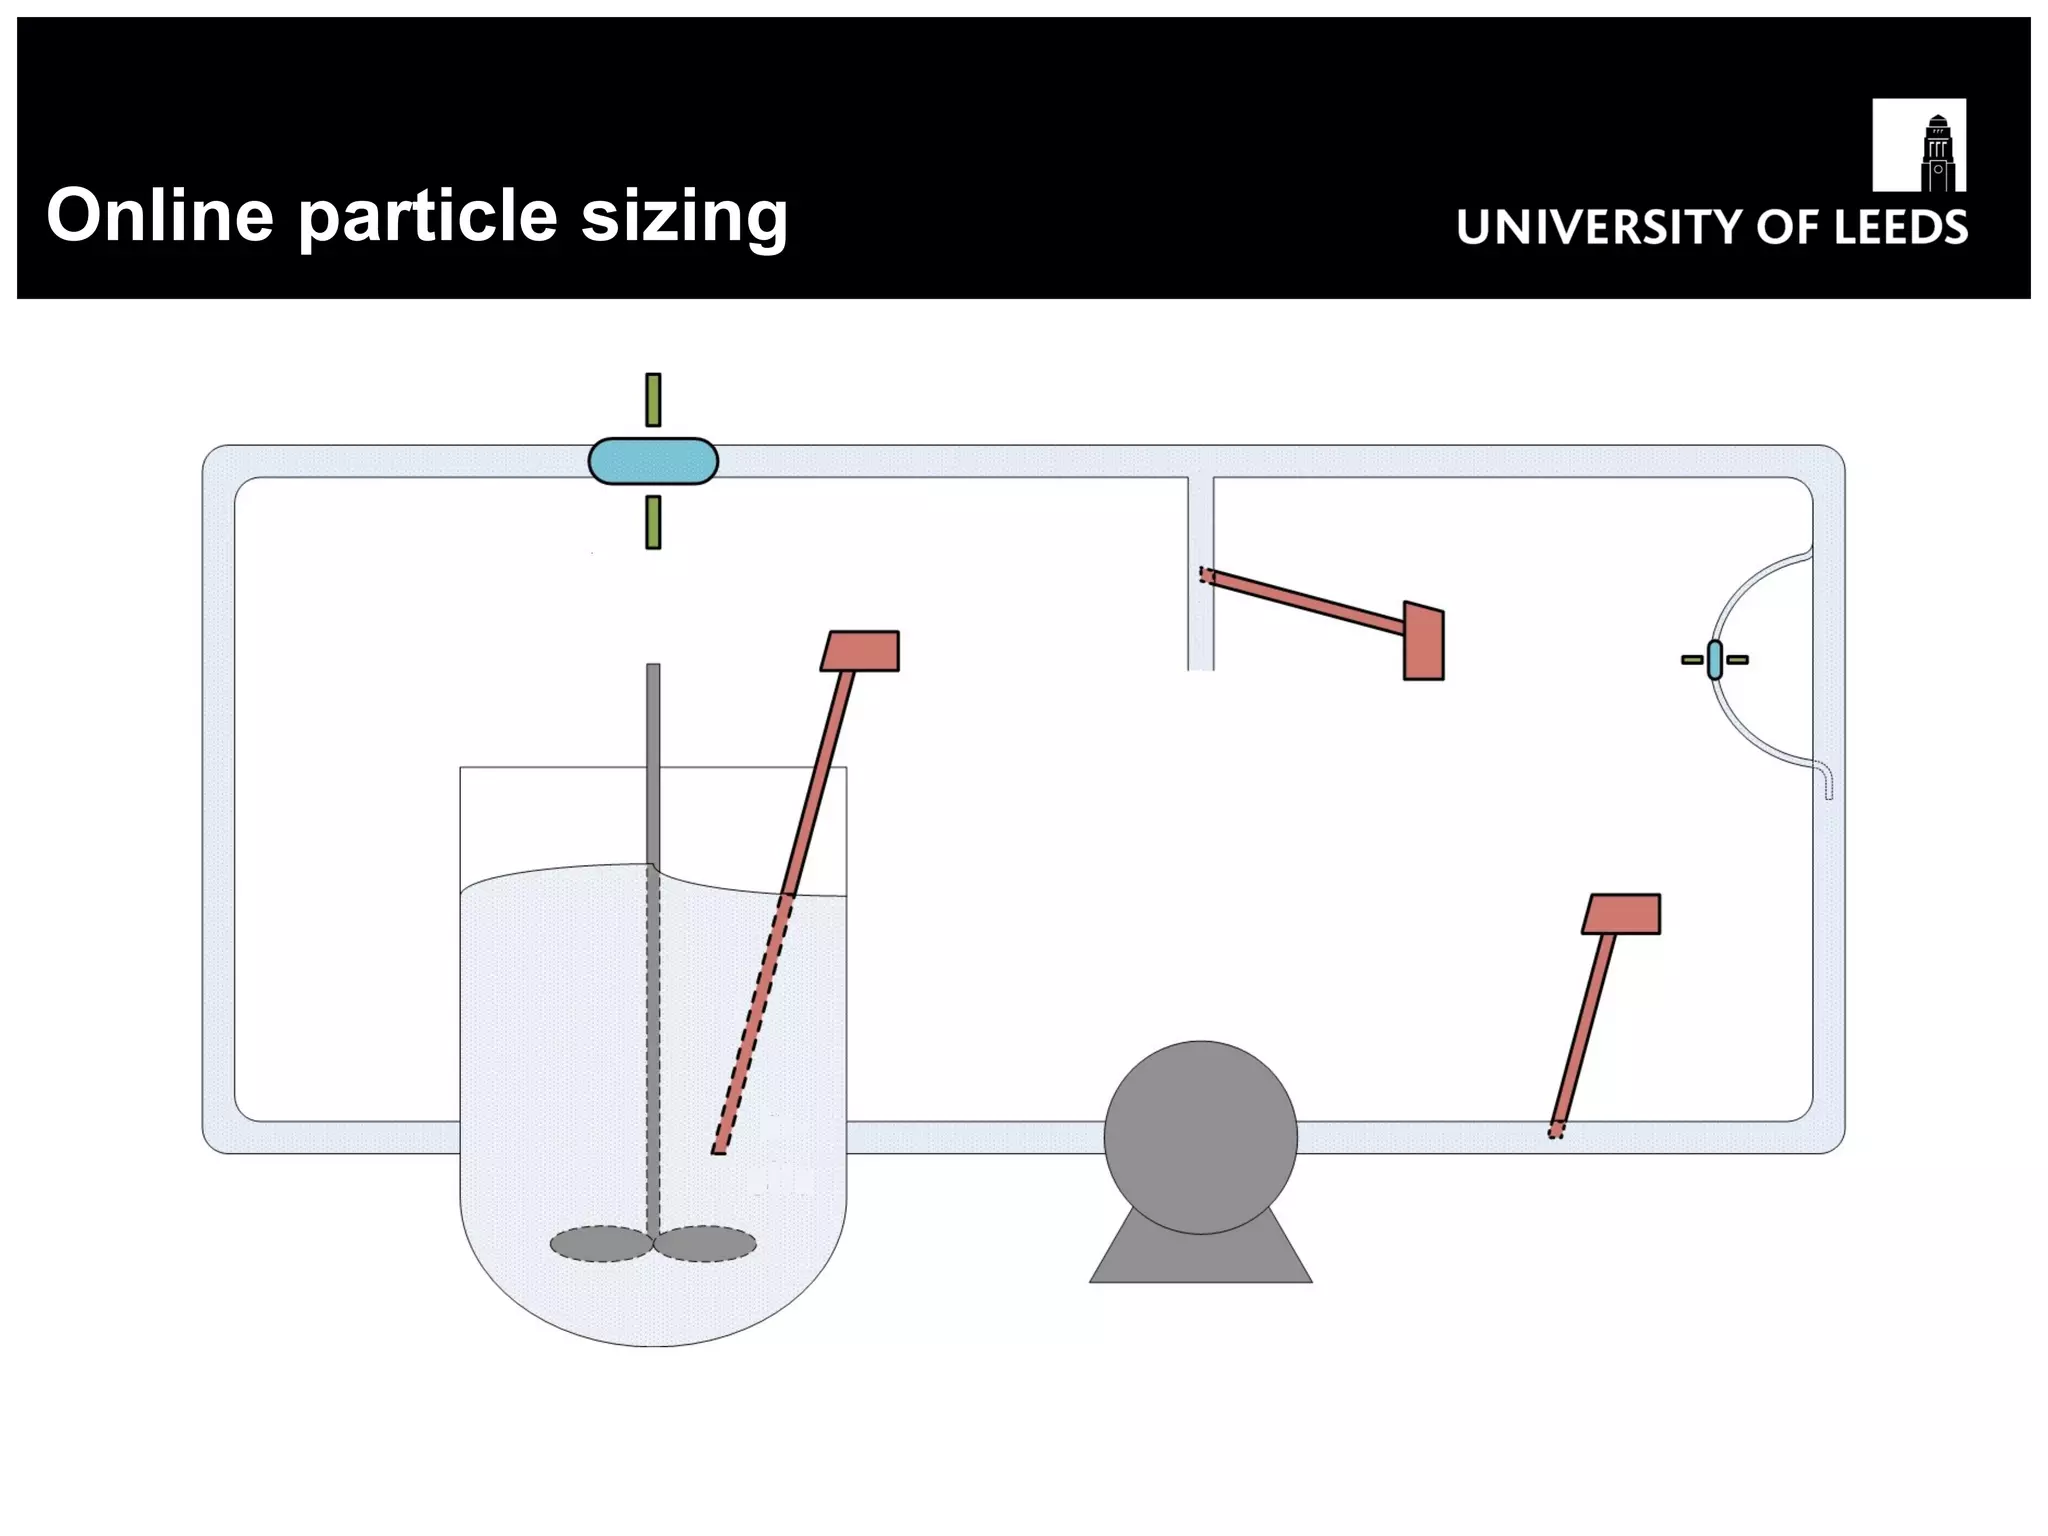
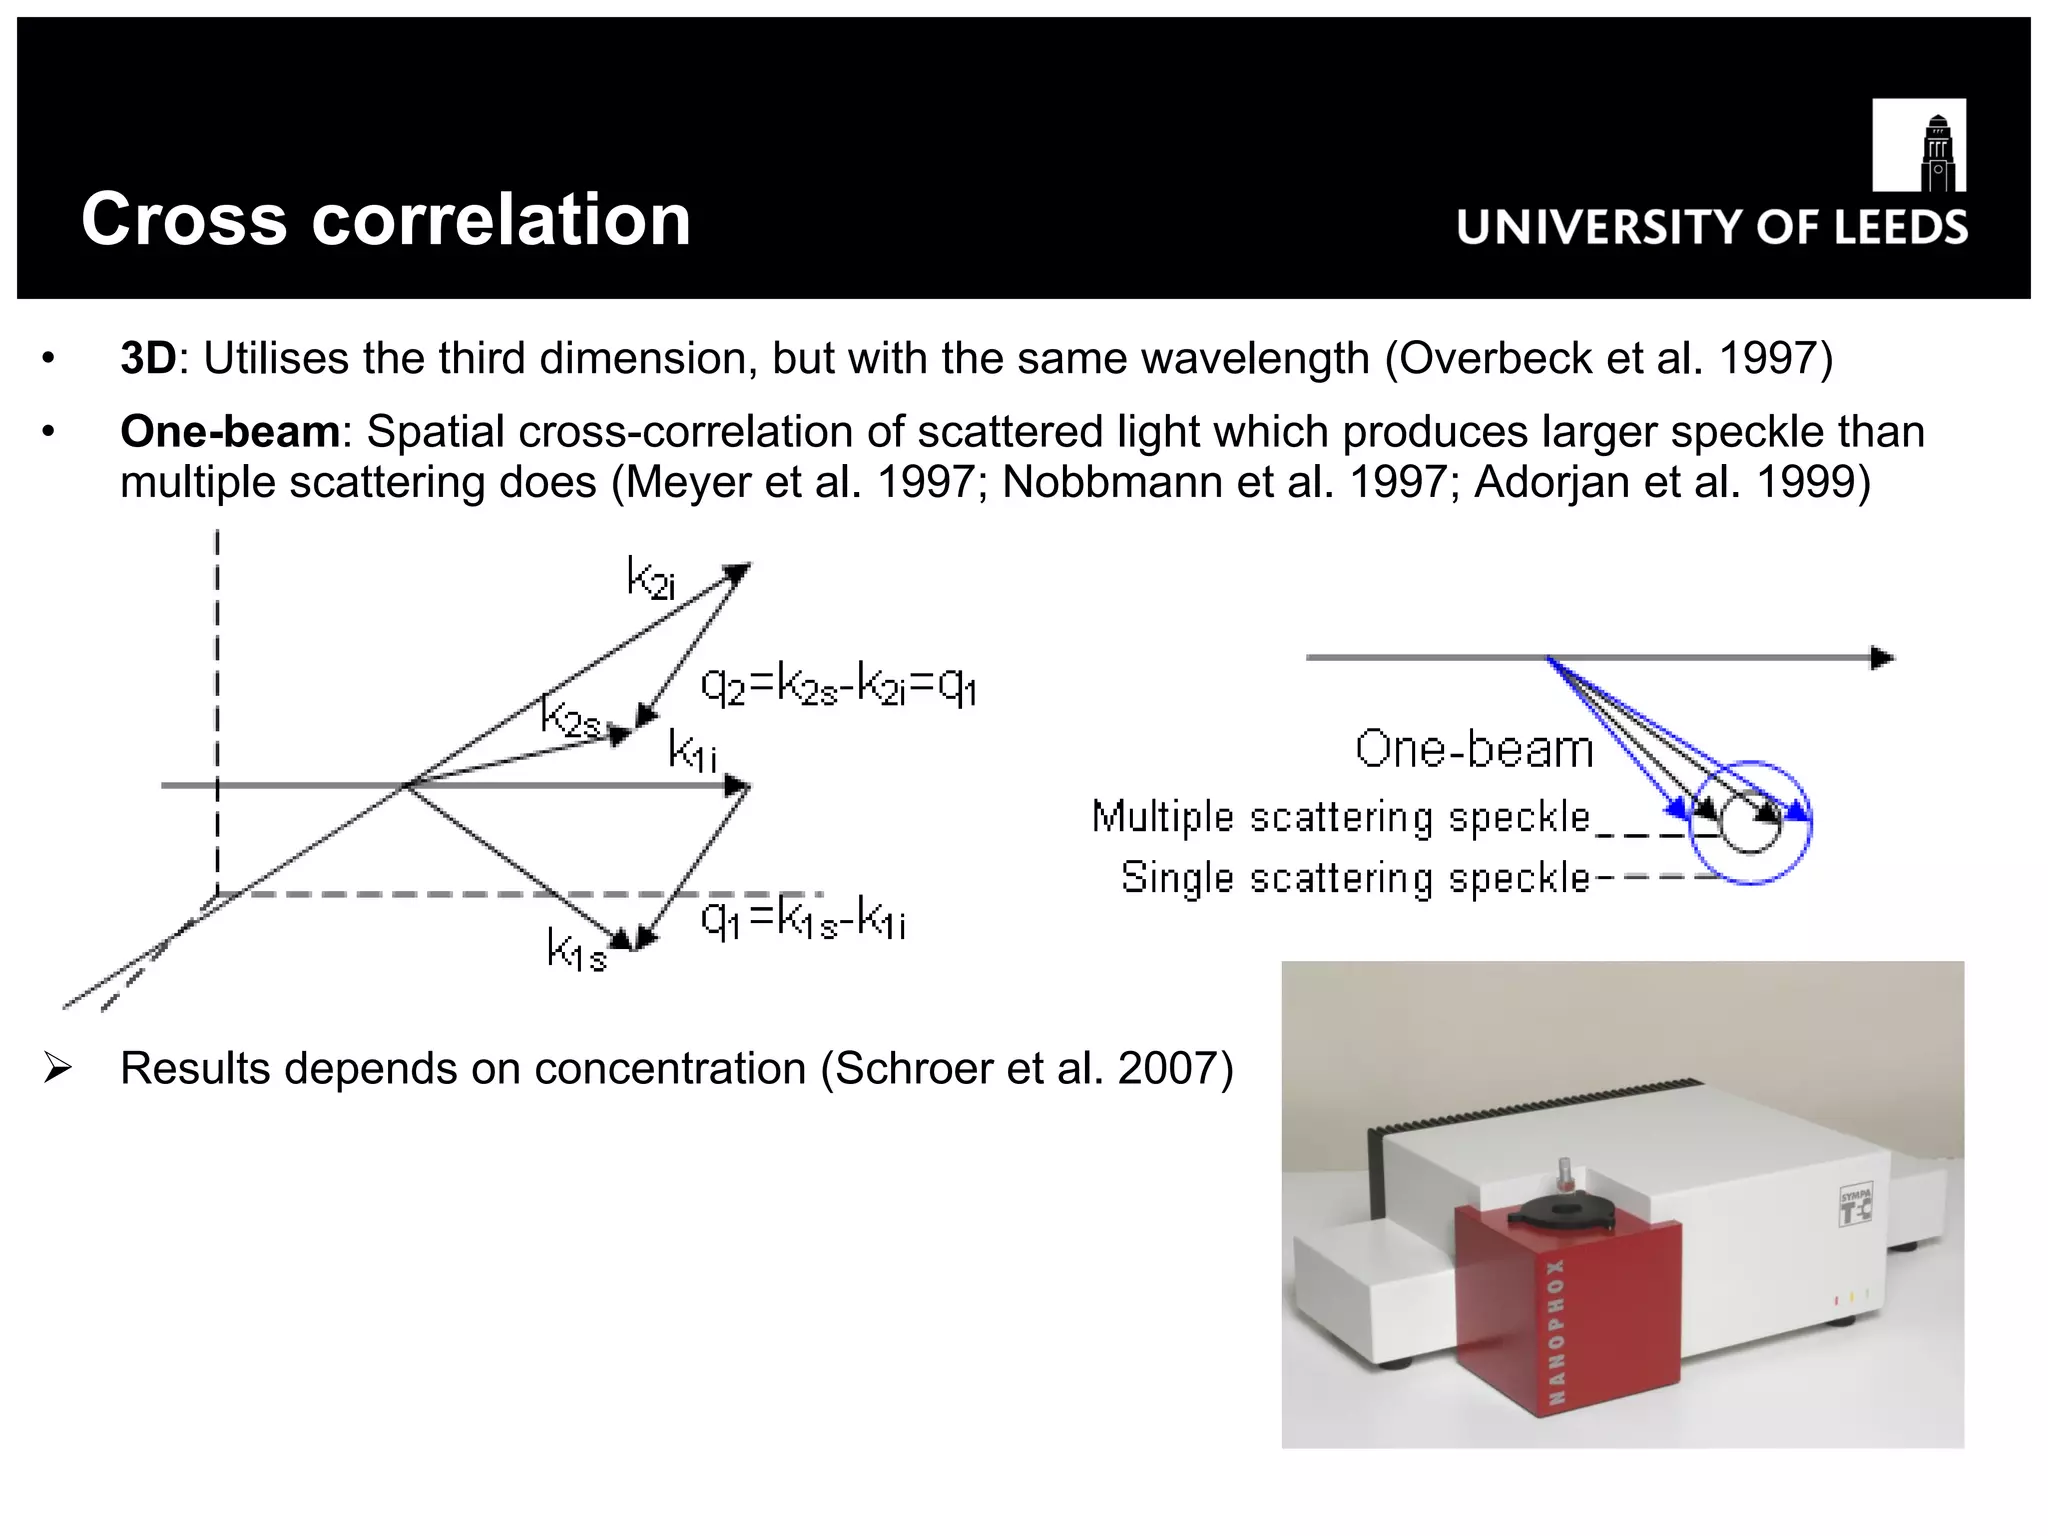
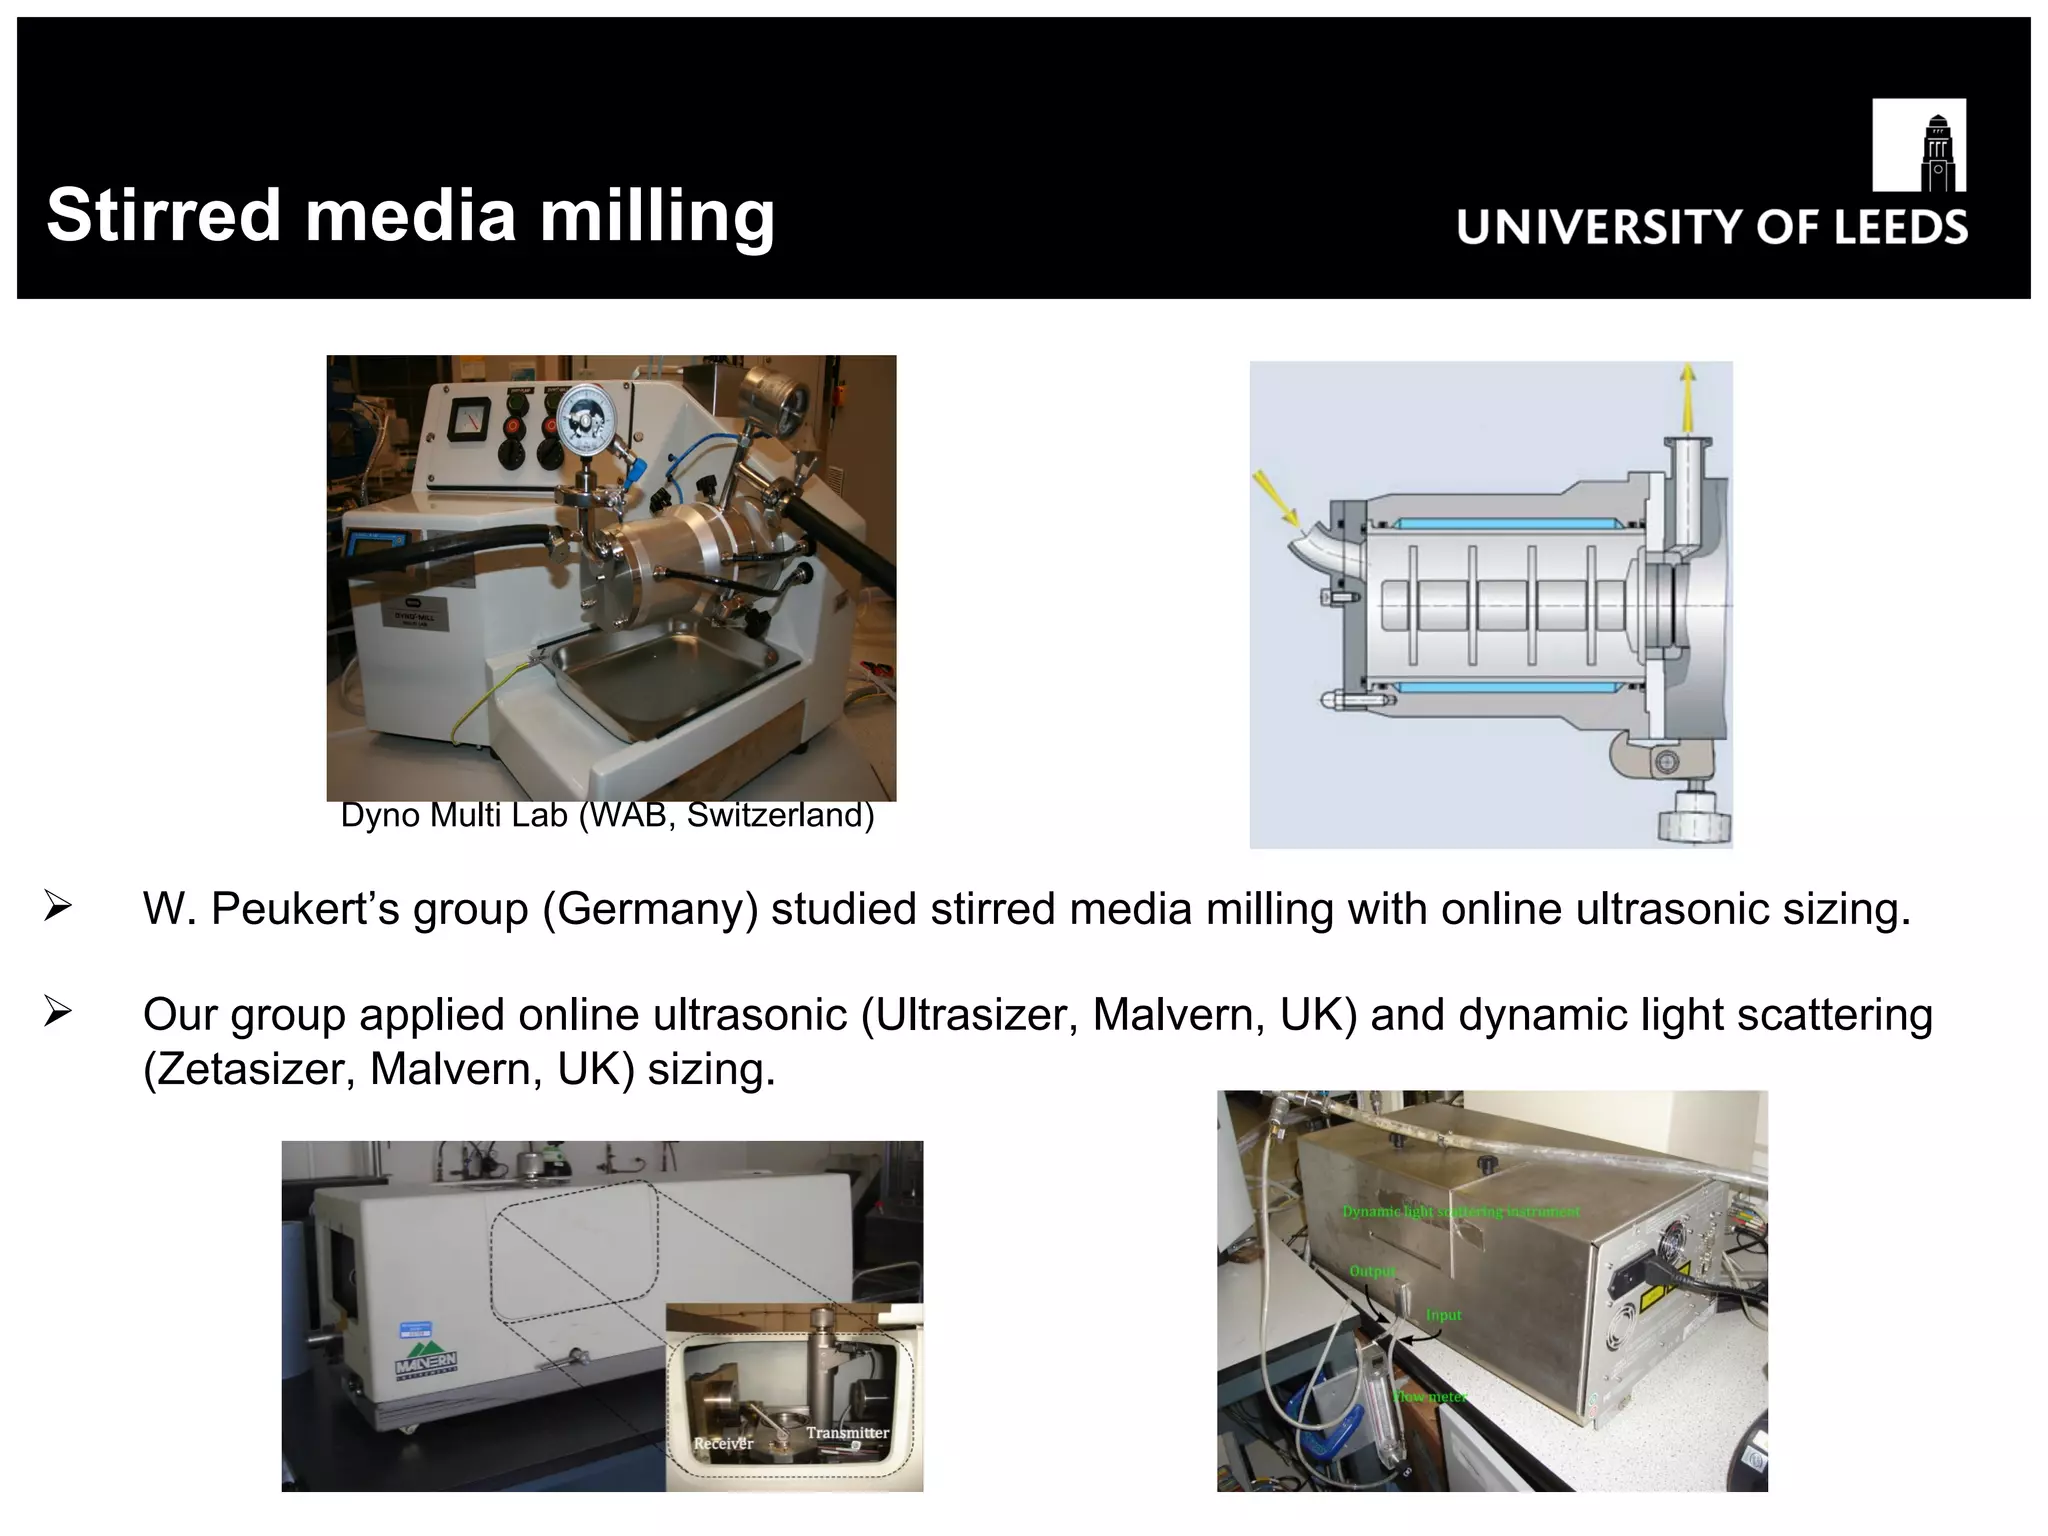
Review of online particle sizing for wet processes and Brief of wet milling  for nanoparticles Tian Lin Institute of Particle Science & Engineering University of Leeds Leeds, UK School of Process, Environmental and Materials Engineering 14/12/2010
Introduction The quality and performance of particle-related products rely significantly to the particle properties, especially the particle size. This presentation reviews the current methodologies and previous practices, and discuss the difficulties faced in online particle sizing.
Main particle sizing techniques Optics-based Laser Diffraction (LD) / Static Laser Scattering (SLS) Dynamic Light Scattering (DLS) / Photon Correlation Spectroscopy (PCS) / Quasi-Elastic Light Scattering (QELS) Turbidimetry Near-InfraRed (NIR) Acoustics-based Ultrasound Image-based Electron microscopy NIR imaging
Optics-based Laser diffraction (LD) Mastersizer 2000 (Malvern, UK) Scores of nm to a few mm Requires dilution;  Can detect flowing samples ; Assumes spherical particles Dynamic light scattering (DLS) Less than one   nm to a few  μ m Requires dilution;  Requires still samples ; Assumes spherical particles   Zeta sizer Nano (Malvern, UK) (backscattering, flow cell)
Optics-based Turbidimetry Detects under multiple wavelengths, solved by nonlinear regression   (Tontrup et al. 2000) Less than one  μ m to hundreds of  μ m Requires dilution;  Or by backscattering scheme  (Tontrup et al. 2000) Near-infrared (NIR) Modelled with numerical algorithms  (Frake et al. 1998) between spectra (reflectance vs. wavelength) and mean particle size or distribution (O’Neil et al. 2003) 200-220nm (Higgins et al. 2003), 700-1300nm (Lai et al. 2007), >20  μ m (Santos et al. 1998)   Turbiscan Online (Formulaction, France )   (by backscattering and considering multiple scattering)
Acoustics-based Ultrsound Detects ultrasound attenuation in terms of frequency Evaluated by superposition of energy loss by individual particles (ECAH), or  additive  of  various energy loss ( extinction) (Shukula et al. 2010) About ten nm to about one mm   DT500 (Dispersion Technology, UK) (online) Can be applied to highly concentrated samples; Can be applied to electrically high-conductive samples ; Insensitive to hydrodynamic factors Requires many physical parameters of the particles and medium; Interparticle interactions to be considered (Shukula et al. 2010); Respond to up to a critical concentration depending on the materials (Hipp et al. 2002); Long measurement period of minutes, but can be shortened to seconds with pulsed wave (see the “Case of Support”)
Image-based SEM Electron microscopy Provides particle visualisation and morphology info Scanning Electron Microscopy (SEM), Transmission Electron Microscopy (TEM), Atomic Force Microscopy (AFM) Requires time-consuming image processing, and subject to statistical error Requires dried samples Near-infrared imaging NIR microscopy, using PCA and PLS (Clarke 2004) NIR tomography, giving particle size distribution (PSD) by Mie theory (Li and Jiang 2005)   Spotlight 400N FT-NIR (PerkinElmer, US)
Online particle sizing
Sampling and Conditioning Alternative methods to conquer formidable process conditions and satisfy the sizing instrument prerequisites . For example, online continuous dilution designs to address highly concentrated samples by mixing chamber  (Hobbel et al. 1991; Florenzano et al. 2005) or parallel stages  (Sacoto et al. 1998; Garcia-Rubio et al. 1999; Celis and Garcia-Rubio 2002) :
Online particle size control Model-based control strategy has been developed or simulated recently, without online particle sizing and real-time feedback . Generally a mechanical (Srour et al. 2009) or population balance  (PB)  (Aamir et al. 2009) model is constructed to predict particle size distribution or particle nucleation and growth kinetics (Shi et al. 2005). With the particle size (or nucleation and growth) prediction based on these models, process variable profiles were dynamically optimised .
Representative work on online particle sizing for wet processes Laser diffraction (LD) E.g. (Biggs and Lant 2000) (diluted in advance) Dynamic light scattering (DLS)   E.g. (Wang et al. 2009) (<5mL/min) Fibre optic DLS   E.g. (Chen 2009) (automatically diluted) Turbidimetry   E.g. (Crawley et al. 1996; Crawley et al. 1997; Gruy and Cournil 2004)   and (Tontrup et al. 2000) (backscattering) Near-infrared (NIR)   E.g. (Higgins et al. 2003) and (Abismail et al. 2000; Tourbin and Frances 2007) (backscattering, multiple scattering) Frequency Domain Photon Migration (FDPM)   E.g. (SevickMuraca et al. 1997) Focused Beam Reflectance Measurement (FBRM)   E.g. (Dowding et al. 2001 ; Chen et al. 2009 ; Trifkovic, Sheikhzadeh et al. 2009; Xalter and Muelhaupt 2010) Multi-wavelength   E.g. (Marioth, Koenig et al. 2000) Ultrasound   E.g. ( Mende et al. 2003; Stenger et al. 2005;  Wang et al. 2009)
Difficulties from general particle sizing High concentration Multiple scattering, and interparticle interactions (e.g. Coulombic force) Dilution may change particle size (e.g. in crystallisation) Morphology Nonsphere (aspect ratio, orientation) Aggregation Due to collision in Brownian or rheological motions  etc. Surface-active agents or agitation force
Difficulties special in online particle sizing Rheological factors Cause interparticle interactions  Inhomogeneity Concentration gradient by sediment, and particle separation by different size or specimen T rending results,  and unrepresentative samples Uncertain parameters Unknown or fluctuating parameters due to mixtures with additives or varying environment
Advances to address the difficulties --- Multiple scattering Modelling and evaluation Radiative Transfer Equation (RTE) Random walk Diffusing Wave Spectroscopy (DWS) Monte-Carlo ray-tracing FDPM, NIR backscattering Suppression Backscattering Fibre optic DLS Cross correlation Dual-beam, Dual-colour, 3D, One-beam
Radiative transfer equation Describes propagation of multiply scattered electromagnetic radiation (Kokhanovsky 2002) Aiming at reflection and scattering coefficients by solving the inverse problem, then related to refractive index, particle size and volume fraction etc. Single-scattering be evaluated first by e.g. Mie theory, then multiple-scattering be considered by e.g. extended Hartel’s theory (Vargas and Niklasson 1997;   Velazco-Roa and Thennadil 2007) Analytic solutions only for special situations, while numerical ones time-consuming Application to instruments, e.g. laser diffraction (Schnablegger and Glatter 1995;   Lehner et al. 1998)
Random walk model and DWS Random walk  (Rogers 2008 ) Each photon is assumed to execute a random walk through the sample Light by all paths independently contribute to the detection Described by transport mean free path (distance between two scattering, related to individual particles scattering properties and particle concentration) , and possibility  of certain photon travel length To solve a diffusion equation Diffusing wave spectroscopy (DWS) Measurements as DLS but interpreted by random walk (Scheffold 2002).   DWS ResearchLab (LS Instruments, Switzerland)
Monte-Carlo ray tracing Simulates light multiple scattering (Bergougnoux et al. 1996;   Aberle et al. 1999 ) Simulates an aspect of the light propagation ( Lu et al. 1995;  Gay et al. 2010) Simulates for parameters ( Arancibia-Bulnes and Ruiz-Suarez 1999;  Rogers 2008)
FDPM Frequency Domain Photon Migration (FDPM) Propagates sinusoidally modulated light through the samples, and detects its attenuation and phase-shift after multiple scattering Utilises multi-wavelength measurements to calculate particle concentration simultaneously by nonlinear regression (Richter et al. 1998) Sample must be concentrated to cause multiple scattering, but not too dense to avoid interparticle interaction  (SevickMuraca et al. 1997)
Backscattering, Fibre optic DLS and FBRM Fibre optic DLS Gives only relative change of particle size Results depending on concentration, and nonlinear to DLS sizing, esp. for high concentration The p robe will influence Brownian motions of particles nearby (Thomas 1989; Thomas and Dimonie 1990; Sadasivan and Rasmussen 1997) Focused Beam Reflectance Measurement (FBRM) Detects particle chord-length rather than diameter or size (Dowding et al. 2001) Severely disturbed by stirring and bubbles, and influenced by the probe angle (Dowding et al. 2001) FOQELS (Brookhaven, UK)   Lasentec FBRM (Mettler-Toledo, US)
Cross correlation Photon correlation function of single scattering doesn’t depend on laser wavelength or wave vector, but only on scattering wave vector, while multiple scattering does. Thus cross correlation between light scattered by the identical scattering volumes and scattering vectors with different optical geometries can eliminate multiple scattering effects. Dual-beam : Two laser systems at opposite positions.   Dual-colour : Two wavelengths (Schatzel et al. 1990; Schatzel and SchulzDuBois 1991)
Cross correlation 3D : Utilises the third dimension, but with the same wavelength  ( Overbeck et al. 1997) One-beam : Spatial cross-correlation of scattered light which produces larger speckle than multiple scattering does   ( Meyer et al. 1997; Nobbmann et al. 1997;  Adorjan et al. 1999 ) Results depends on concentration (Schroer et al. 2007)   Nanophox (Sympatec, Germany) (3D)
Advances to address the difficulties --- Morphology Nonspherical effects at resonance region  when particle sizes are comparable to light wavelength Radiative transfer equation (RTE) (Mishchenko 2009; Velazco-Roa et al. 2008;   Mishchenko 2009) T-matrix and superposition Polarization fluctuation spectroscopy  (PFS) Cross-correlation of two polarised laser to recover particle aspect ratio, also the radius of equivalent volume sphere (Walker et al. 2004; Chang et al. 2002). Requires sufficient dilution to avoid multiple scattering (Gay et al. 2010) realised polarization imaging, and got particle size and morphology info by polarization pattern analysis. The group’s work of  on-line crystal morphology measurement and control by imaging, as mentioned in the “Case for Support”.
Advances to address the difficulties --- Aggregation & Interparticle interaction Aggregation (Sorensen 2001) reviewed light scattering by fractal aggregates . (Iwai et al. 1998) applied polydisperse random medium as the model of fractal aggregations . (Mishchenko et al. 1996) applied superposition T-matrix approach for computing light scattering by composite/aggregated particles . (Soos et al. 2009) took into account the intracluster multiple scattering by solving T-matrix,  in  a population balance (PB) model. Interparticle interaction Some physical models of interparticle interactions have been set up, with the assumption of hard spherical particles. E.g. (Richter et al. 1998; Tourbin and Frances 2007) applied Percus-Yevick model for approximating spatial correlation of particles in monodisperse suspension. Interparticle interactions due to hydrodynamic factors can also be modelled and taken into account, e.g. (Richter et al. 1998).
Advances to address the difficulties --- Uncertain parameters Multi-wavelength Detects intensity attenuation of laser of different wavelengths (Marioth, Koenig et al. 2000) Particle number concentration can be solved together with the particle size Usage of a third wavelength can avoid systematic errors, or determine another uncertain parameter FDPM and turbidimetry-based sizing also apply multi-wavelength techniques
Potential of chemometrics NIR Chemometric tools applied to NIR instruments  for modelling between spectra and particle size info, e.g. Principal Component Analysis (PCA), Partial Least Square (PLS), Multi-Linear Regression (MLR) etc. (Gossen et al. 1993; O'Neil et al. 1998; Otsuka et al. 2003; Clarke 2004; Rantanen et al. 2005; Otsuka 2006; Lai et al. 2007). These techniques also applied to light scattering techniques (Hergeth 2000; Togkalidou et al. 2004; Levin 2006). Statistical analysis (Egelandsdal et al. 2001; Roggo et al. 2003) and ANN modelling (Guardani et al. 2002; Khanmohammadi et al. 2010) have also been emerged.
Potential of chemometrics Chemometric techniques can contribute very much to online particle sizing techniques by addressing the difficulties mentioned. E.g.  the group’s work on analysis of ultrasound sizing spectra using PCA, as mentioned in the “Case for Support”. Simulation of unknown or uncertain parameters   (Sadasivan and Rasmussen 1997; Li and Jiang 2005; Hipp et al. 1999; Babick et al. 2006; Trifkovic et al. 2009) Modelling of unclear principles   (Richter et al. 1998; Mougin et al. 2003; Parker et al. 2007; Liu 2009) Determination of sizing results or even the process directly   E.g. modelling of NIR-based particle sizing as mentioned The online detection and control of particle size as critical process parameter, together with the analytical techniques of chemometrics, can join the Process Analytical Technology (PAT) framework, help to understand the particulate processes profoundly, and ensure the critical quality attributes of final product.
Summary The advances of particle sizing are aiming at reliable techniques for online application to formidable industrial processes, especially the highly concentrated particulate processes. Though many potential solutions have been investigated, further improvements are expected for better accuracy and applicability, as well as good real-time performance to construct process control. Chemometrics tools has shown power and convenience in addressing the difficulties, and, together with online particle sizing, can join the PAT framework to enhance particulate processes.
Brief of wet milling for nanoparticles School of Process, Environmental and Materials Engineering
Stirred media milling   Dyno Multi Lab (WAB, Switzerland) W. Peukert’s group (Germany) studied stirred media milling with online ultrasonic sizing. Our group applied online ultrasonic (Ultrasizer, Malvern, UK) and dynamic light scattering (Zetasizer, Malvern, UK) sizing.
Wet milling variables and relationship to particle size Process, materials and machine variables (Knieke et al. 2009) Specific energy T otal energy supplied to milling chamber related to product mass, a measure of milling efficiency. Particle size will converge to a minimum even with further specific energy input (Sakthivel et al. 2008). Mill   tip speed   Lower tip speed generates smaller particle size with identical specific energy input, i.e. more efficient milling (He and Forssberg 2007; Kowalski et al. 2008). (Mende et al. 2003) didn’t observed significant relationship between them. Material flow rate   Faster flow rate reduces residence time in milling chamber and so larger particle size (Kowalski et al. 2008).
Wet milling variables and relationship to particle size Material concentration   Higher concentration leads to larger particle size (He and Forssberg 2007; Sakthivel et al. 2008). Material pH   pH increases when milling alumina, until a plateau between pH and particle size  (Mende et al. 2003). pH responds reversely when milling silica is ( Sakthivel et al. 2008 ). pH adjustment can be applied at any time without difference in the final particle size (Mende et al. 2003) Milling beads size   T ip speed contributes more when milling coarse particles, while beads size is more important when milling fine, especially submicron, particles ( Hennart et al. 2010 ). Bigger beads are better for milling coarse particles, and smaller ones are better for milling fine particles, in terms of efficiency ( He and Forssberg 2007 ). Milling beads density Larger beads density leads to smaller particle size (He  and Forssberg 2007 ). Others Milling beads filling ratio, different milling beads  (Mende et al. 2003) , particle dispersants (He et al. 2006) and particle compositions.
Wet milling strategy in terms of efficiency It’s believed that: There exists an  optimal stress energy  in terms of milling efficiency at given specific energy input. (Mende et al. 2003;  He and Forssberg 2007; Hennart et al. 2010) There exists an  an  optimal tip speed  for given materials concentration  ( He and Forssberg 2007 ). There exists an  optimal milling beads size  in terms of milling efficiency for a given targeted particle size  ( He and Forssberg 2007; Hennart et al. 2010).
Population balance modelling of wet milling The model targets at the product quality as a function of the initial material properties and the operational conditions  (France 2004). Milling can be defined by  breakage and agglomeration kinetics , and characterized by the hydrodynamic conditions inside the grinding chamber, which can be modelled with Population Balance (PB) (France 2004). There’s  a transition from  deagglomeration of agglomerates  to the  breakage of primary particles  (Bilgili et al. 2006). Optimal stability conditions (in terms of agglomeration) could be determined for desired particle size (Sommer et al. 2006). The breakage rate is relevant to the fed particle size, and has a  delay  due to fatigue and damage accumulation , so time-variant PB model should be adopted (Meloy and Williams 1992; Bilgili et al. 2006). There’s a  minimal particle size  achievable for certain materials and machine, when no more crystal defects can be generated and no sufficient stress energy can be accumulated (Knieke et al. 2009). There’s also a limit caused by  increasing viscosity  during milling that dissipates the stress energy (Knieke et al. 2010).
Summary Wet milling is a very complex process, and change of any process variable may have impact on many others. The process hasn’t been fully understood, and controversial results exist. It could be a multi-objective problem anticipating desired particle size and maximum efficiency. Population balance (PB) model could help in more profound comprehension of wet milling.
Thank you ! School of Process, Environmental and Materials Engineering

Online particle sizing for wet processes

  • 1.
    Review of onlineparticle sizing for wet processes and Brief of wet milling for nanoparticles Tian Lin Institute of Particle Science & Engineering University of Leeds Leeds, UK School of Process, Environmental and Materials Engineering 14/12/2010
  • 2.
    Introduction The qualityand performance of particle-related products rely significantly to the particle properties, especially the particle size. This presentation reviews the current methodologies and previous practices, and discuss the difficulties faced in online particle sizing.
  • 3.
    Main particle sizingtechniques Optics-based Laser Diffraction (LD) / Static Laser Scattering (SLS) Dynamic Light Scattering (DLS) / Photon Correlation Spectroscopy (PCS) / Quasi-Elastic Light Scattering (QELS) Turbidimetry Near-InfraRed (NIR) Acoustics-based Ultrasound Image-based Electron microscopy NIR imaging
  • 4.
    Optics-based Laser diffraction(LD) Mastersizer 2000 (Malvern, UK) Scores of nm to a few mm Requires dilution; Can detect flowing samples ; Assumes spherical particles Dynamic light scattering (DLS) Less than one nm to a few μ m Requires dilution; Requires still samples ; Assumes spherical particles Zeta sizer Nano (Malvern, UK) (backscattering, flow cell)
  • 5.
    Optics-based Turbidimetry Detectsunder multiple wavelengths, solved by nonlinear regression (Tontrup et al. 2000) Less than one μ m to hundreds of μ m Requires dilution; Or by backscattering scheme (Tontrup et al. 2000) Near-infrared (NIR) Modelled with numerical algorithms (Frake et al. 1998) between spectra (reflectance vs. wavelength) and mean particle size or distribution (O’Neil et al. 2003) 200-220nm (Higgins et al. 2003), 700-1300nm (Lai et al. 2007), >20 μ m (Santos et al. 1998) Turbiscan Online (Formulaction, France ) (by backscattering and considering multiple scattering)
  • 6.
    Acoustics-based Ultrsound Detectsultrasound attenuation in terms of frequency Evaluated by superposition of energy loss by individual particles (ECAH), or additive of various energy loss ( extinction) (Shukula et al. 2010) About ten nm to about one mm DT500 (Dispersion Technology, UK) (online) Can be applied to highly concentrated samples; Can be applied to electrically high-conductive samples ; Insensitive to hydrodynamic factors Requires many physical parameters of the particles and medium; Interparticle interactions to be considered (Shukula et al. 2010); Respond to up to a critical concentration depending on the materials (Hipp et al. 2002); Long measurement period of minutes, but can be shortened to seconds with pulsed wave (see the “Case of Support”)
  • 7.
    Image-based SEM Electronmicroscopy Provides particle visualisation and morphology info Scanning Electron Microscopy (SEM), Transmission Electron Microscopy (TEM), Atomic Force Microscopy (AFM) Requires time-consuming image processing, and subject to statistical error Requires dried samples Near-infrared imaging NIR microscopy, using PCA and PLS (Clarke 2004) NIR tomography, giving particle size distribution (PSD) by Mie theory (Li and Jiang 2005) Spotlight 400N FT-NIR (PerkinElmer, US)
  • 8.
  • 9.
    Sampling and ConditioningAlternative methods to conquer formidable process conditions and satisfy the sizing instrument prerequisites . For example, online continuous dilution designs to address highly concentrated samples by mixing chamber (Hobbel et al. 1991; Florenzano et al. 2005) or parallel stages (Sacoto et al. 1998; Garcia-Rubio et al. 1999; Celis and Garcia-Rubio 2002) :
  • 10.
    Online particle sizecontrol Model-based control strategy has been developed or simulated recently, without online particle sizing and real-time feedback . Generally a mechanical (Srour et al. 2009) or population balance (PB) (Aamir et al. 2009) model is constructed to predict particle size distribution or particle nucleation and growth kinetics (Shi et al. 2005). With the particle size (or nucleation and growth) prediction based on these models, process variable profiles were dynamically optimised .
  • 11.
    Representative work ononline particle sizing for wet processes Laser diffraction (LD) E.g. (Biggs and Lant 2000) (diluted in advance) Dynamic light scattering (DLS) E.g. (Wang et al. 2009) (<5mL/min) Fibre optic DLS E.g. (Chen 2009) (automatically diluted) Turbidimetry E.g. (Crawley et al. 1996; Crawley et al. 1997; Gruy and Cournil 2004) and (Tontrup et al. 2000) (backscattering) Near-infrared (NIR) E.g. (Higgins et al. 2003) and (Abismail et al. 2000; Tourbin and Frances 2007) (backscattering, multiple scattering) Frequency Domain Photon Migration (FDPM) E.g. (SevickMuraca et al. 1997) Focused Beam Reflectance Measurement (FBRM) E.g. (Dowding et al. 2001 ; Chen et al. 2009 ; Trifkovic, Sheikhzadeh et al. 2009; Xalter and Muelhaupt 2010) Multi-wavelength E.g. (Marioth, Koenig et al. 2000) Ultrasound E.g. ( Mende et al. 2003; Stenger et al. 2005; Wang et al. 2009)
  • 12.
    Difficulties from generalparticle sizing High concentration Multiple scattering, and interparticle interactions (e.g. Coulombic force) Dilution may change particle size (e.g. in crystallisation) Morphology Nonsphere (aspect ratio, orientation) Aggregation Due to collision in Brownian or rheological motions etc. Surface-active agents or agitation force
  • 13.
    Difficulties special inonline particle sizing Rheological factors Cause interparticle interactions Inhomogeneity Concentration gradient by sediment, and particle separation by different size or specimen T rending results, and unrepresentative samples Uncertain parameters Unknown or fluctuating parameters due to mixtures with additives or varying environment
  • 14.
    Advances to addressthe difficulties --- Multiple scattering Modelling and evaluation Radiative Transfer Equation (RTE) Random walk Diffusing Wave Spectroscopy (DWS) Monte-Carlo ray-tracing FDPM, NIR backscattering Suppression Backscattering Fibre optic DLS Cross correlation Dual-beam, Dual-colour, 3D, One-beam
  • 15.
    Radiative transfer equationDescribes propagation of multiply scattered electromagnetic radiation (Kokhanovsky 2002) Aiming at reflection and scattering coefficients by solving the inverse problem, then related to refractive index, particle size and volume fraction etc. Single-scattering be evaluated first by e.g. Mie theory, then multiple-scattering be considered by e.g. extended Hartel’s theory (Vargas and Niklasson 1997; Velazco-Roa and Thennadil 2007) Analytic solutions only for special situations, while numerical ones time-consuming Application to instruments, e.g. laser diffraction (Schnablegger and Glatter 1995; Lehner et al. 1998)
  • 16.
    Random walk modeland DWS Random walk (Rogers 2008 ) Each photon is assumed to execute a random walk through the sample Light by all paths independently contribute to the detection Described by transport mean free path (distance between two scattering, related to individual particles scattering properties and particle concentration) , and possibility of certain photon travel length To solve a diffusion equation Diffusing wave spectroscopy (DWS) Measurements as DLS but interpreted by random walk (Scheffold 2002). DWS ResearchLab (LS Instruments, Switzerland)
  • 17.
    Monte-Carlo ray tracingSimulates light multiple scattering (Bergougnoux et al. 1996; Aberle et al. 1999 ) Simulates an aspect of the light propagation ( Lu et al. 1995; Gay et al. 2010) Simulates for parameters ( Arancibia-Bulnes and Ruiz-Suarez 1999; Rogers 2008)
  • 18.
    FDPM Frequency DomainPhoton Migration (FDPM) Propagates sinusoidally modulated light through the samples, and detects its attenuation and phase-shift after multiple scattering Utilises multi-wavelength measurements to calculate particle concentration simultaneously by nonlinear regression (Richter et al. 1998) Sample must be concentrated to cause multiple scattering, but not too dense to avoid interparticle interaction (SevickMuraca et al. 1997)
  • 19.
    Backscattering, Fibre opticDLS and FBRM Fibre optic DLS Gives only relative change of particle size Results depending on concentration, and nonlinear to DLS sizing, esp. for high concentration The p robe will influence Brownian motions of particles nearby (Thomas 1989; Thomas and Dimonie 1990; Sadasivan and Rasmussen 1997) Focused Beam Reflectance Measurement (FBRM) Detects particle chord-length rather than diameter or size (Dowding et al. 2001) Severely disturbed by stirring and bubbles, and influenced by the probe angle (Dowding et al. 2001) FOQELS (Brookhaven, UK) Lasentec FBRM (Mettler-Toledo, US)
  • 20.
    Cross correlation Photoncorrelation function of single scattering doesn’t depend on laser wavelength or wave vector, but only on scattering wave vector, while multiple scattering does. Thus cross correlation between light scattered by the identical scattering volumes and scattering vectors with different optical geometries can eliminate multiple scattering effects. Dual-beam : Two laser systems at opposite positions. Dual-colour : Two wavelengths (Schatzel et al. 1990; Schatzel and SchulzDuBois 1991)
  • 21.
    Cross correlation 3D: Utilises the third dimension, but with the same wavelength ( Overbeck et al. 1997) One-beam : Spatial cross-correlation of scattered light which produces larger speckle than multiple scattering does ( Meyer et al. 1997; Nobbmann et al. 1997; Adorjan et al. 1999 ) Results depends on concentration (Schroer et al. 2007) Nanophox (Sympatec, Germany) (3D)
  • 22.
    Advances to addressthe difficulties --- Morphology Nonspherical effects at resonance region when particle sizes are comparable to light wavelength Radiative transfer equation (RTE) (Mishchenko 2009; Velazco-Roa et al. 2008; Mishchenko 2009) T-matrix and superposition Polarization fluctuation spectroscopy (PFS) Cross-correlation of two polarised laser to recover particle aspect ratio, also the radius of equivalent volume sphere (Walker et al. 2004; Chang et al. 2002). Requires sufficient dilution to avoid multiple scattering (Gay et al. 2010) realised polarization imaging, and got particle size and morphology info by polarization pattern analysis. The group’s work of on-line crystal morphology measurement and control by imaging, as mentioned in the “Case for Support”.
  • 23.
    Advances to addressthe difficulties --- Aggregation & Interparticle interaction Aggregation (Sorensen 2001) reviewed light scattering by fractal aggregates . (Iwai et al. 1998) applied polydisperse random medium as the model of fractal aggregations . (Mishchenko et al. 1996) applied superposition T-matrix approach for computing light scattering by composite/aggregated particles . (Soos et al. 2009) took into account the intracluster multiple scattering by solving T-matrix, in a population balance (PB) model. Interparticle interaction Some physical models of interparticle interactions have been set up, with the assumption of hard spherical particles. E.g. (Richter et al. 1998; Tourbin and Frances 2007) applied Percus-Yevick model for approximating spatial correlation of particles in monodisperse suspension. Interparticle interactions due to hydrodynamic factors can also be modelled and taken into account, e.g. (Richter et al. 1998).
  • 24.
    Advances to addressthe difficulties --- Uncertain parameters Multi-wavelength Detects intensity attenuation of laser of different wavelengths (Marioth, Koenig et al. 2000) Particle number concentration can be solved together with the particle size Usage of a third wavelength can avoid systematic errors, or determine another uncertain parameter FDPM and turbidimetry-based sizing also apply multi-wavelength techniques
  • 25.
    Potential of chemometricsNIR Chemometric tools applied to NIR instruments for modelling between spectra and particle size info, e.g. Principal Component Analysis (PCA), Partial Least Square (PLS), Multi-Linear Regression (MLR) etc. (Gossen et al. 1993; O'Neil et al. 1998; Otsuka et al. 2003; Clarke 2004; Rantanen et al. 2005; Otsuka 2006; Lai et al. 2007). These techniques also applied to light scattering techniques (Hergeth 2000; Togkalidou et al. 2004; Levin 2006). Statistical analysis (Egelandsdal et al. 2001; Roggo et al. 2003) and ANN modelling (Guardani et al. 2002; Khanmohammadi et al. 2010) have also been emerged.
  • 26.
    Potential of chemometricsChemometric techniques can contribute very much to online particle sizing techniques by addressing the difficulties mentioned. E.g. the group’s work on analysis of ultrasound sizing spectra using PCA, as mentioned in the “Case for Support”. Simulation of unknown or uncertain parameters (Sadasivan and Rasmussen 1997; Li and Jiang 2005; Hipp et al. 1999; Babick et al. 2006; Trifkovic et al. 2009) Modelling of unclear principles (Richter et al. 1998; Mougin et al. 2003; Parker et al. 2007; Liu 2009) Determination of sizing results or even the process directly E.g. modelling of NIR-based particle sizing as mentioned The online detection and control of particle size as critical process parameter, together with the analytical techniques of chemometrics, can join the Process Analytical Technology (PAT) framework, help to understand the particulate processes profoundly, and ensure the critical quality attributes of final product.
  • 27.
    Summary The advancesof particle sizing are aiming at reliable techniques for online application to formidable industrial processes, especially the highly concentrated particulate processes. Though many potential solutions have been investigated, further improvements are expected for better accuracy and applicability, as well as good real-time performance to construct process control. Chemometrics tools has shown power and convenience in addressing the difficulties, and, together with online particle sizing, can join the PAT framework to enhance particulate processes.
  • 28.
    Brief of wetmilling for nanoparticles School of Process, Environmental and Materials Engineering
  • 29.
    Stirred media milling Dyno Multi Lab (WAB, Switzerland) W. Peukert’s group (Germany) studied stirred media milling with online ultrasonic sizing. Our group applied online ultrasonic (Ultrasizer, Malvern, UK) and dynamic light scattering (Zetasizer, Malvern, UK) sizing.
  • 30.
    Wet milling variablesand relationship to particle size Process, materials and machine variables (Knieke et al. 2009) Specific energy T otal energy supplied to milling chamber related to product mass, a measure of milling efficiency. Particle size will converge to a minimum even with further specific energy input (Sakthivel et al. 2008). Mill tip speed Lower tip speed generates smaller particle size with identical specific energy input, i.e. more efficient milling (He and Forssberg 2007; Kowalski et al. 2008). (Mende et al. 2003) didn’t observed significant relationship between them. Material flow rate Faster flow rate reduces residence time in milling chamber and so larger particle size (Kowalski et al. 2008).
  • 31.
    Wet milling variablesand relationship to particle size Material concentration Higher concentration leads to larger particle size (He and Forssberg 2007; Sakthivel et al. 2008). Material pH pH increases when milling alumina, until a plateau between pH and particle size (Mende et al. 2003). pH responds reversely when milling silica is ( Sakthivel et al. 2008 ). pH adjustment can be applied at any time without difference in the final particle size (Mende et al. 2003) Milling beads size T ip speed contributes more when milling coarse particles, while beads size is more important when milling fine, especially submicron, particles ( Hennart et al. 2010 ). Bigger beads are better for milling coarse particles, and smaller ones are better for milling fine particles, in terms of efficiency ( He and Forssberg 2007 ). Milling beads density Larger beads density leads to smaller particle size (He and Forssberg 2007 ). Others Milling beads filling ratio, different milling beads (Mende et al. 2003) , particle dispersants (He et al. 2006) and particle compositions.
  • 32.
    Wet milling strategyin terms of efficiency It’s believed that: There exists an optimal stress energy in terms of milling efficiency at given specific energy input. (Mende et al. 2003; He and Forssberg 2007; Hennart et al. 2010) There exists an an optimal tip speed for given materials concentration ( He and Forssberg 2007 ). There exists an optimal milling beads size in terms of milling efficiency for a given targeted particle size ( He and Forssberg 2007; Hennart et al. 2010).
  • 33.
    Population balance modellingof wet milling The model targets at the product quality as a function of the initial material properties and the operational conditions (France 2004). Milling can be defined by breakage and agglomeration kinetics , and characterized by the hydrodynamic conditions inside the grinding chamber, which can be modelled with Population Balance (PB) (France 2004). There’s a transition from deagglomeration of agglomerates to the breakage of primary particles (Bilgili et al. 2006). Optimal stability conditions (in terms of agglomeration) could be determined for desired particle size (Sommer et al. 2006). The breakage rate is relevant to the fed particle size, and has a delay due to fatigue and damage accumulation , so time-variant PB model should be adopted (Meloy and Williams 1992; Bilgili et al. 2006). There’s a minimal particle size achievable for certain materials and machine, when no more crystal defects can be generated and no sufficient stress energy can be accumulated (Knieke et al. 2009). There’s also a limit caused by increasing viscosity during milling that dissipates the stress energy (Knieke et al. 2010).
  • 34.
    Summary Wet millingis a very complex process, and change of any process variable may have impact on many others. The process hasn’t been fully understood, and controversial results exist. It could be a multi-objective problem anticipating desired particle size and maximum efficiency. Population balance (PB) model could help in more profound comprehension of wet milling.
  • 35.
    Thank you !School of Process, Environmental and Materials Engineering