By
Namrata K Jadhav
(AssistantProfessor)
Department Of Chemical Engineering
Unit 1
Properties and handling of particulate solids
2.
CONTENT........
1.1 Particlecharacterization
1.2 Particle size measuring technologies
1.3 Particle size distribution
1.4 Mean particle size
1.5 Mixed particle sizes and size analysis
1.6 Specific surface of mixture
1.7 Average particle size
1.8 Number of particles in mixture
1.9 Properties of solid masses
1.10 Storage of solids (Bulk and Bin)
1.11 Angle of repose and angle of friction
1.12 Introduction to conveying of solids.
3.
1.1 Particle Characterization:Understanding the
Building Blocks of Matter
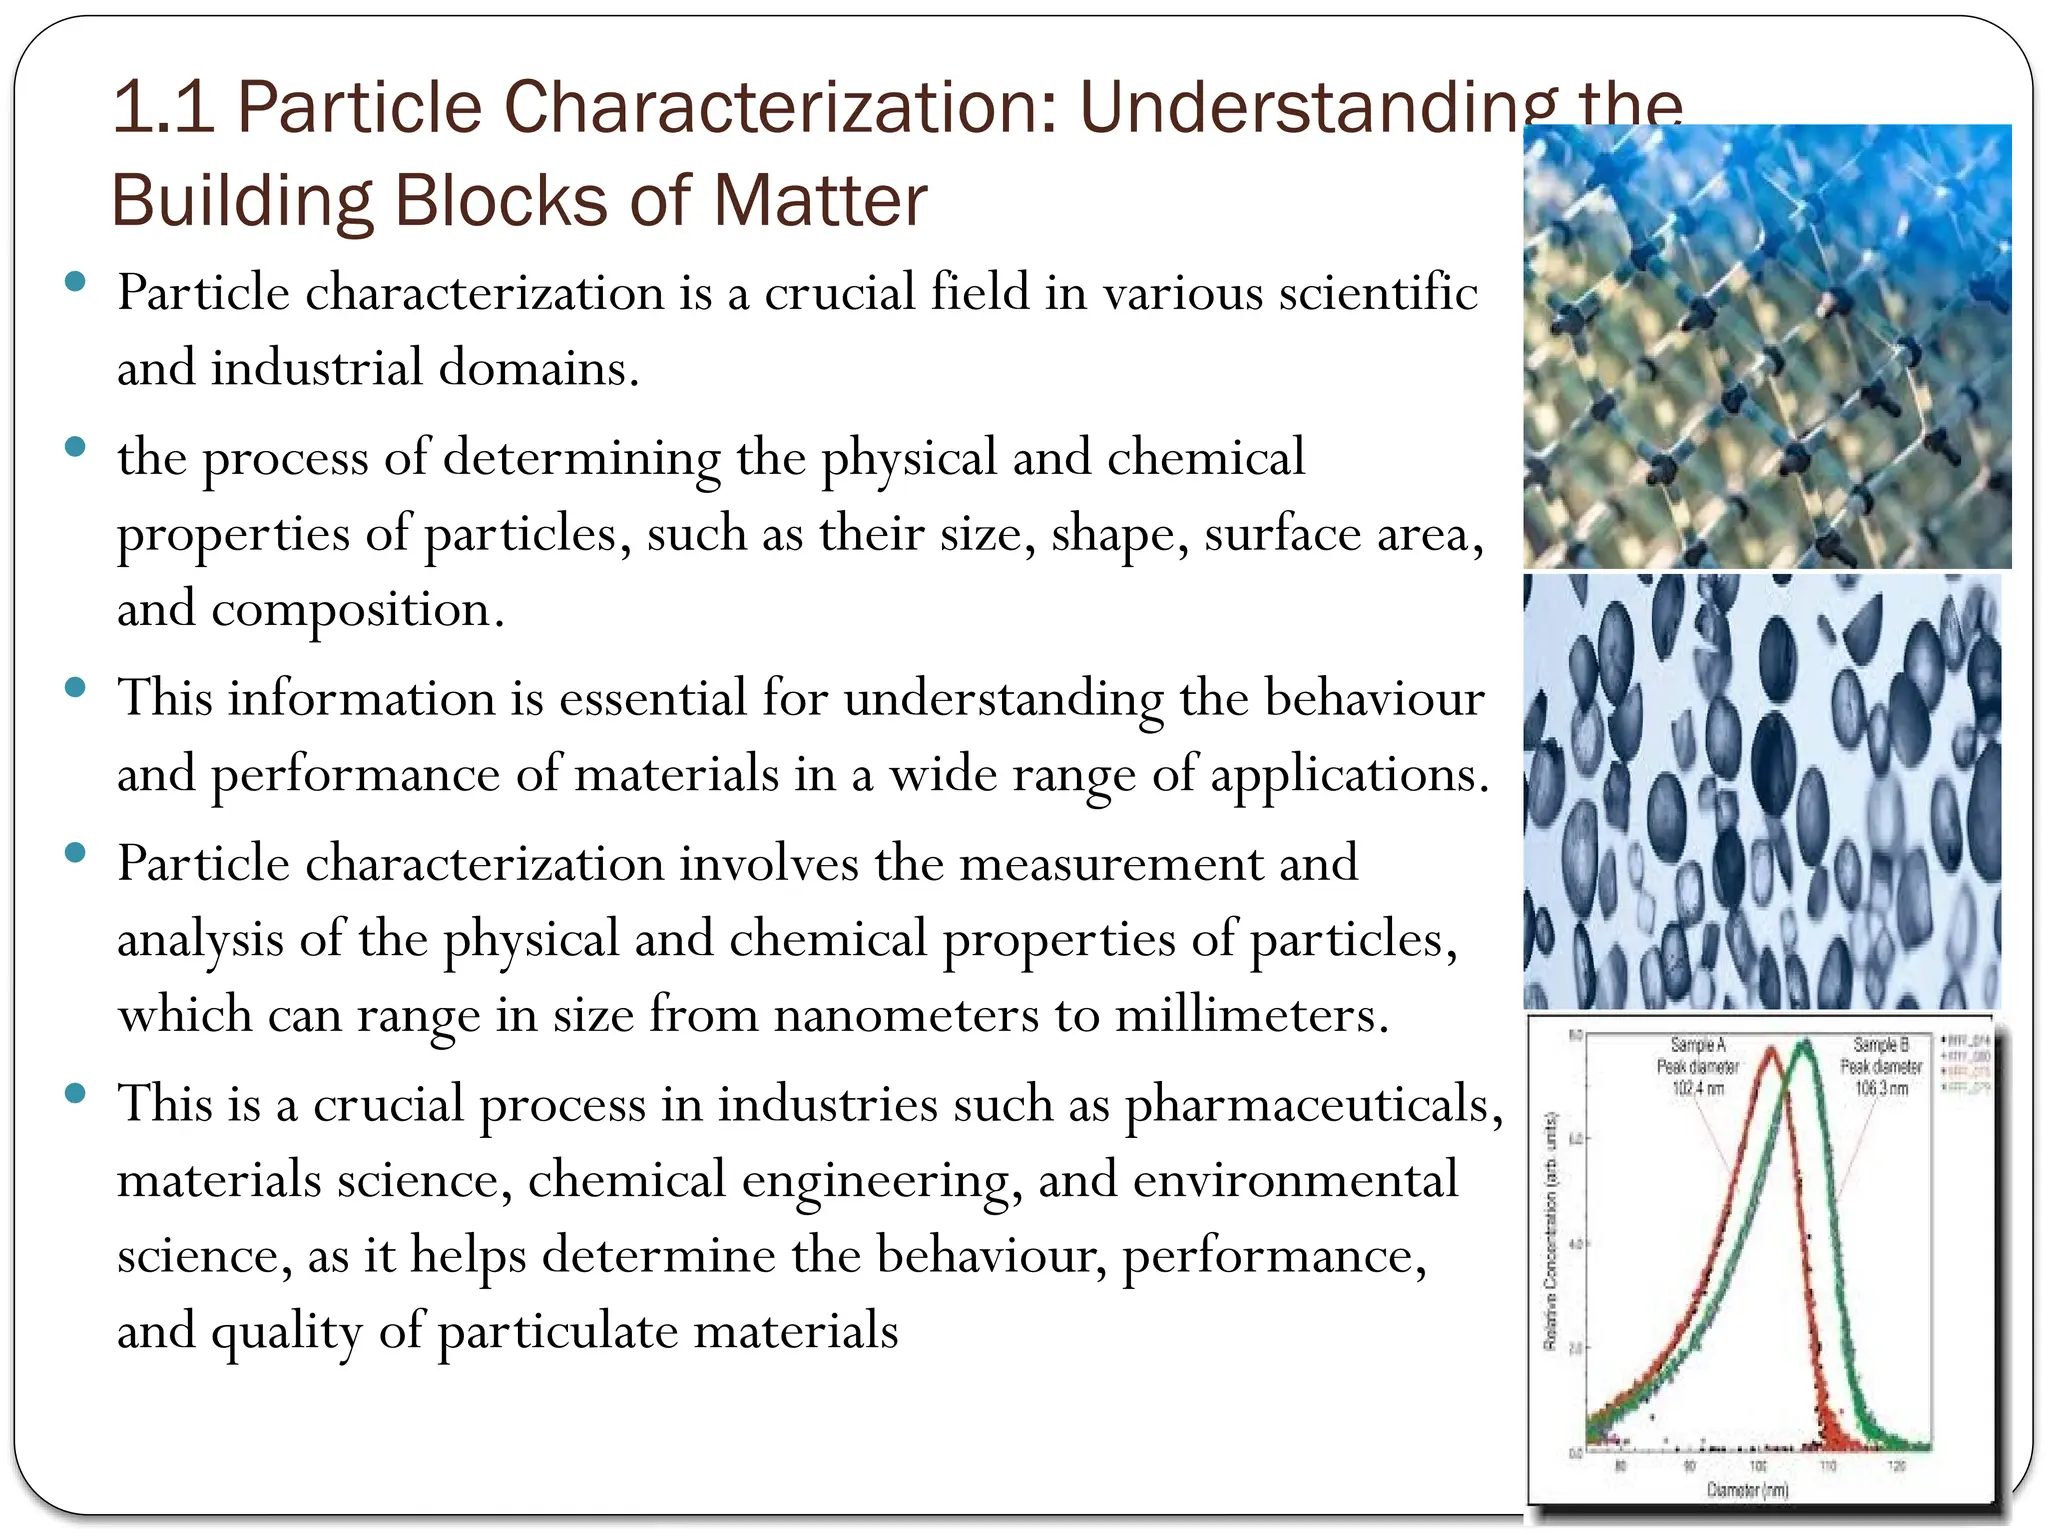
Particle characterization is a crucial field in various scientific
and industrial domains.
the process of determining the physical and chemical
properties of particles, such as their size, shape, surface area,
and composition.
This information is essential for understanding the behaviour
and performance of materials in a wide range of applications.
Particle characterization involves the measurement and
analysis of the physical and chemical properties of particles,
which can range in size from nanometers to millimeters.
This is a crucial process in industries such as pharmaceuticals,
materials science, chemical engineering, and environmental
science, as it helps determine the behaviour, performance,
and quality of particulate materials
4.
Key Parameters inParticle Characterization:
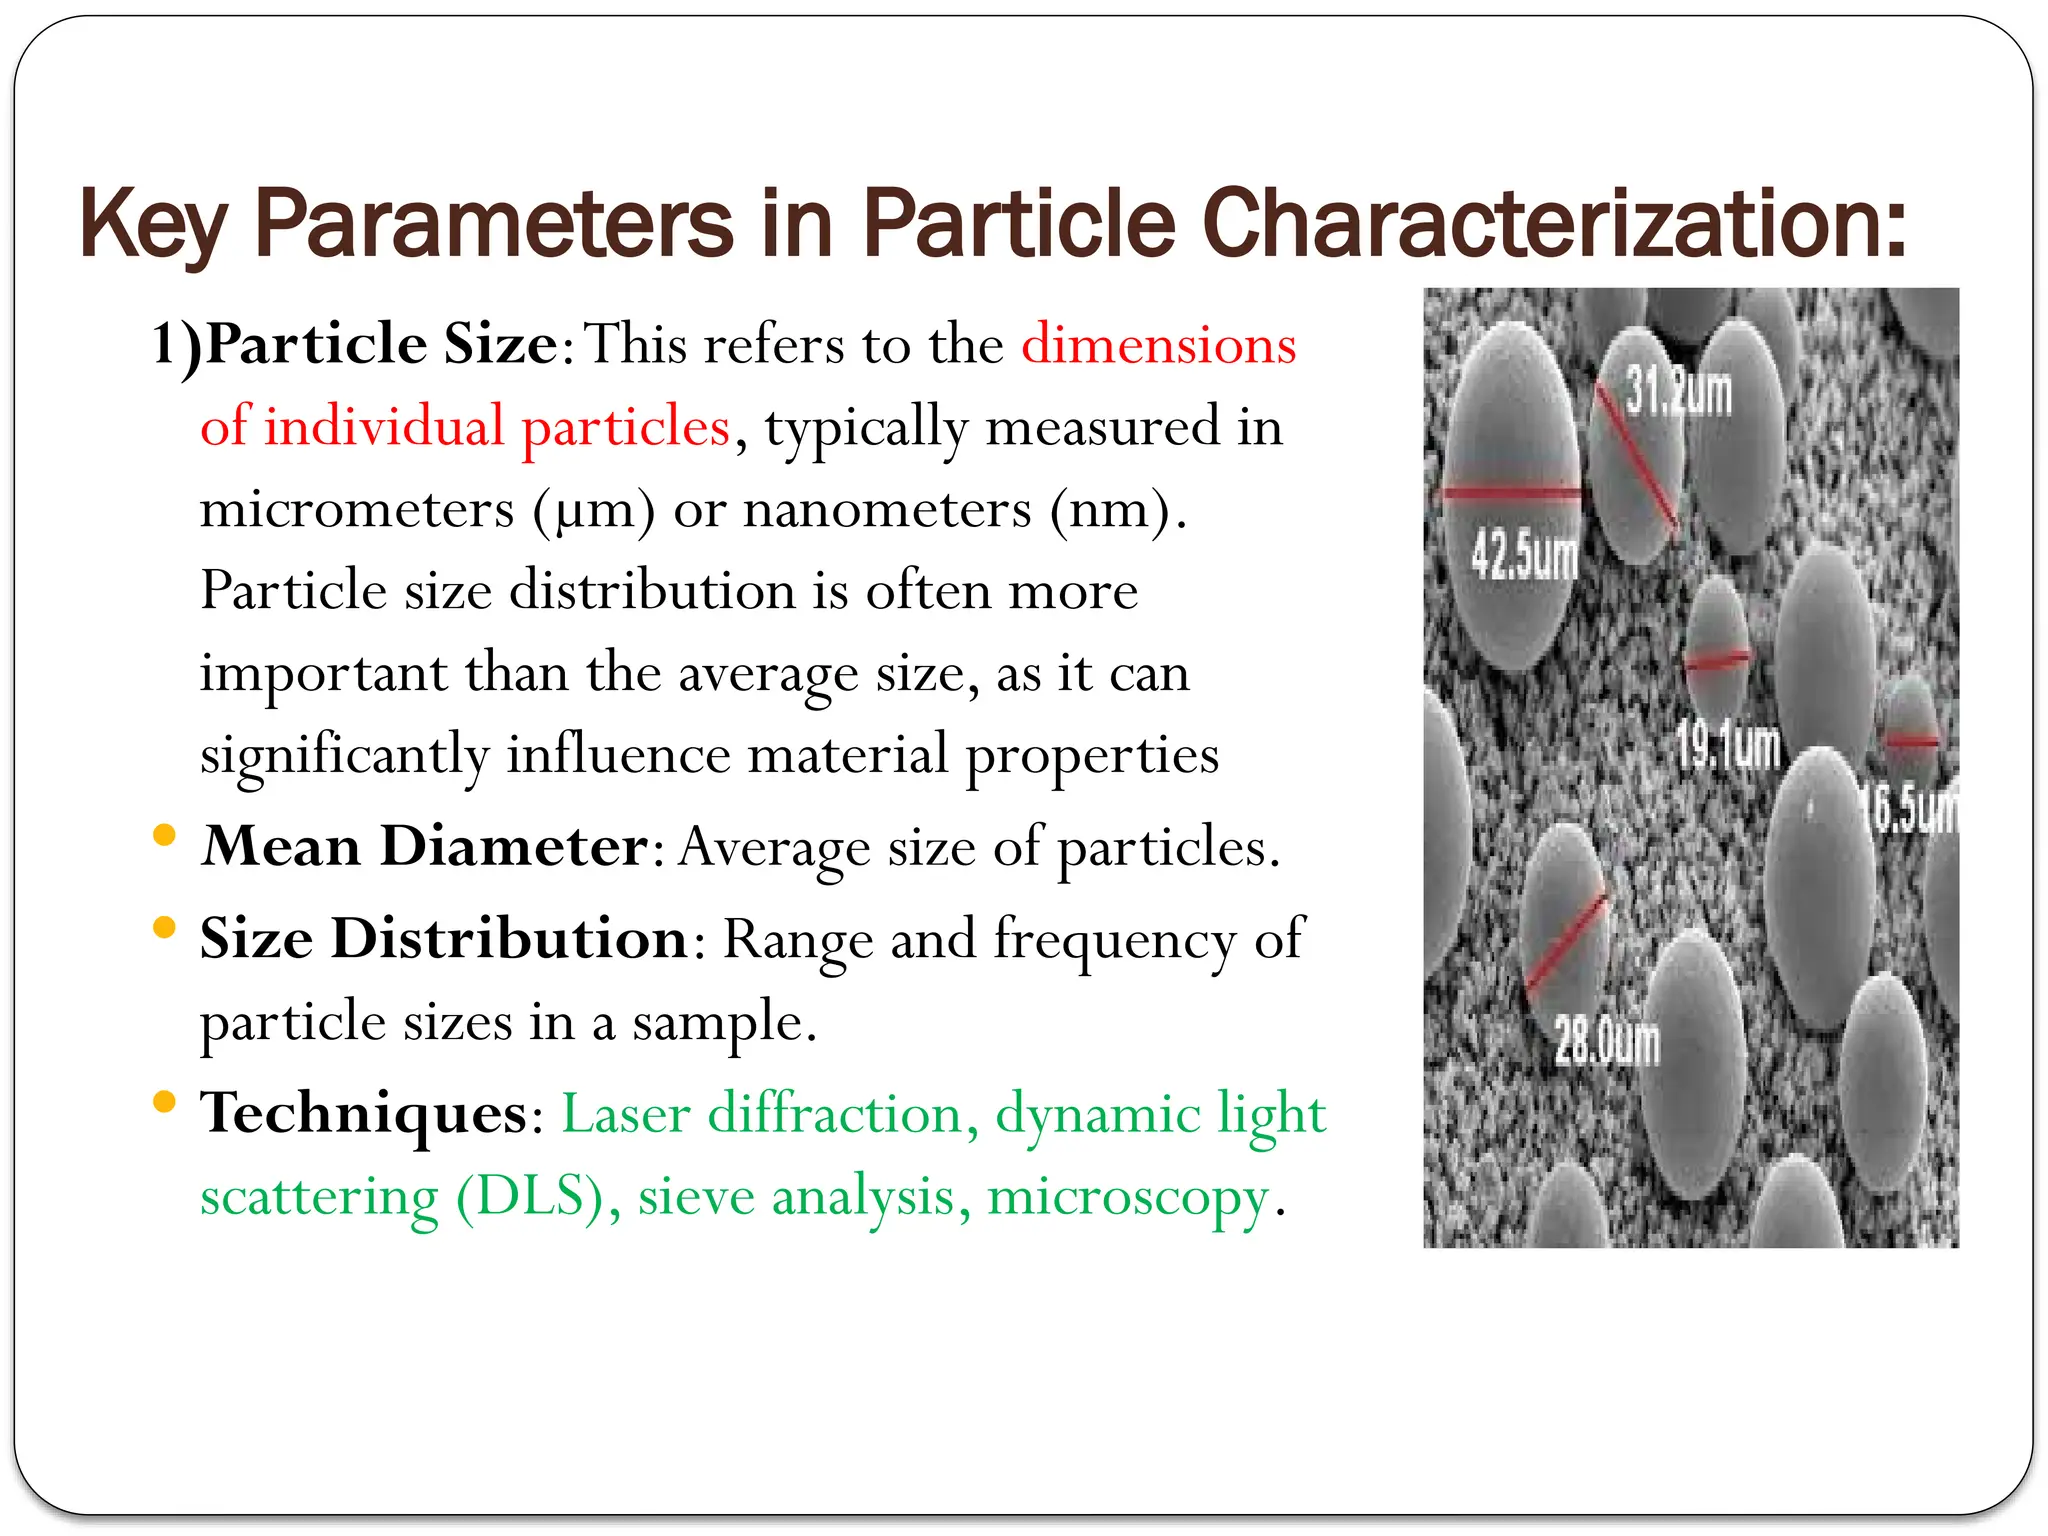
1)Particle Size:This refers to the dimensions
of individual particles, typically measured in
micrometers (µm) or nanometers (nm).
Particle size distribution is often more
important than the average size, as it can
significantly influence material properties
Mean Diameter:Average size of particles.
Size Distribution: Range and frequency of
particle sizes in a sample.
Techniques: Laser diffraction, dynamic light
scattering (DLS), sieve analysis, microscopy.
5.
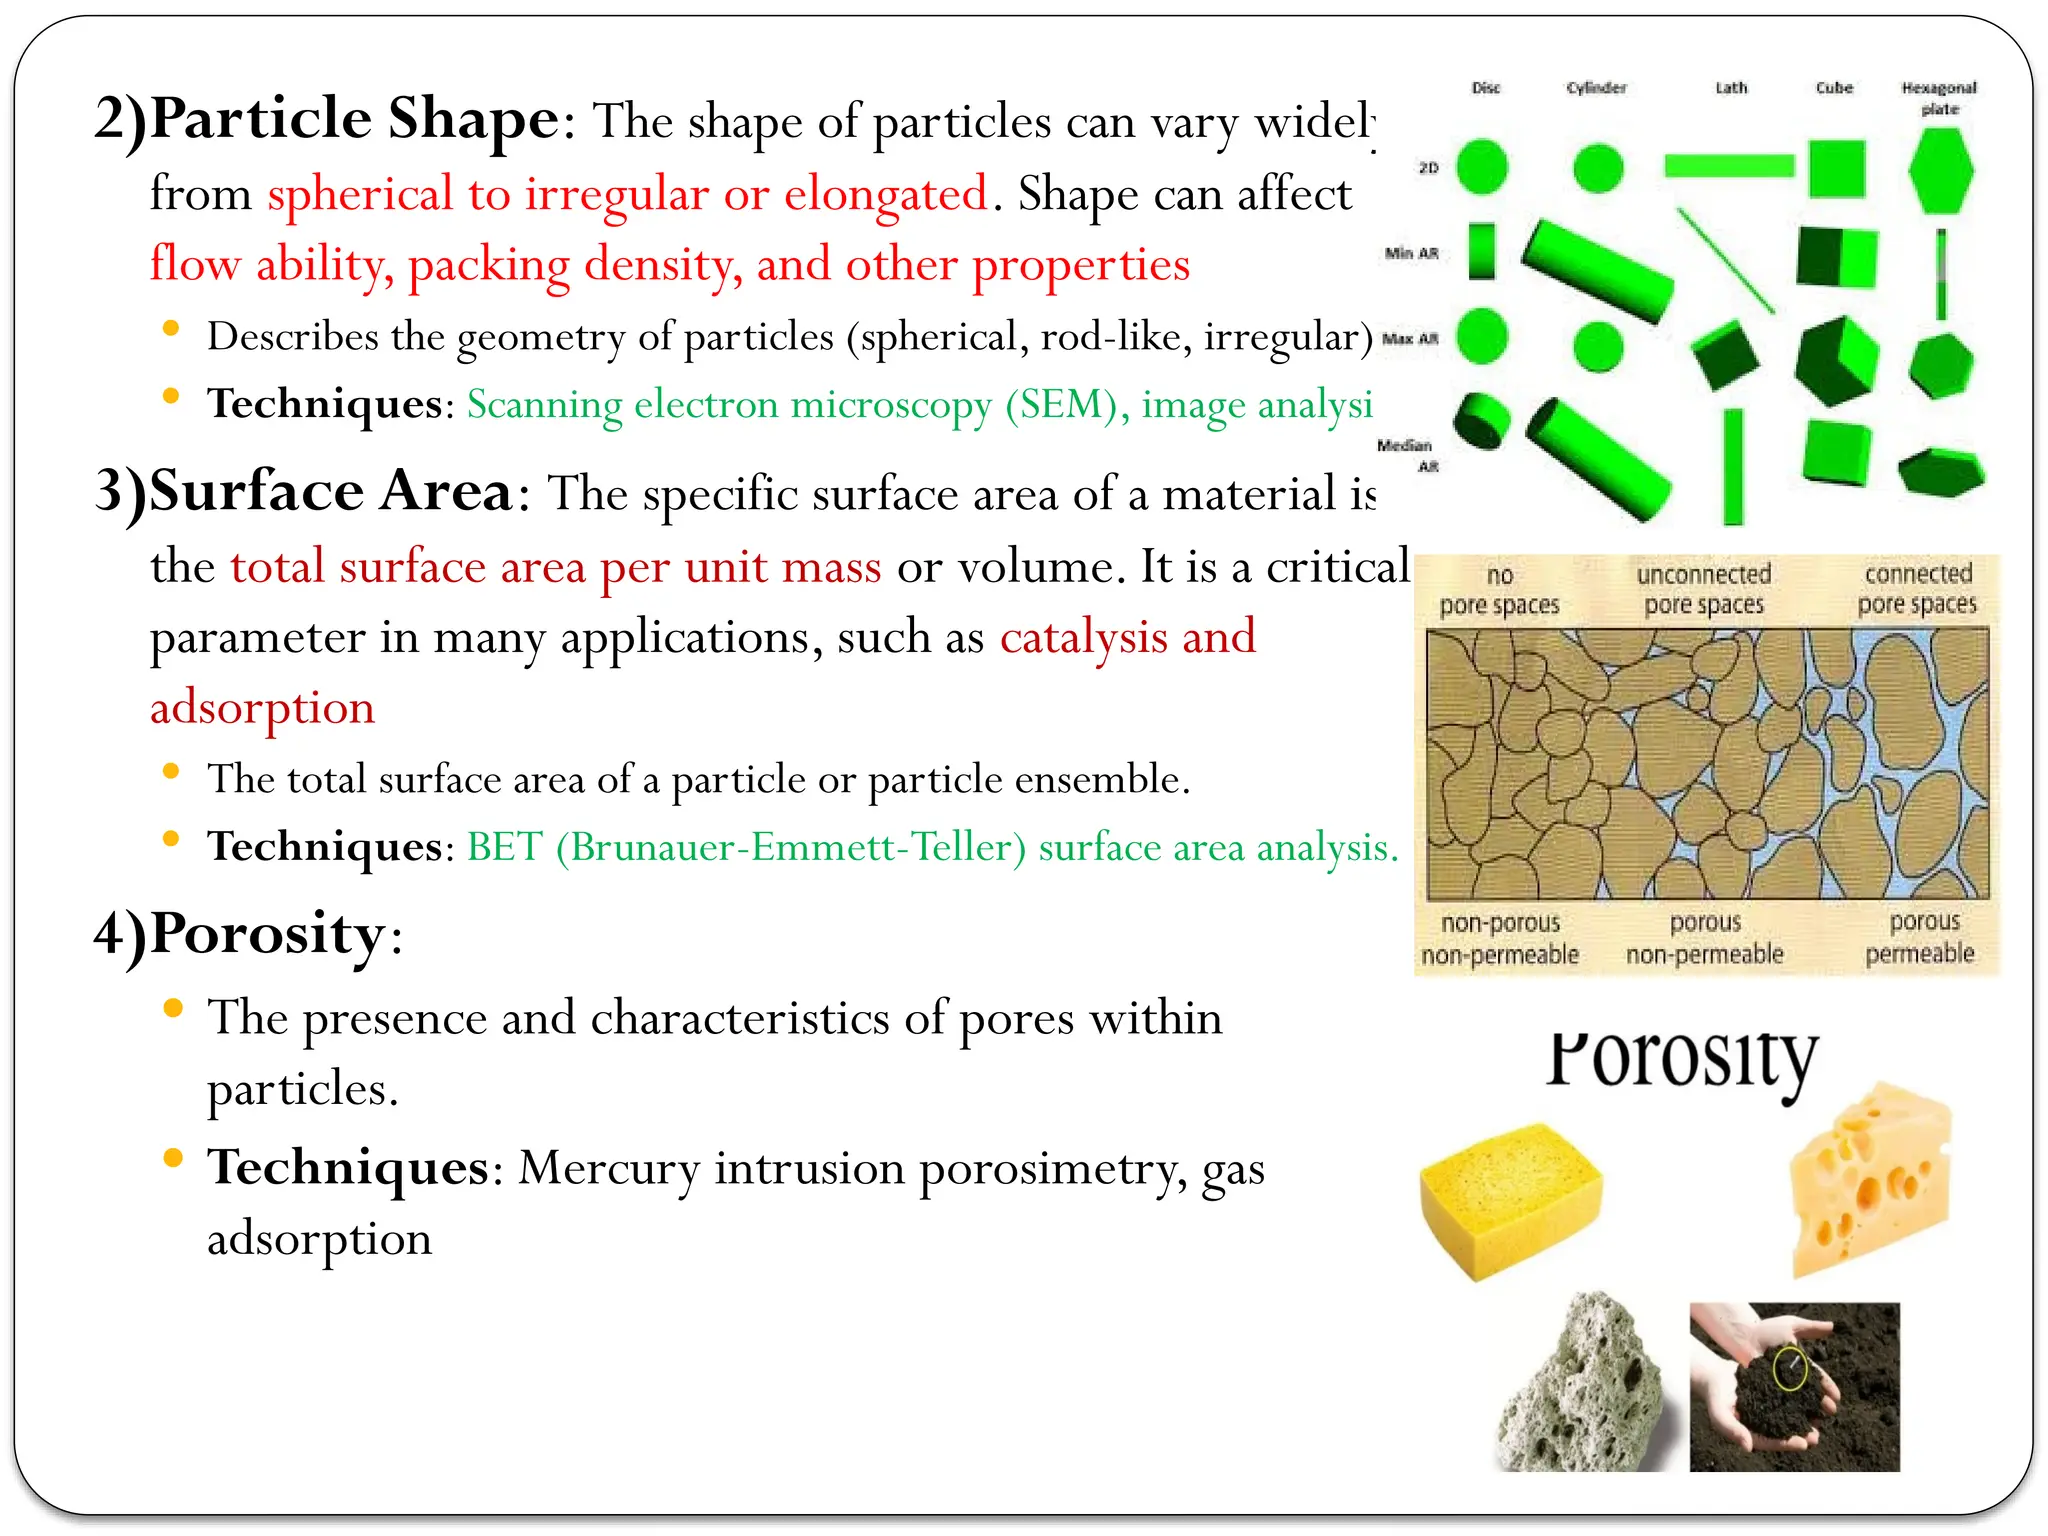
2)Particle Shape: Theshape of particles can vary widely,
from spherical to irregular or elongated. Shape can affect
flow ability, packing density, and other properties
Describes the geometry of particles (spherical, rod-like, irregular).
Techniques: Scanning electron microscopy (SEM), image analysis.
3)Surface Area: The specific surface area of a material is
the total surface area per unit mass or volume. It is a critical
parameter in many applications, such as catalysis and
adsorption
The total surface area of a particle or particle ensemble.
Techniques: BET (Brunauer-Emmett-Teller) surface area analysis.
4)Porosity:
The presence and characteristics of pores within
particles.
Techniques: Mercury intrusion porosimetry, gas
adsorption
6.
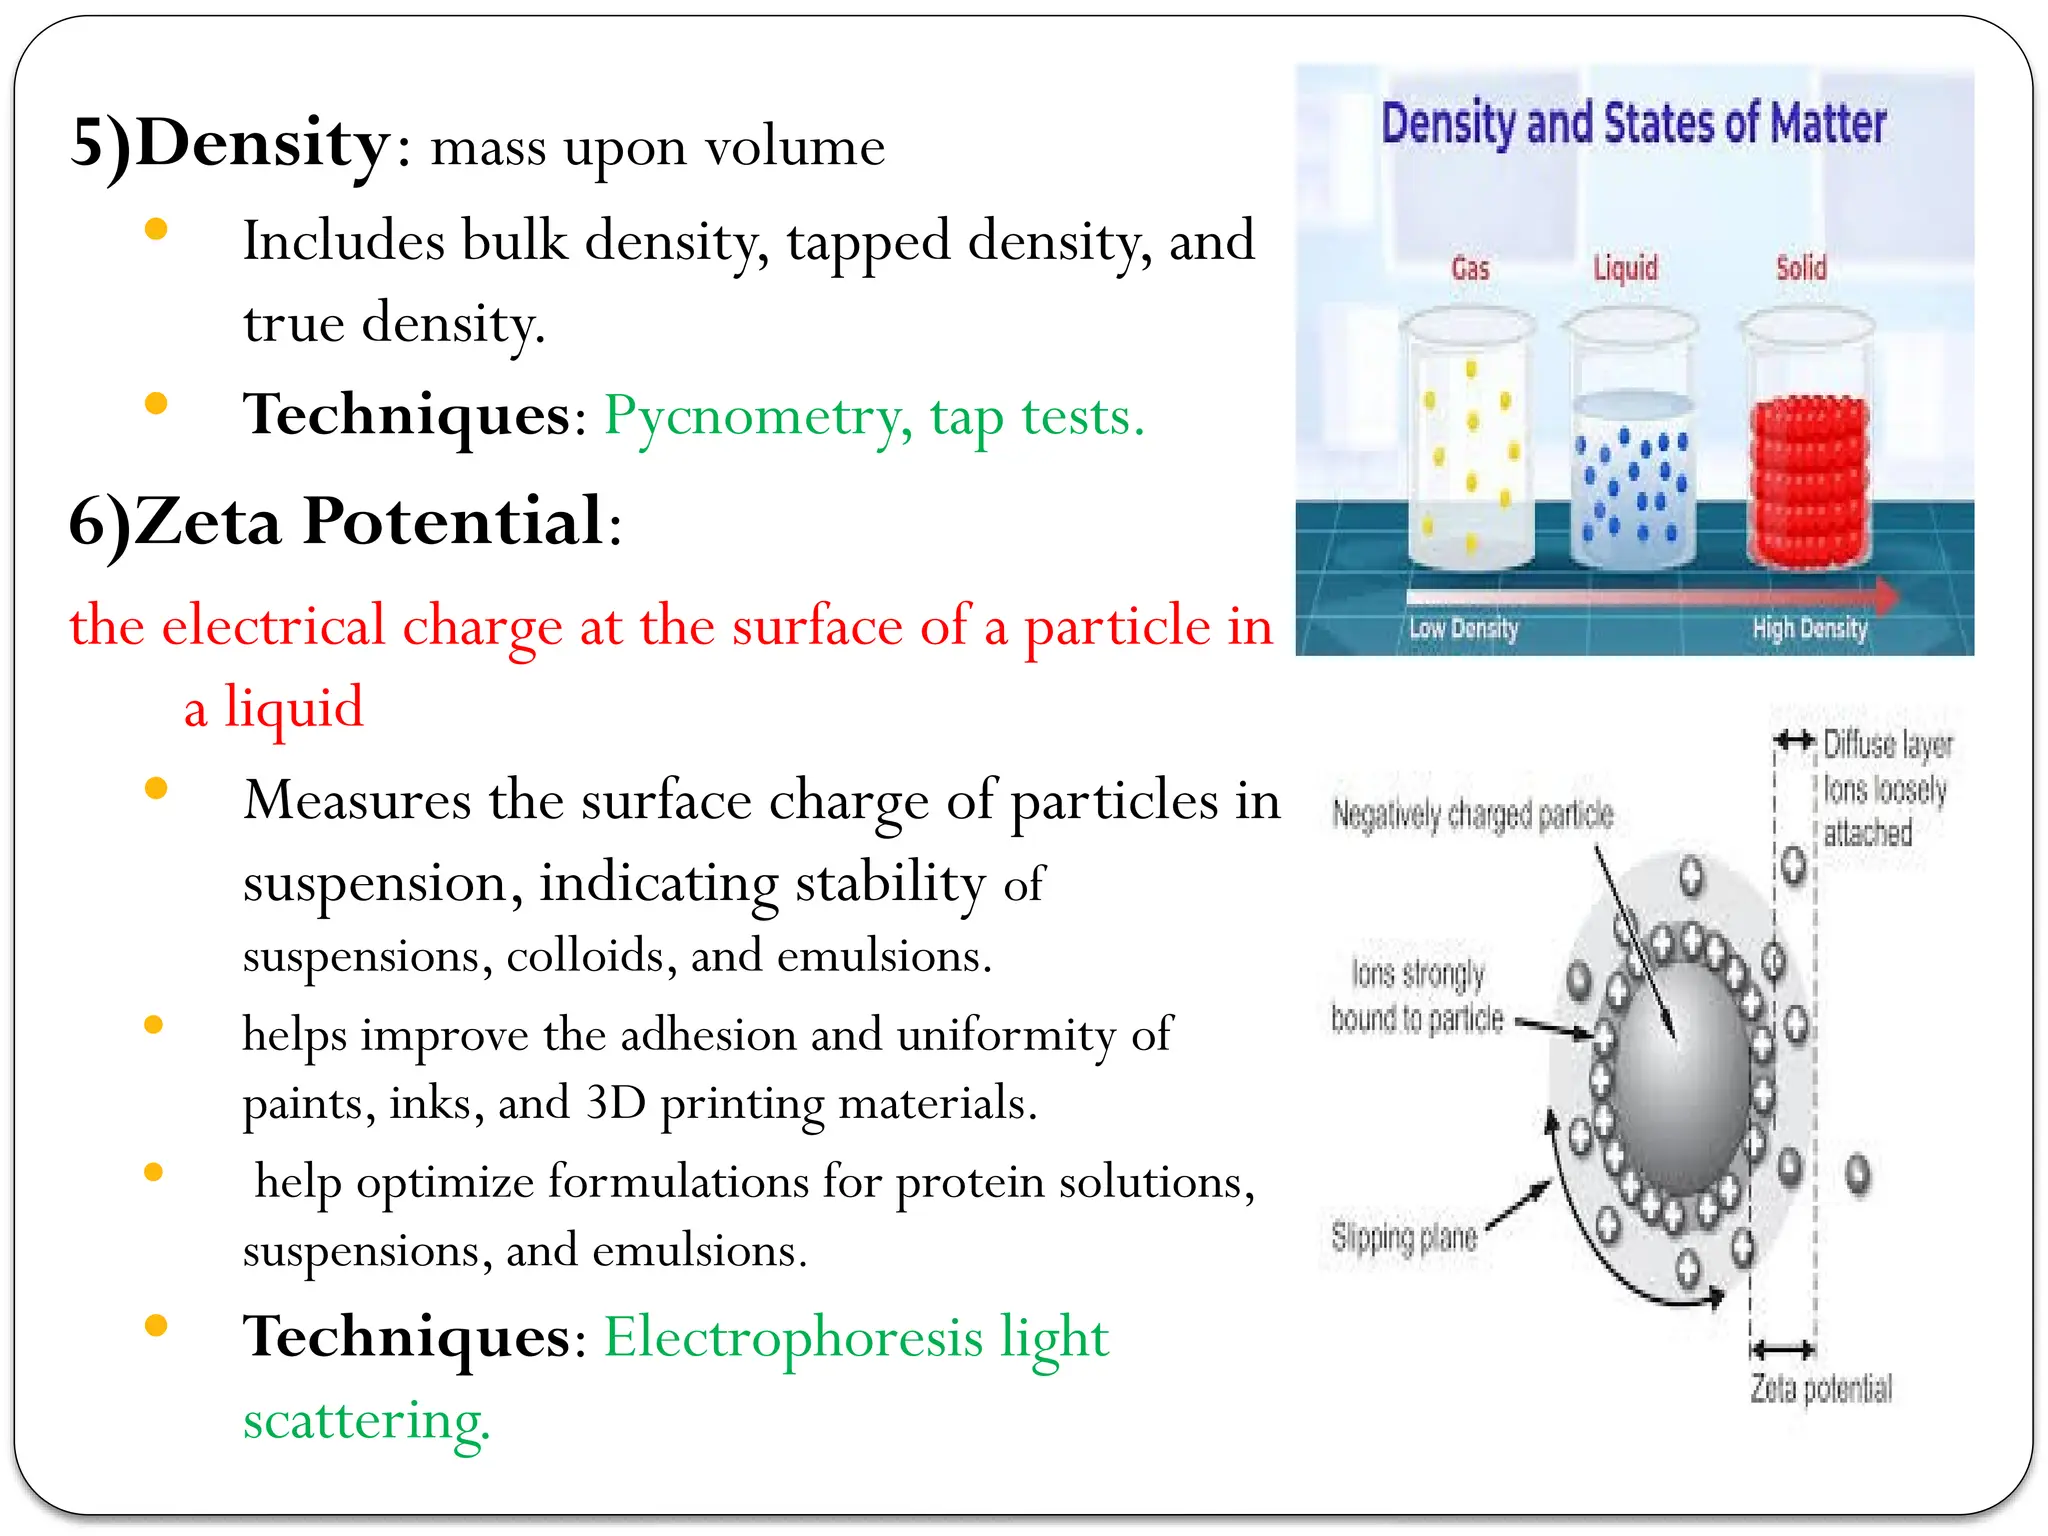
5)Density: mass uponvolume
Includes bulk density, tapped density, and
true density.
Techniques: Pycnometry, tap tests.
6)Zeta Potential:
the electrical charge at the surface of a particle in
a liquid
Measures the surface charge of particles in
suspension, indicating stability of
suspensions, colloids, and emulsions.
helps improve the adhesion and uniformity of
paints, inks, and 3D printing materials.
help optimize formulations for protein solutions,
suspensions, and emulsions.
Techniques: Electrophoresis light
scattering.
7.
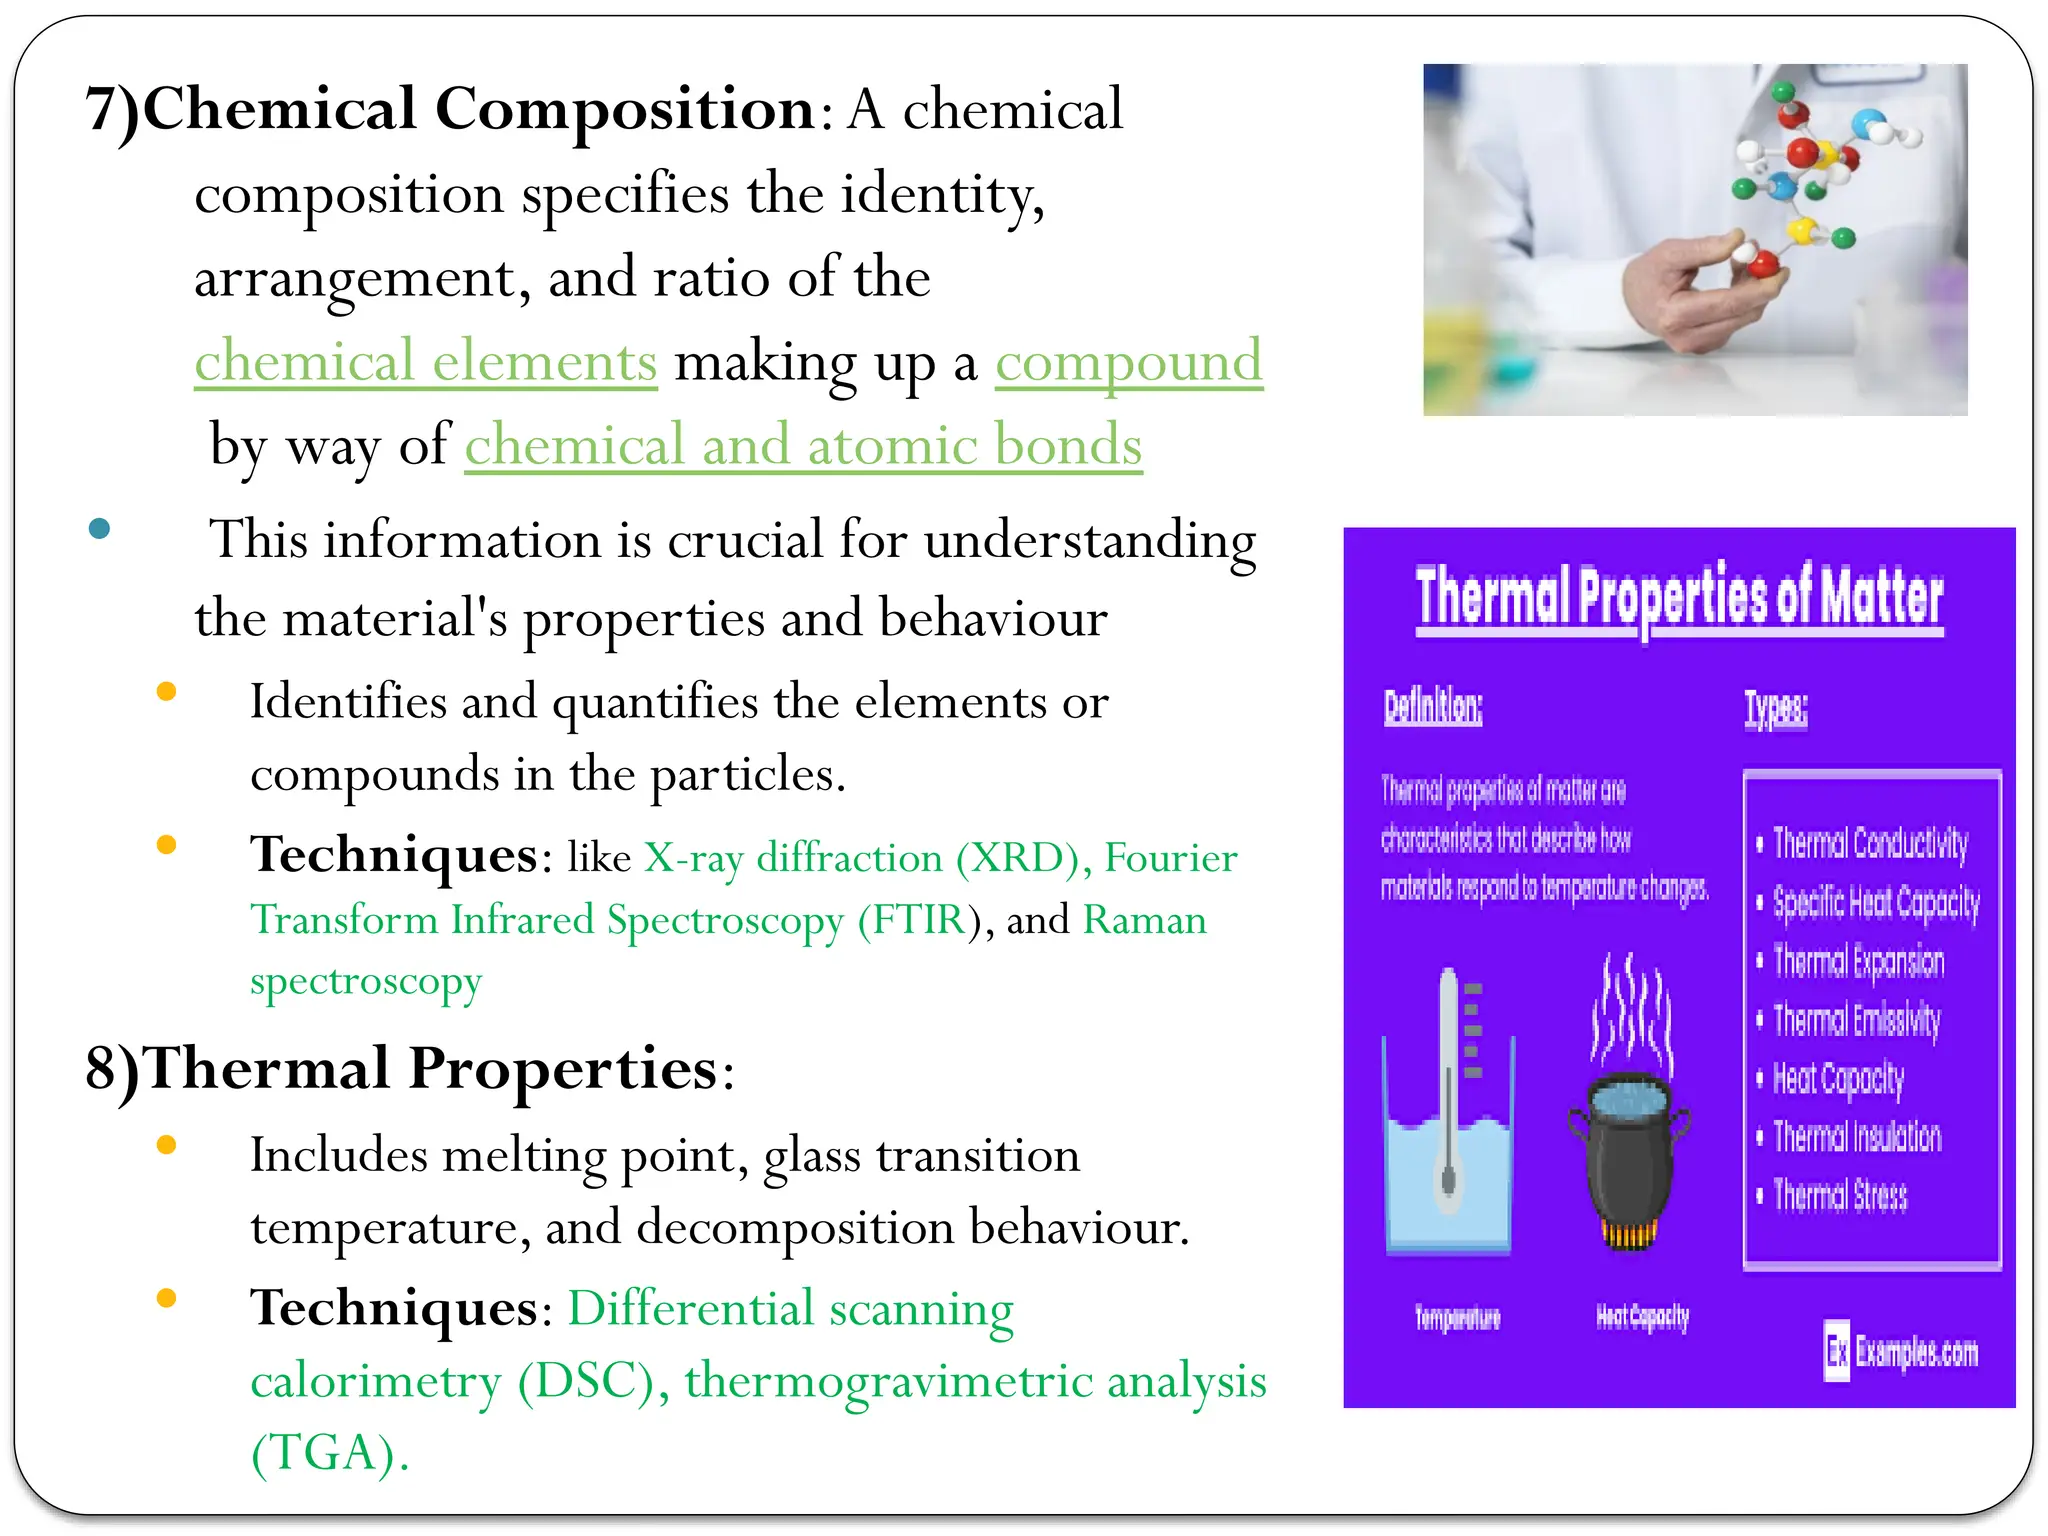
7)Chemical Composition:A chemical
compositionspecifies the identity,
arrangement, and ratio of the
chemical elements making up a compound
by way of chemical and atomic bonds
This information is crucial for understanding
the material's properties and behaviour
Identifies and quantifies the elements or
compounds in the particles.
Techniques: like X-ray diffraction (XRD), Fourier
Transform Infrared Spectroscopy (FTIR), and Raman
spectroscopy
8)Thermal Properties:
Includes melting point, glass transition
temperature, and decomposition behaviour.
Techniques: Differential scanning
calorimetry (DSC), thermogravimetric analysis
(TGA).
8.
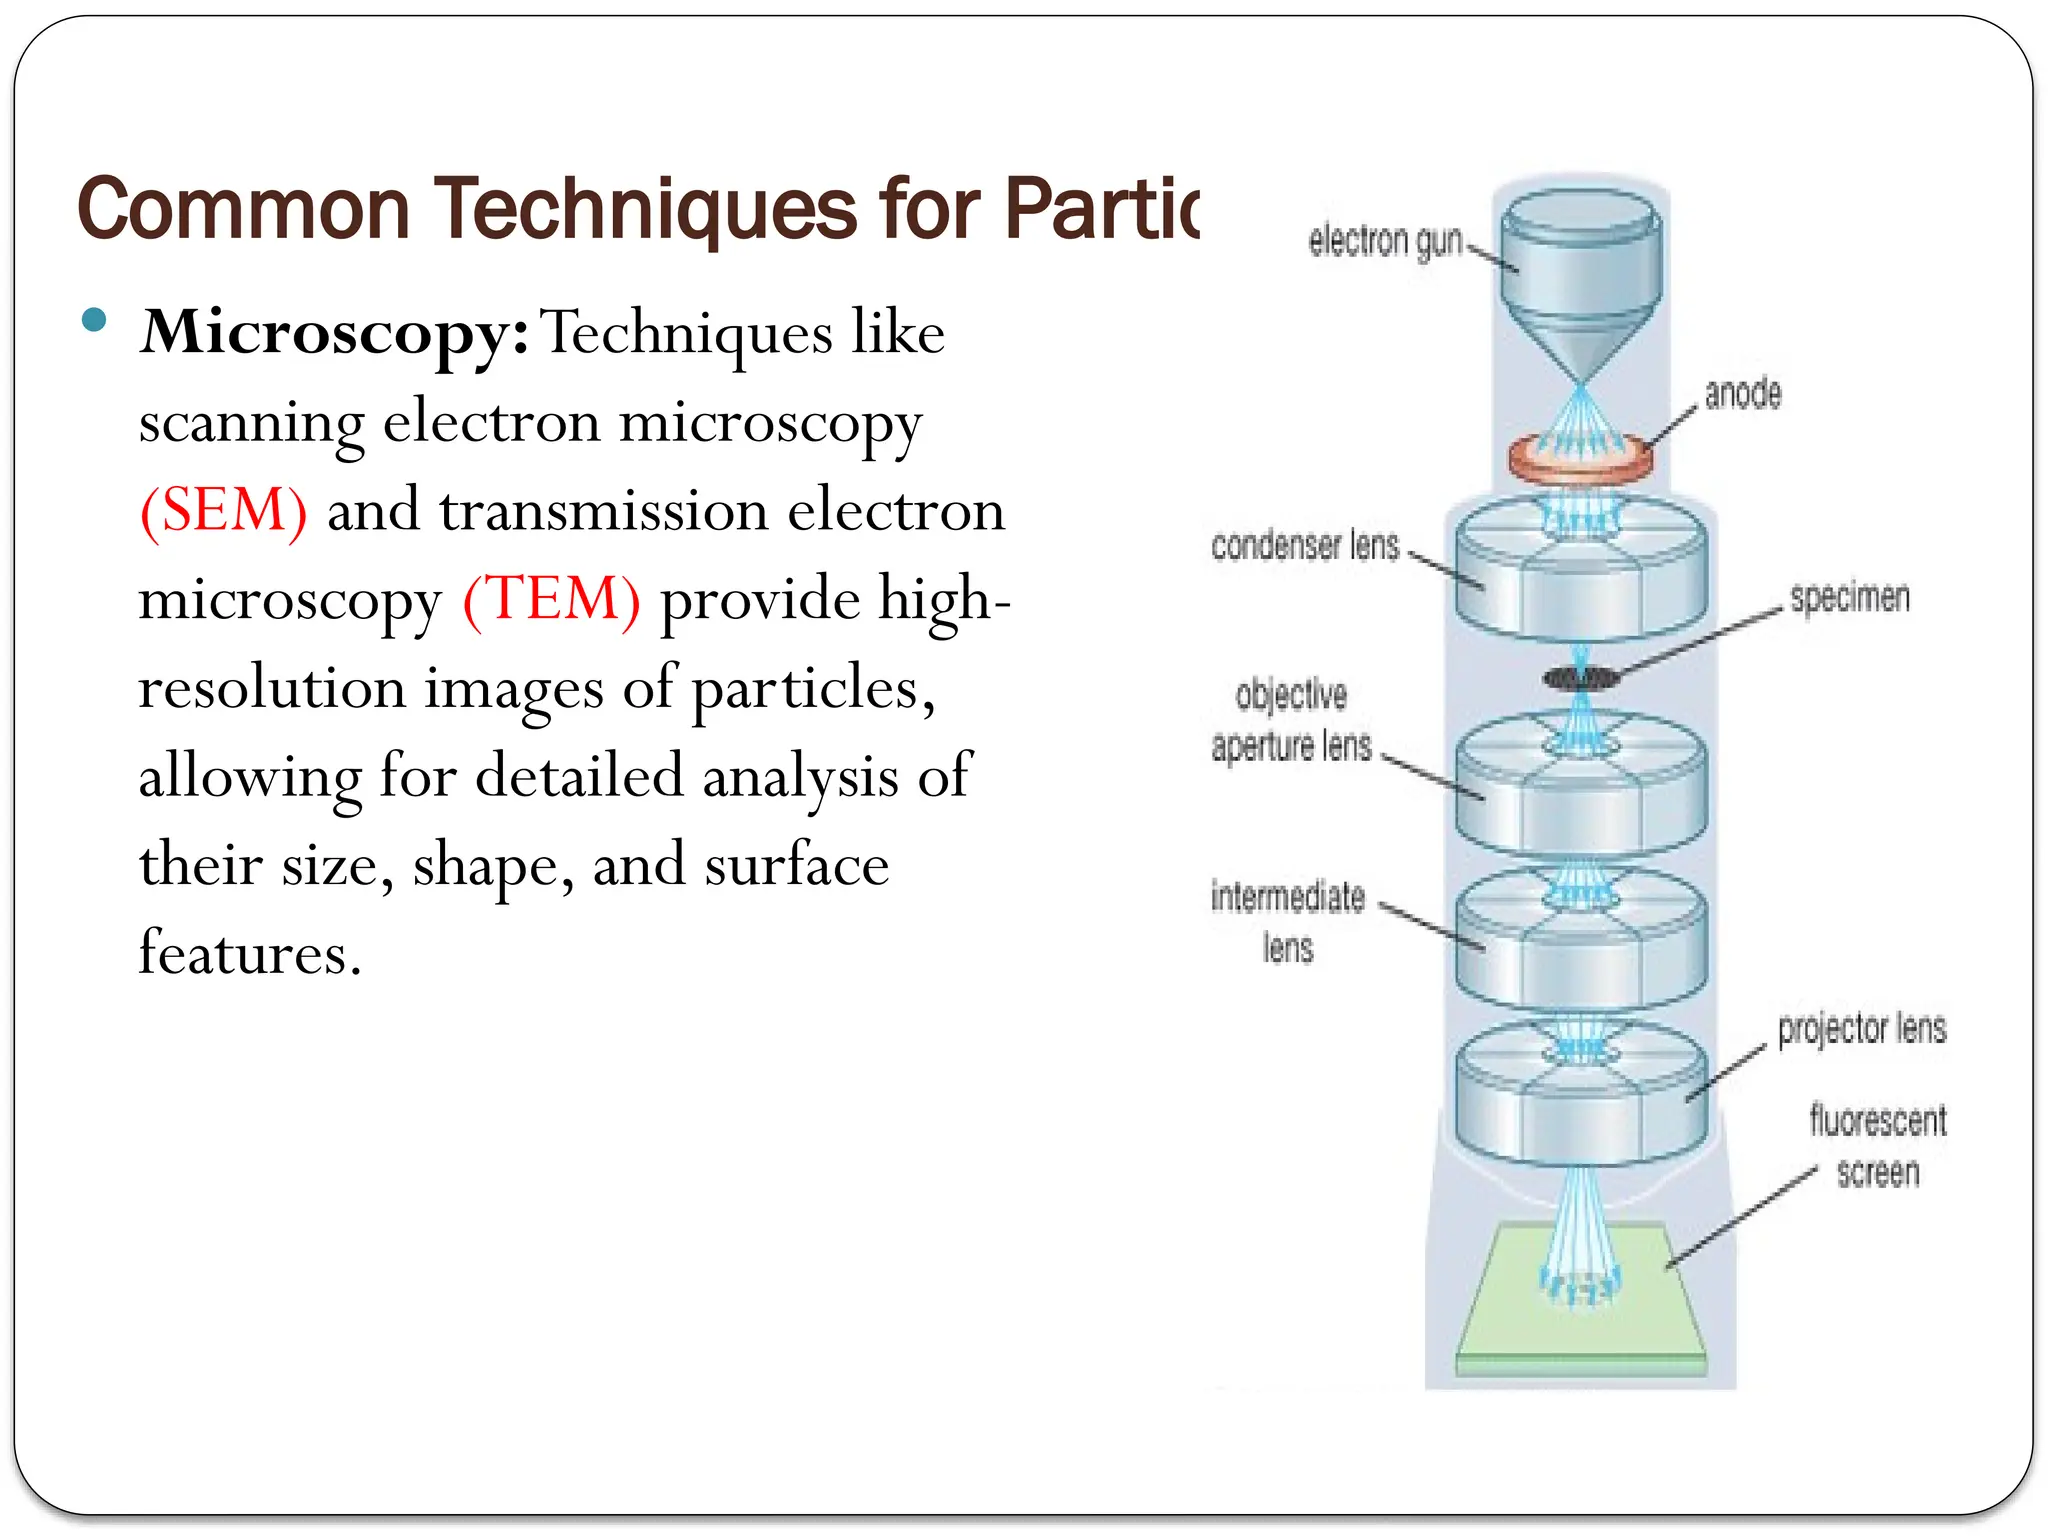
Common Techniques forParticle Characterization
Microscopy:Techniques like
scanning electron microscopy
(SEM) and transmission electron
microscopy (TEM) provide high-
resolution images of particles,
allowing for detailed analysis of
their size, shape, and surface
features.
9.
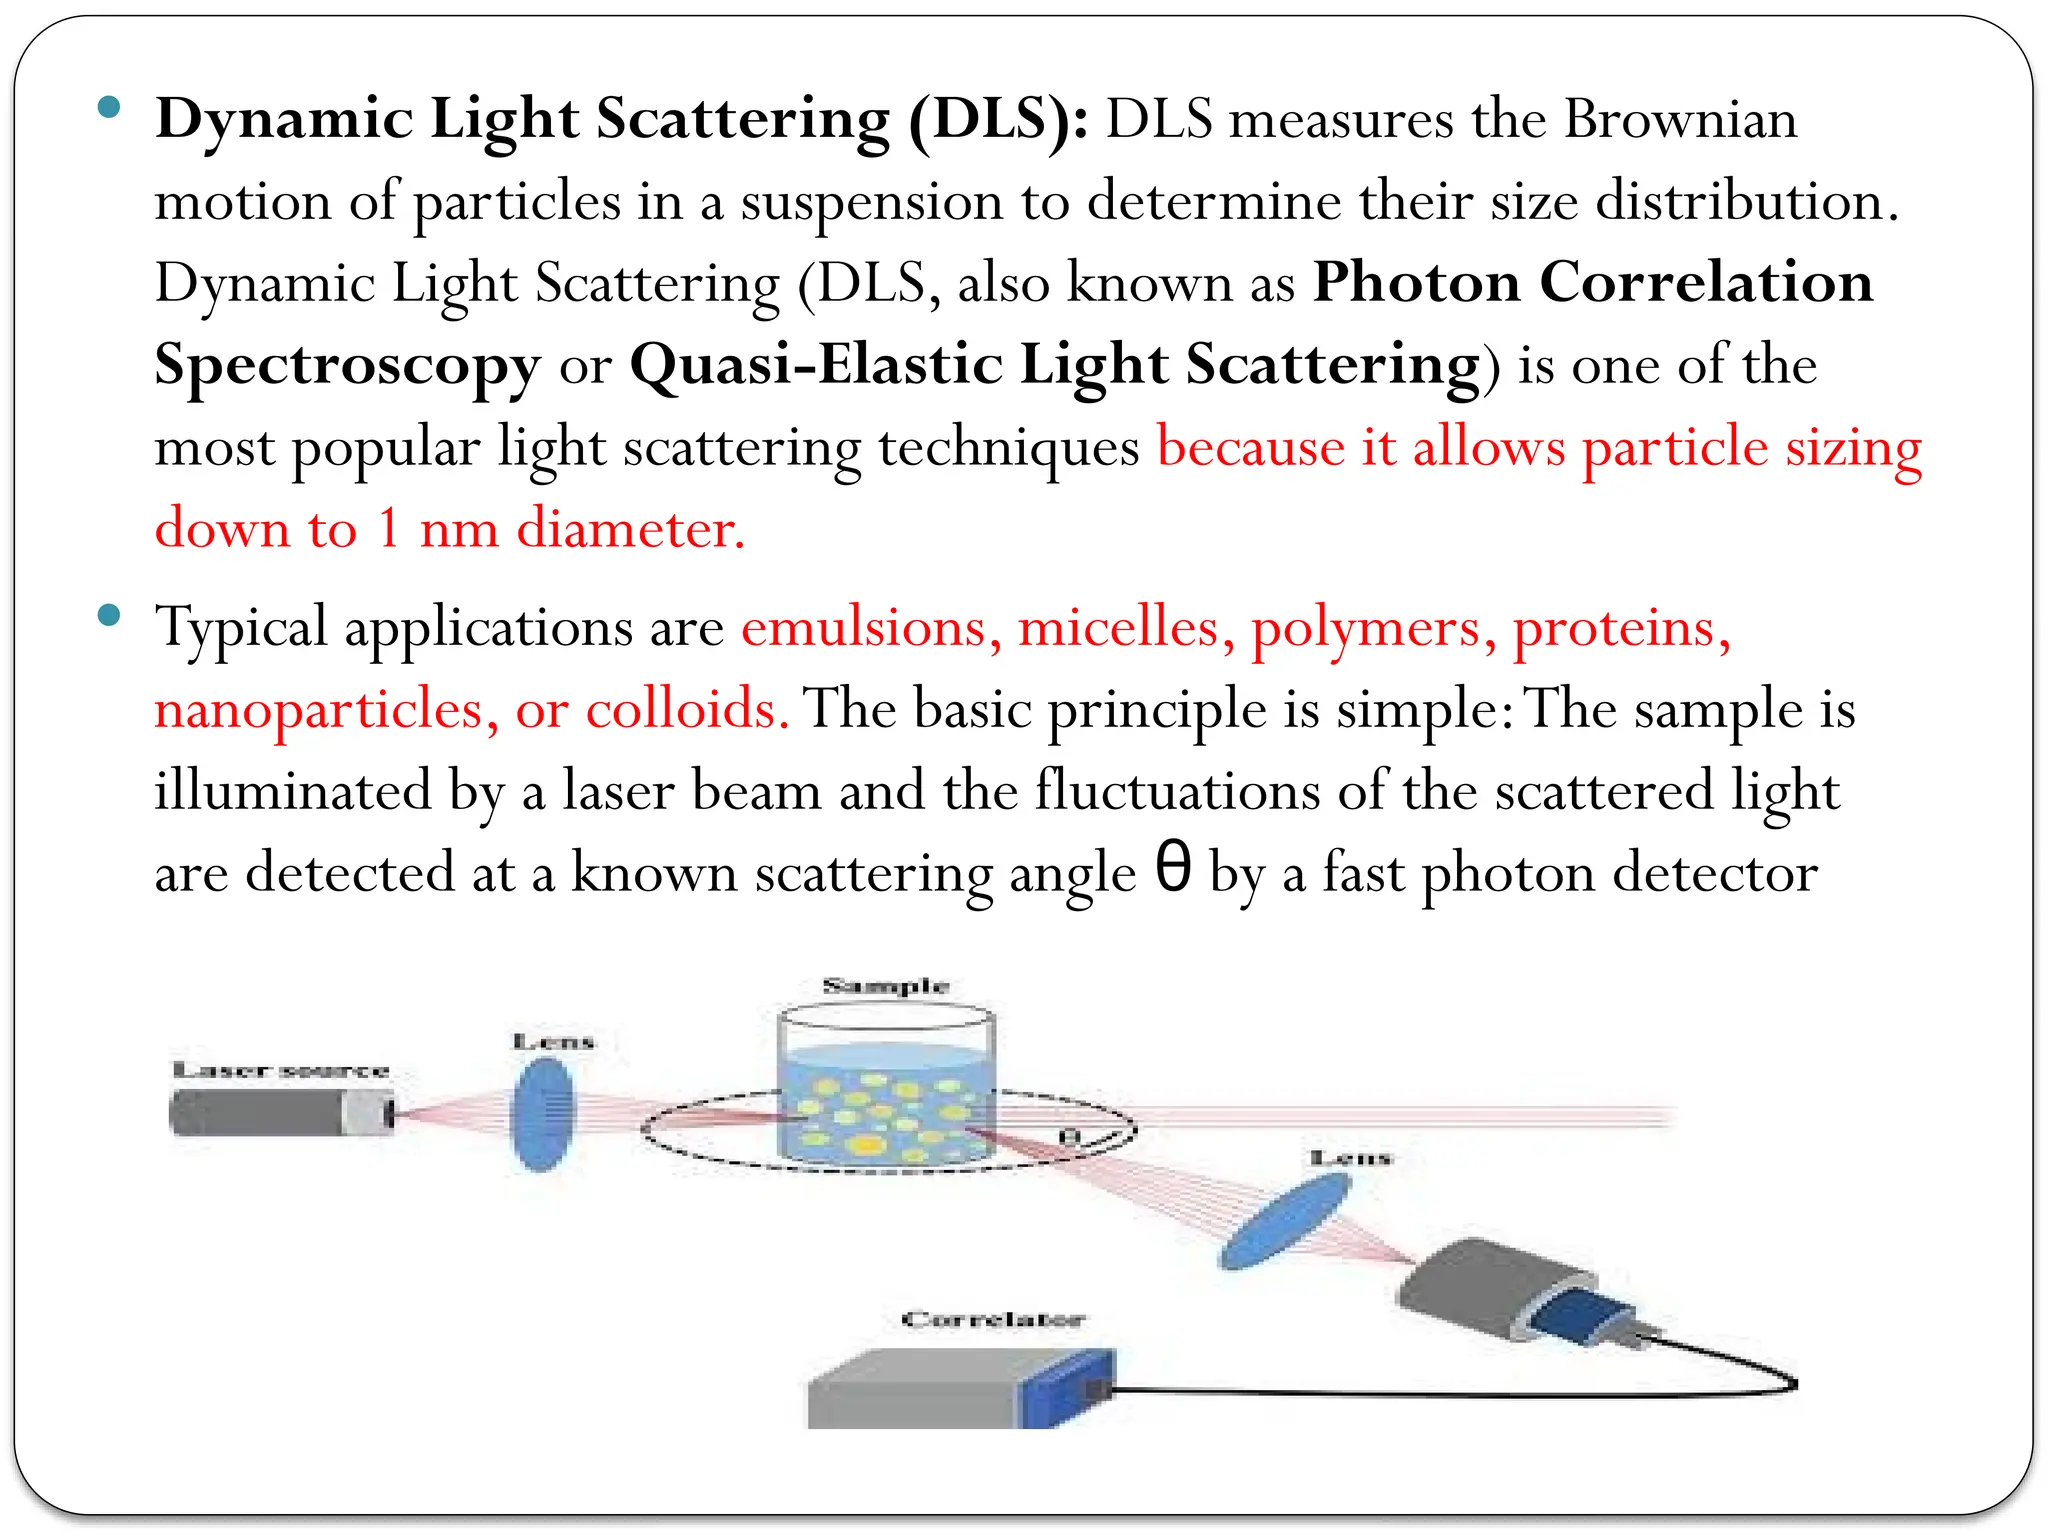
Dynamic LightScattering (DLS): DLS measures the Brownian
motion of particles in a suspension to determine their size distribution.
Dynamic Light Scattering (DLS, also known as Photon Correlation
Spectroscopy or Quasi-Elastic Light Scattering) is one of the
most popular light scattering techniques because it allows particle sizing
down to 1 nm diameter.
Typical applications are emulsions, micelles, polymers, proteins,
nanoparticles, or colloids.The basic principle is simple:The sample is
illuminated by a laser beam and the fluctuations of the scattered light
are detected at a known scattering angle by a fast photon detector
θ
10.
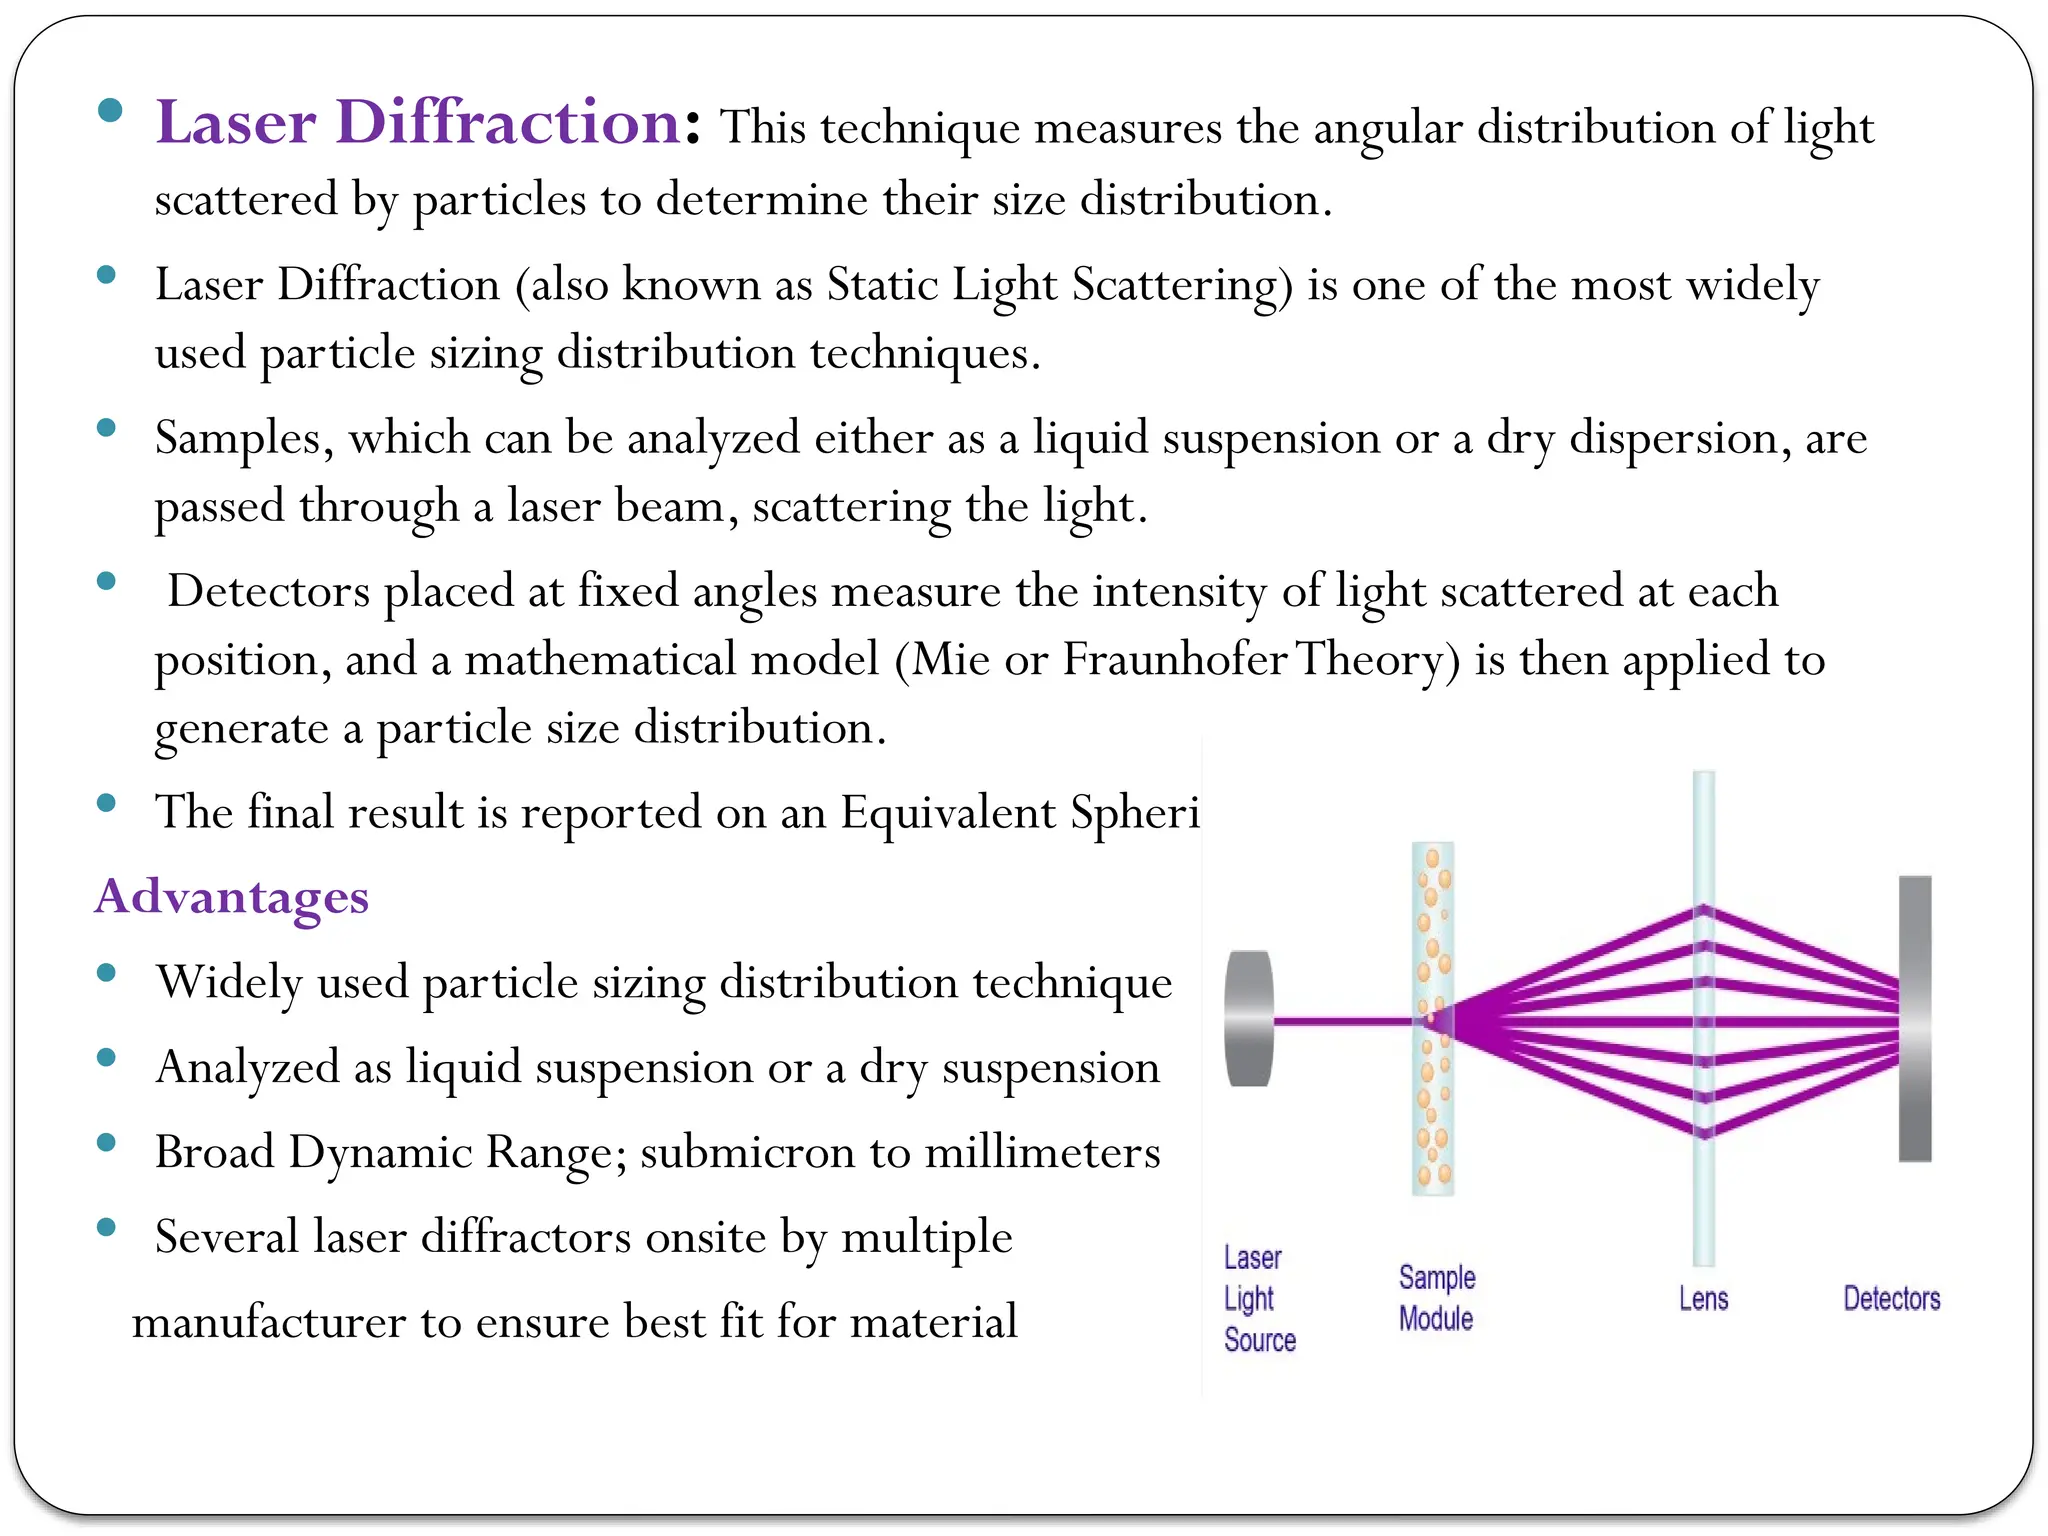
Laser Diffraction:This technique measures the angular distribution of light
scattered by particles to determine their size distribution.
Laser Diffraction (also known as Static Light Scattering) is one of the most widely
used particle sizing distribution techniques.
Samples, which can be analyzed either as a liquid suspension or a dry dispersion, are
passed through a laser beam, scattering the light.
Detectors placed at fixed angles measure the intensity of light scattered at each
position, and a mathematical model (Mie or FraunhoferTheory) is then applied to
generate a particle size distribution.
The final result is reported on an Equivalent Spherical DiameterVolume basis
Advantages
Widely used particle sizing distribution technique
Analyzed as liquid suspension or a dry suspension
Broad Dynamic Range; submicron to millimeters
Several laser diffractors onsite by multiple
manufacturer to ensure best fit for material
11.
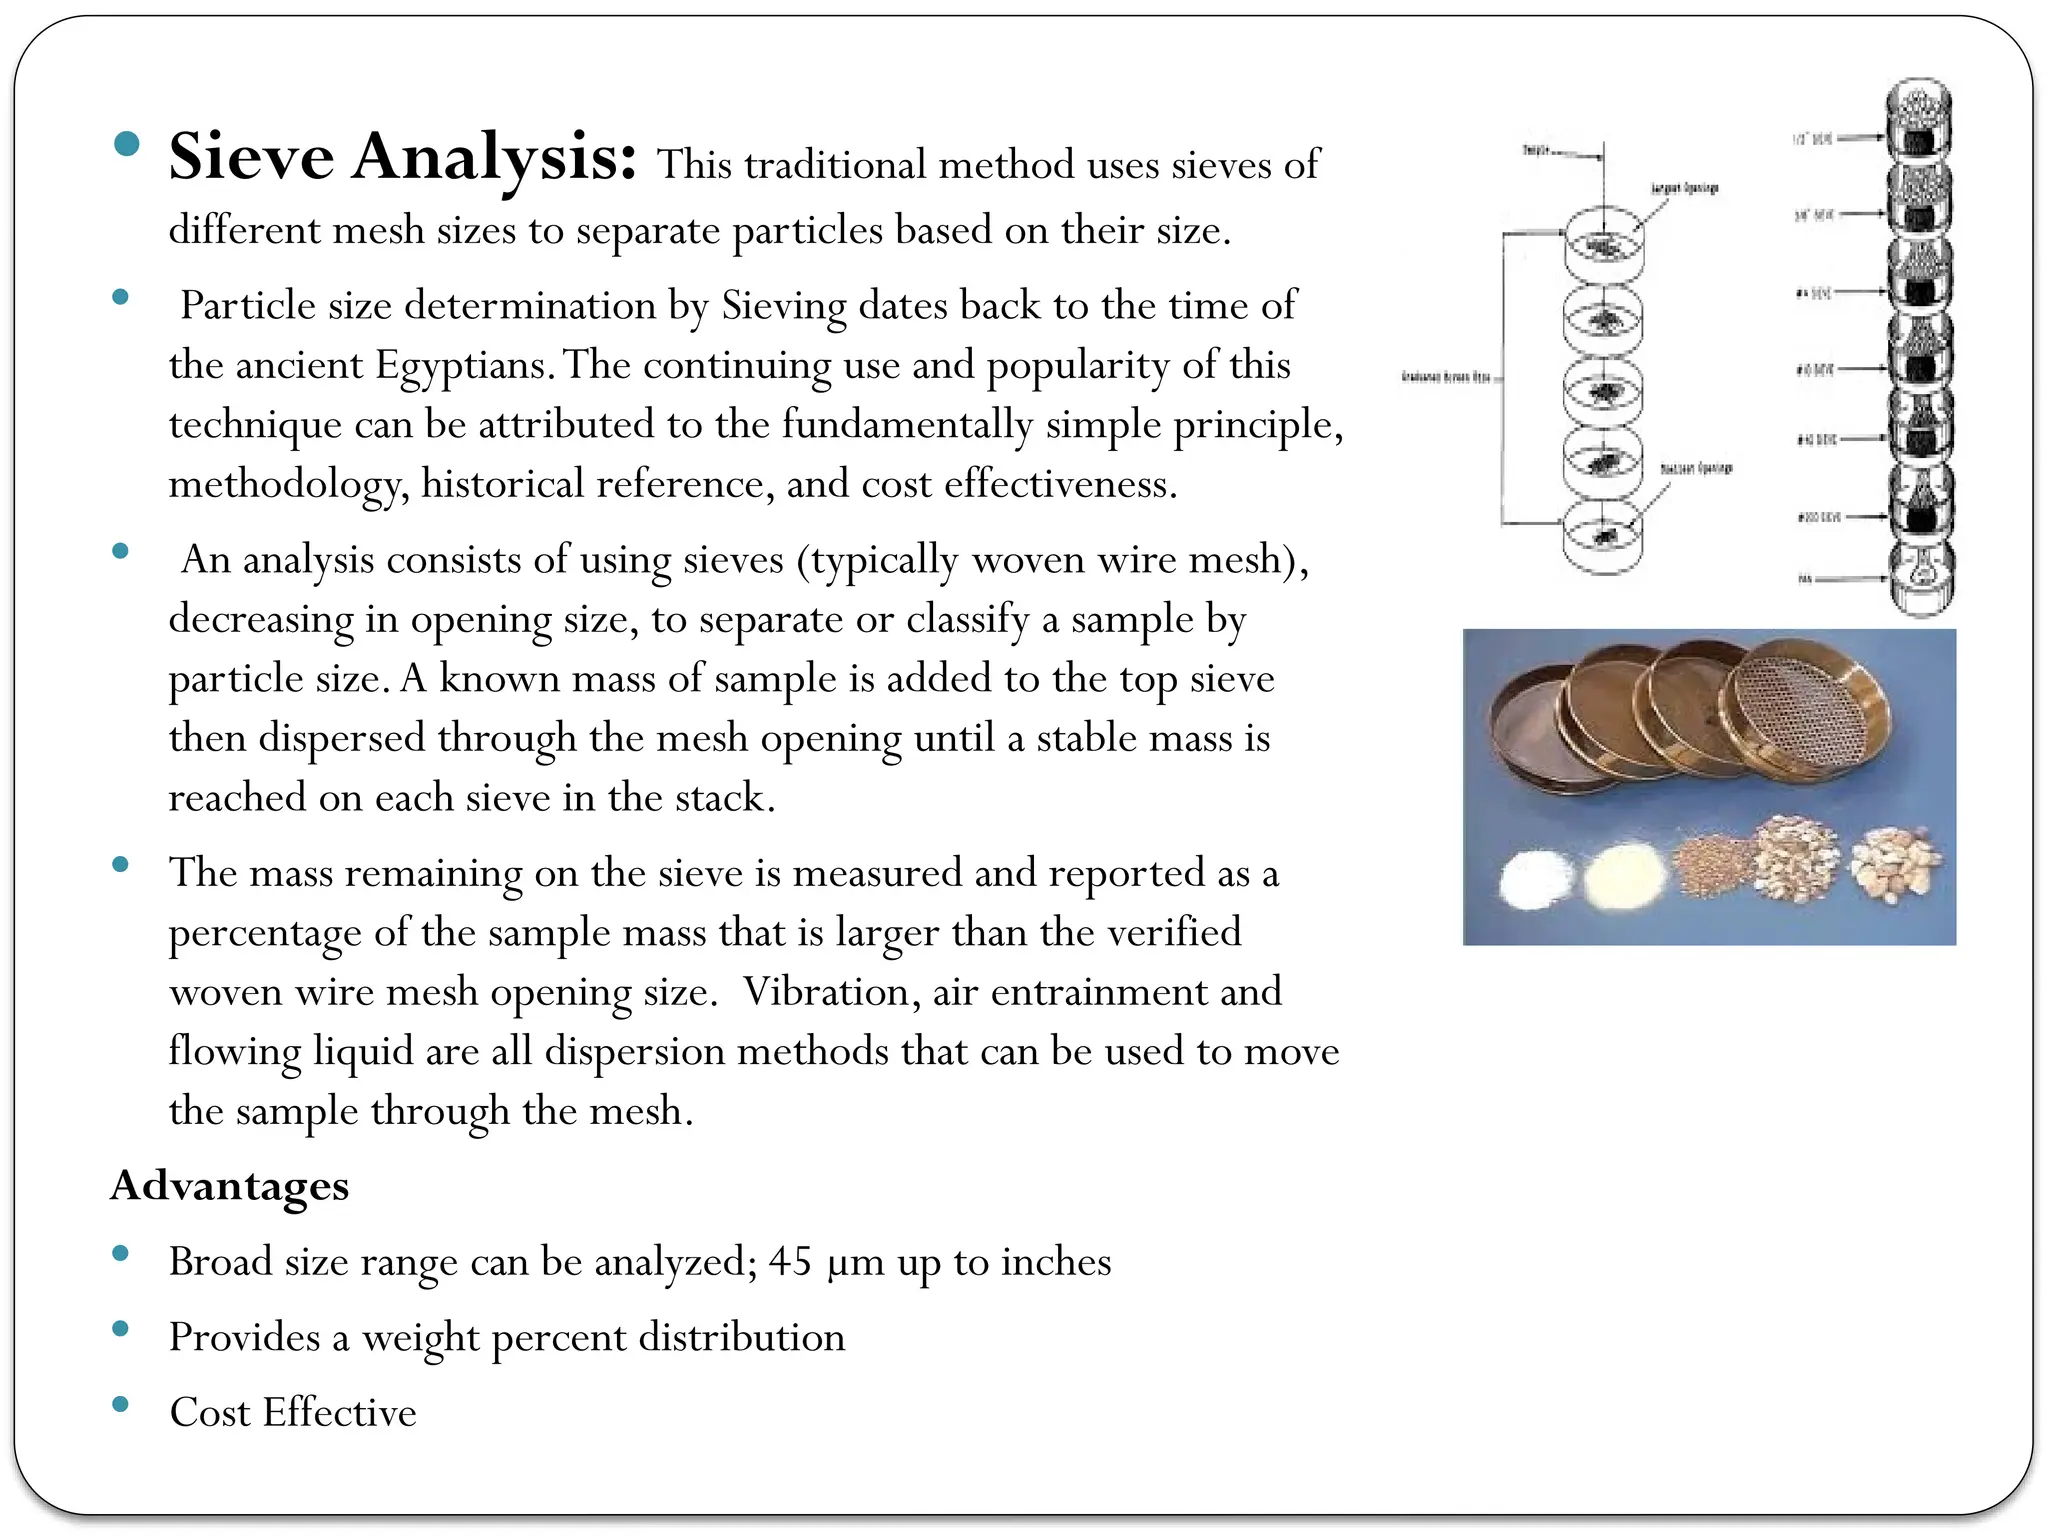
Sieve Analysis:This traditional method uses sieves of
different mesh sizes to separate particles based on their size.
Particle size determination by Sieving dates back to the time of
the ancient Egyptians.The continuing use and popularity of this
technique can be attributed to the fundamentally simple principle,
methodology, historical reference, and cost effectiveness.
An analysis consists of using sieves (typically woven wire mesh),
decreasing in opening size, to separate or classify a sample by
particle size.A known mass of sample is added to the top sieve
then dispersed through the mesh opening until a stable mass is
reached on each sieve in the stack.
The mass remaining on the sieve is measured and reported as a
percentage of the sample mass that is larger than the verified
woven wire mesh opening size. Vibration, air entrainment and
flowing liquid are all dispersion methods that can be used to move
the sample through the mesh.
Advantages
Broad size range can be analyzed; 45 µm up to inches
Provides a weight percent distribution
Cost Effective
12.
Applications of ParticleCharacterization
Particle characterization finds applications in a wide range of fields,
including:
Pharmaceutical industry: Ensuring drug quality and
bioavailability
Materials science: Optimizing the performance of composites,
ceramics, and metals. Developing new materials with tailored
properties
Environmental science: Monitoring air and water quality &
pollution sources.
Food industry: Controlling& Enhancing texture, solubility, and
stability of food products ,maintaining quality
Cosmetics industry: Controlling product texture and skin
absorption properties. Formulating products with desired properties
1.2 Particle SizeMeasuring Technologies
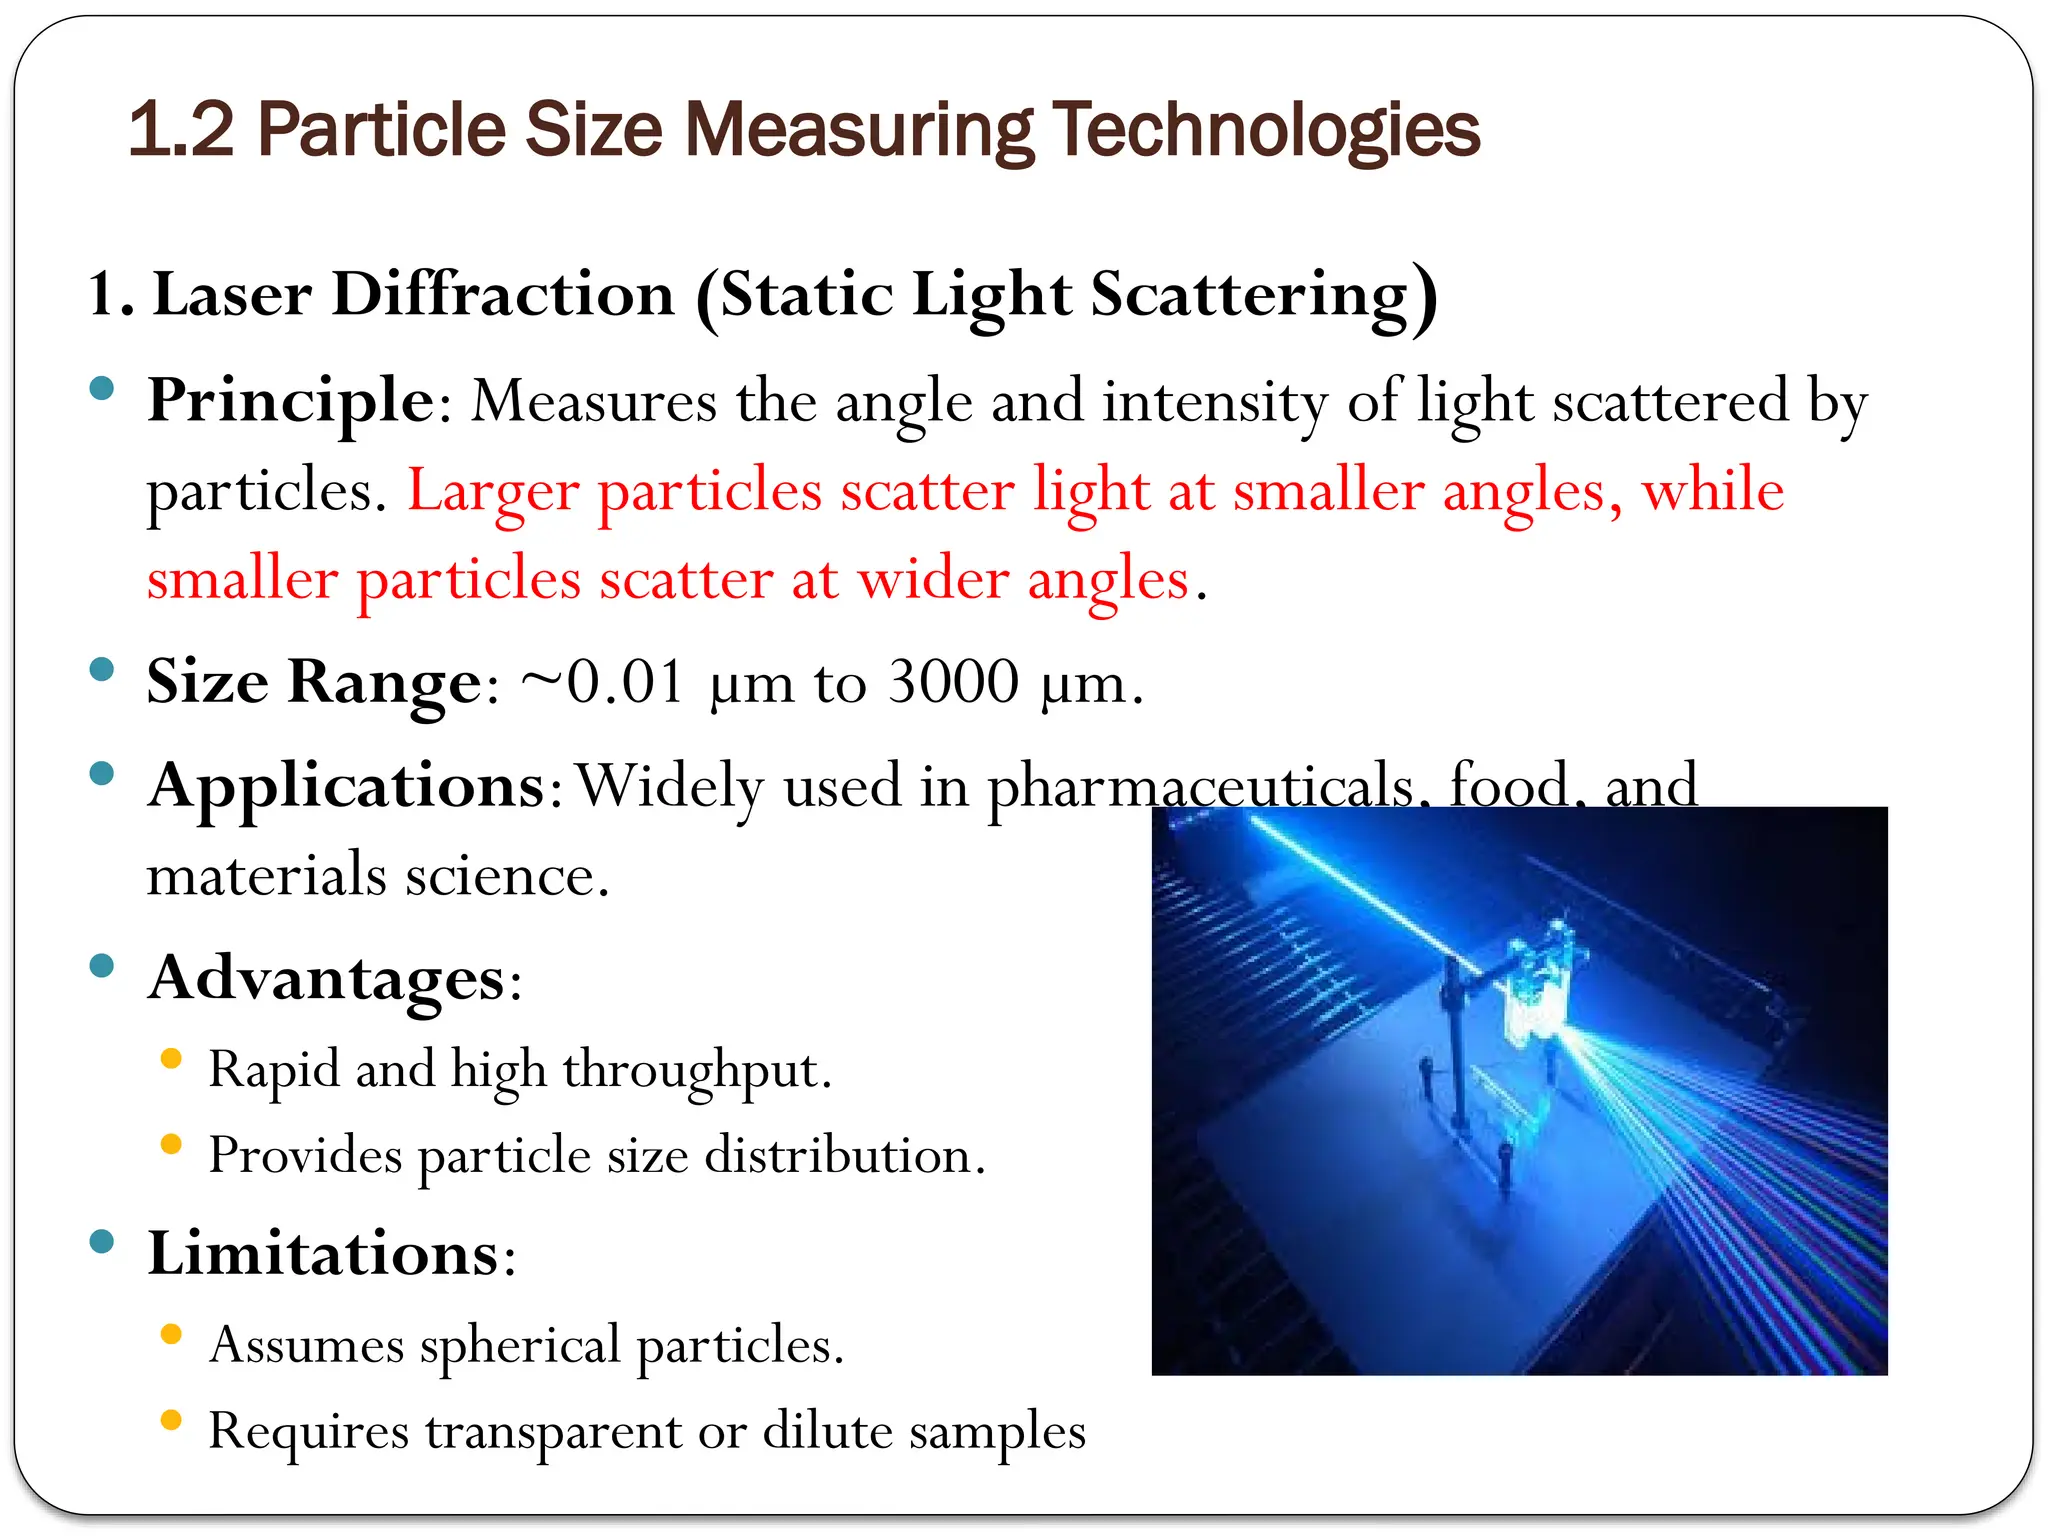
1. Laser Diffraction (Static Light Scattering)
Principle: Measures the angle and intensity of light scattered by
particles. Larger particles scatter light at smaller angles, while
smaller particles scatter at wider angles.
Size Range: ~0.01 µm to 3000 µm.
Applications:Widely used in pharmaceuticals, food, and
materials science.
Advantages:
Rapid and high throughput.
Provides particle size distribution.
Limitations:
Assumes spherical particles.
Requires transparent or dilute samples
15.
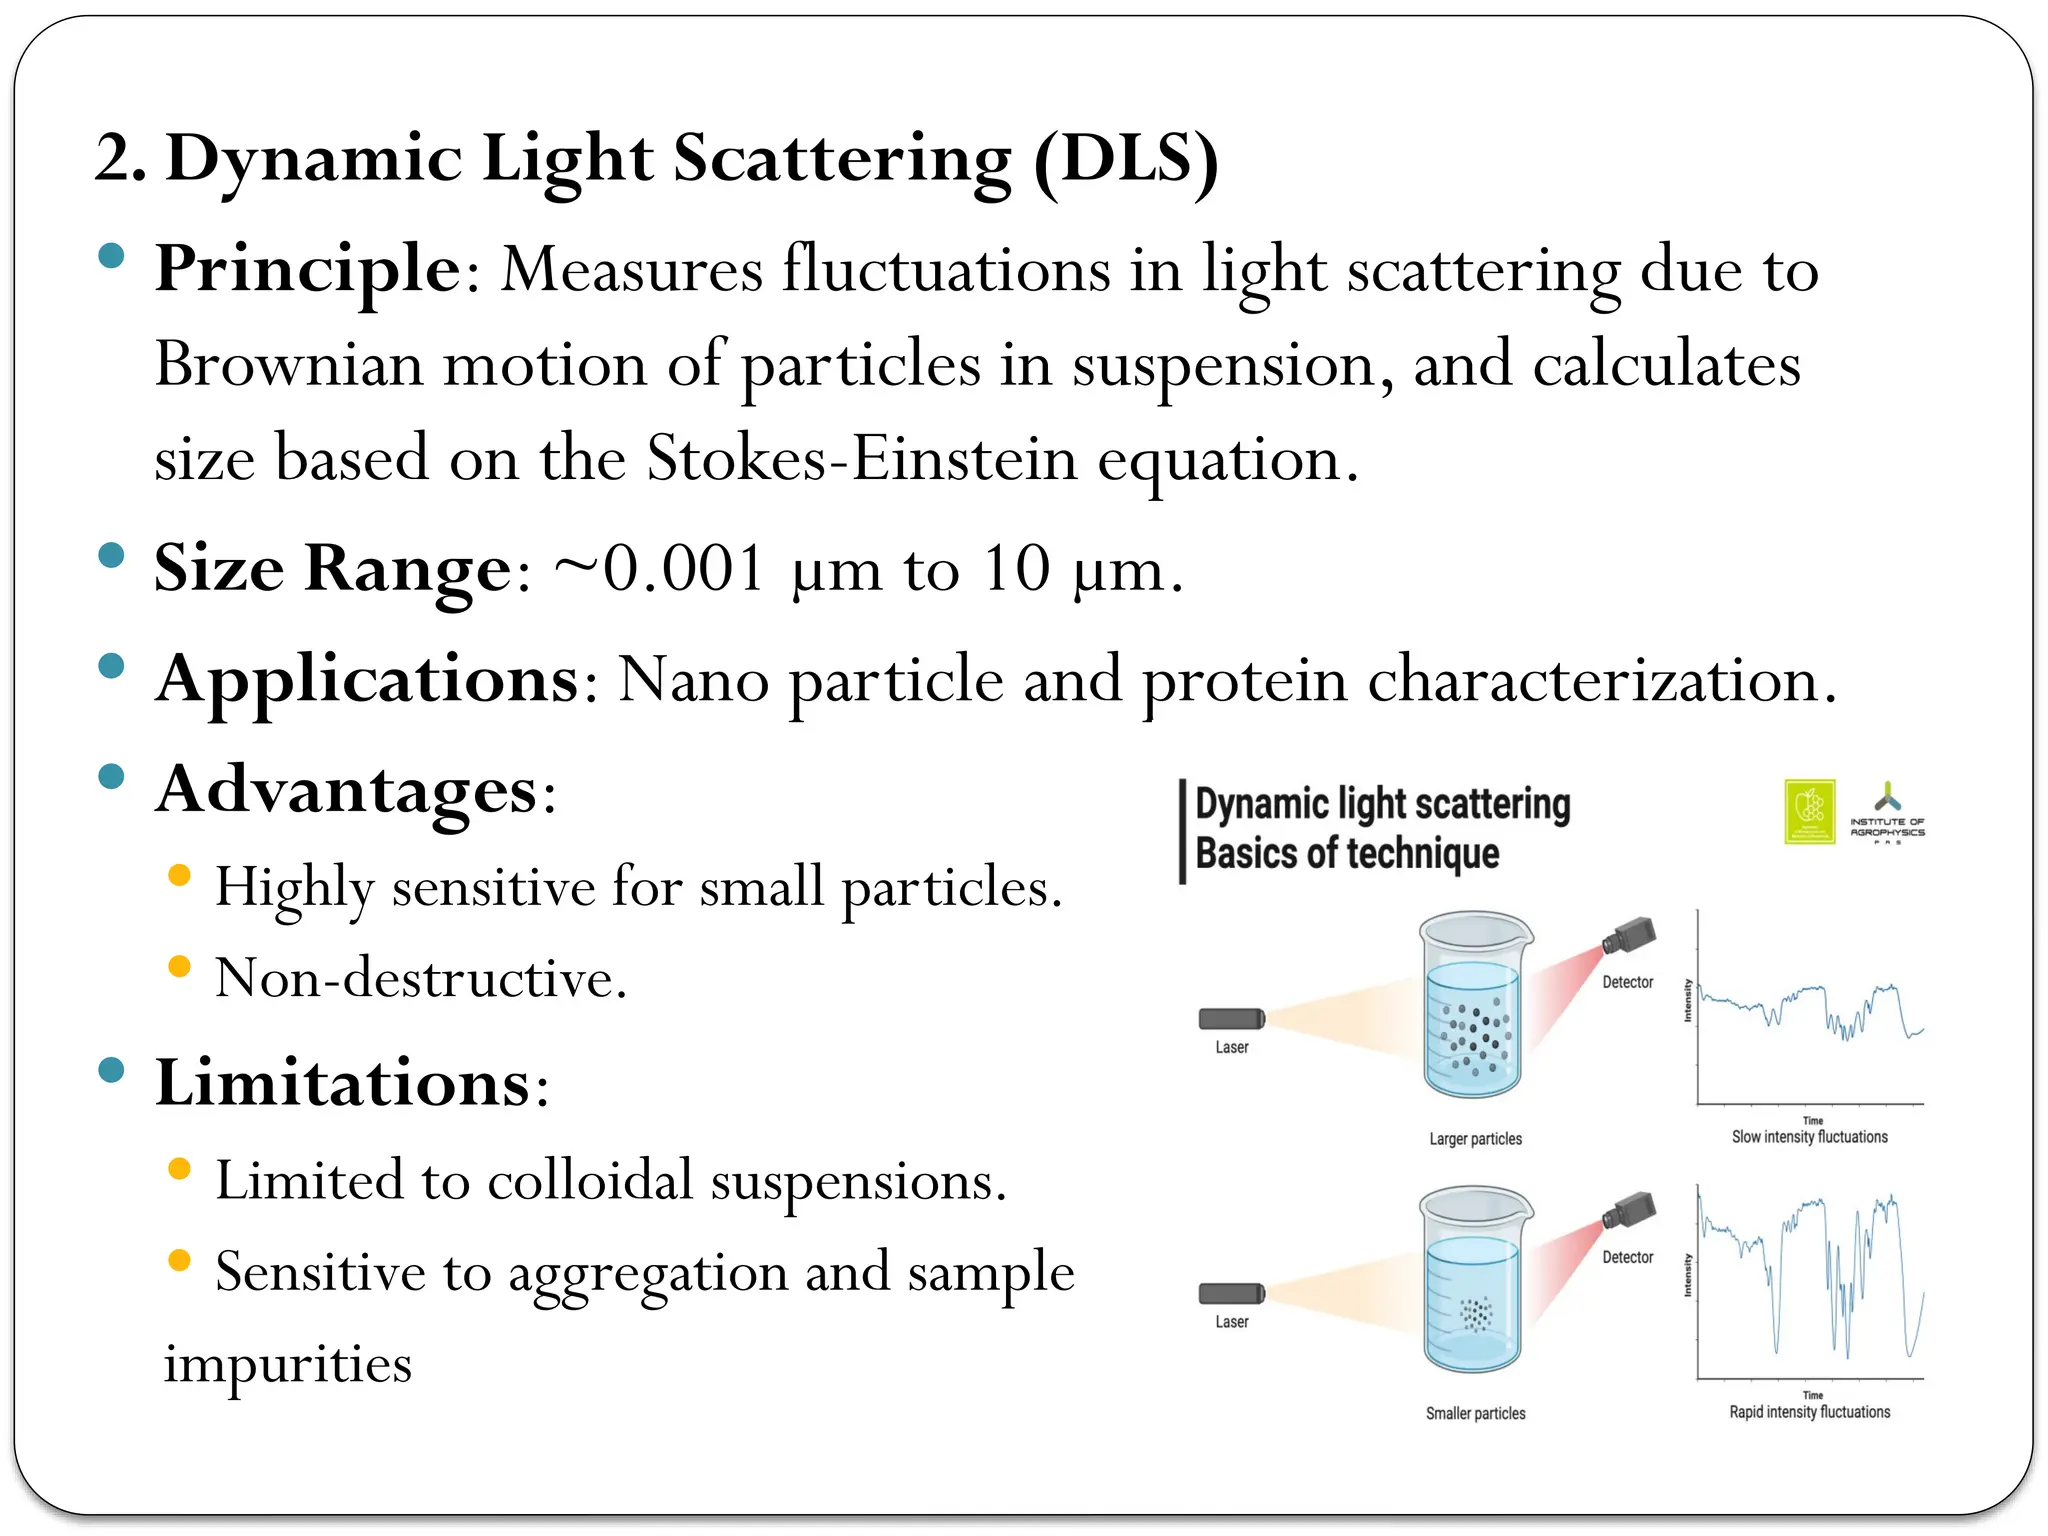
2. Dynamic LightScattering (DLS)
Principle: Measures fluctuations in light scattering due to
Brownian motion of particles in suspension, and calculates
size based on the Stokes-Einstein equation.
Size Range: ~0.001 µm to 10 µm.
Applications: Nano particle and protein characterization.
Advantages:
Highly sensitive for small particles.
Non-destructive.
Limitations:
Limited to colloidal suspensions.
Sensitive to aggregation and sample
impurities
16.
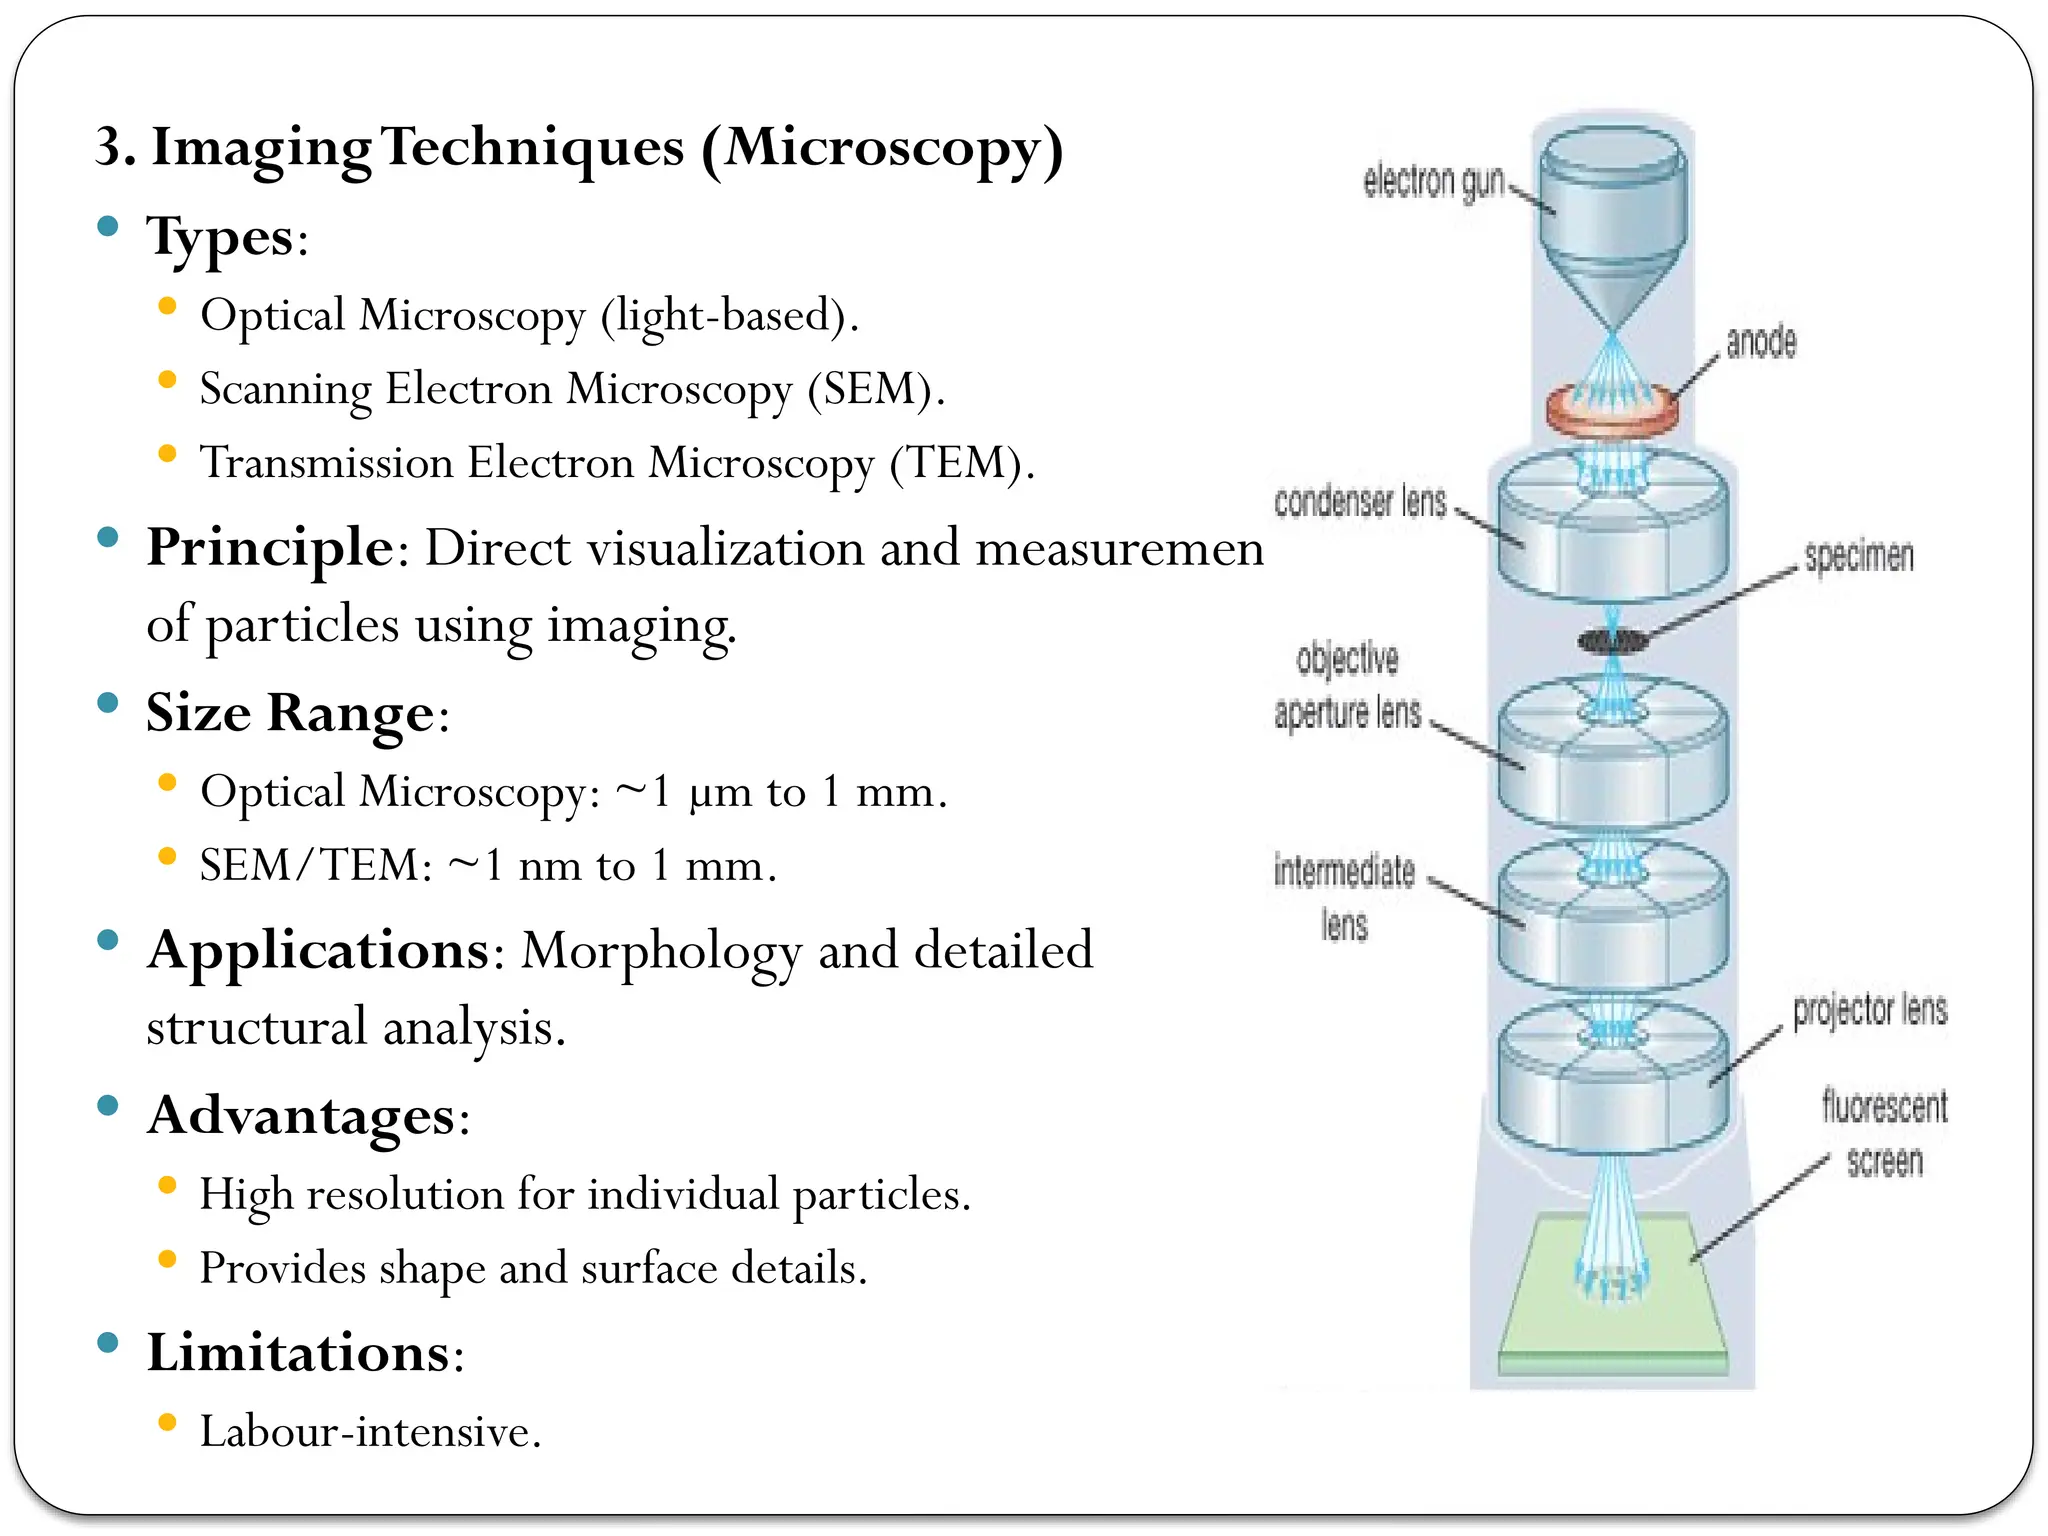
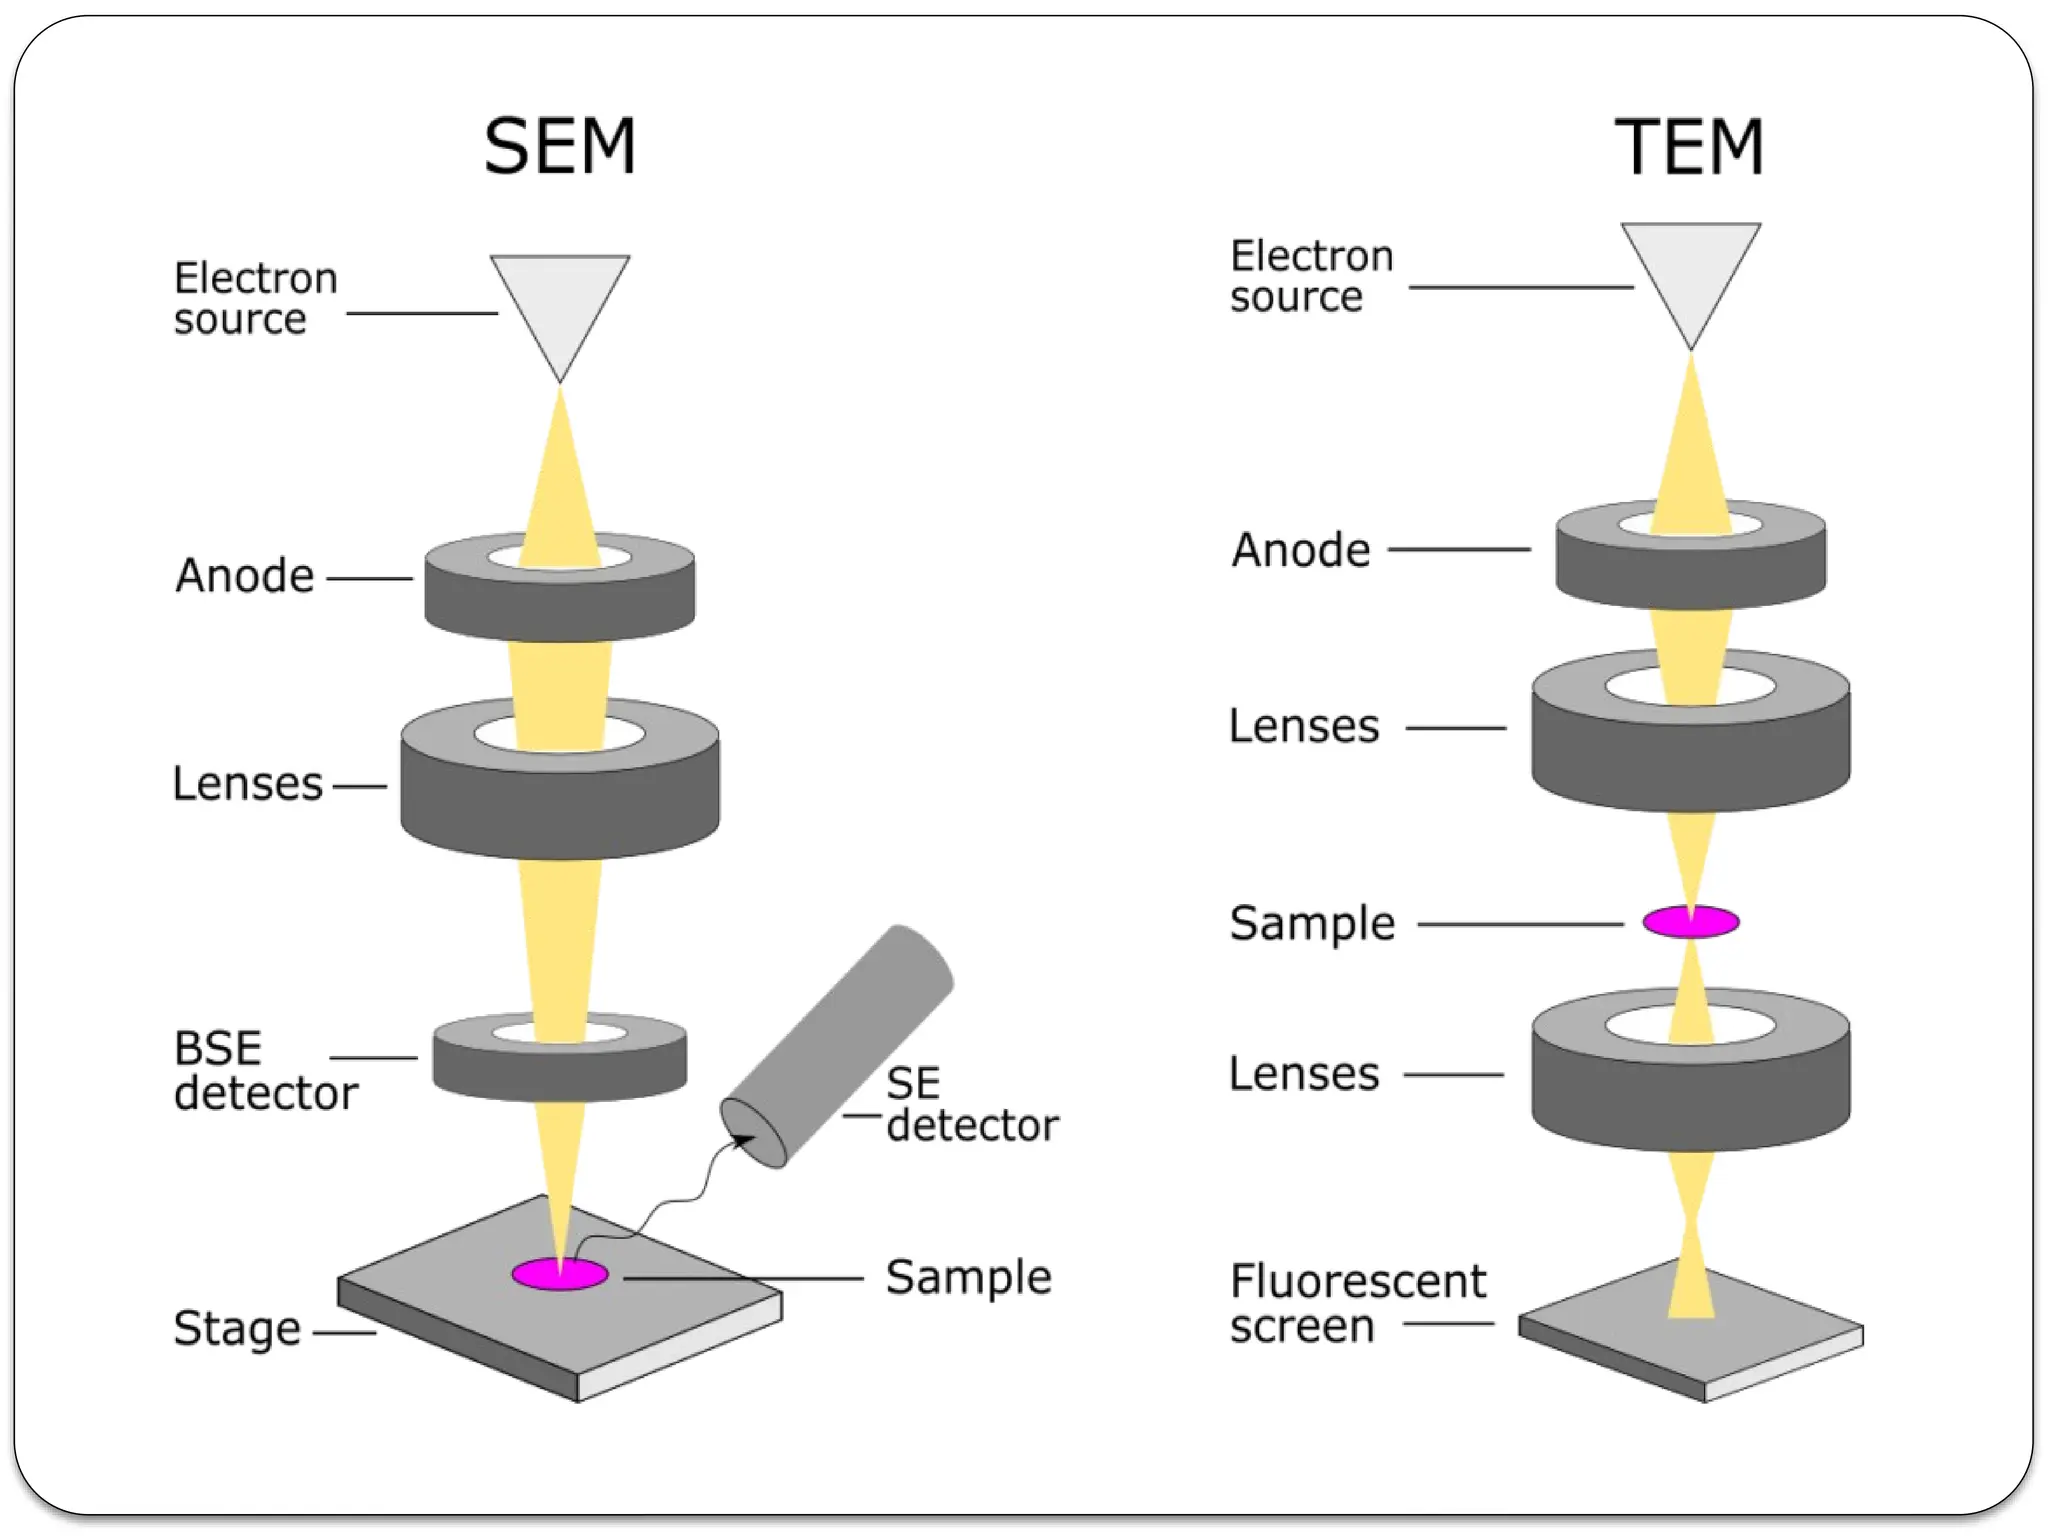
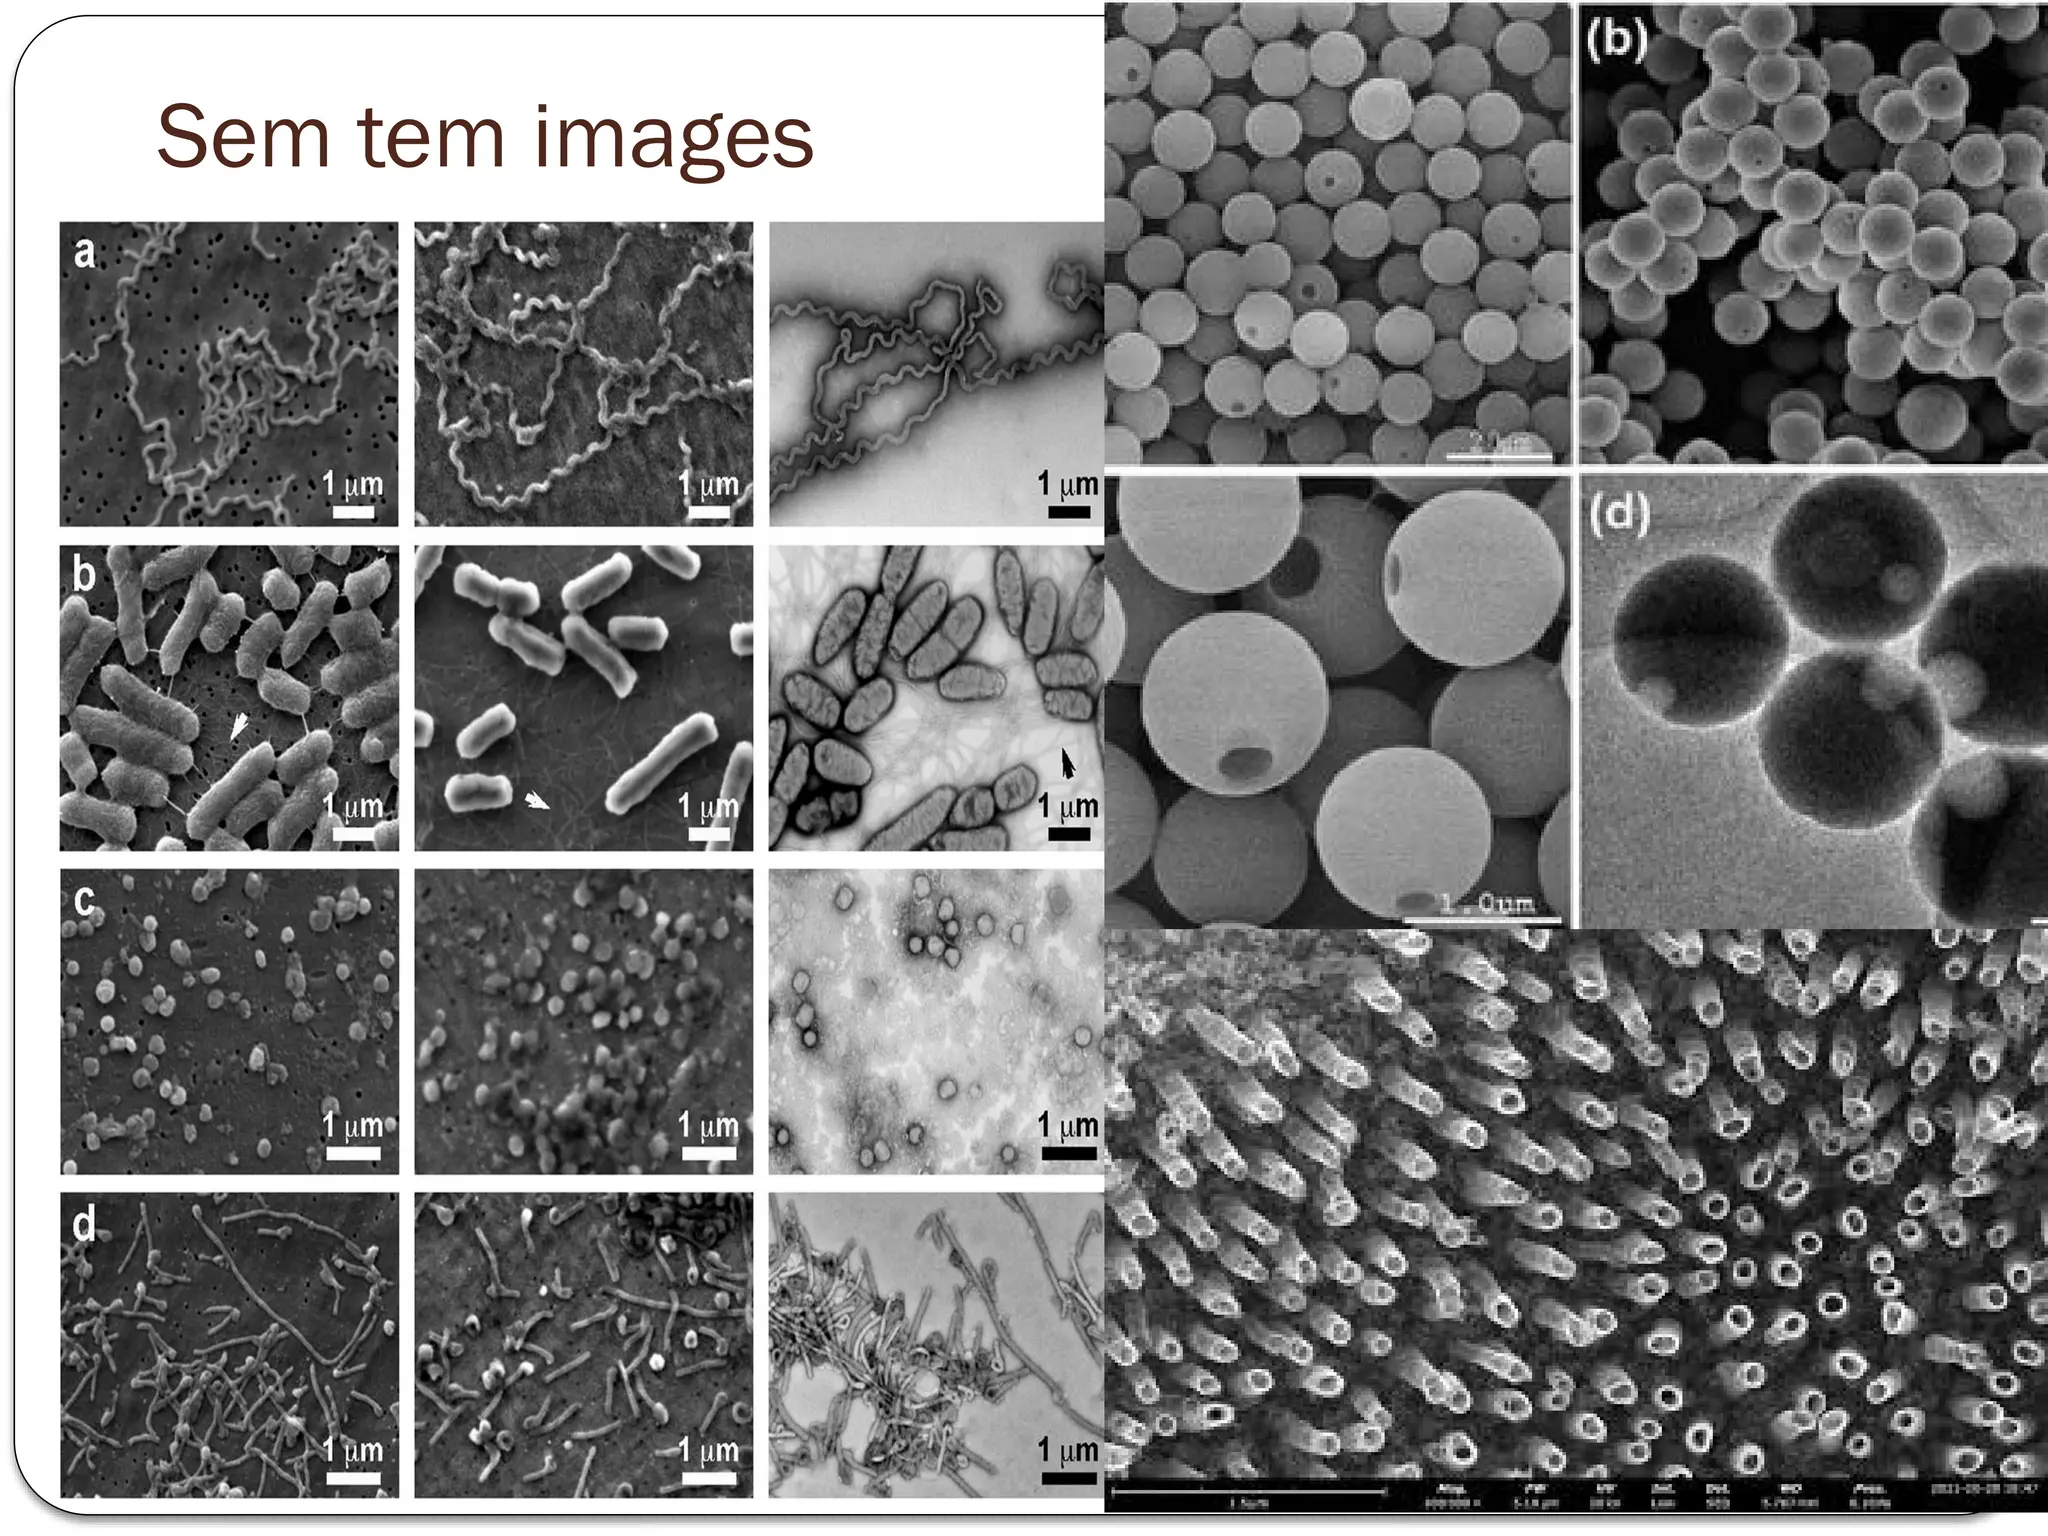
3. ImagingTechniques (Microscopy)
Types:
Optical Microscopy (light-based).
Scanning Electron Microscopy (SEM).
Transmission Electron Microscopy (TEM).
Principle: Direct visualization and measurement
of particles using imaging.
Size Range:
Optical Microscopy: ~1 µm to 1 mm.
SEM/TEM: ~1 nm to 1 mm.
Applications: Morphology and detailed
structural analysis.
Advantages:
High resolution for individual particles.
Provides shape and surface details.
Limitations:
Labour-intensive.
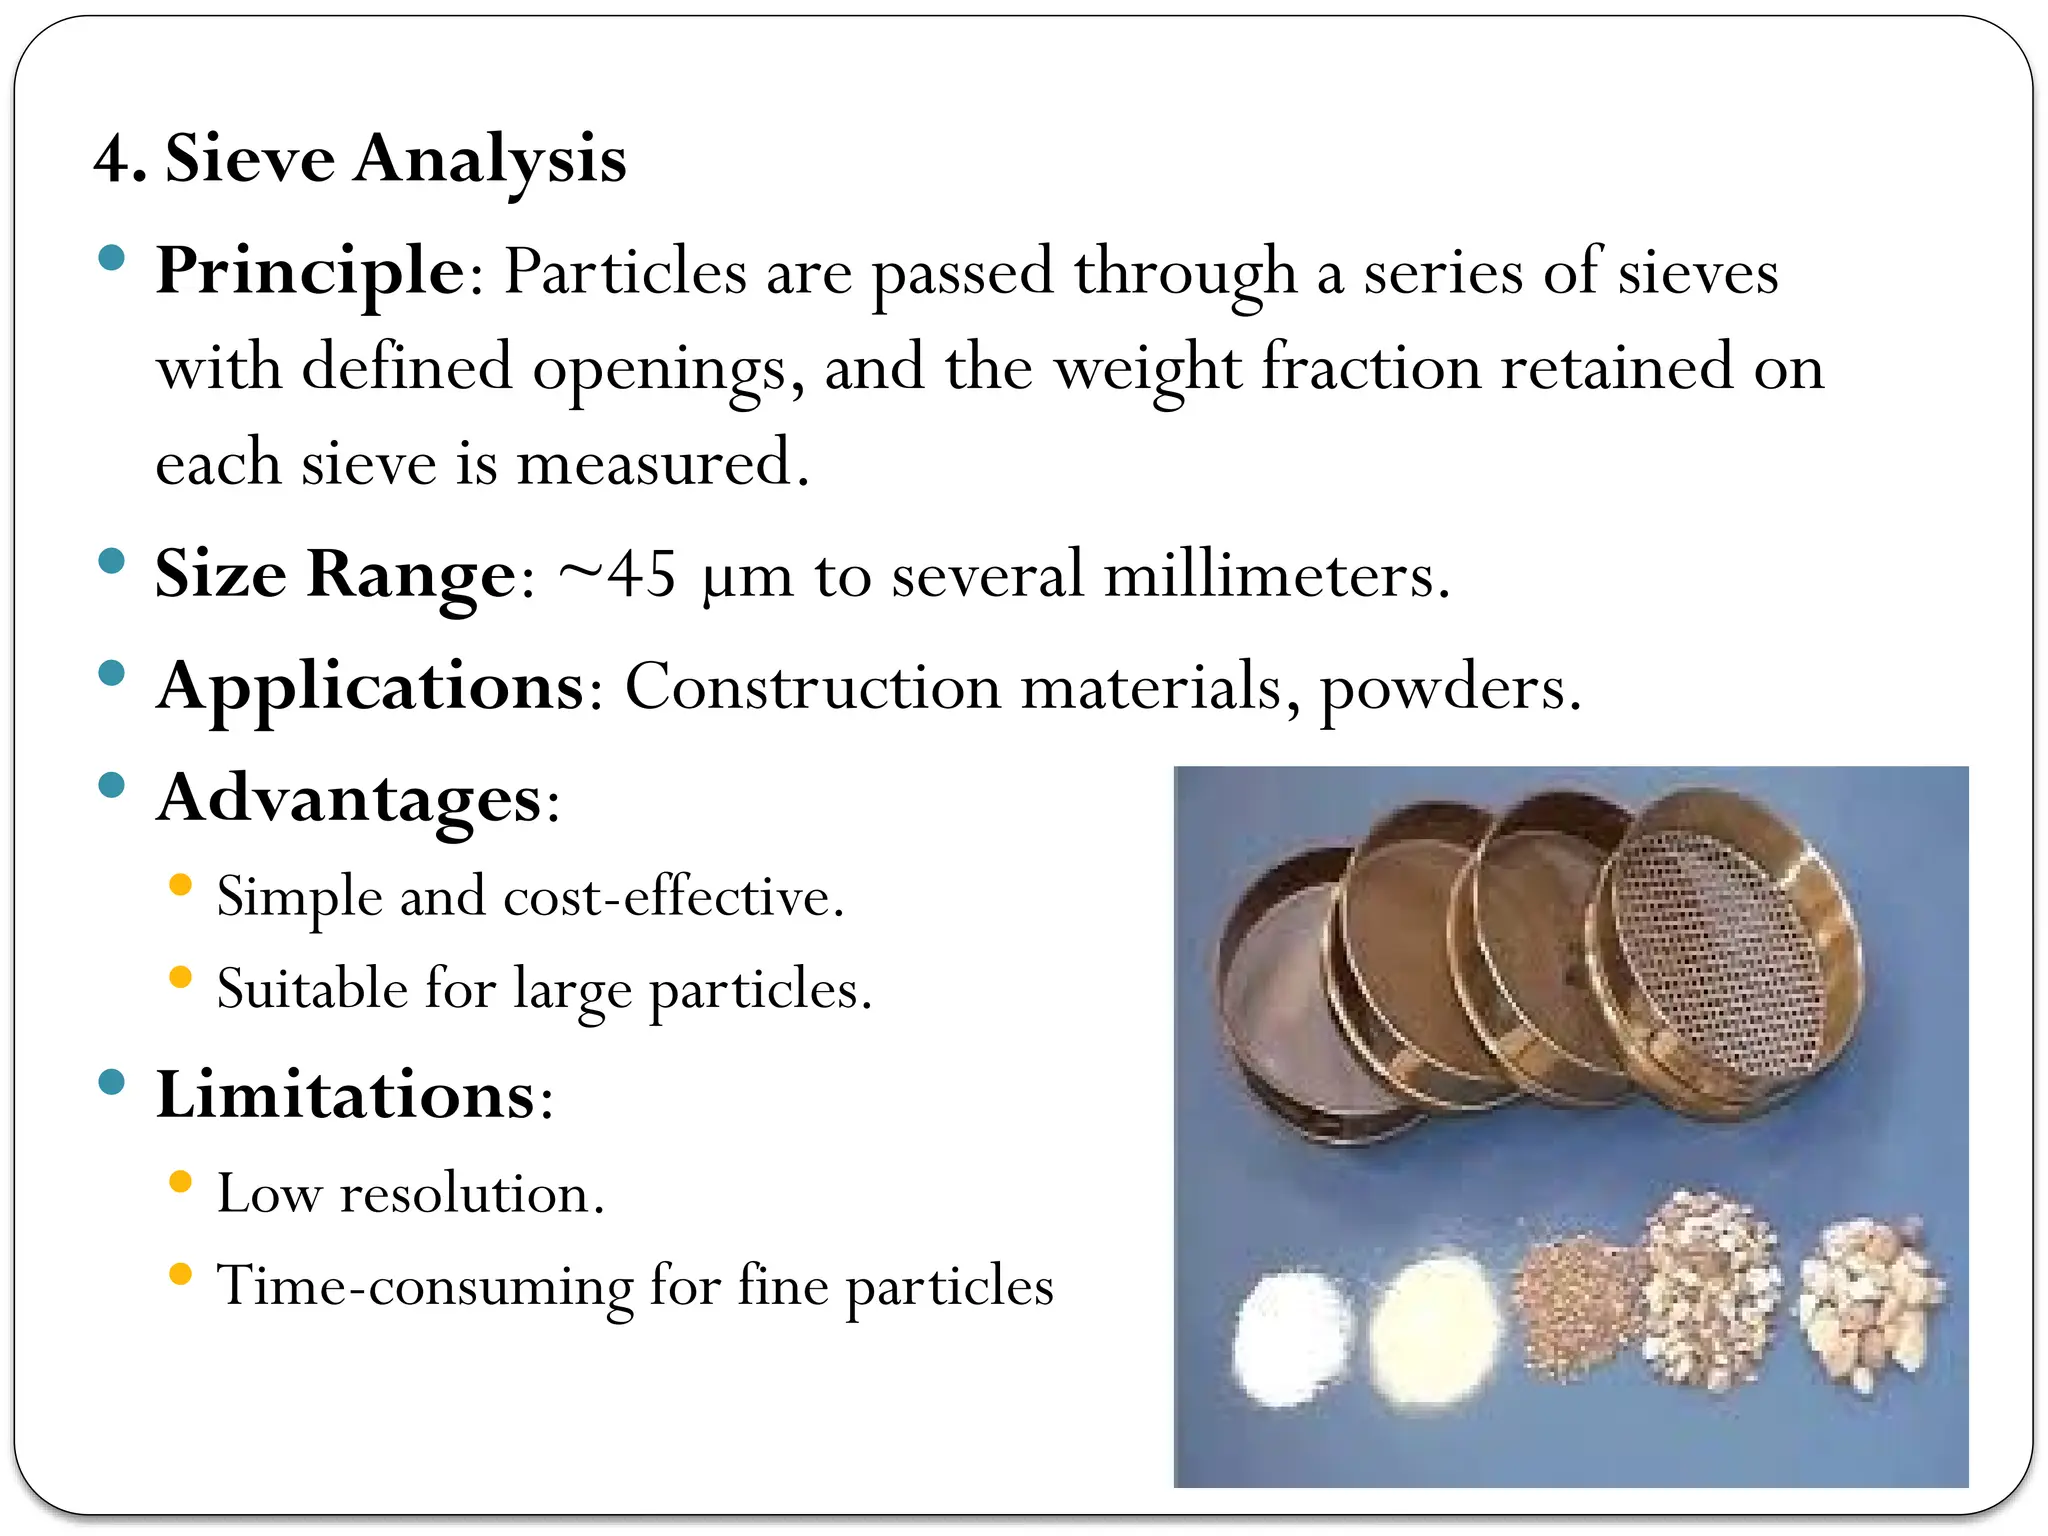
4. Sieve Analysis
Principle: Particles are passed through a series of sieves
with defined openings, and the weight fraction retained on
each sieve is measured.
Size Range: ~45 µm to several millimeters.
Applications: Construction materials, powders.
Advantages:
Simple and cost-effective.
Suitable for large particles.
Limitations:
Low resolution.
Time-consuming for fine particles
21.
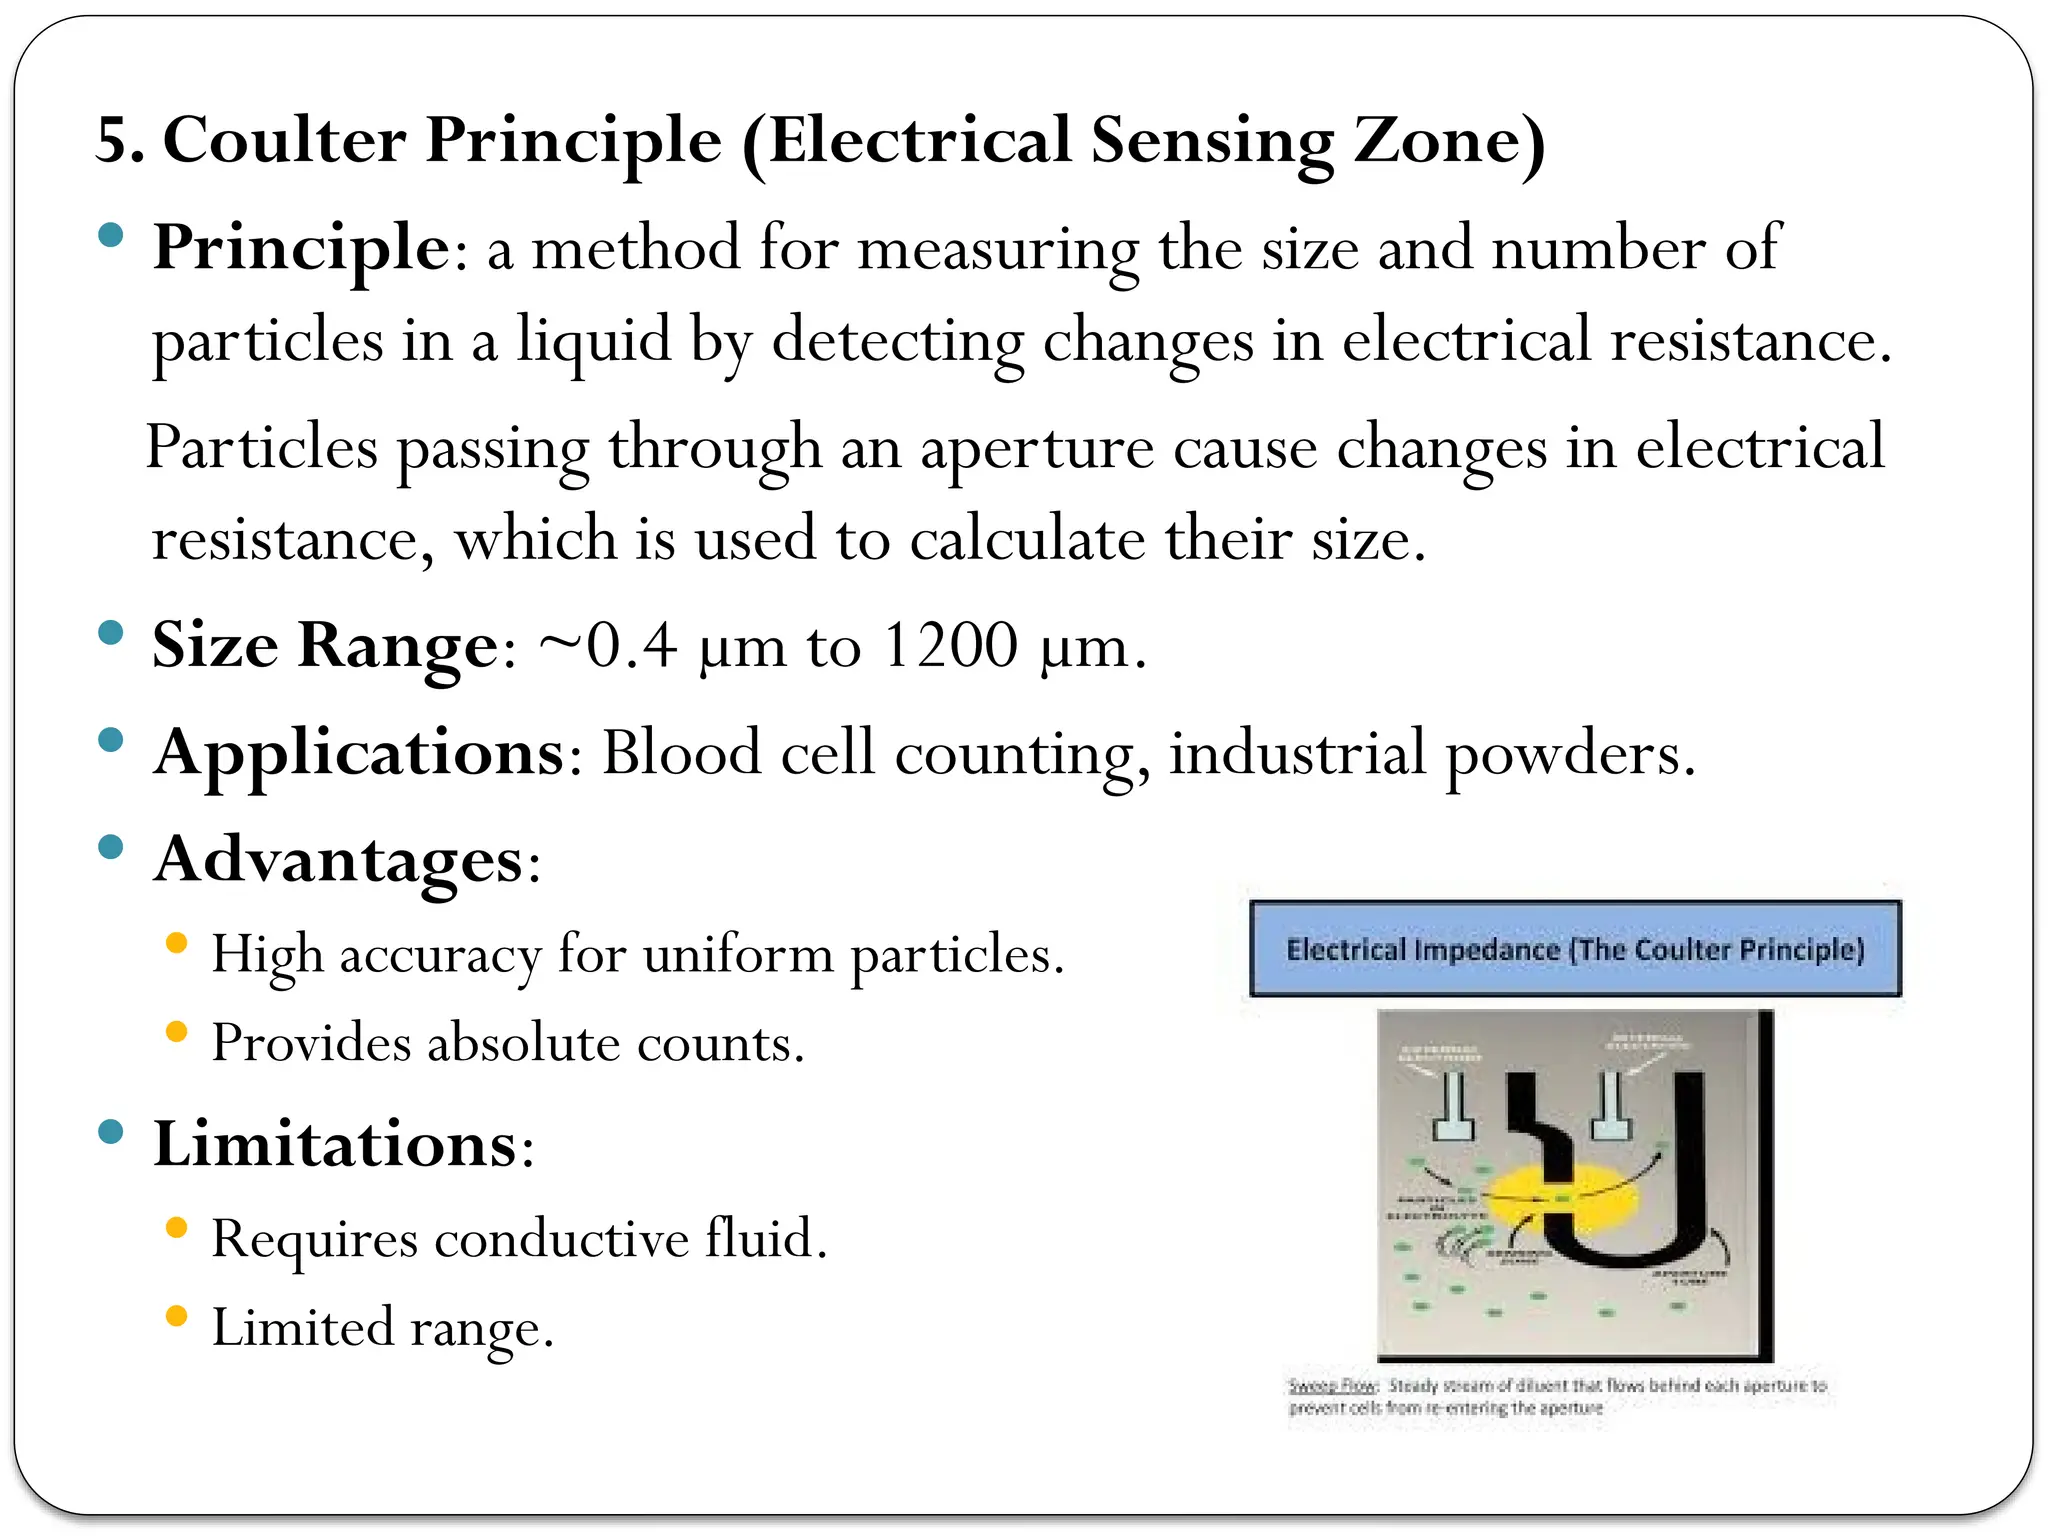
5. Coulter Principle(Electrical Sensing Zone)
Principle: a method for measuring the size and number of
particles in a liquid by detecting changes in electrical resistance.
Particles passing through an aperture cause changes in electrical
resistance, which is used to calculate their size.
Size Range: ~0.4 µm to 1200 µm.
Applications: Blood cell counting, industrial powders.
Advantages:
High accuracy for uniform particles.
Provides absolute counts.
Limitations:
Requires conductive fluid.
Limited range.
22.
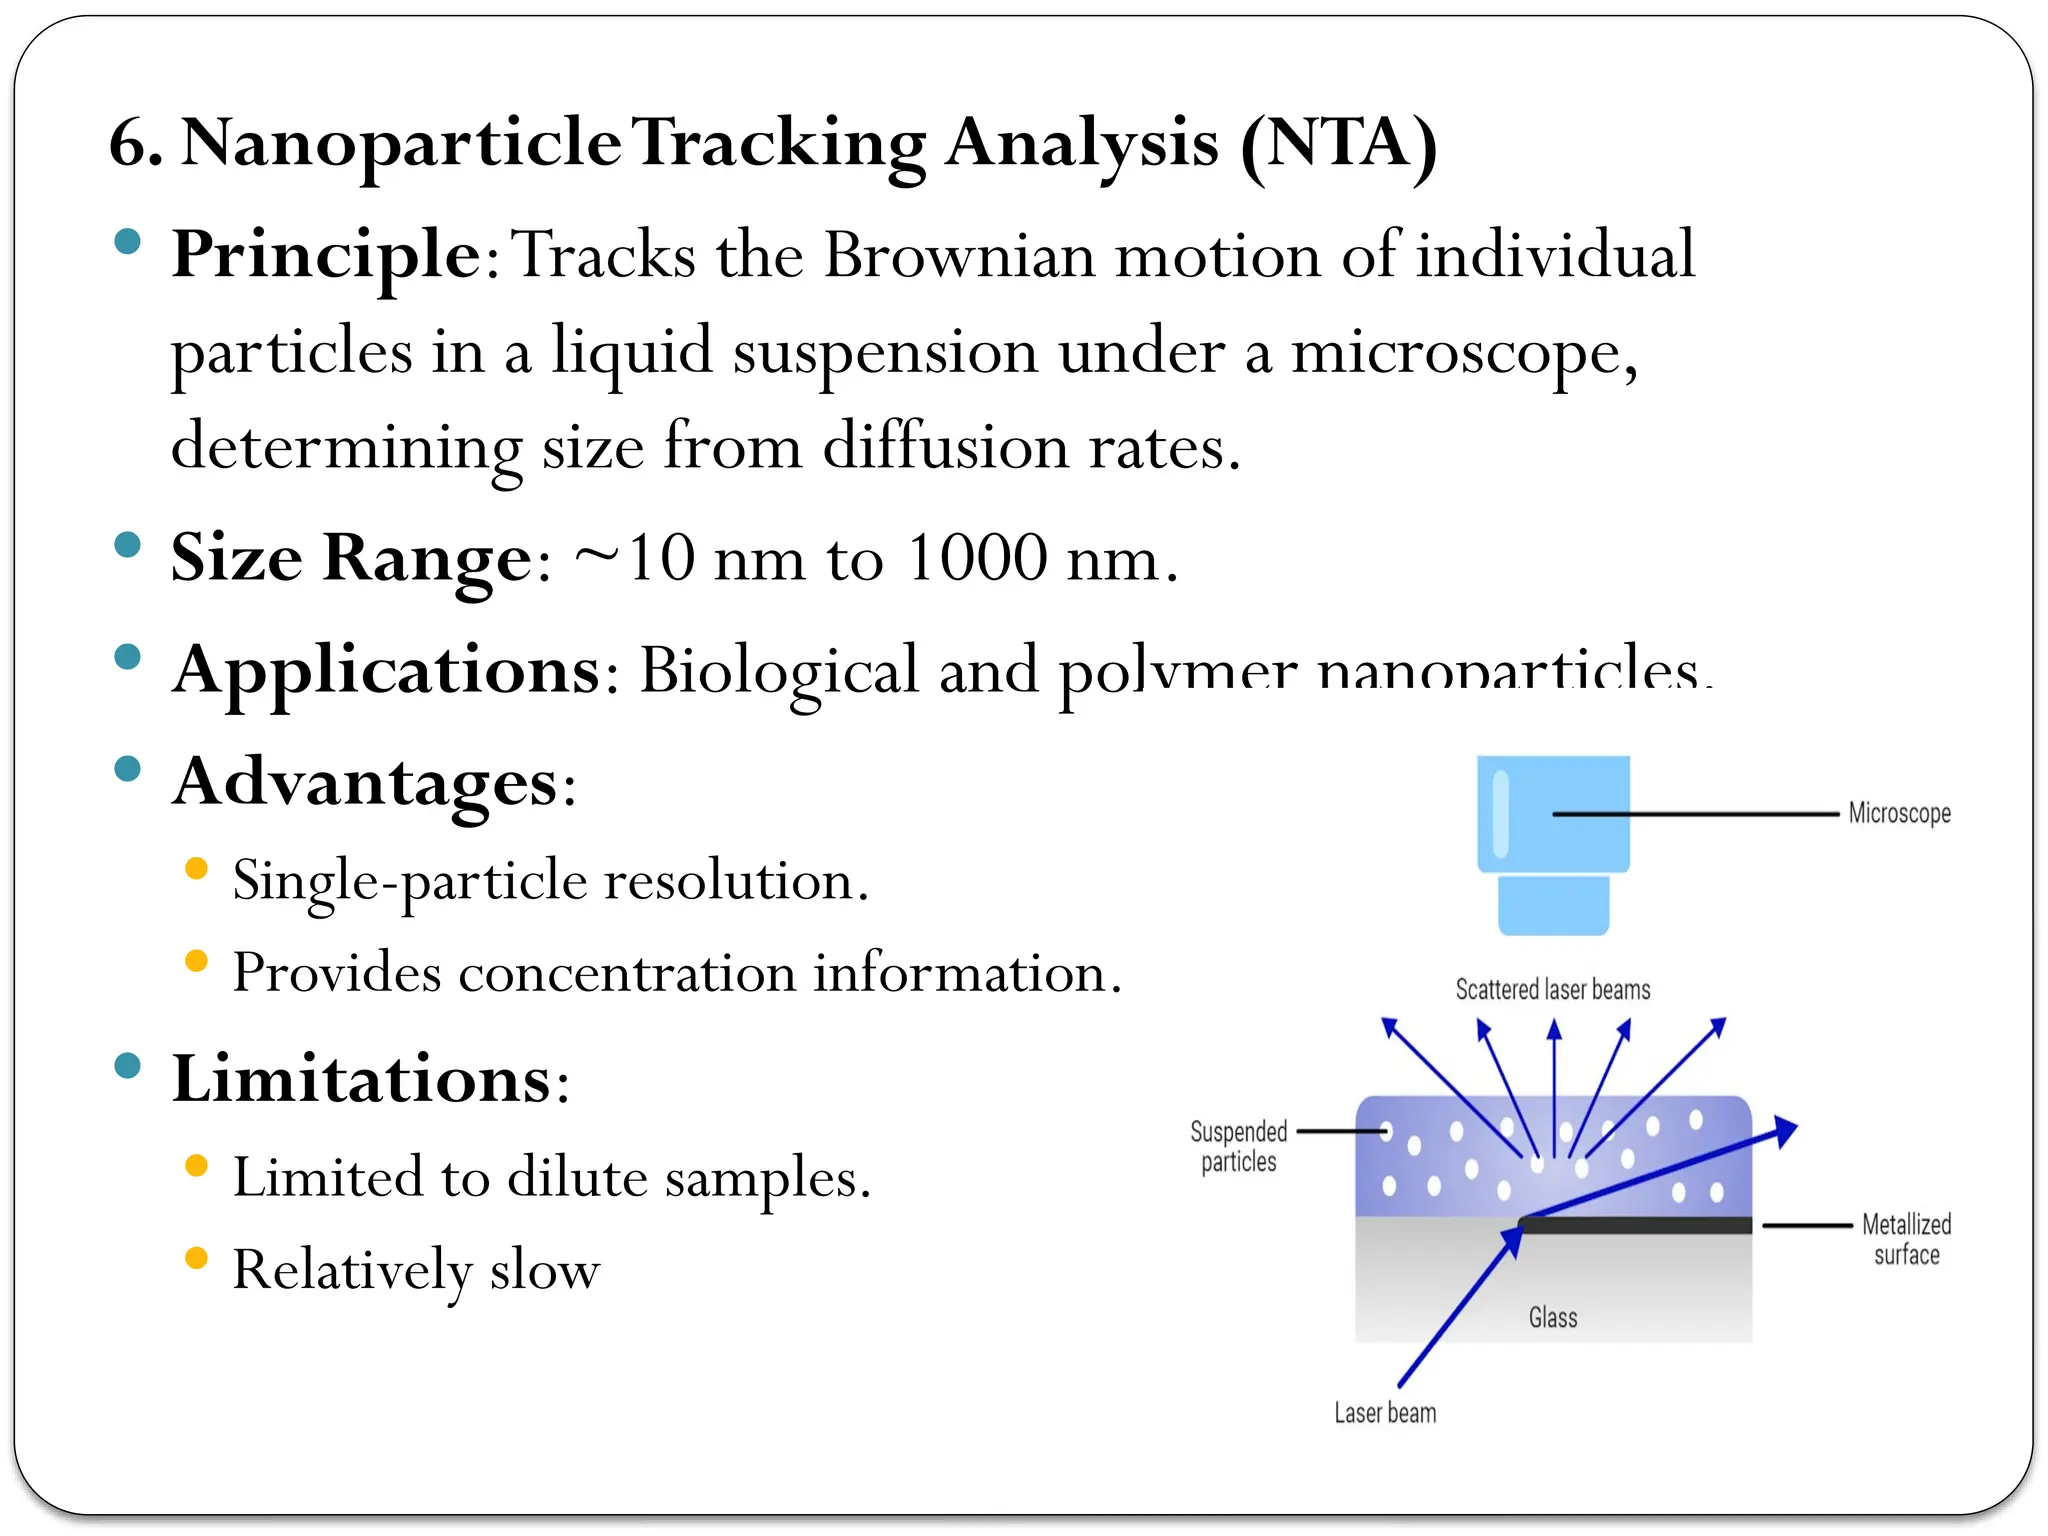
6. NanoparticleTracking Analysis(NTA)
Principle:Tracks the Brownian motion of individual
particles in a liquid suspension under a microscope,
determining size from diffusion rates.
Size Range: ~10 nm to 1000 nm.
Applications: Biological and polymer nanoparticles.
Advantages:
Single-particle resolution.
Provides concentration information.
Limitations:
Limited to dilute samples.
Relatively slow
23.
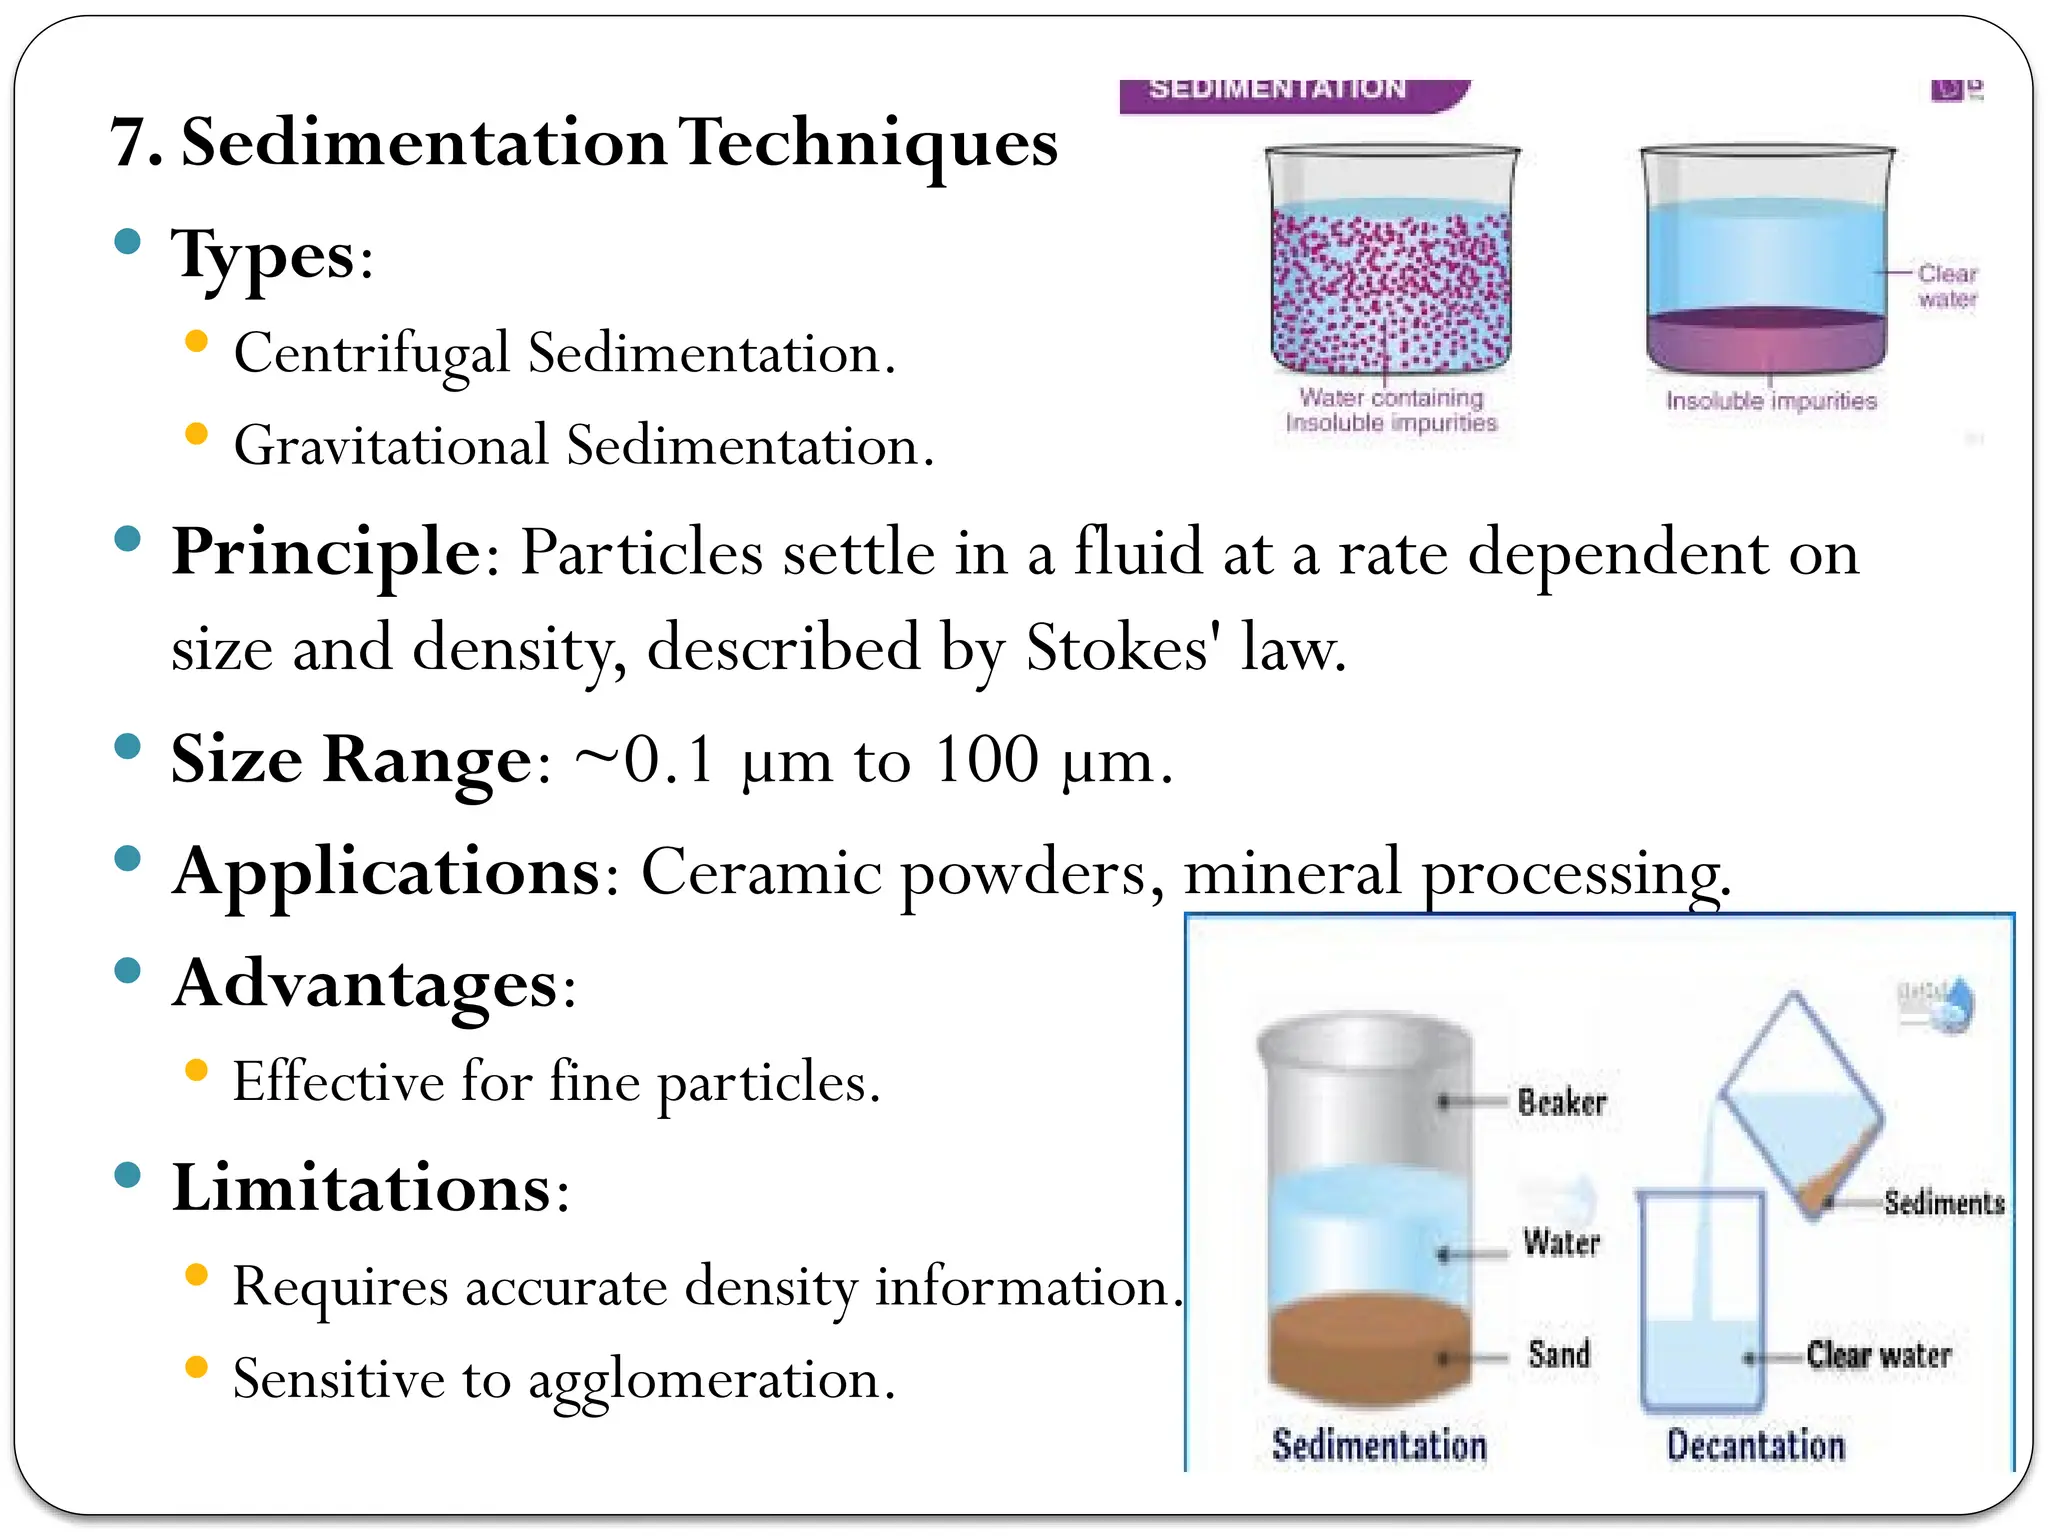
7. SedimentationTechniques
Types:
Centrifugal Sedimentation.
Gravitational Sedimentation.
Principle: Particles settle in a fluid at a rate dependent on
size and density, described by Stokes' law.
Size Range: ~0.1 µm to 100 µm.
Applications: Ceramic powders, mineral processing.
Advantages:
Effective for fine particles.
Limitations:
Requires accurate density information.
Sensitive to agglomeration.
24.
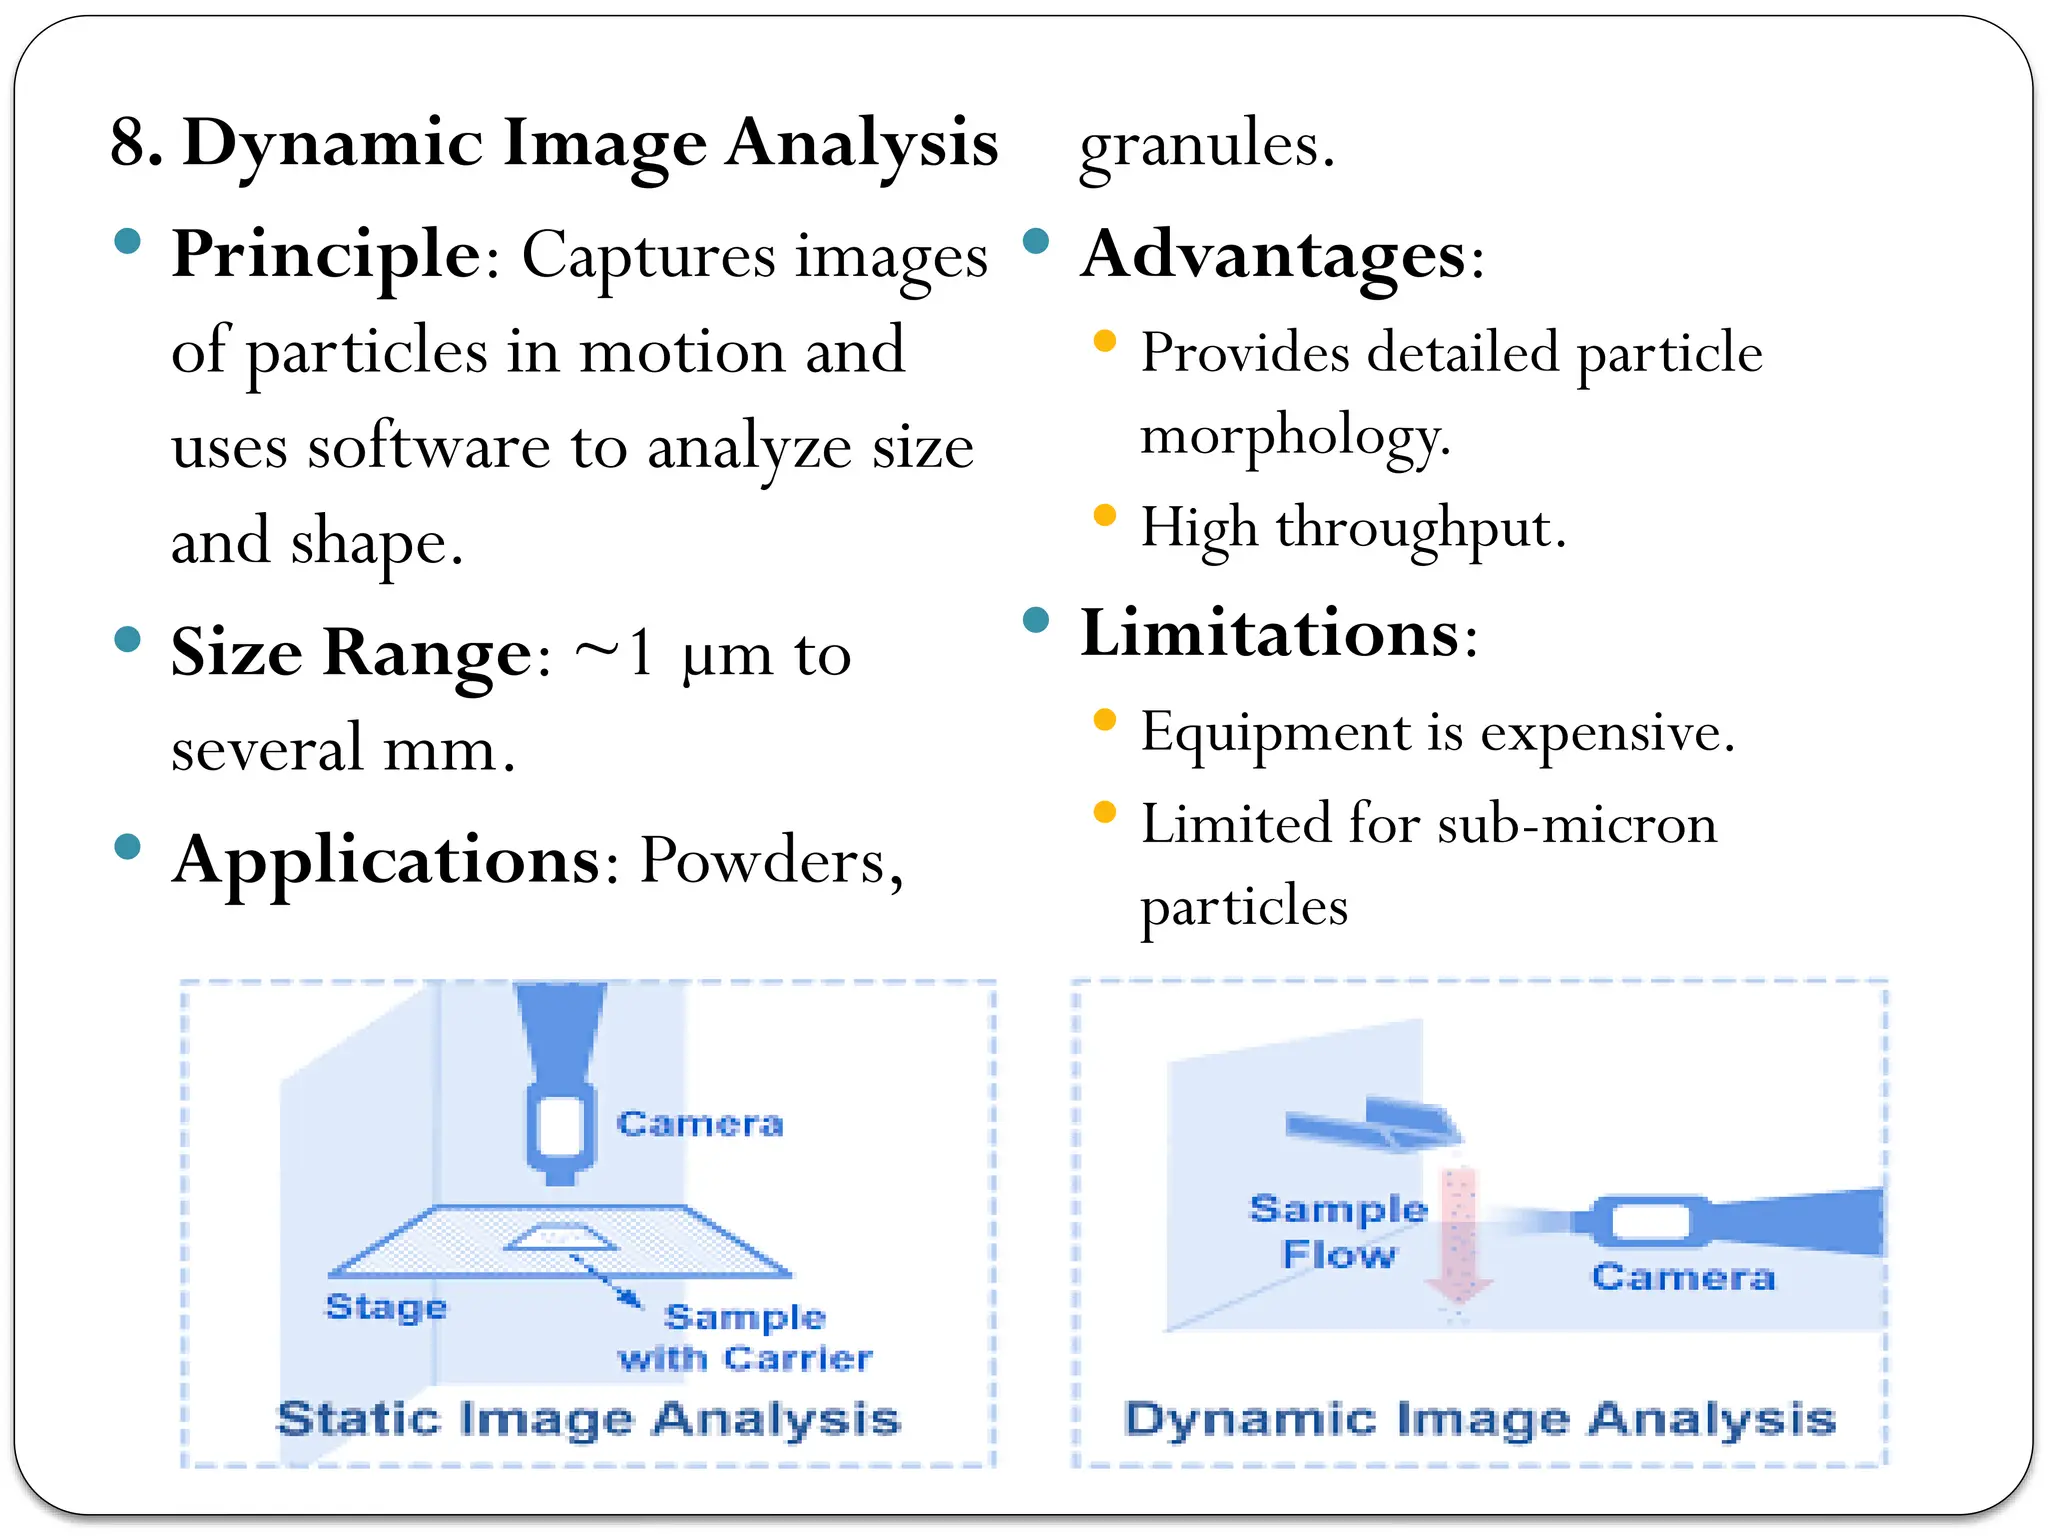
8. Dynamic ImageAnalysis
Principle: Captures images
of particles in motion and
uses software to analyze size
and shape.
Size Range: ~1 µm to
several mm.
Applications: Powders,
granules.
Advantages:
Provides detailed particle
morphology.
High throughput.
Limitations:
Equipment is expensive.
Limited for sub-micron
particles
25.
9.Acoustic Attenuation Spectroscopy
Principle: Measures the attenuation of ultrasonic waves
passing through a suspension to calculate particle size
distribution.
Size Range: ~0.1 µm to 1000 µm.
Applications: Emulsions, suspensions.
Advantages:
Works for concentrated systems.
Limitations:
Limited resolution for polydisperse samples
26.
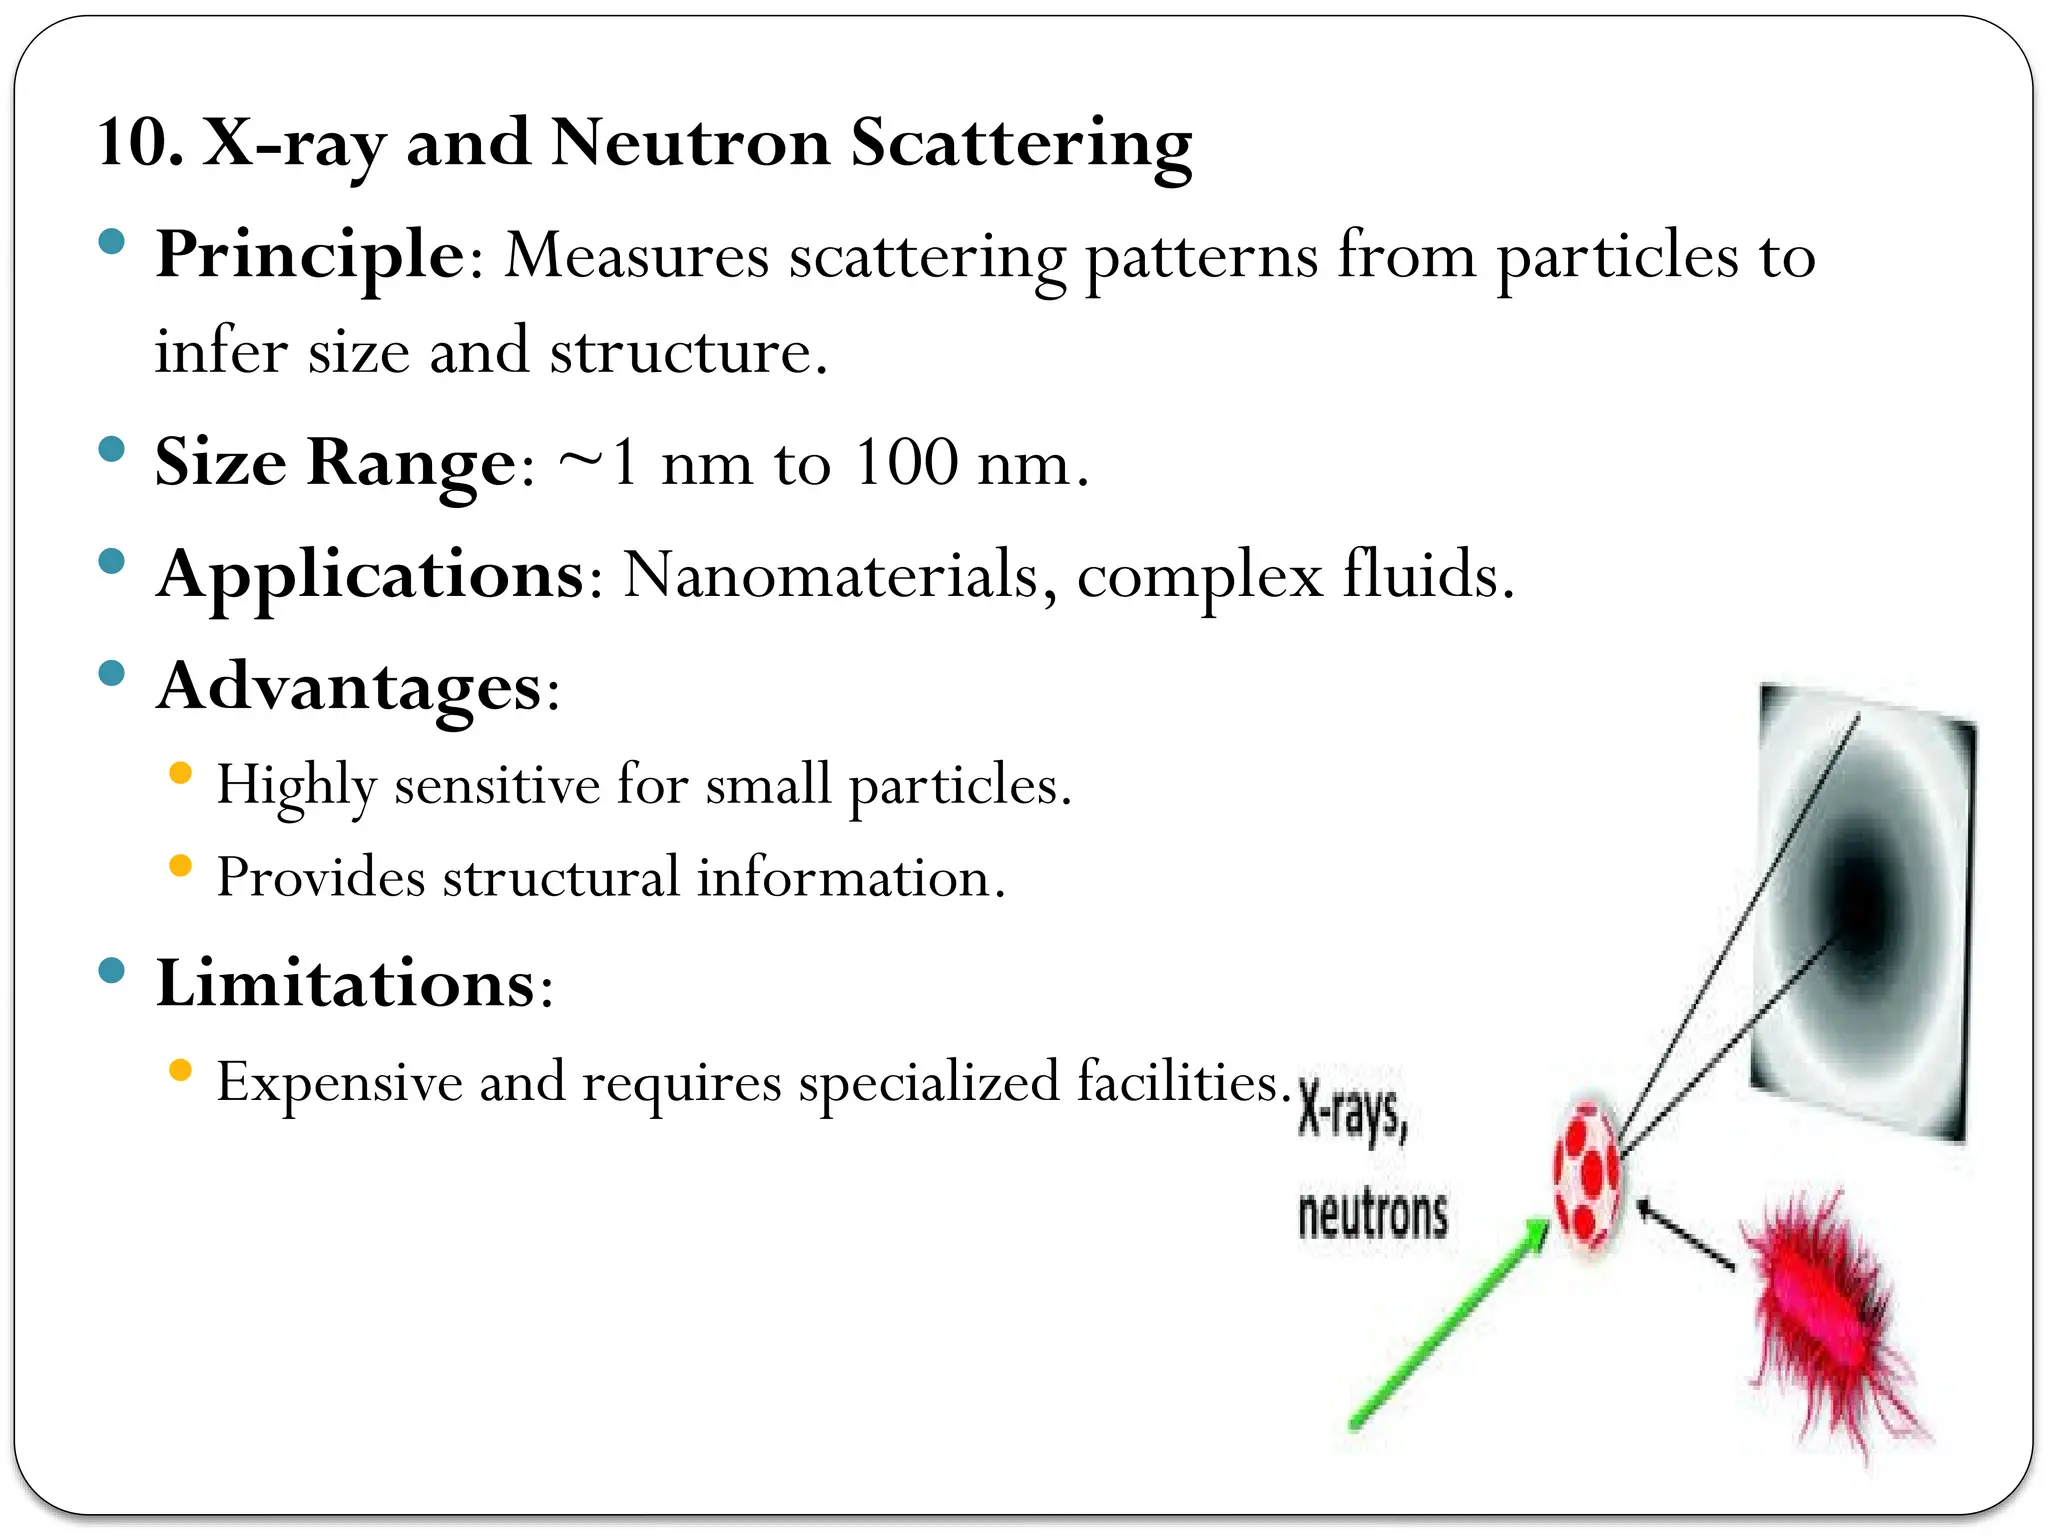
10. X-ray andNeutron Scattering
Principle: Measures scattering patterns from particles to
infer size and structure.
Size Range: ~1 nm to 100 nm.
Applications: Nanomaterials, complex fluids.
Advantages:
Highly sensitive for small particles.
Provides structural information.
Limitations:
Expensive and requires specialized facilities.
27.
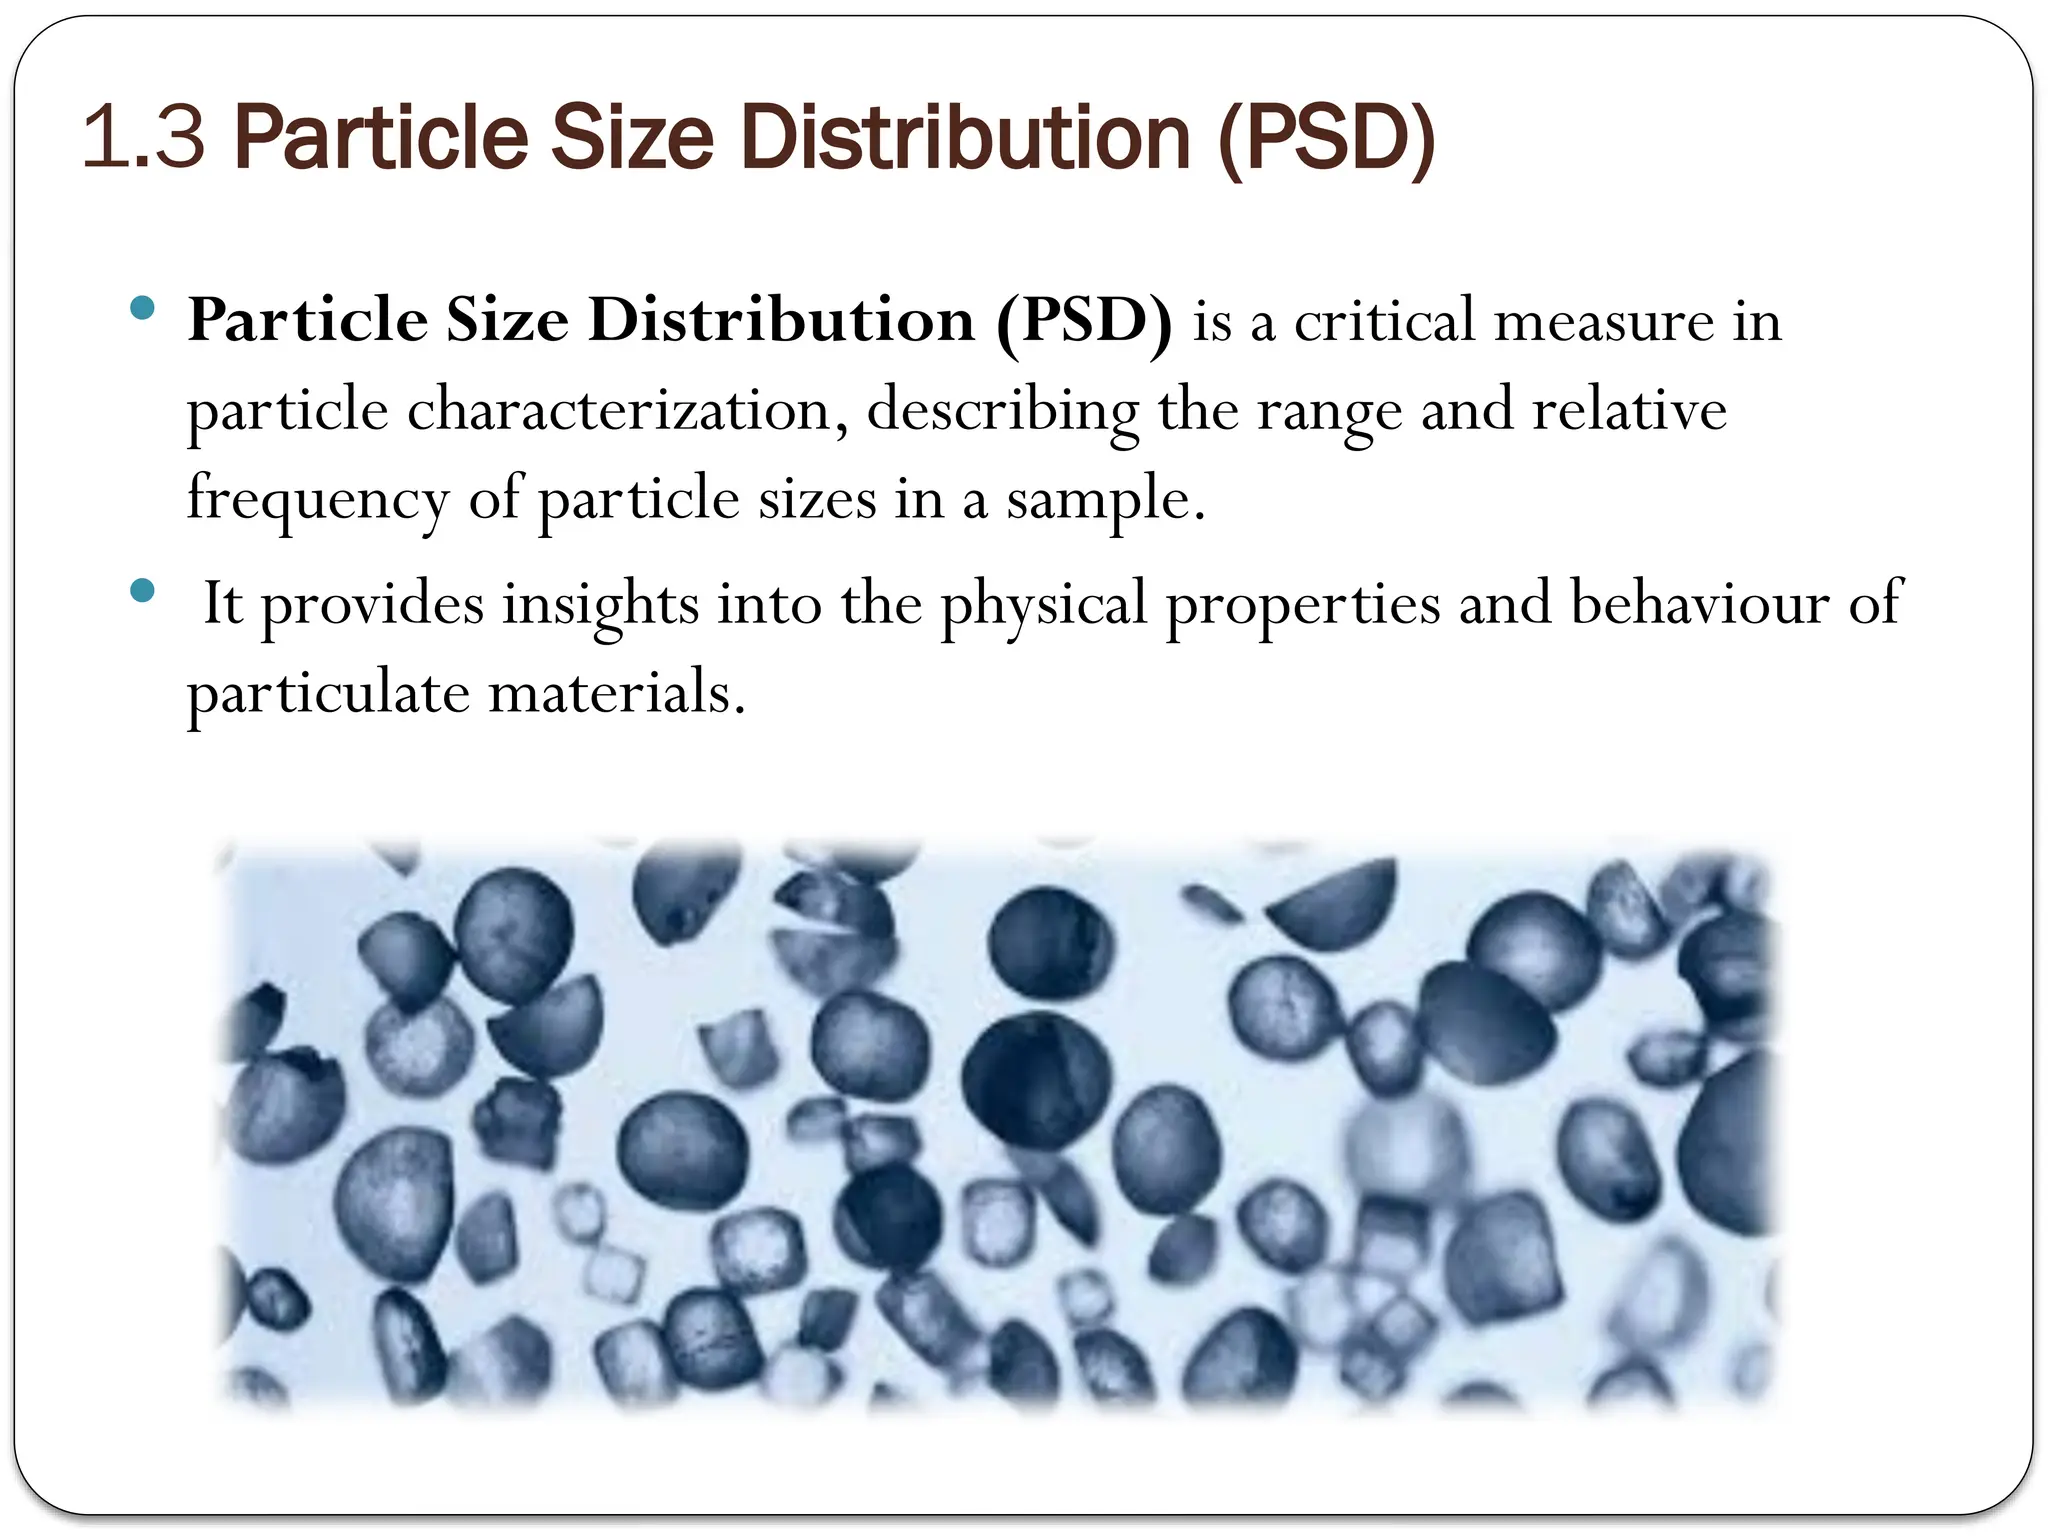
1.3 Particle SizeDistribution (PSD)
Particle Size Distribution (PSD) is a critical measure in
particle characterization, describing the range and relative
frequency of particle sizes in a sample.
It provides insights into the physical properties and behaviour of
particulate materials.
28.
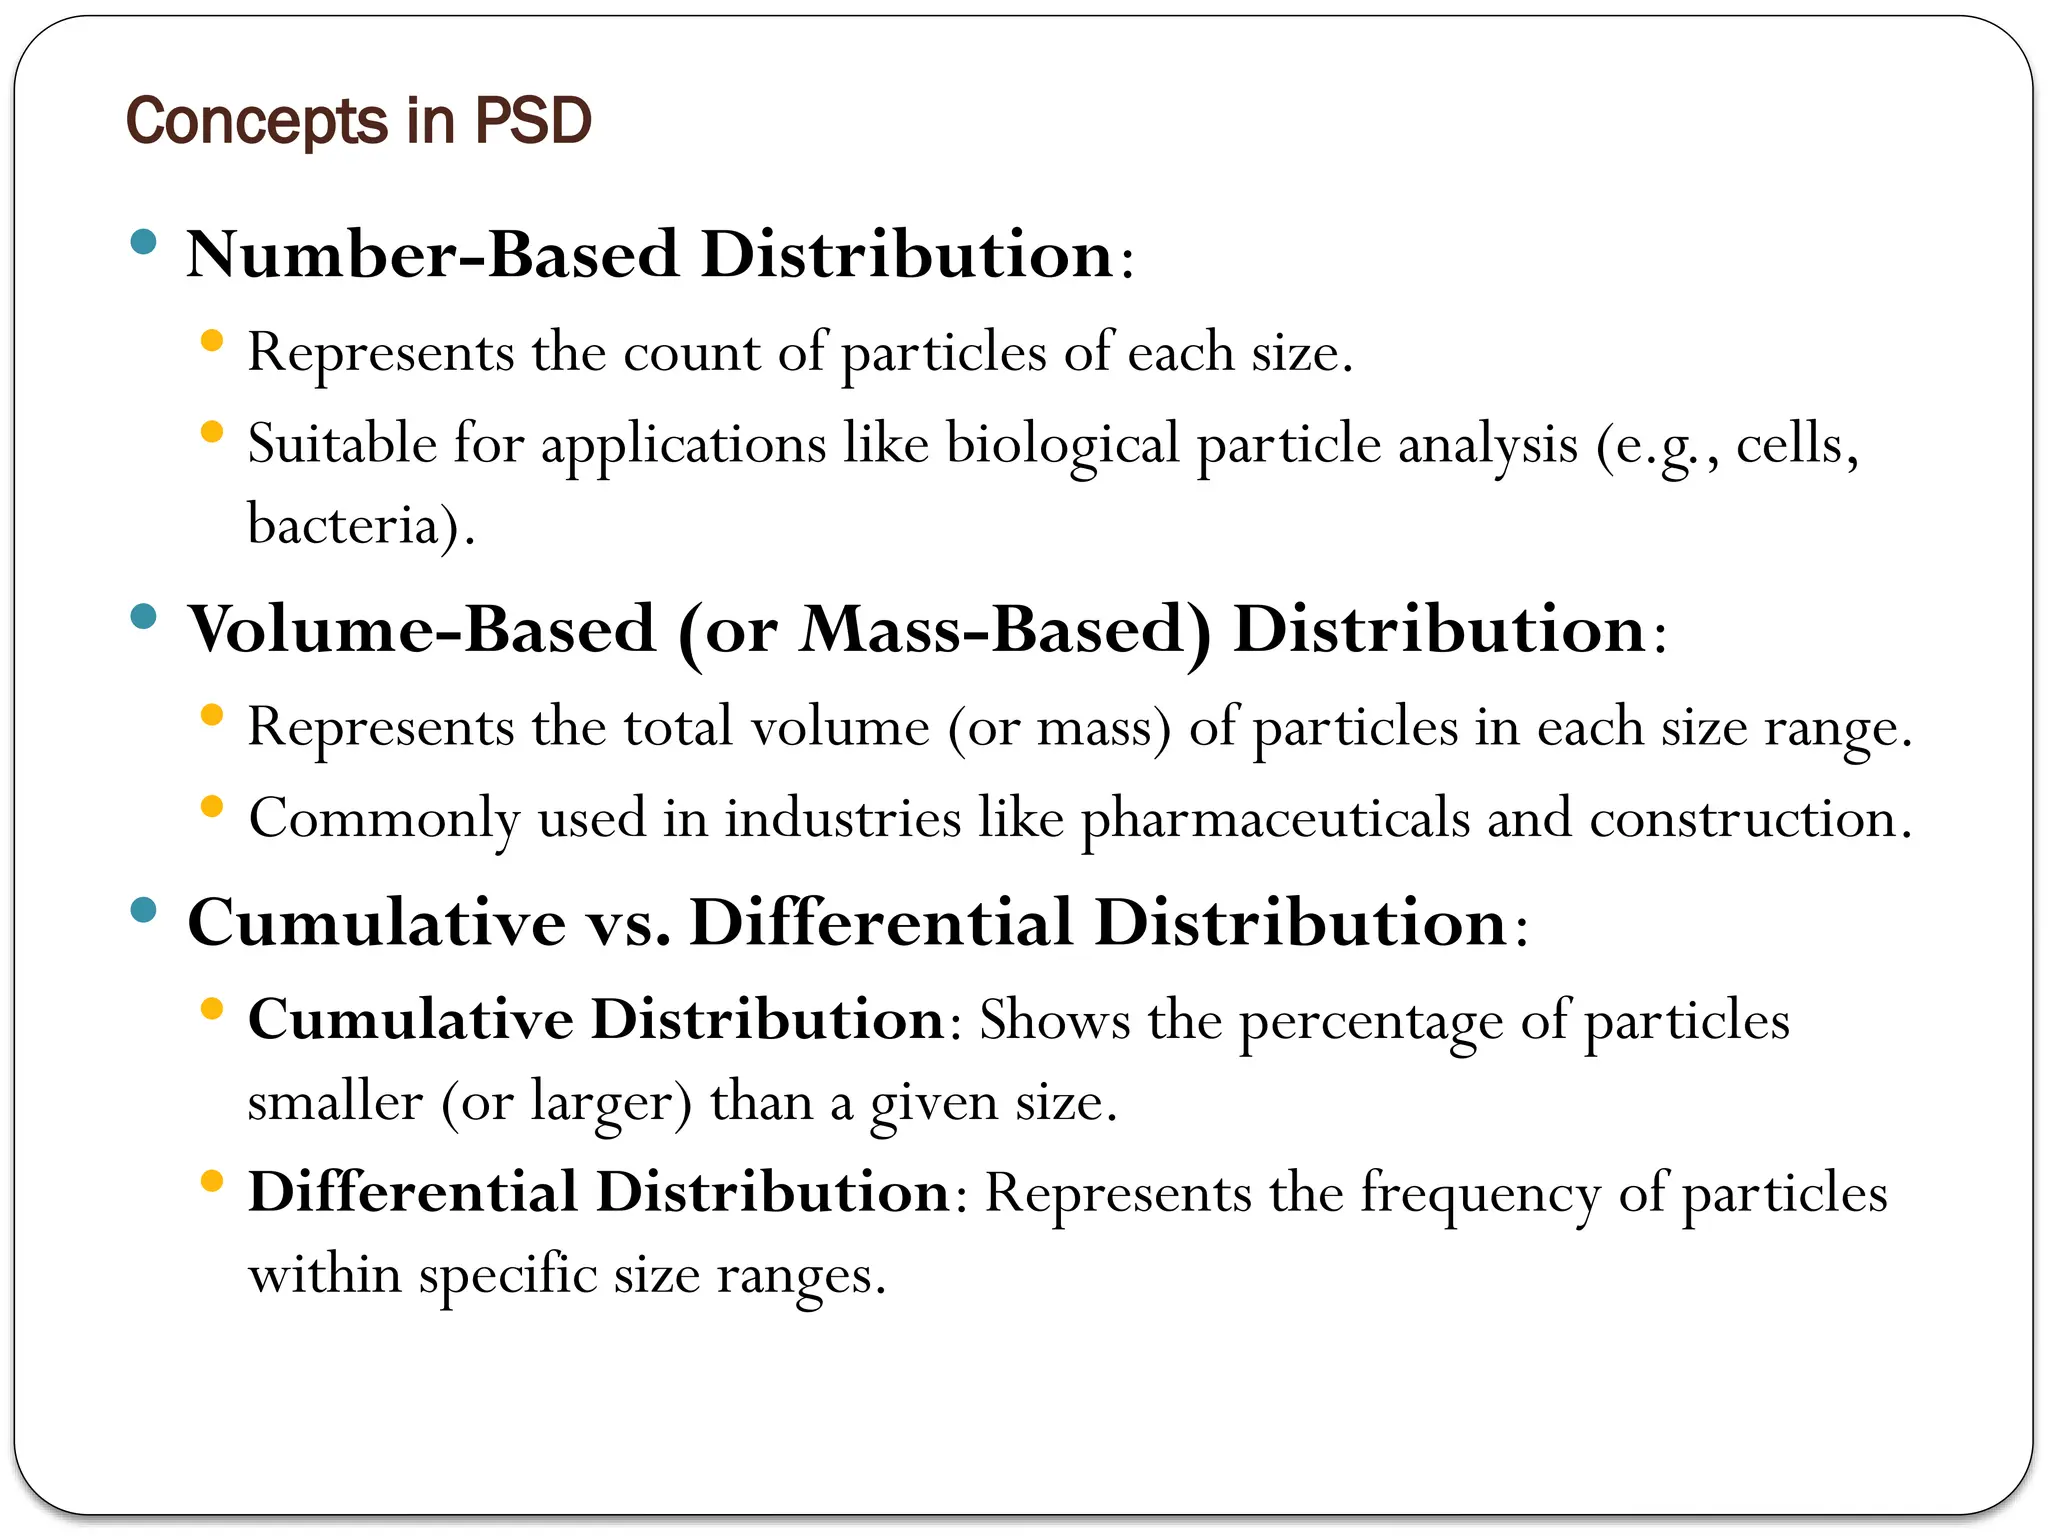
Concepts in PSD
Number-Based Distribution:
Represents the count of particles of each size.
Suitable for applications like biological particle analysis (e.g., cells,
bacteria).
Volume-Based (or Mass-Based) Distribution:
Represents the total volume (or mass) of particles in each size range.
Commonly used in industries like pharmaceuticals and construction.
Cumulative vs. Differential Distribution:
Cumulative Distribution: Shows the percentage of particles
smaller (or larger) than a given size.
Differential Distribution: Represents the frequency of particles
within specific size ranges.
29.
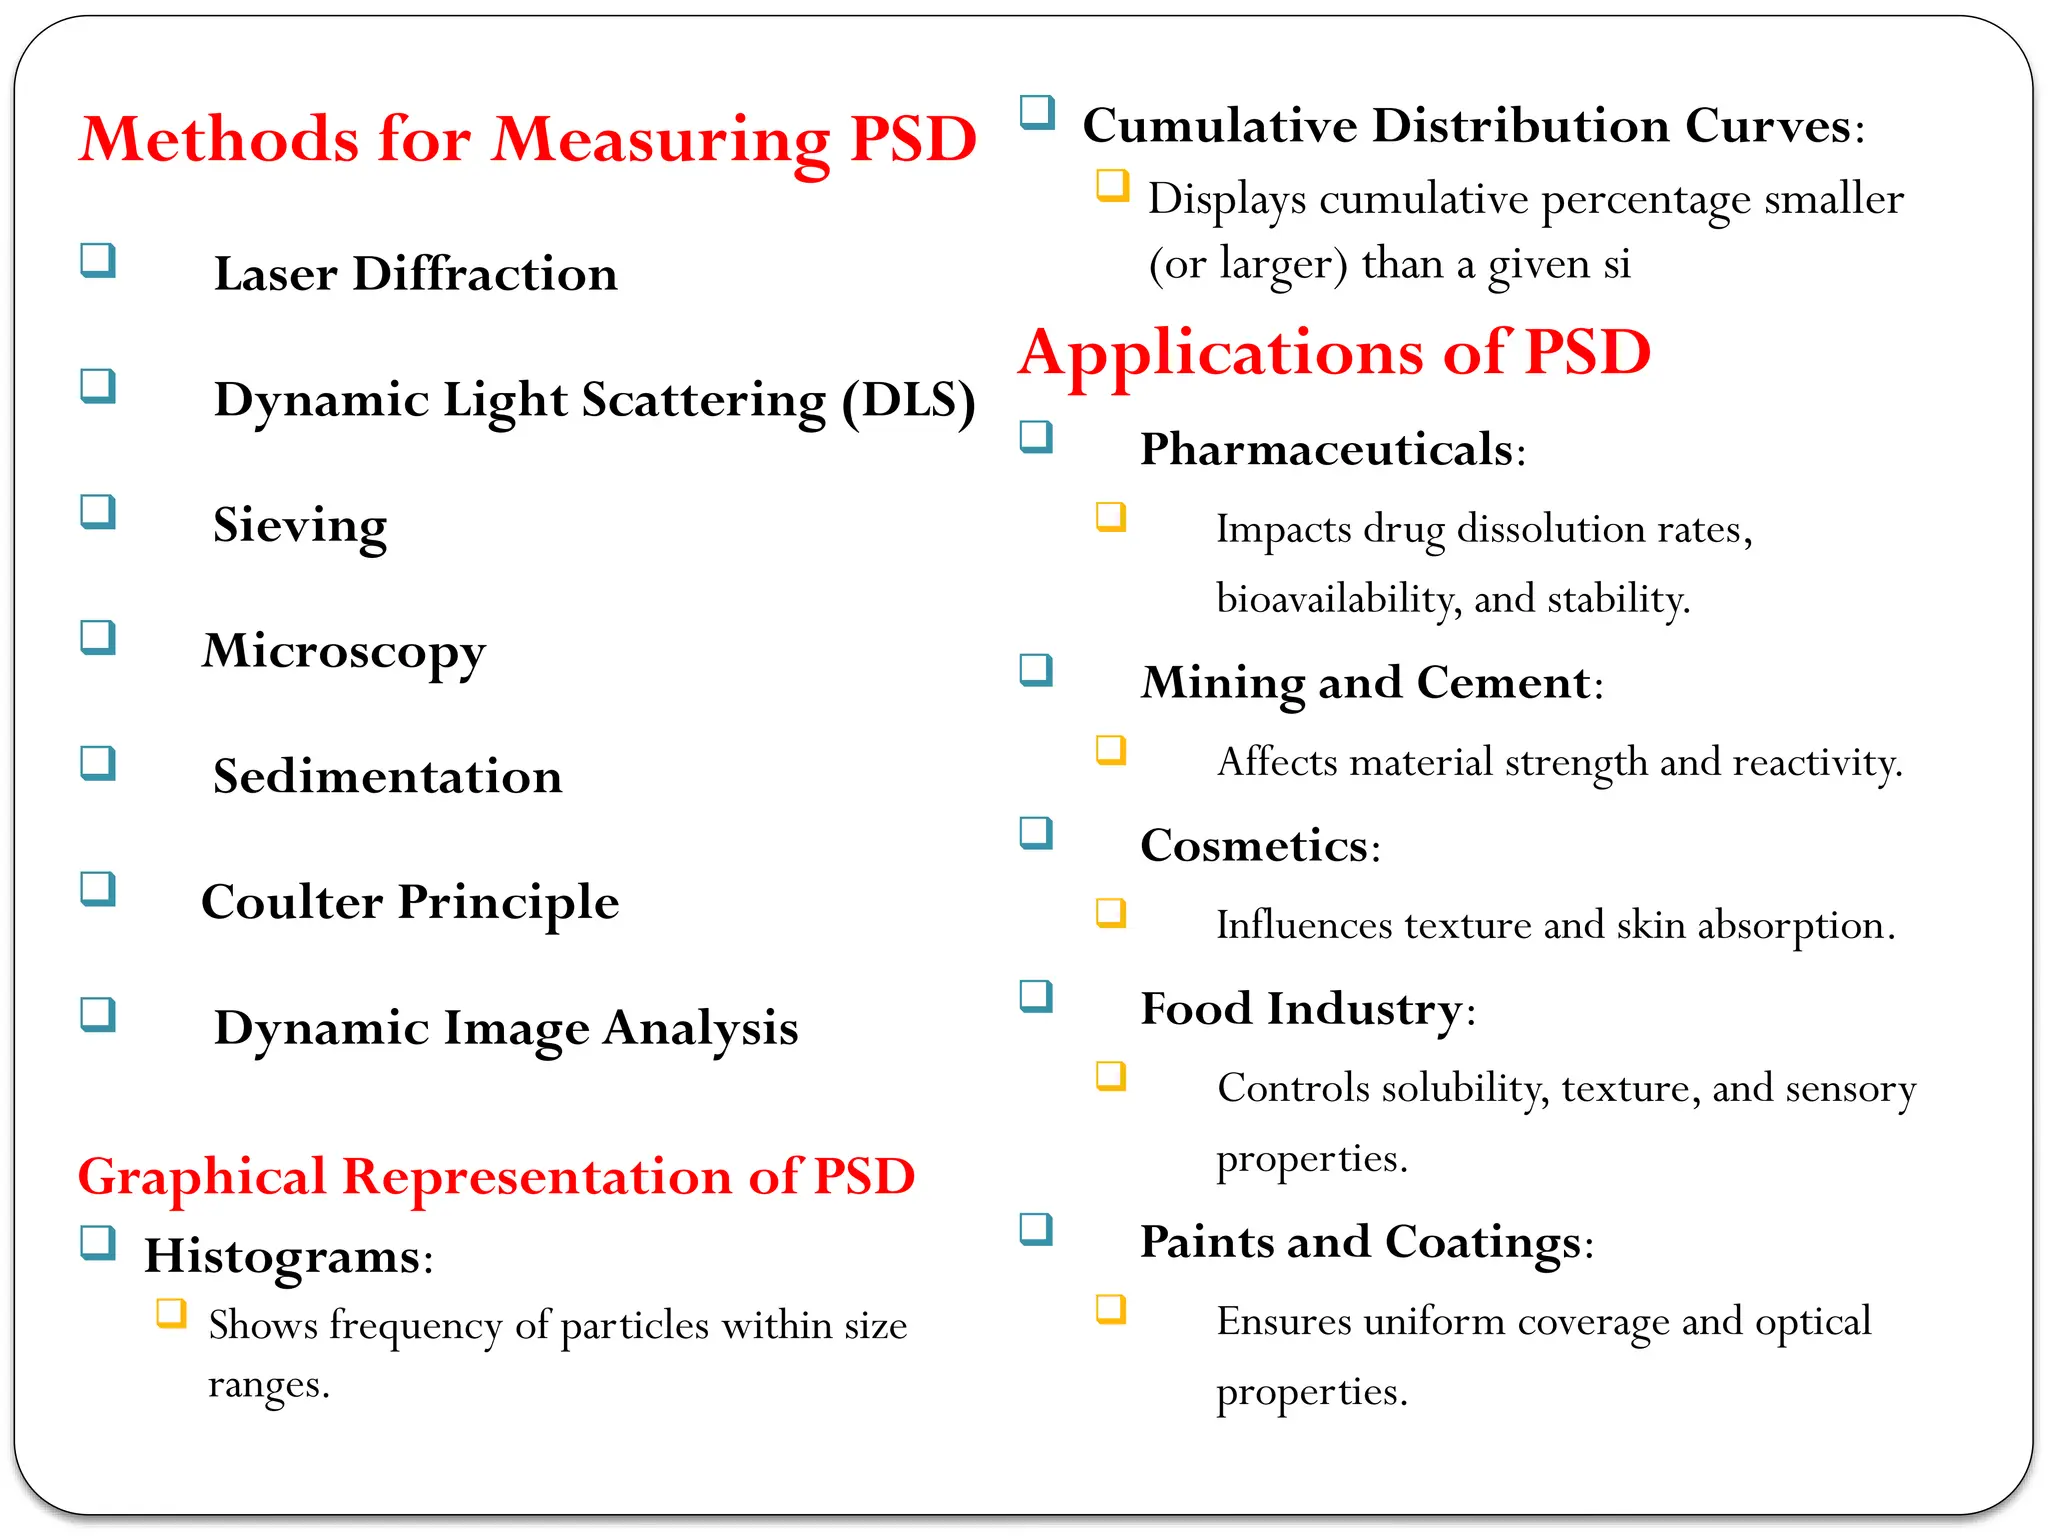
Methods for MeasuringPSD
Laser Diffraction
Dynamic Light Scattering (DLS)
Sieving
Microscopy
Sedimentation
Coulter Principle
Dynamic Image Analysis
Graphical Representation of PSD
Histograms:
Shows frequency of particles within size
ranges.
Cumulative Distribution Curves:
Displays cumulative percentage smaller
(or larger) than a given si
Applications of PSD
Pharmaceuticals:
Impacts drug dissolution rates,
bioavailability, and stability.
Mining and Cement:
Affects material strength and reactivity.
Cosmetics:
Influences texture and skin absorption.
Food Industry:
Controls solubility, texture, and sensory
properties.
Paints and Coatings:
Ensures uniform coverage and optical
properties.
30.
1.4 Mean ParticleSize
The mean particle size is a statistical measure of the average
size of particles in a sample.
Mean particle size is the average diameter of a group of particles
It plays a crucial role in understanding and controlling the
behaviour of particulate systems, such as powders, suspensions,
and emulsions.
31.
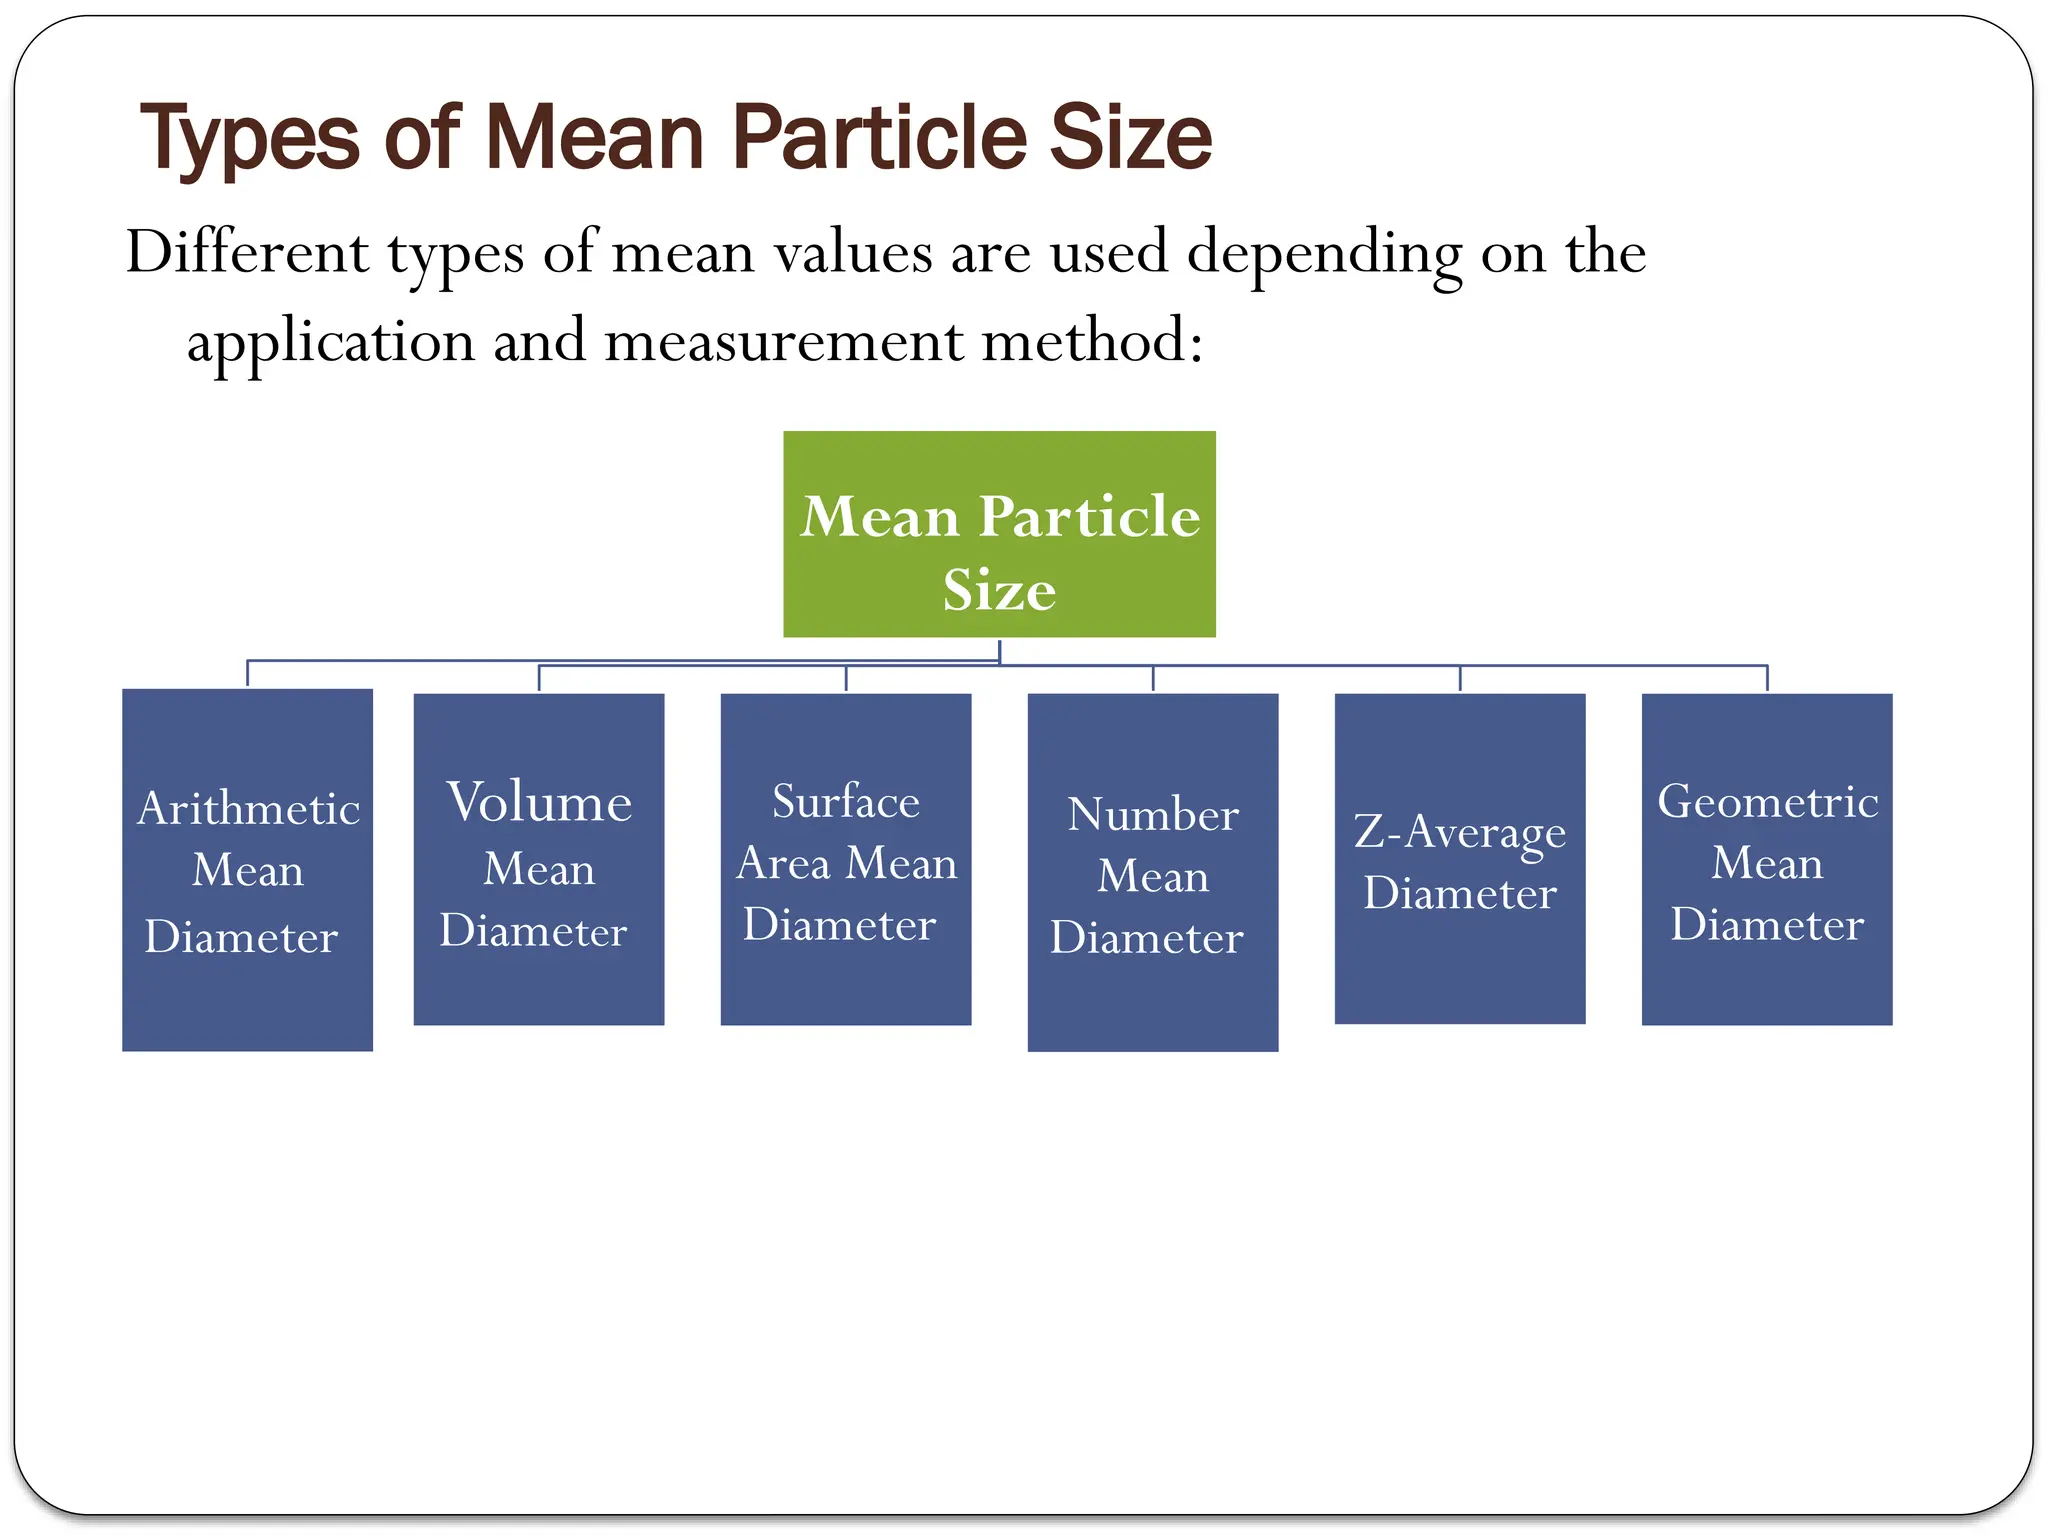
Types of MeanParticle Size
Different types of mean values are used depending on the
application and measurement method:
Mean Particle
Size
Arithmetic
Mean
Diameter
Volume
Mean
Diameter
Surface
Area Mean
Diameter
Number
Mean
Diameter
Z-Average
Diameter
Geometric
Mean
Diameter
32.
1.5 Mixed ParticleSizes And Size Analysis
When dealing with mixed particle sizes, particle size analysis
becomes more complex and involves understanding the
distribution of particles in terms of various size fractions.
This is critical for applications where particle size impacts
material performance, such as pharmaceuticals, ceramics, or
environmental monitoring.
33.
Characteristics of MixedParticle Sizes
Polydispersity:
A measure of the variability
in particle sizes within a
sample.
Polydisperse samples have a
wide range of particle sizes,
while monodisperse samples
have uniform sizes.
Polydisperse means having
particles of different sizes.
It can describe the variation
in particle sizes in a dispersed
system, such as a colloidal
dispersion.
Why is polydispersity
important?
Polydispersity is important to
consider in data interpretation
because it can affect magnetic
properties and phase diagrams.
Polydispersity is also important in
the fields of molecular and
nanoparticulate characterization.
34.
Size Distribution:
Mixed particle sizes are represented by a particle size
distribution (PSD), which can be plotted as:
Histogram: Frequency of particle sizes in specific ranges.
Cumulative Curve: Percentage of particles smaller or larger than a certain
size.
Weighted Averages:
Size distribution data is used to compute various mean diameters to
characterize mixed sizes
Challenges in MixedSize Analysis
Overlapping Size Ranges:
Techniques like laser diffraction might blur distinctions between
particle populations.
Shape Effects:
Non-spherical particles can introduce biases in size measurements.
Aggregation:
Clumping of particles can skew results.
Resolution:
Selecting the right technique is crucial for accurately resolving
distinct particle sizes.
37.
Applications of MixedParticle Size Analysis
Pharmaceuticals:
Optimizing drug dissolution and bioavailability.
Ceramics and Composites:
Ensuring strength and uniformity by mixing different particle
sizes.
Food and Beverage:
Controlling texture and sensory properties.
Environmental Science:
Characterizing aerosols and sediment distributions
38.
1.6 Specific Surfacearea Of Mixture
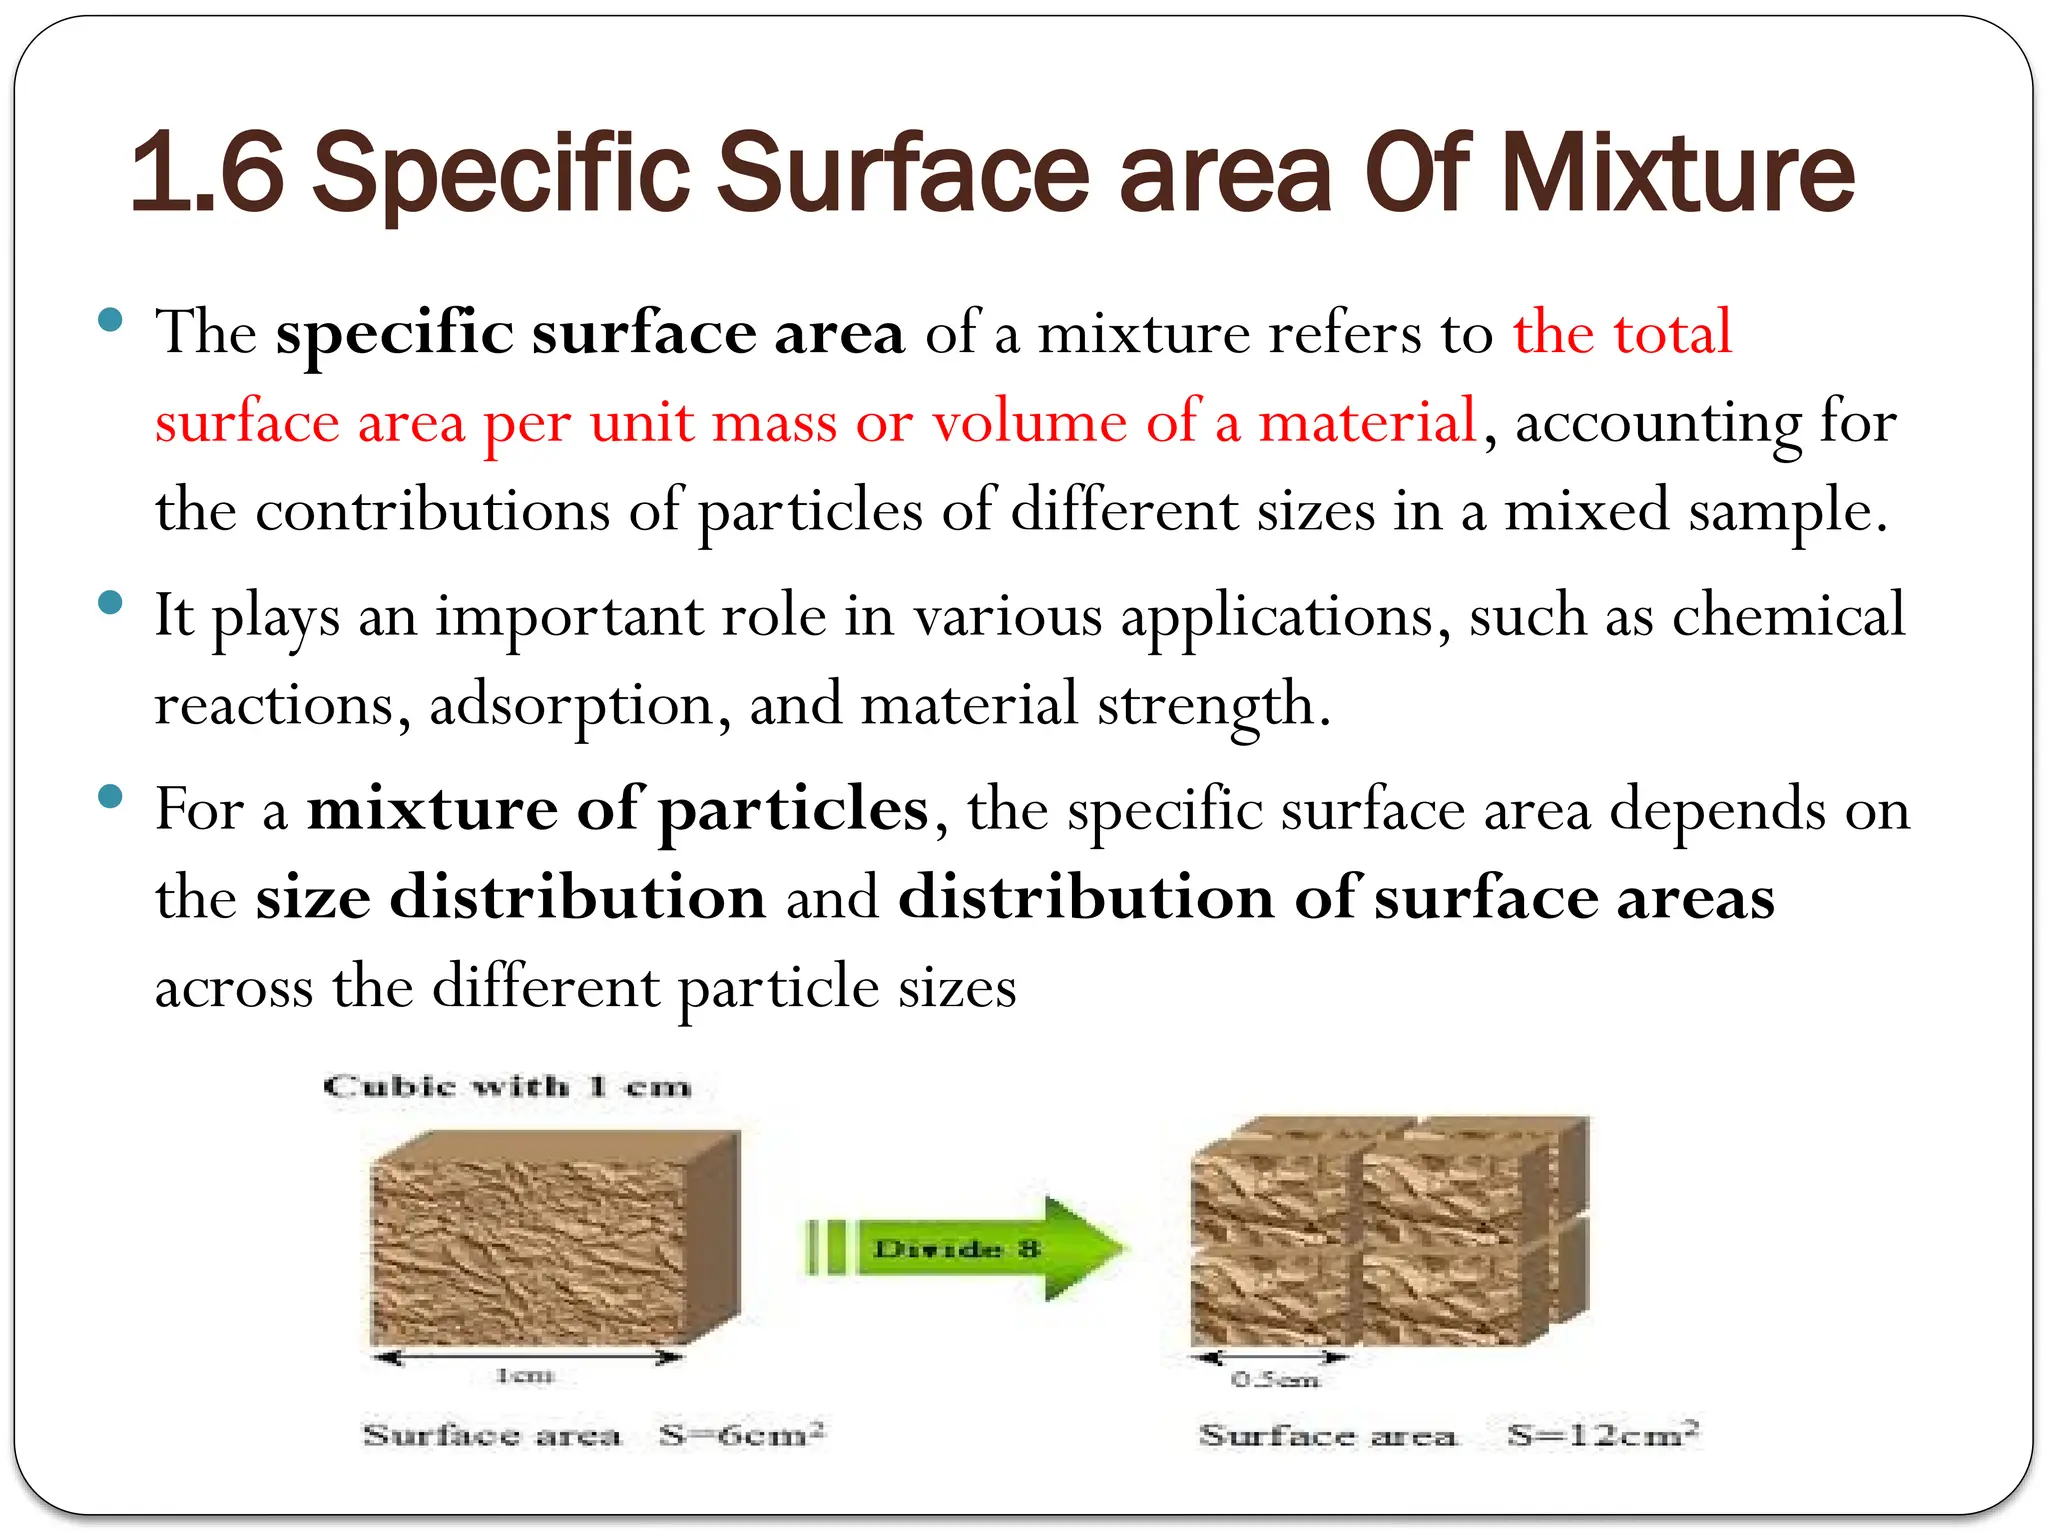
The specific surface area of a mixture refers to the total
surface area per unit mass or volume of a material, accounting for
the contributions of particles of different sizes in a mixed sample.
It plays an important role in various applications, such as chemical
reactions, adsorption, and material strength.
For a mixture of particles, the specific surface area depends on
the size distribution and distribution of surface areas
across the different particle sizes
39.
Calculating the SpecificSurface Area of a Mixture
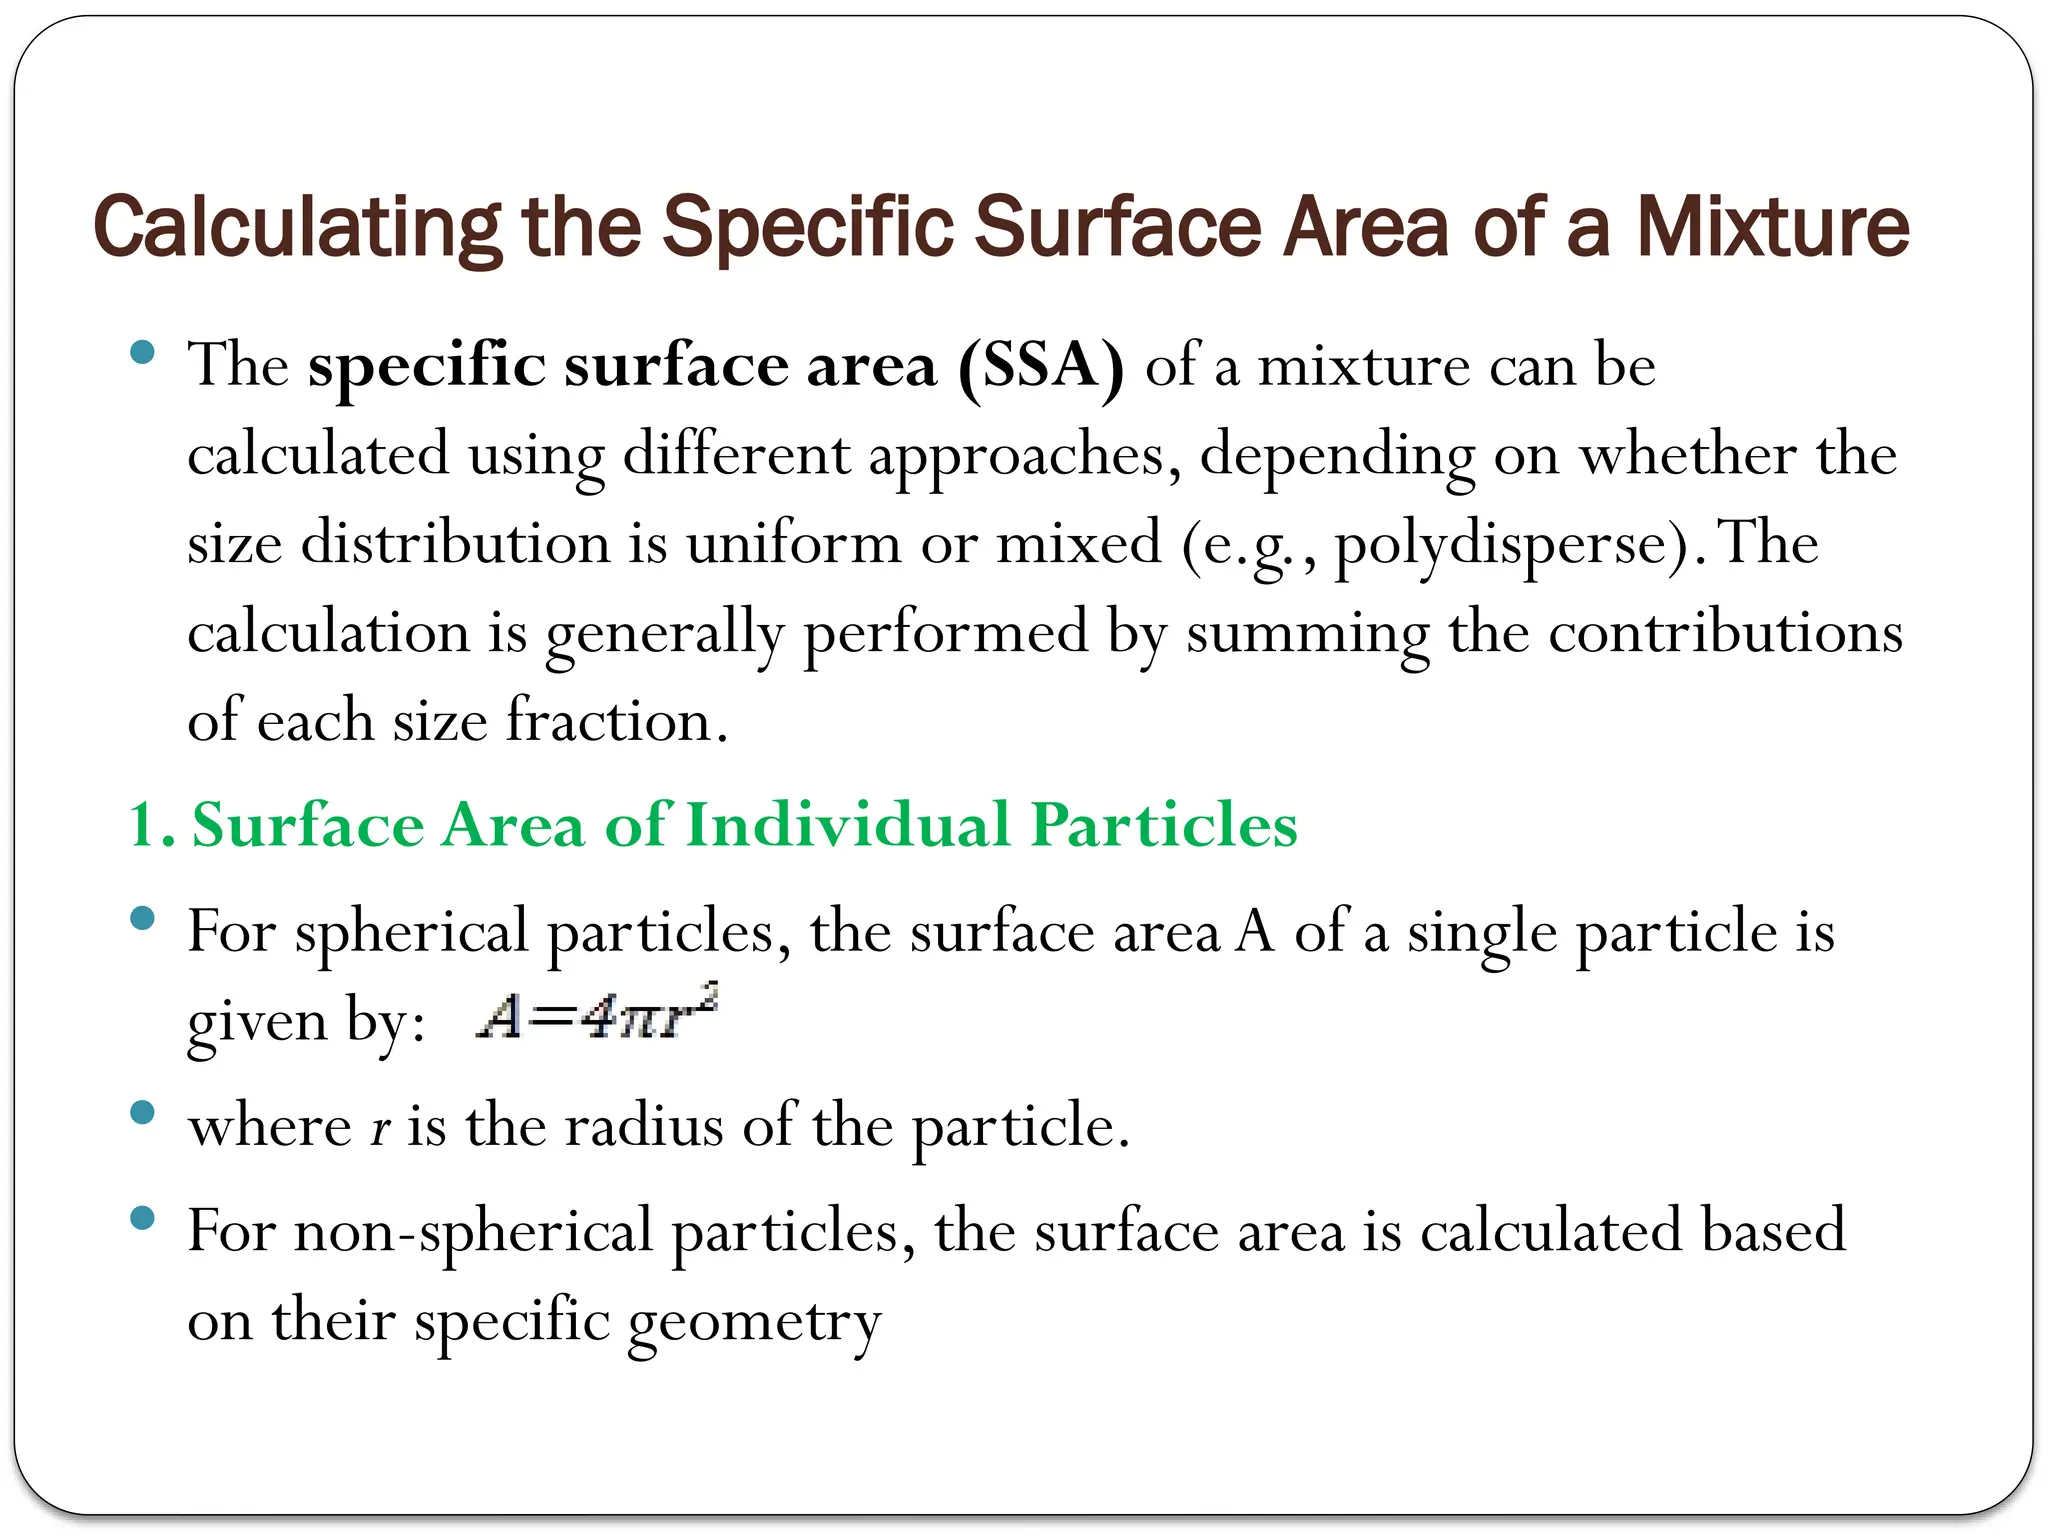
The specific surface area (SSA) of a mixture can be
calculated using different approaches, depending on whether the
size distribution is uniform or mixed (e.g., polydisperse).The
calculation is generally performed by summing the contributions
of each size fraction.
1. Surface Area of Individual Particles
For spherical particles, the surface area A of a single particle is
given by:
where r is the radius of the particle.
For non-spherical particles, the surface area is calculated based
on their specific geometry
40.
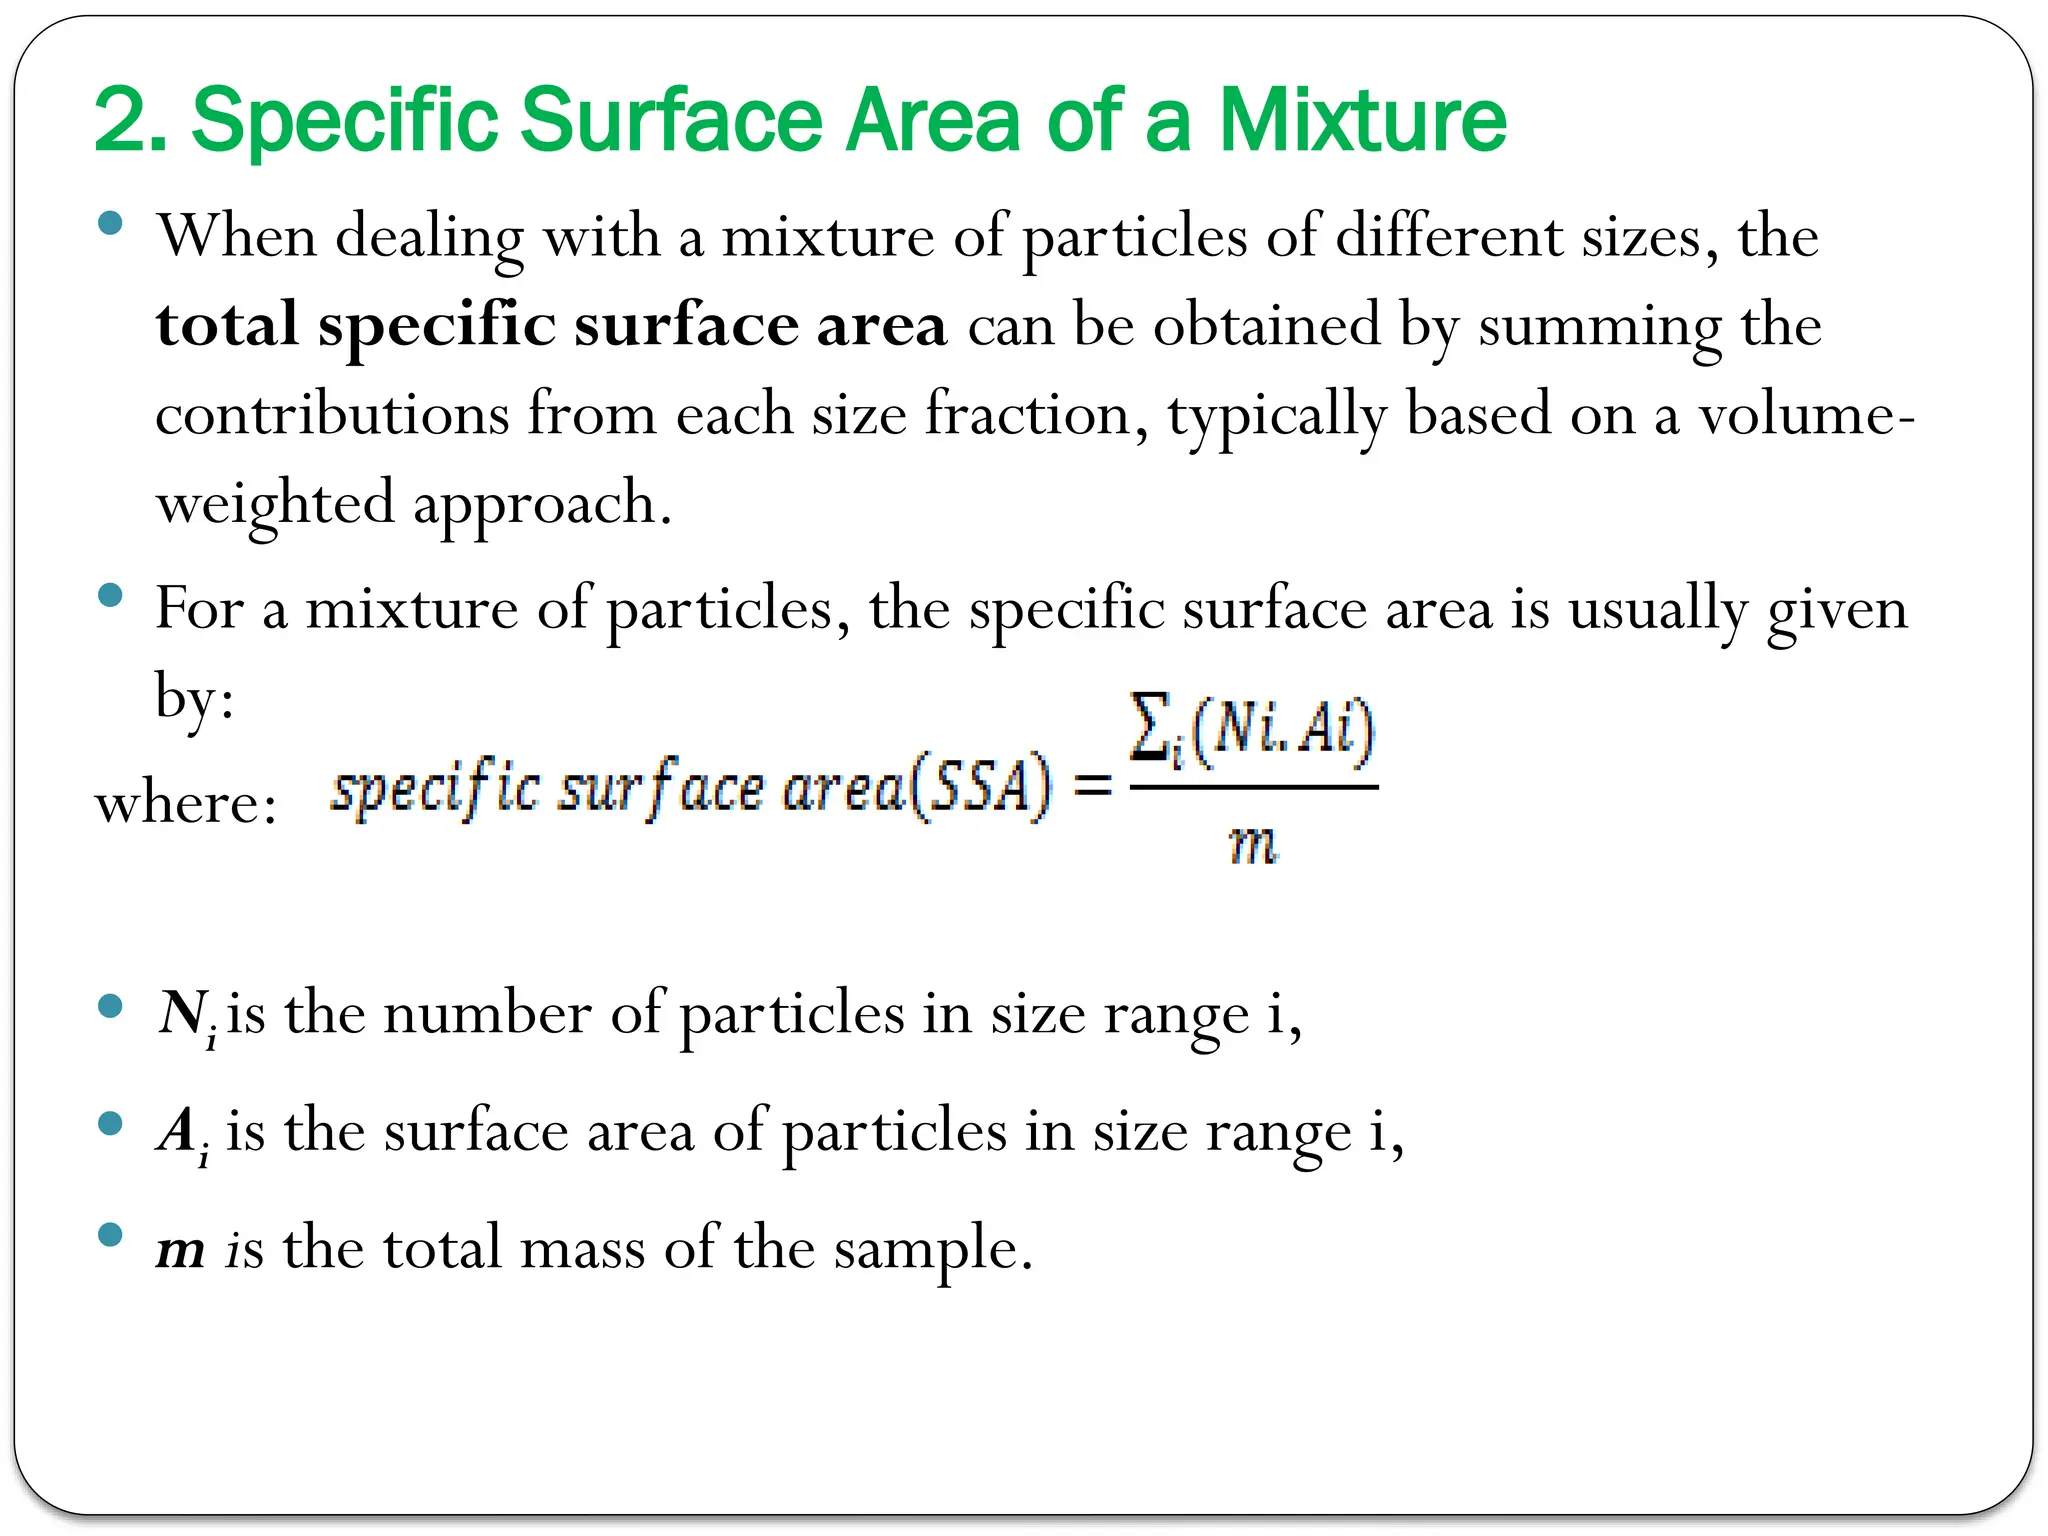
2. Specific SurfaceArea of a Mixture
When dealing with a mixture of particles of different sizes, the
total specific surface area can be obtained by summing the
contributions from each size fraction, typically based on a volume-
weighted approach.
For a mixture of particles, the specific surface area is usually given
by:
where:
Niis the number of particles in size range i,
Ai is the surface area of particles in size range i,
m is the total mass of the sample.
41.
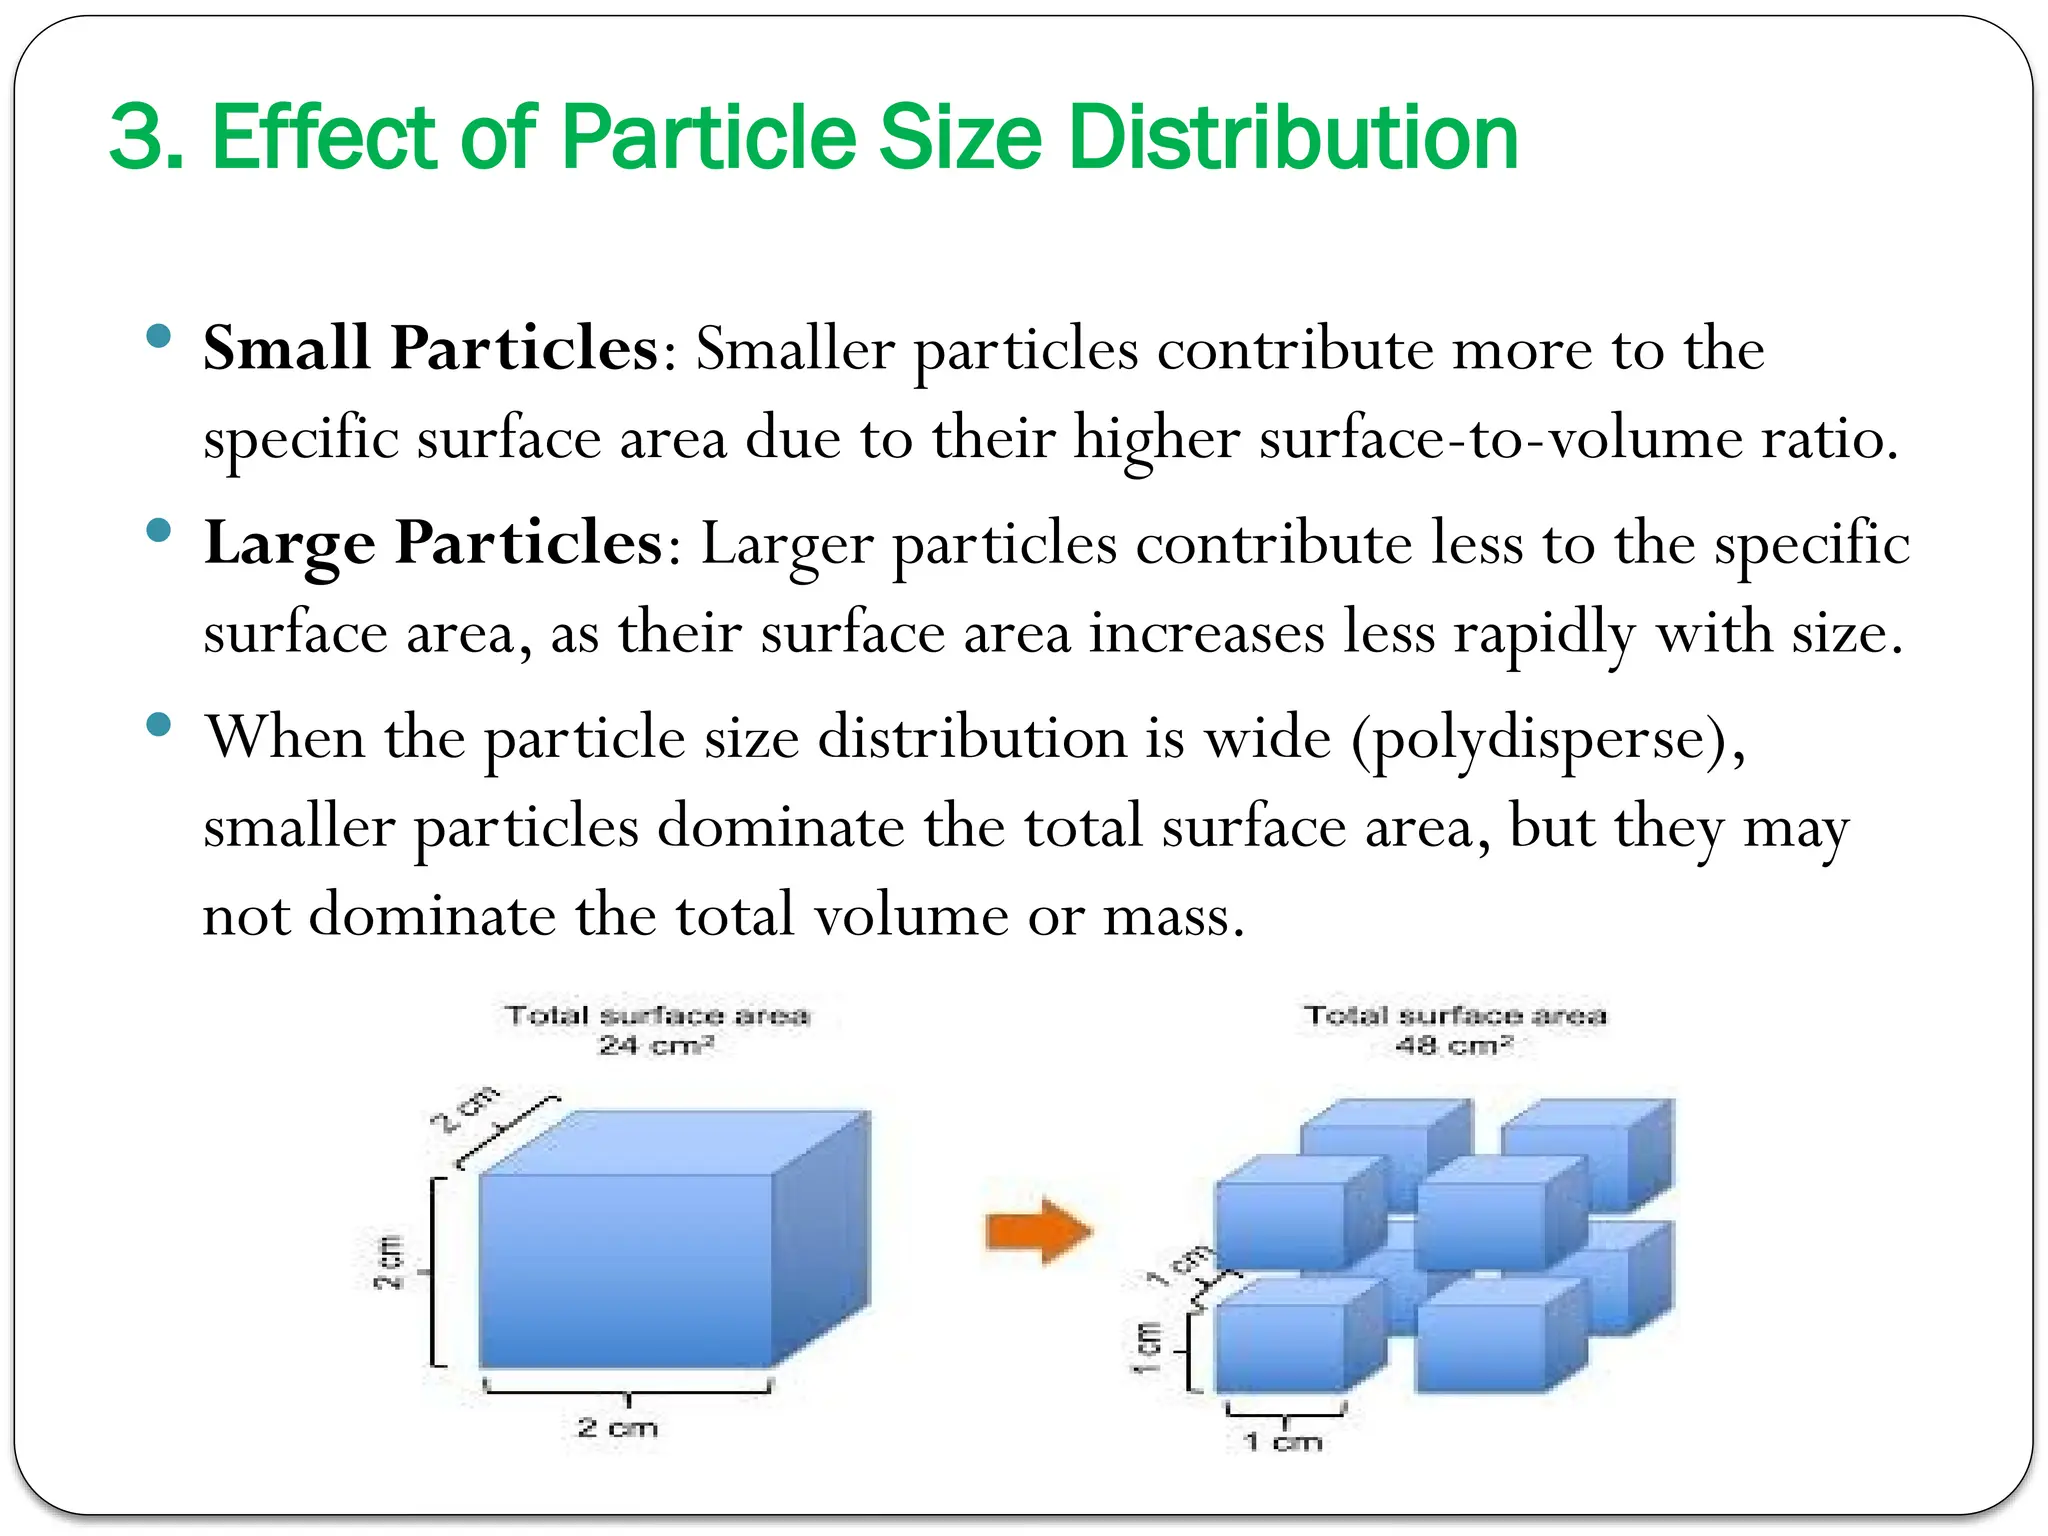
3. Effect ofParticle Size Distribution
Small Particles: Smaller particles contribute more to the
specific surface area due to their higher surface-to-volume ratio.
Large Particles: Larger particles contribute less to the specific
surface area, as their surface area increases less rapidly with size.
When the particle size distribution is wide (polydisperse),
smaller particles dominate the total surface area, but they may
not dominate the total volume or mass.
42.
Applications of SpecificSurface Area in Mixtures
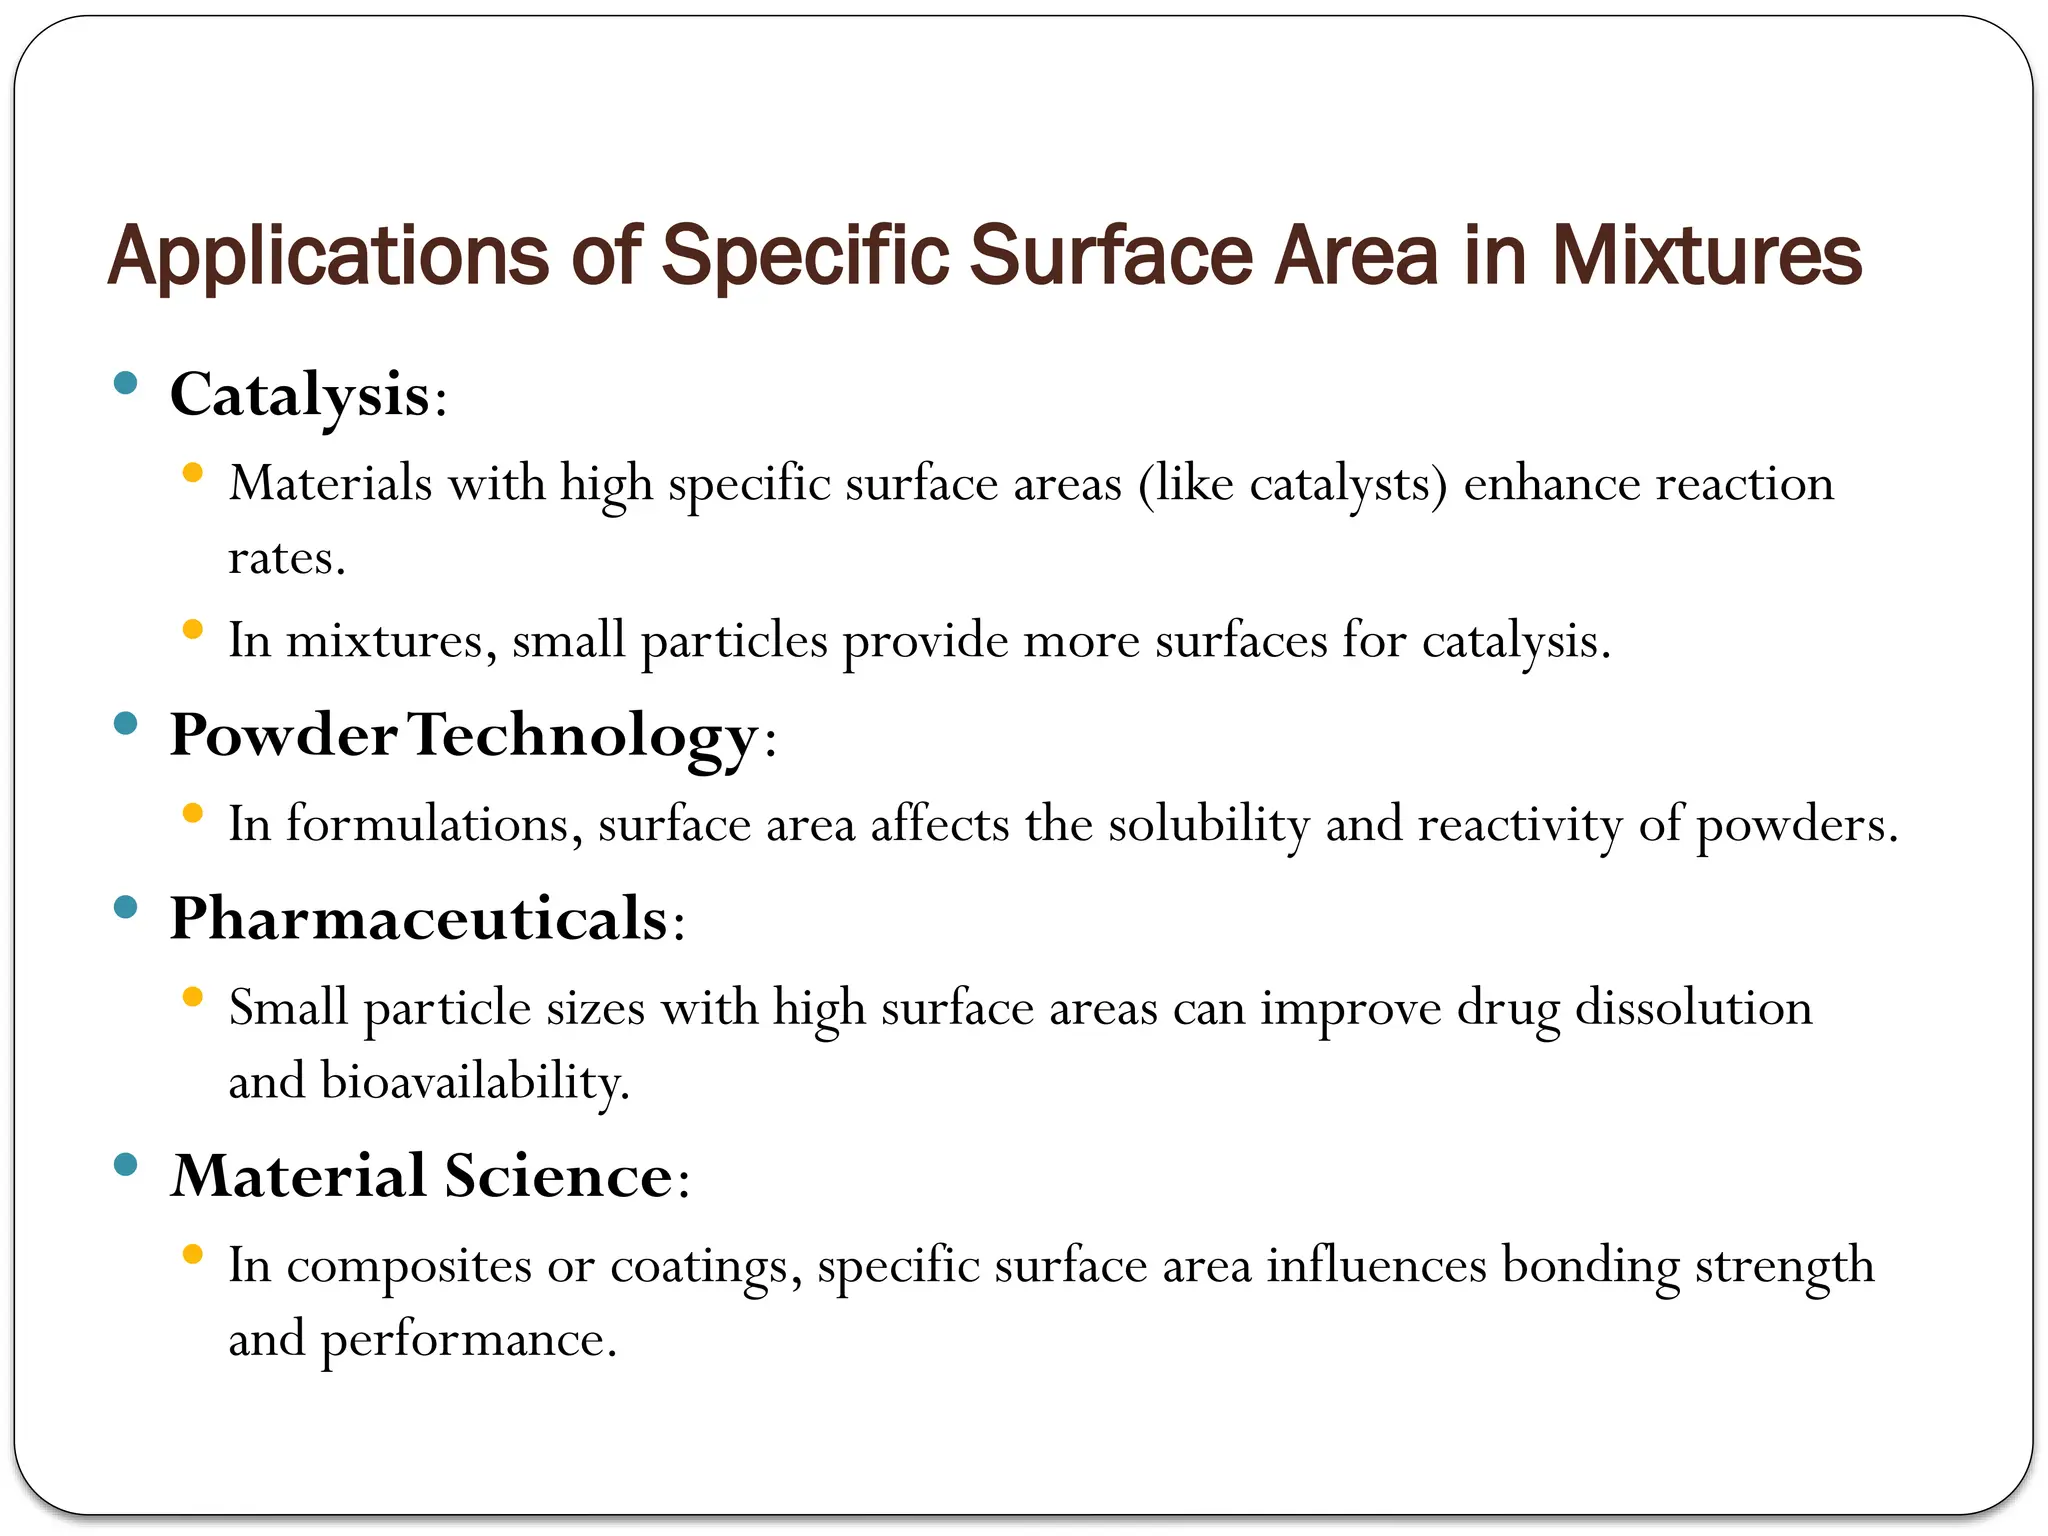
Catalysis:
Materials with high specific surface areas (like catalysts) enhance reaction
rates.
In mixtures, small particles provide more surfaces for catalysis.
PowderTechnology:
In formulations, surface area affects the solubility and reactivity of powders.
Pharmaceuticals:
Small particle sizes with high surface areas can improve drug dissolution
and bioavailability.
Material Science:
In composites or coatings, specific surface area influences bonding strength
and performance.
43.
1.8 Number OfParticle In Mixtures
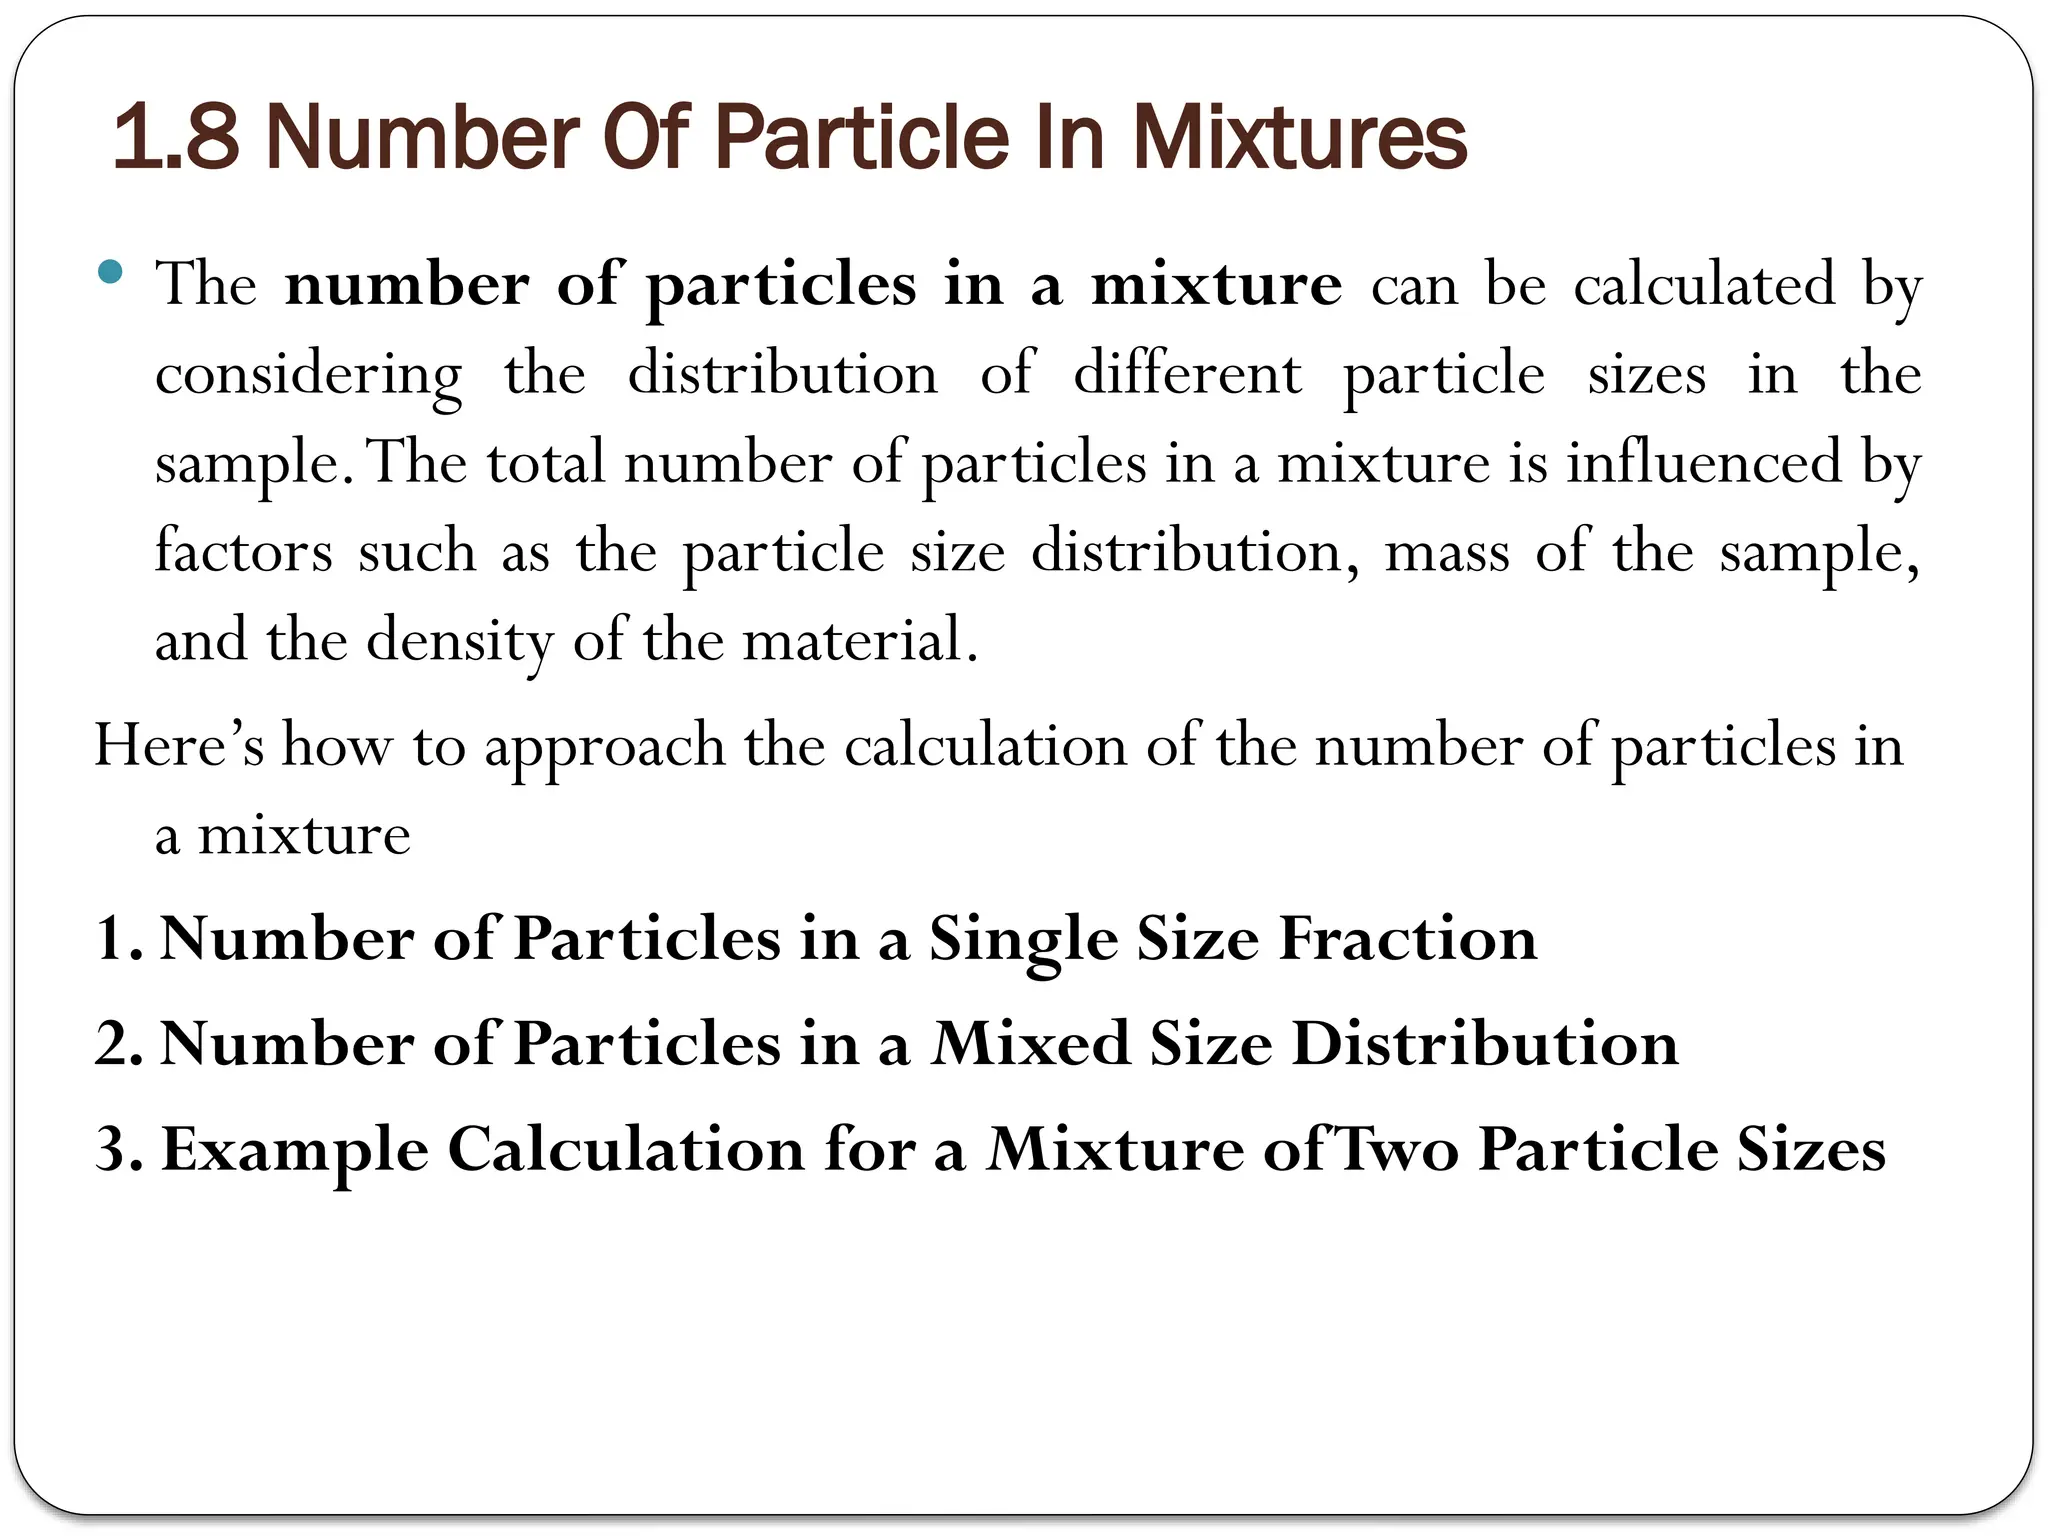
The number of particles in a mixture can be calculated by
considering the distribution of different particle sizes in the
sample.The total number of particles in a mixture is influenced by
factors such as the particle size distribution, mass of the sample,
and the density of the material.
Here’s how to approach the calculation of the number of particles in
a mixture
1. Number of Particles in a Single Size Fraction
2. Number of Particles in a Mixed Size Distribution
3. Example Calculation for a Mixture ofTwo Particle Sizes
44.
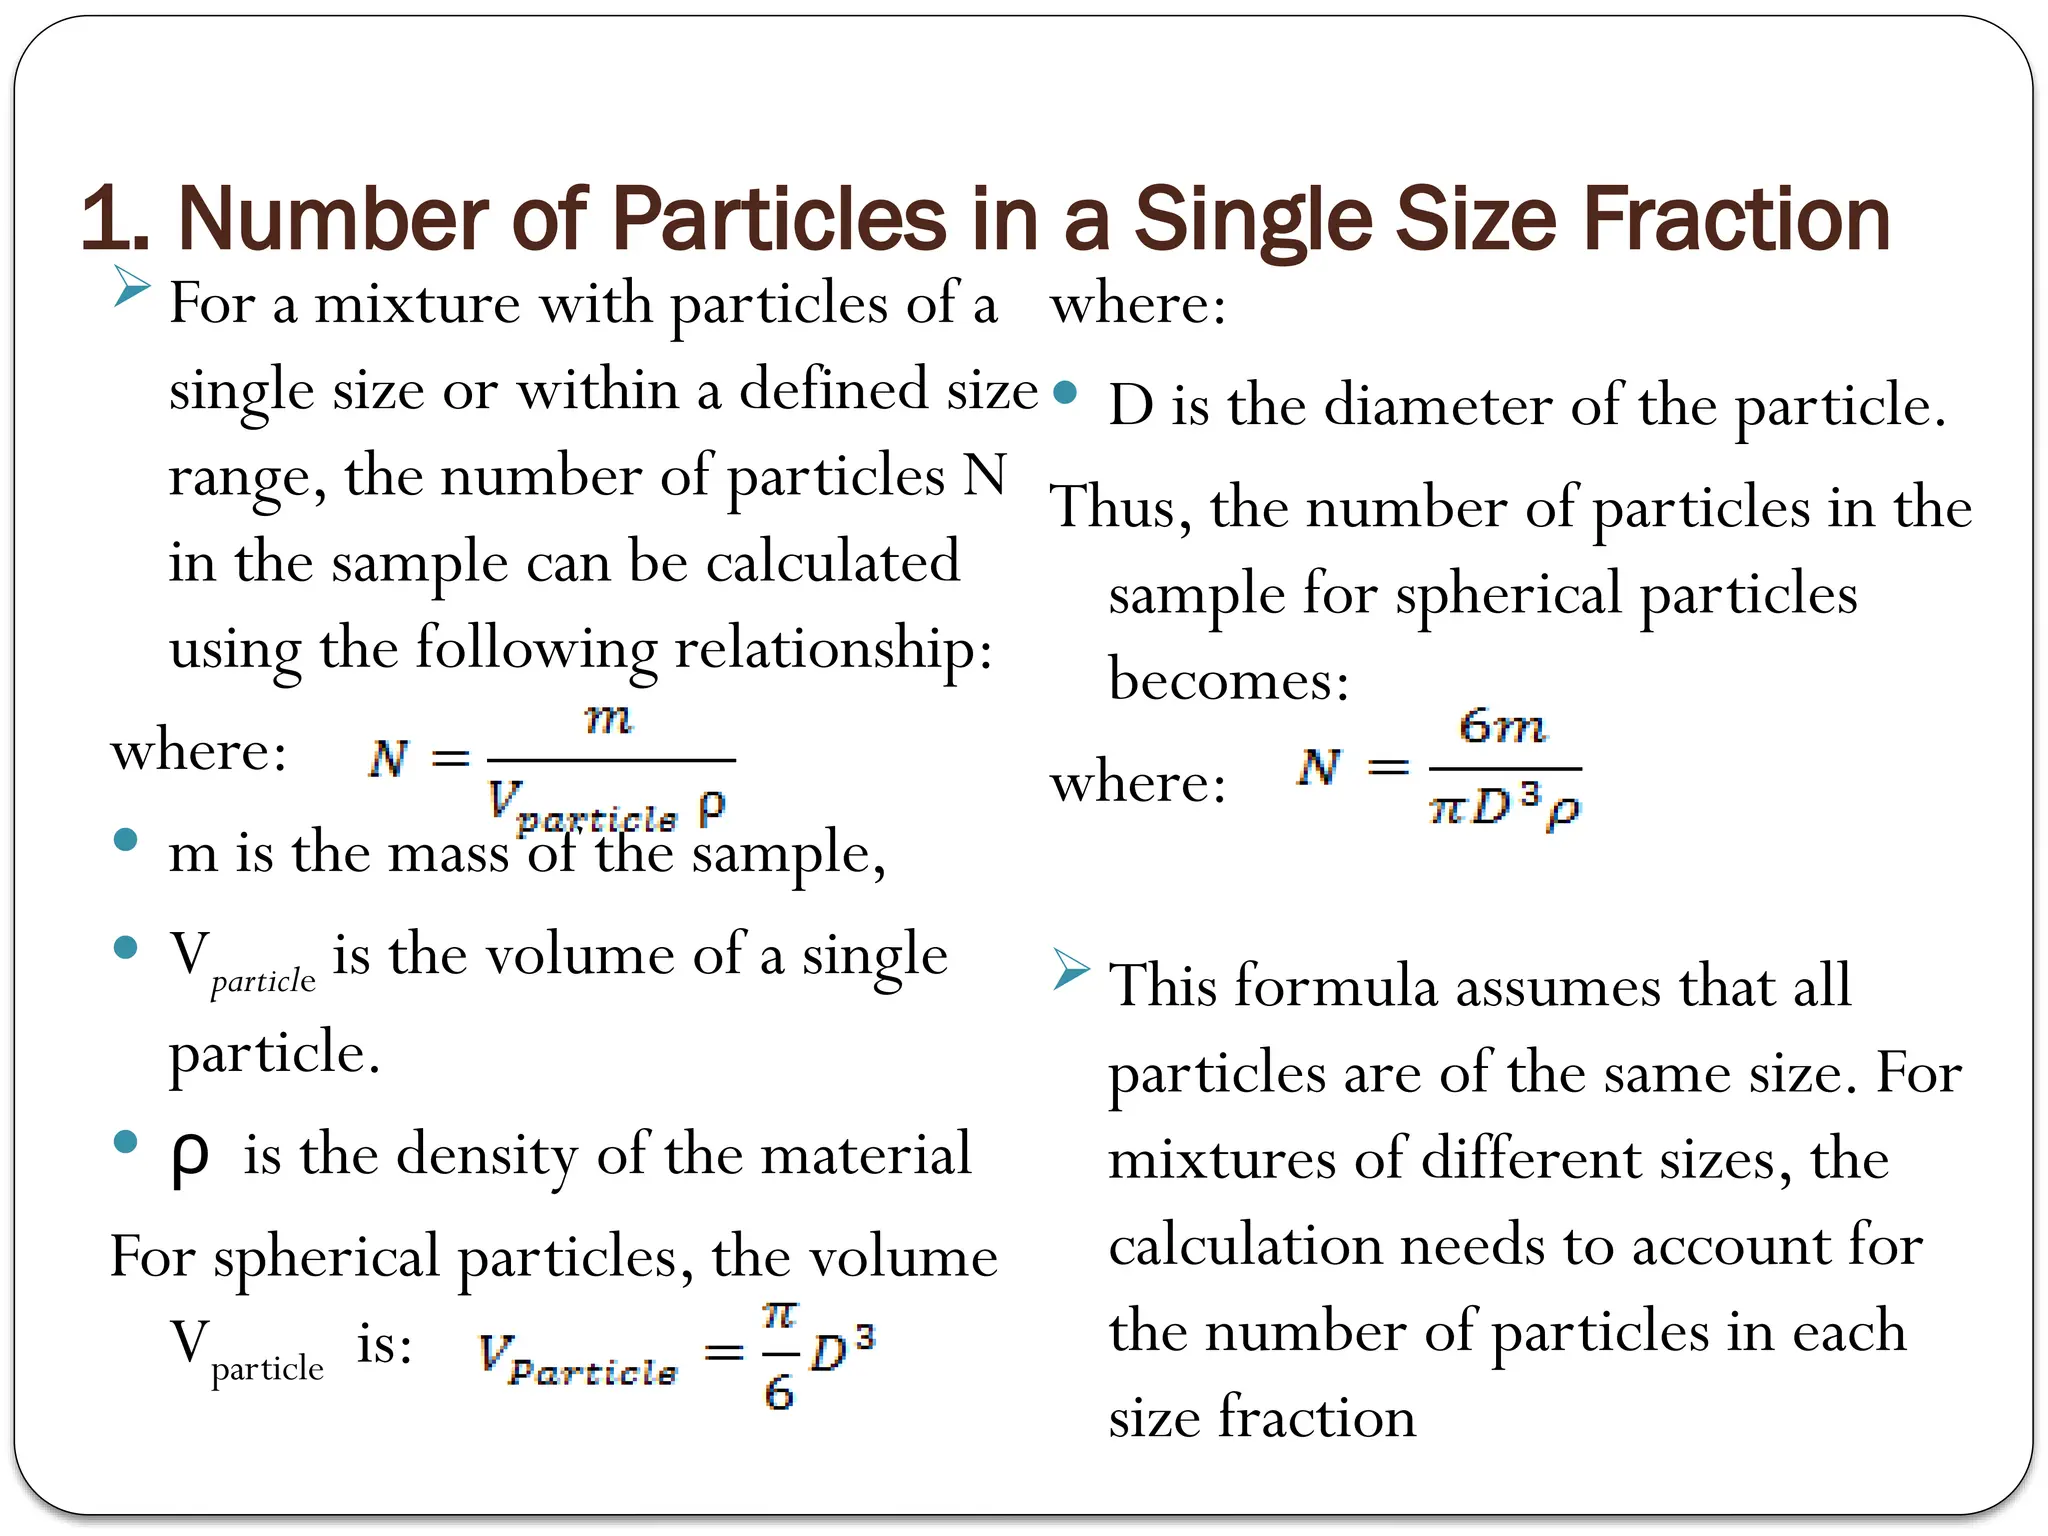
1. Number ofParticles in a Single Size Fraction
For a mixture with particles of a
single size or within a defined size
range, the number of particles N
in the sample can be calculated
using the following relationship:
where:
m is the mass of the sample,
Vparticleis the volume of a single
particle.
is the density of the material
ρ
For spherical particles, the volume
Vparticle is:
where:
D is the diameter of the particle.
Thus, the number of particles in the
sample for spherical particles
becomes:
where:
This formula assumes that all
particles are of the same size. For
mixtures of different sizes, the
calculation needs to account for
the number of particles in each
size fraction
45.
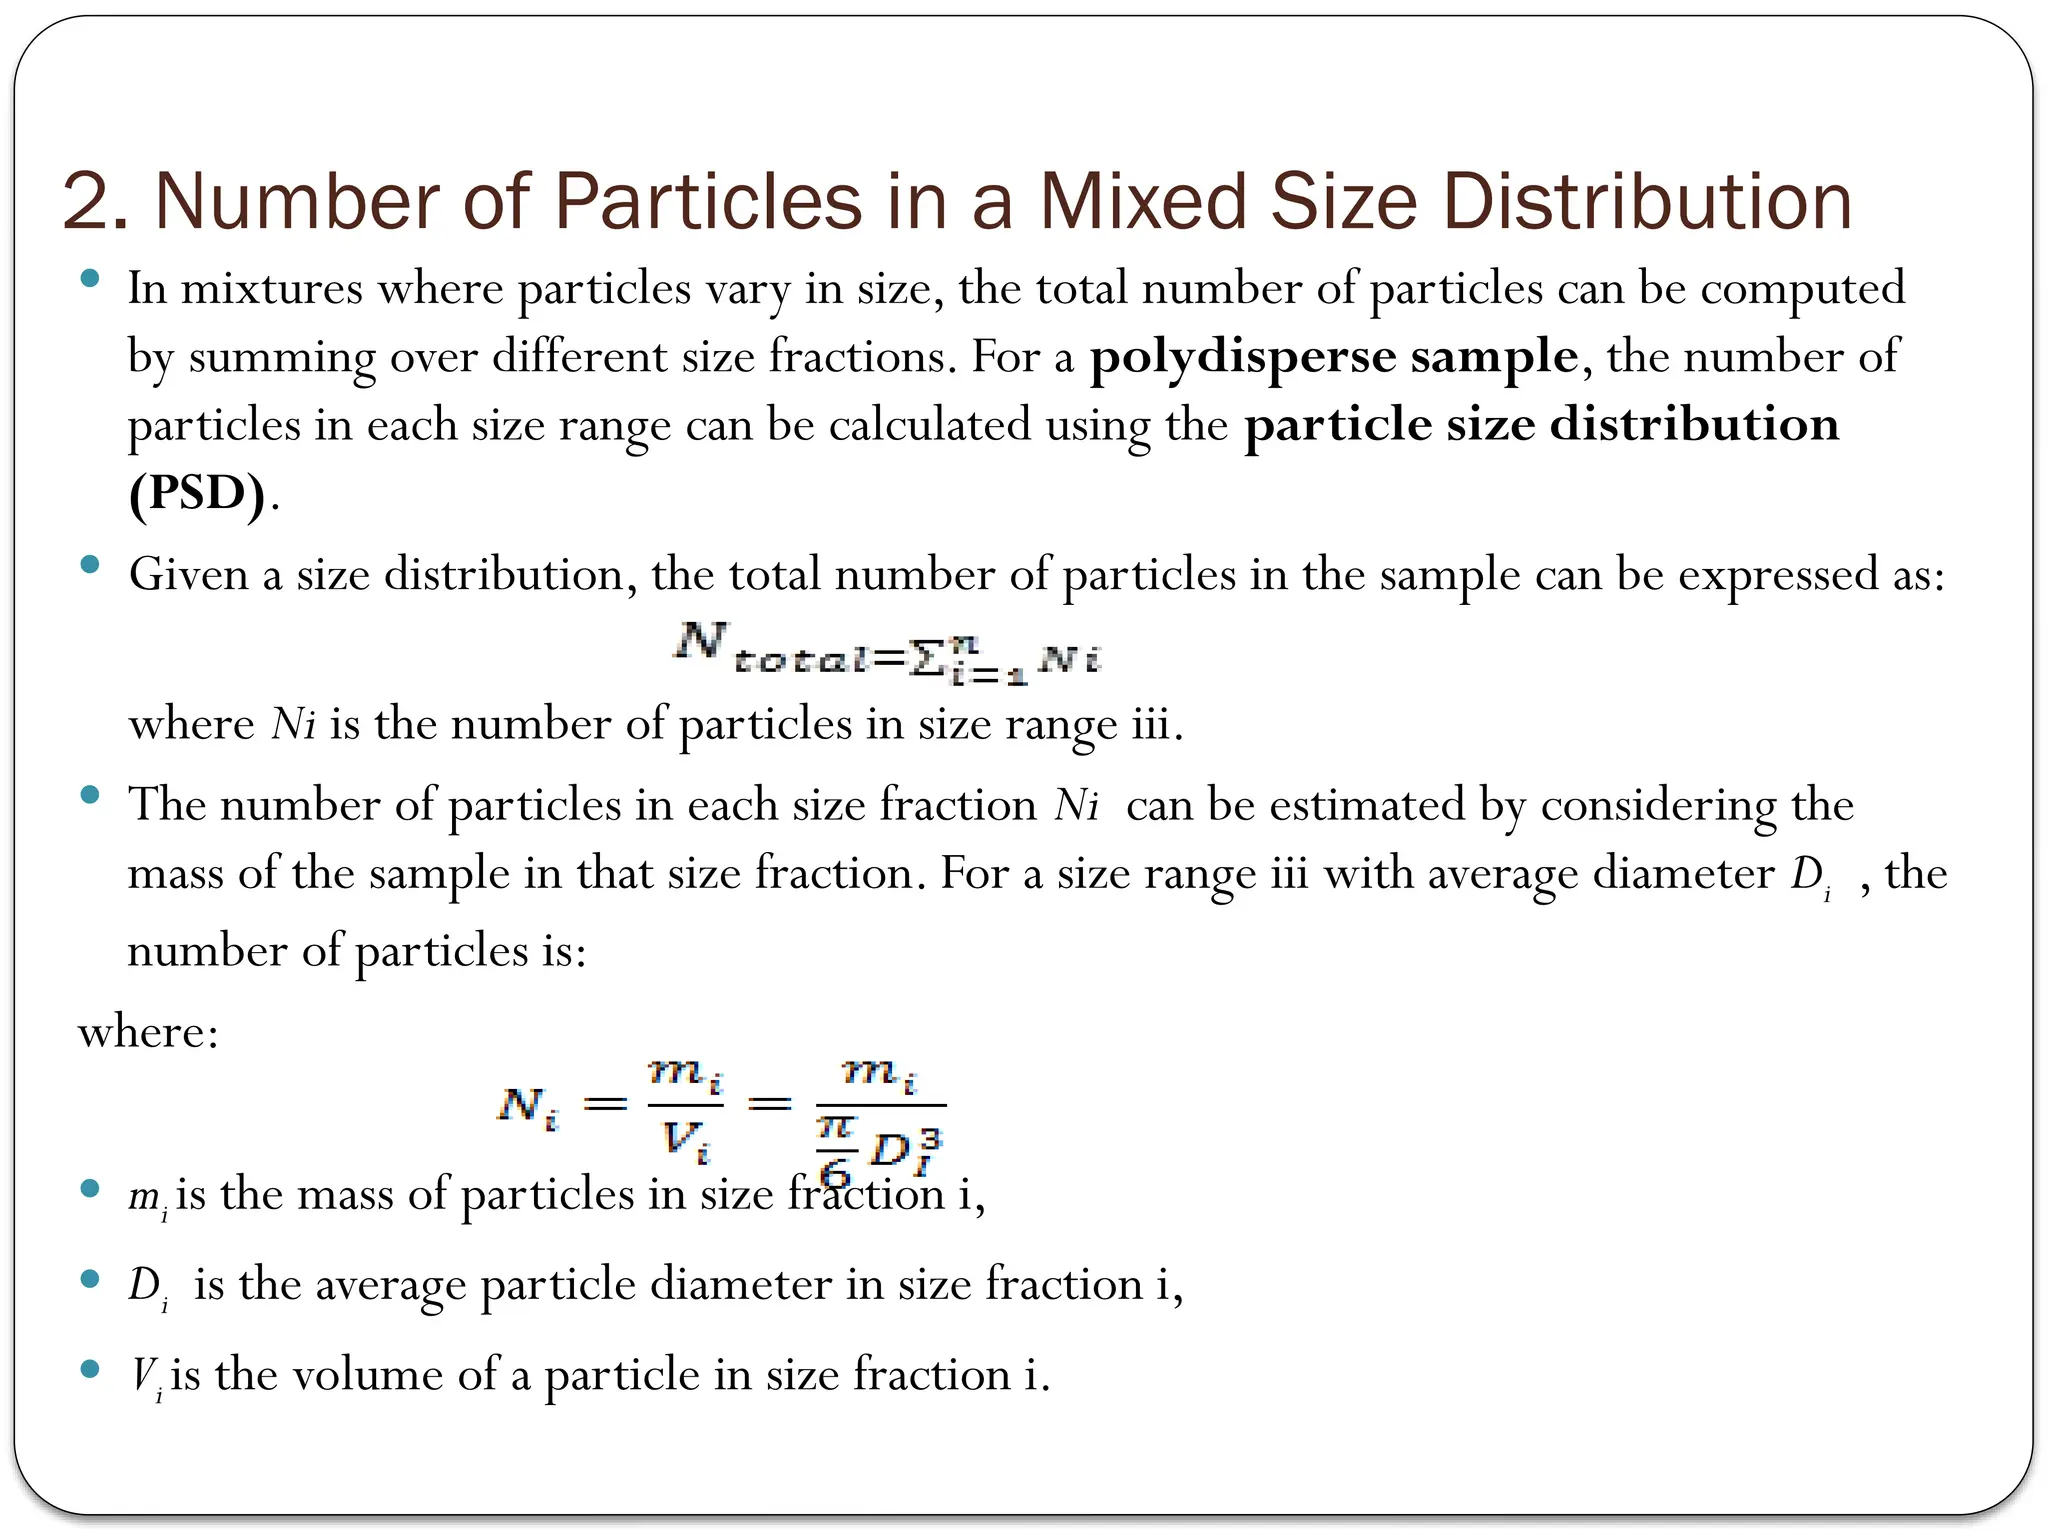
2. Number ofParticles in a Mixed Size Distribution
In mixtures where particles vary in size, the total number of particles can be computed
by summing over different size fractions. For a polydisperse sample, the number of
particles in each size range can be calculated using the particle size distribution
(PSD).
Given a size distribution, the total number of particles in the sample can be expressed as:
where Niis the number of particles in size range iii.
The number of particles in each size fraction Ni can be estimated by considering the
mass of the sample in that size fraction. For a size range iii with average diameter Di
, the
number of particles is:
where:
mi is the mass of particles in size fraction i,
Di is the average particle diameter in size fraction i,
Vi is the volume of a particle in size fraction i.
46.
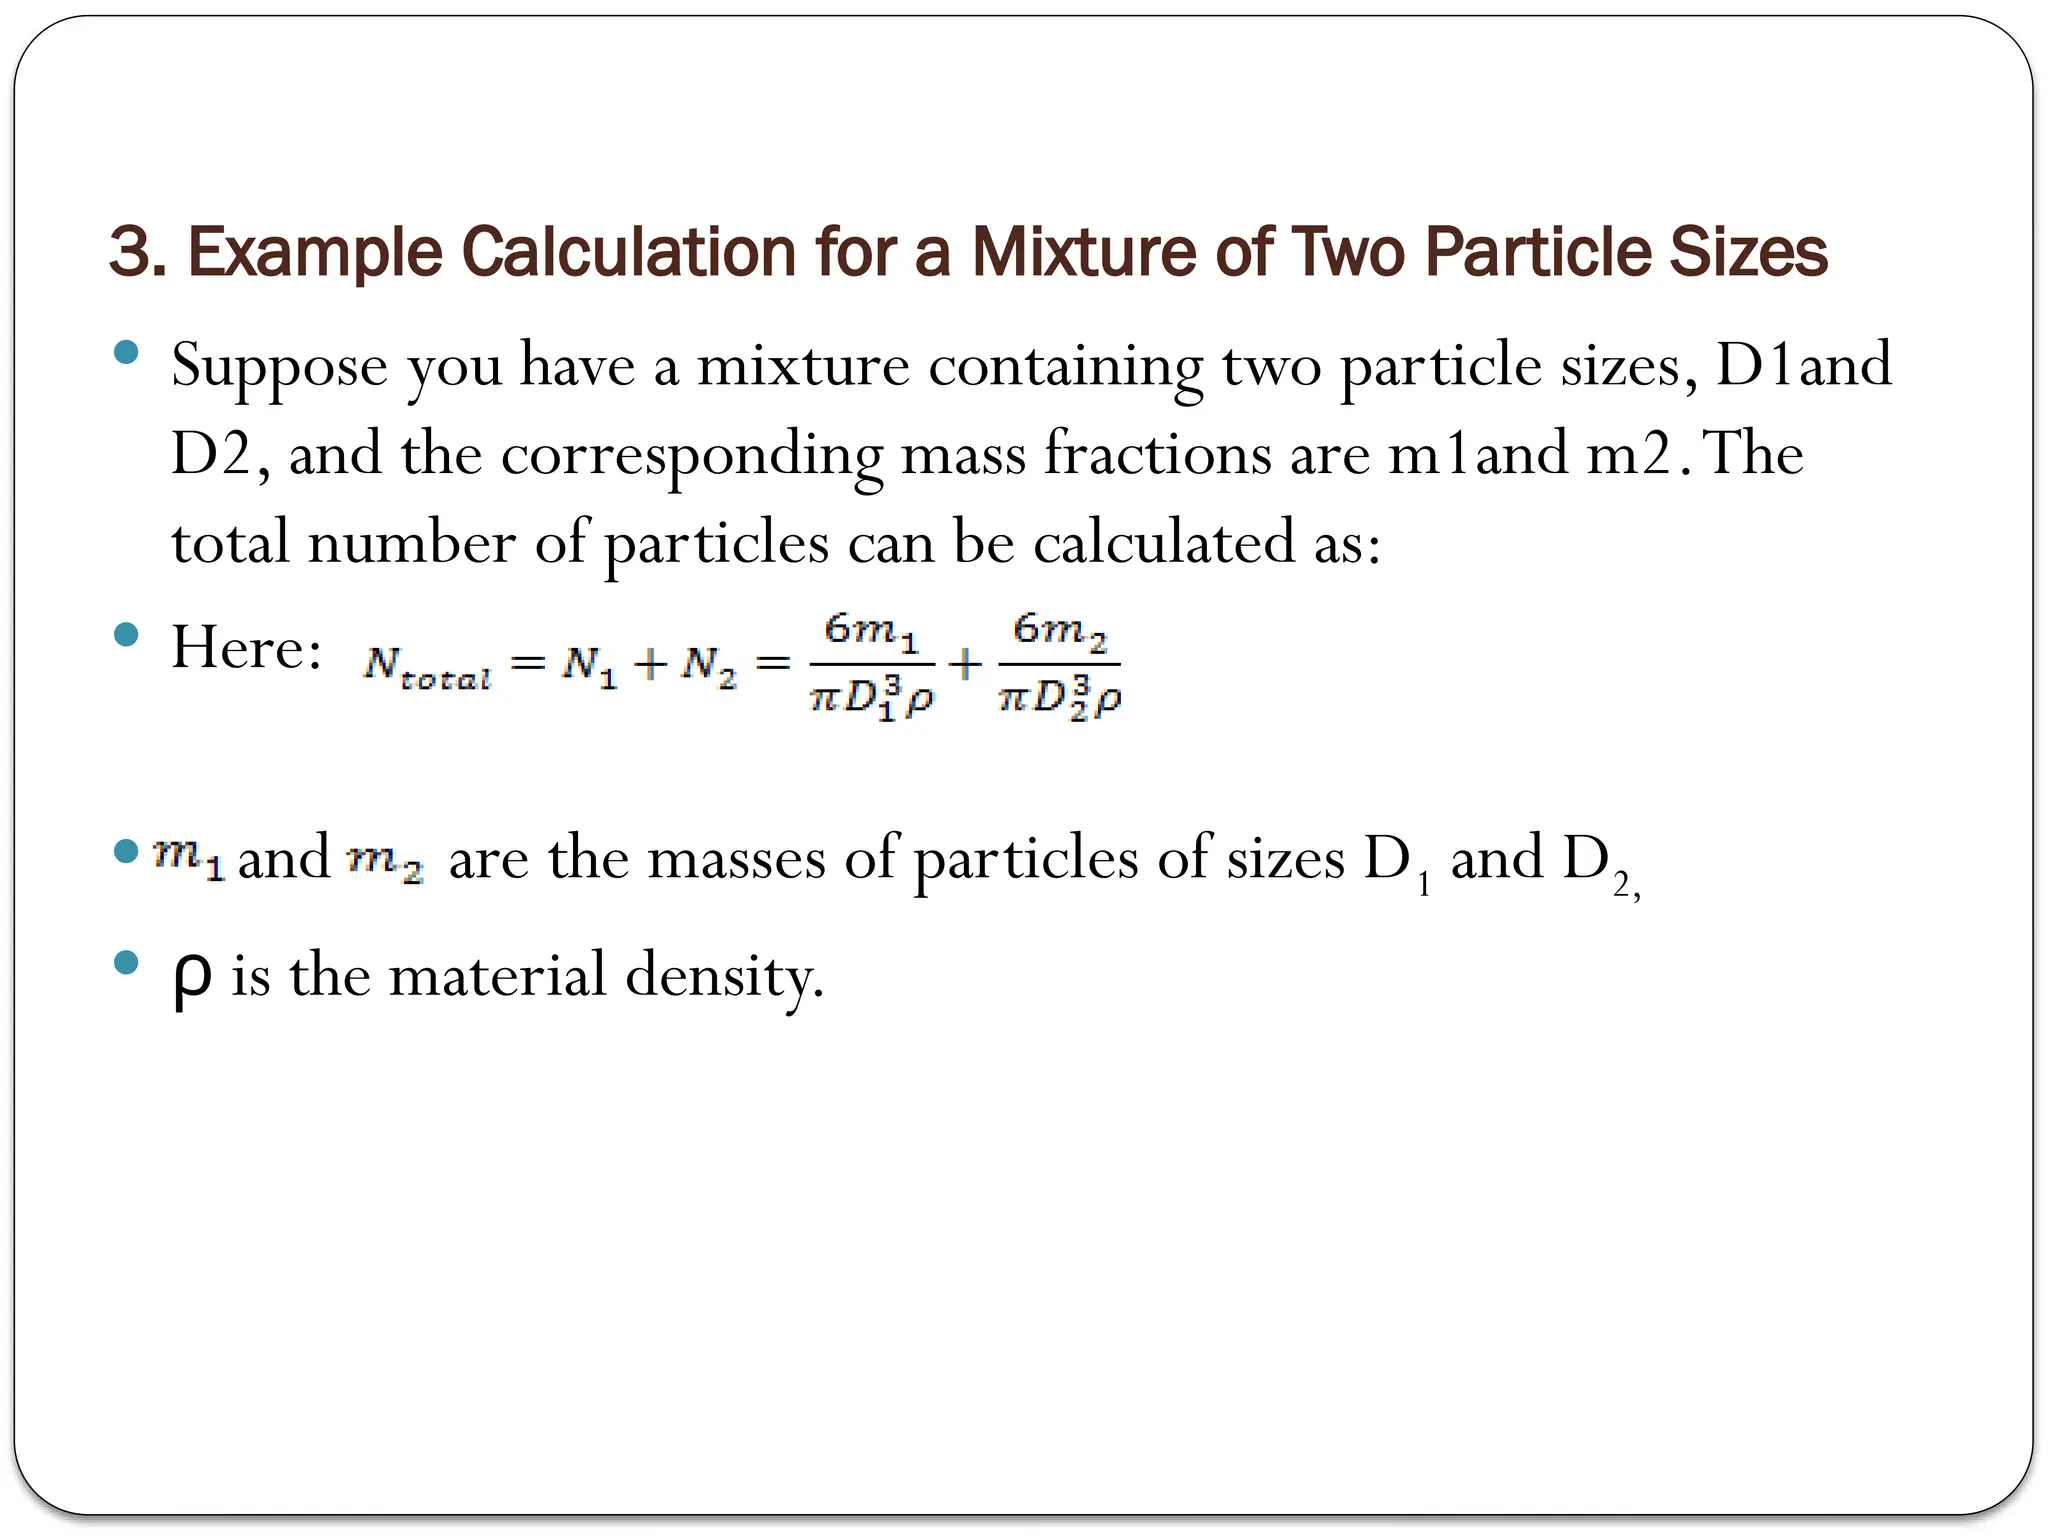
3. Example Calculationfor a Mixture of Two Particle Sizes
Suppose you have a mixture containing two particle sizes, D1and
D2, and the corresponding mass fractions are m1and m2
.The
total number of particles can be calculated as:
Here:
and are the masses of particles of sizes D1and D2
,
is the material density.
ρ
47.
Applications of ParticleCount in Mixtures
Pharmaceuticals: Estimating the number of drug particles helps
determine dissolution rates and bioavailability.
PowderTechnology: Understanding the number of particles
influences flow ability, packing density, and compaction behaviour.
Catalysis: Catalytic reactions depend on the number of active
sites, which is related to the number of particles.
Environmental Studies: Particle count is important for
assessing pollutant dispersion in air or water.
48.
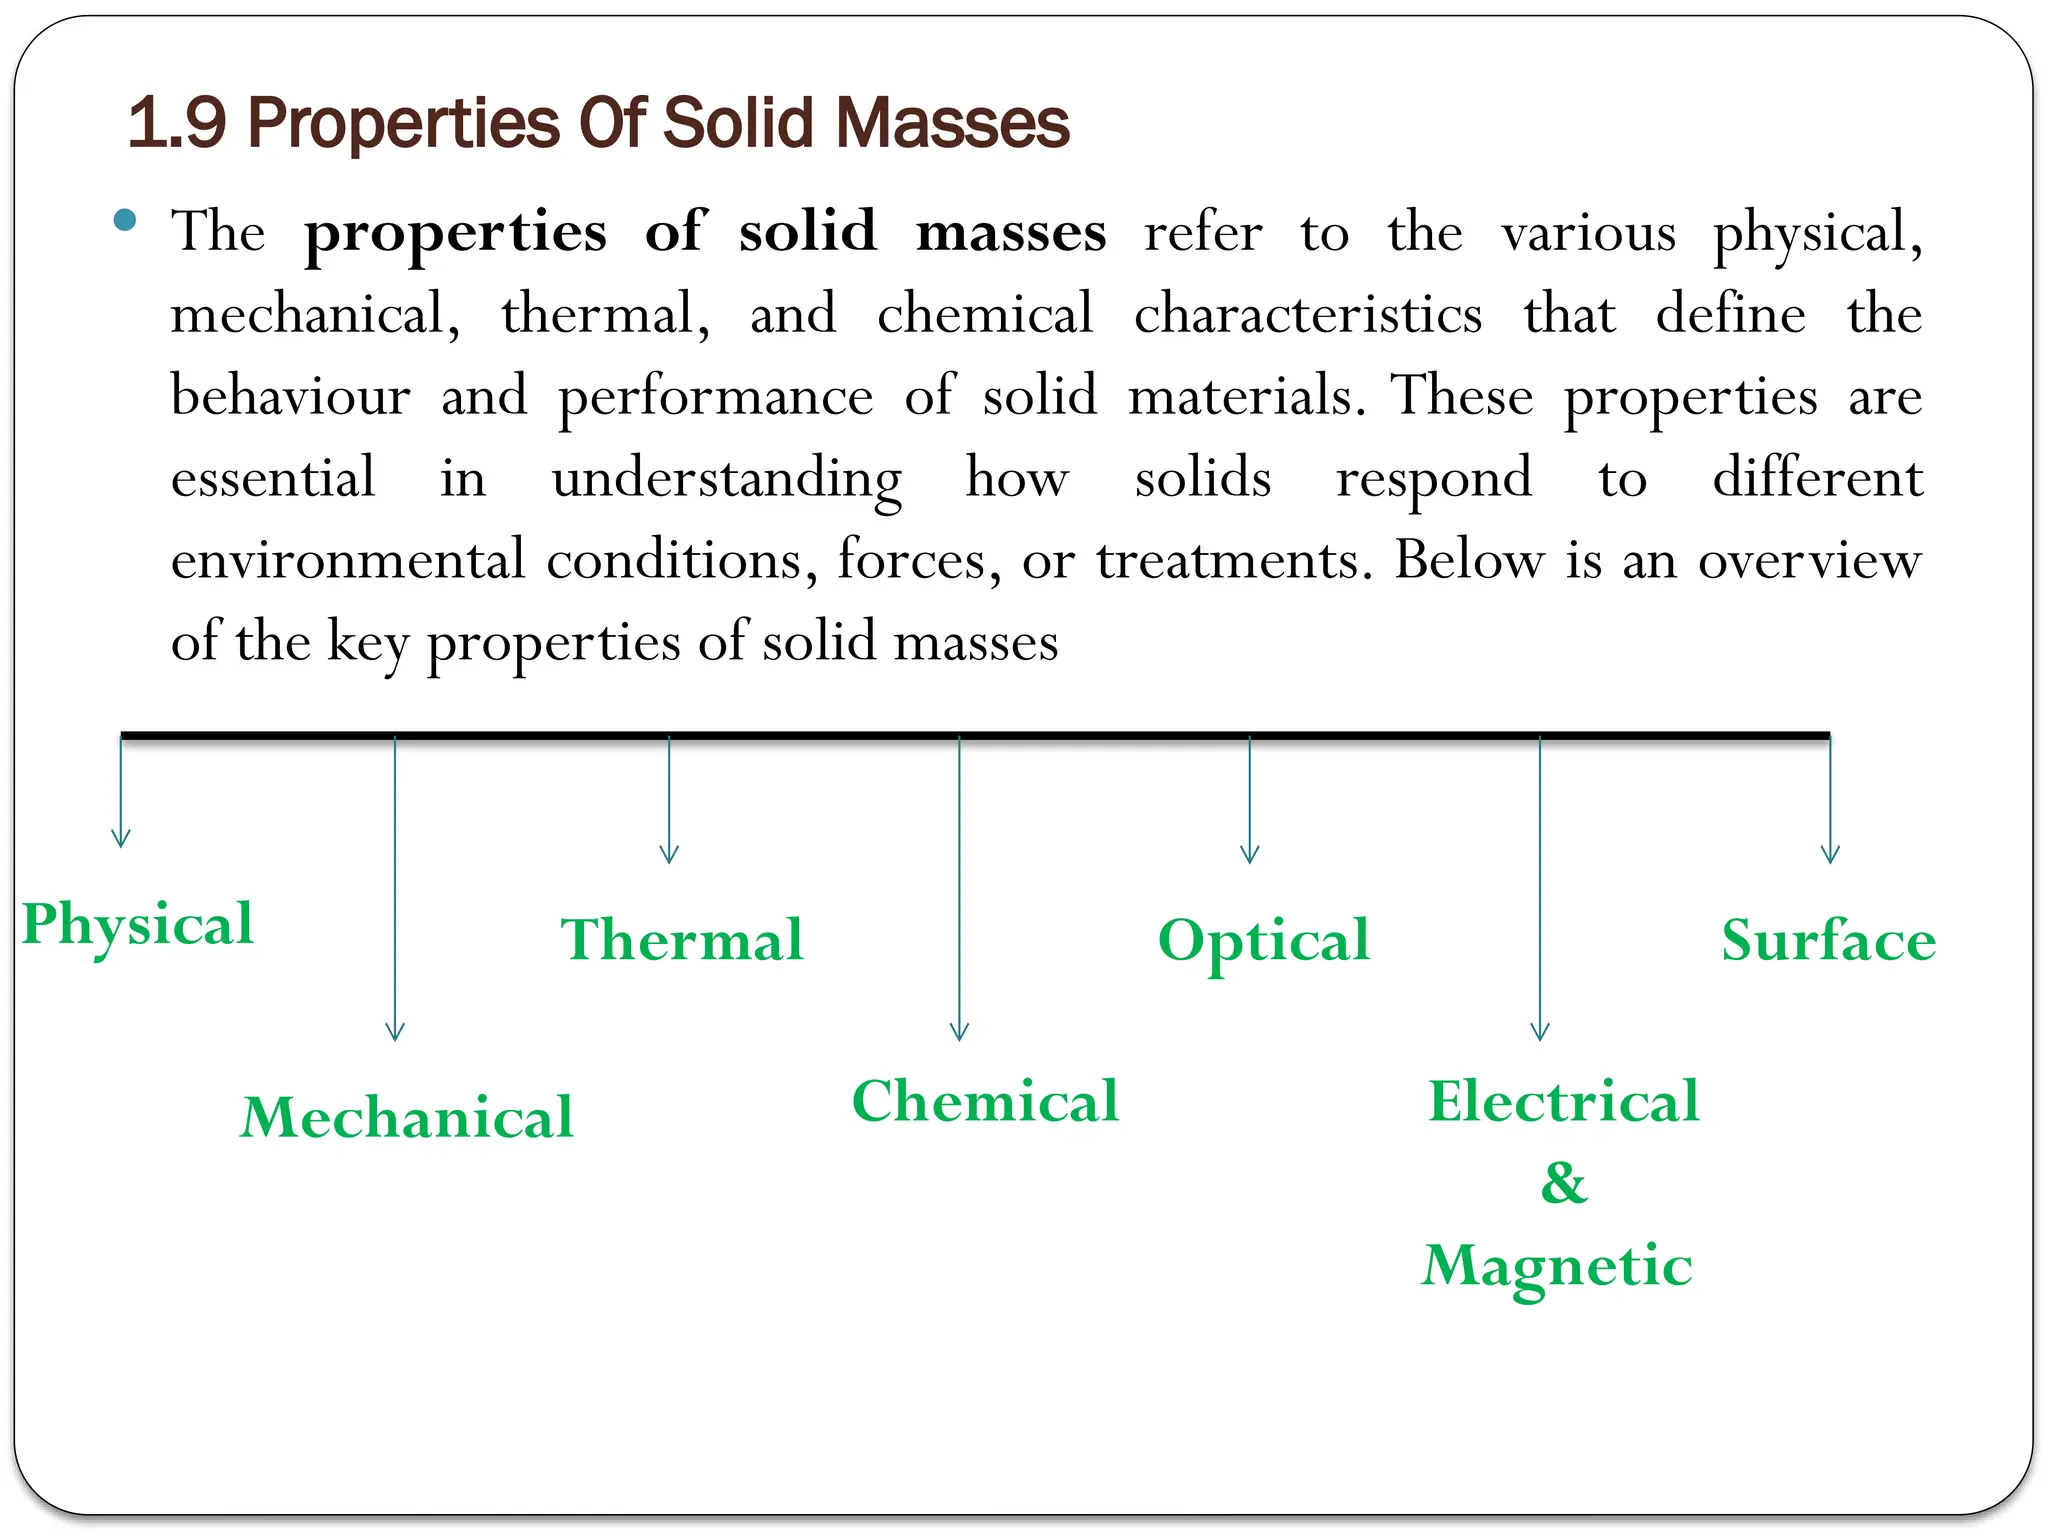
1.9 Properties OfSolid Masses
The properties of solid masses refer to the various physical,
mechanical, thermal, and chemical characteristics that define the
behaviour and performance of solid materials. These properties are
essential in understanding how solids respond to different
environmental conditions, forces, or treatments. Below is an overview
of the key properties of solid masses
Physical
Mechanical
Thermal Surface
Chemical Electrical
&
Magnetic
Optical
49.
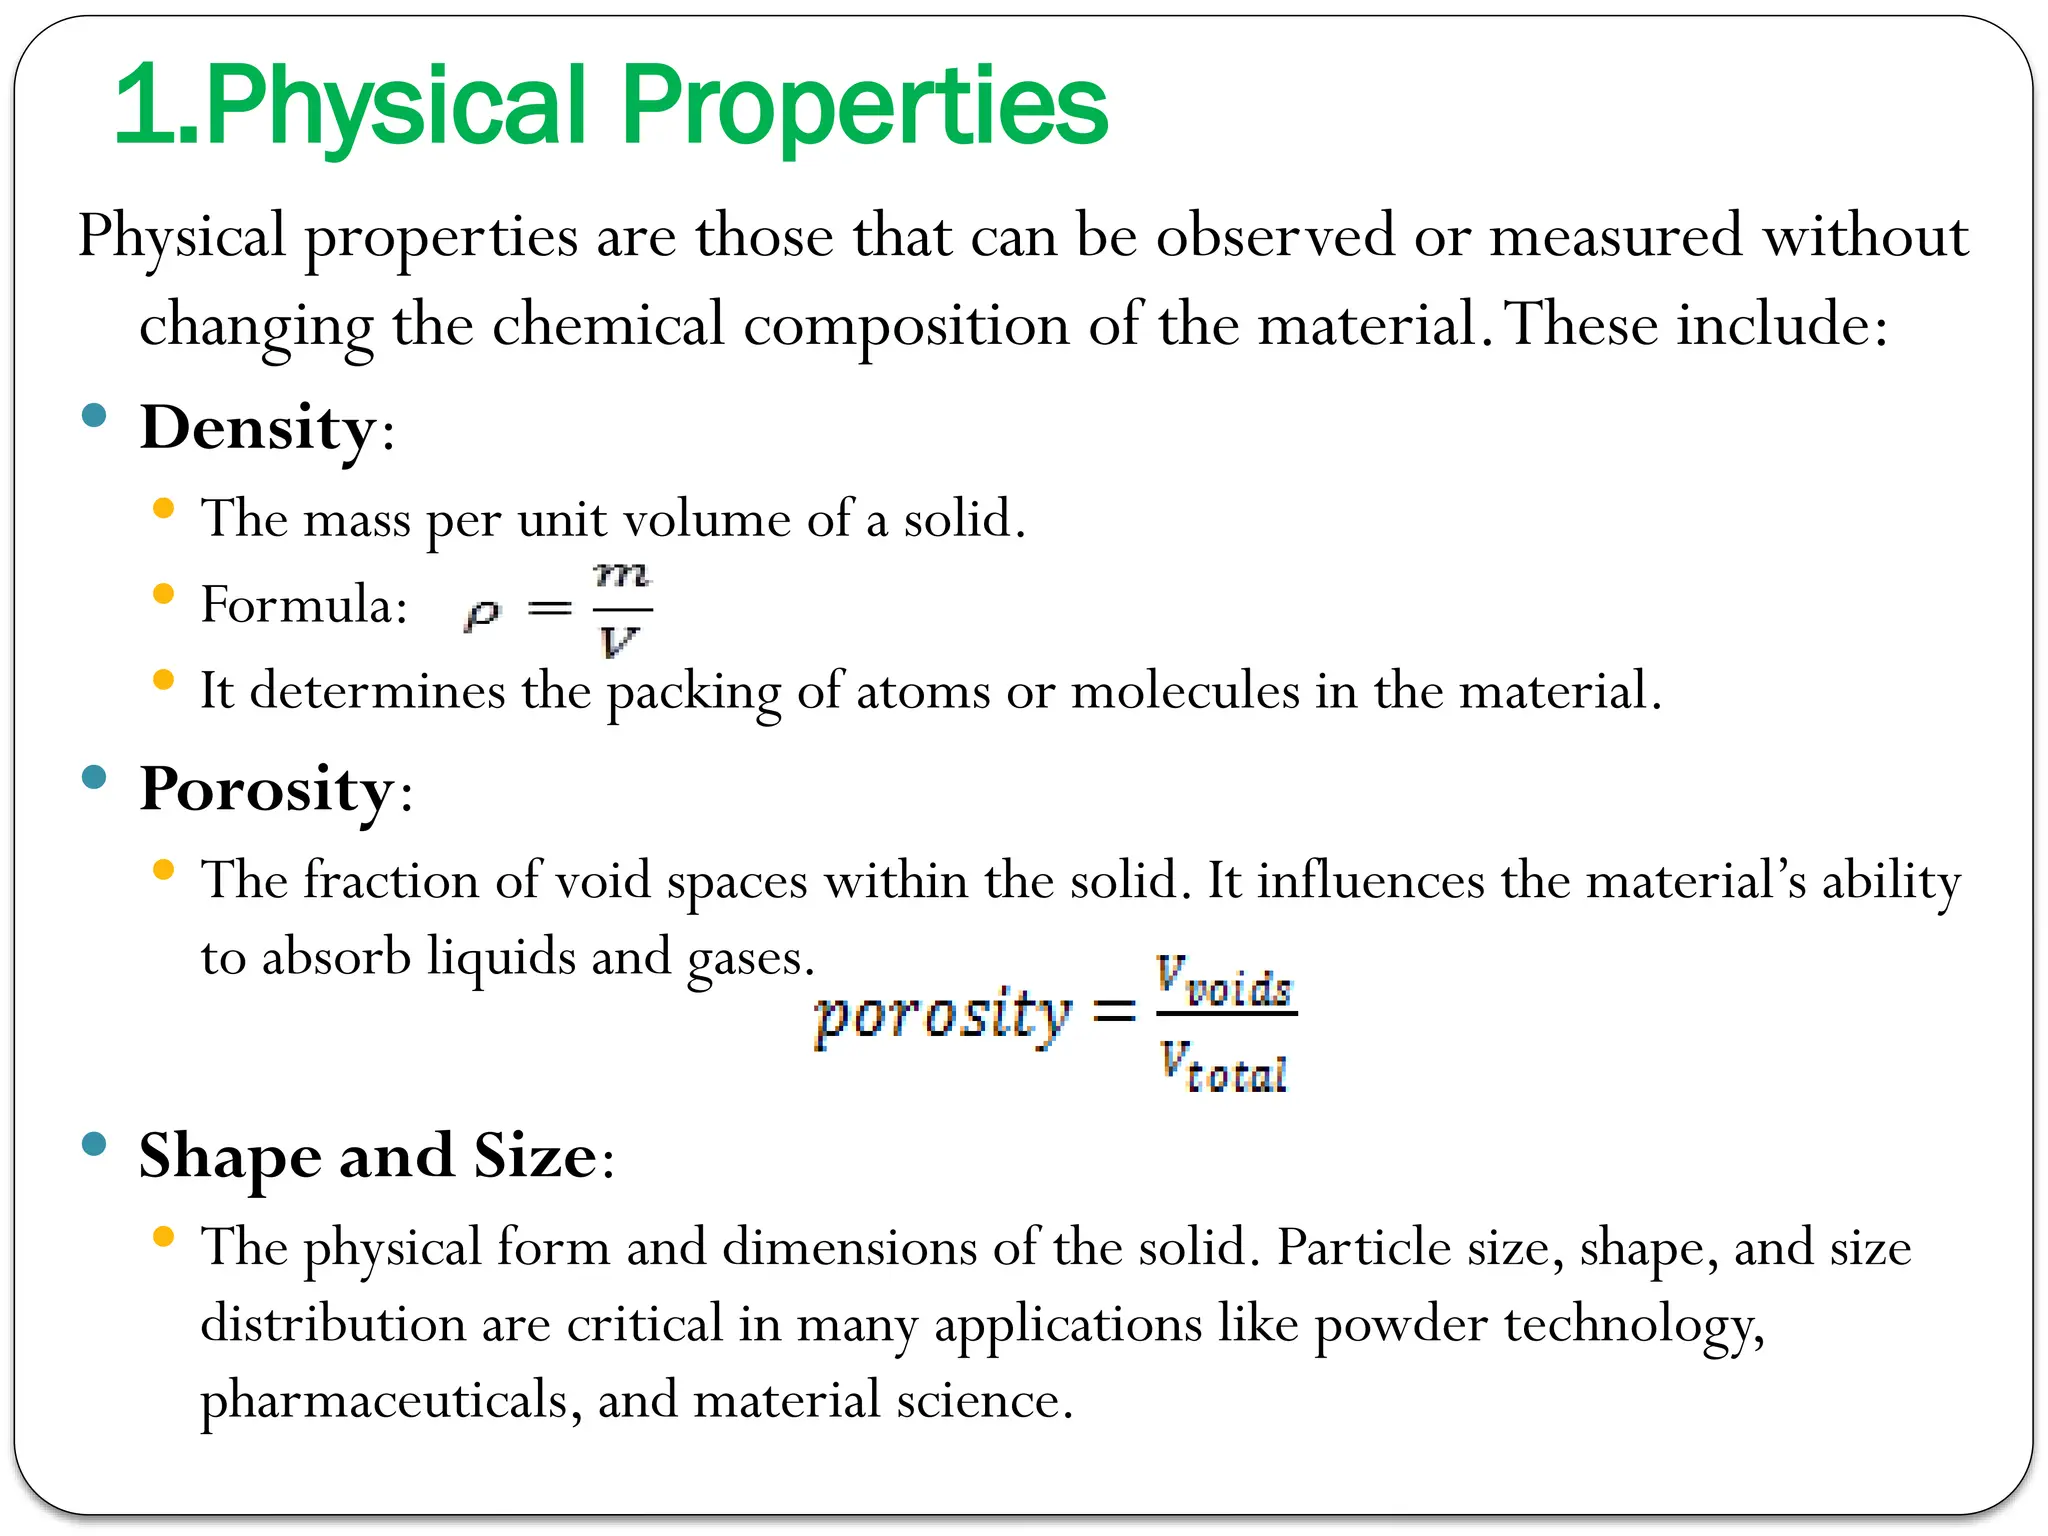
1.Physical Properties
Physical propertiesare those that can be observed or measured without
changing the chemical composition of the material.These include:
Density:
The mass per unit volume of a solid.
Formula:
It determines the packing of atoms or molecules in the material.
Porosity:
The fraction of void spaces within the solid. It influences the material’s ability
to absorb liquids and gases.
Shape and Size:
The physical form and dimensions of the solid. Particle size, shape, and size
distribution are critical in many applications like powder technology,
pharmaceuticals, and material science.
50.
Colour:
Colourcan provide insights into the material's composition and
surface characteristics. In solids, colour is often related to surface
properties or impurities.
Refractive Index:
The measure of how light is bent (refracted) when passing through
the solid. It depends on the material’s optical properties.
Melting Point:
The temperature at which the solid changes from solid to liquid.
It’s a critical property for materials used in high-temperature
applications (e.g., metals, ceramics).
51.
2. Mechanical Properties
Mechanical properties describe the solid's response to external
forces, such as stress, strain, and deformation.
Hardness:
The resistance of a solid to deformation, typically by indentation or scratching.
Measured by different scales (e.g., Mohs, Rockwell,Vickers).
A key property in materials used for tools, coatings, and wear-resistant
applications.
Tensile Strength:
The maximum stress a solid can withstand while being stretched or pulled
before breaking.
It is a measure of the material's ability to resist breaking under tension.
Compressive Strength:
The maximum stress a material can withstand while being compressed or
squeezed.
Important for structural materials like concrete and steel.
52.
Elasticity:
Theability of a material to return
to its original shape after the
removal of stress or force.
Elastic modulus (Young’s modulus)
quantifies elasticity.
Ductility:
The ability of a material to undergo
significant plastic deformation
before rupture, often observed
through stretching (e.g., metals like
copper and gold).
Brittleness:
The tendency of a material to
fracture or fail without significant
deformation when subjected to
stress.
Toughness:
The ability of a material to absorb
energy and plastically deform
without fracturing, combining
strength and ductility.
Fatigue Strength:
The material’s ability to withstand
repeated loading and unloading
cycles without failing.
Shear Strength:
The resistance of a material to
forces that cause sliding or shearing
between its layers.
53.
3. Thermal Properties
Thermalproperties relate to how a solid
material responds to changes in
temperature.
Thermal Conductivity:
The ability of a material to conduct heat.
Materials with high conductivity, like
metals, transfer heat efficiently, while
insulators like rubber and wood have low
thermal conductivity.
Thermal Expansion:
The change in a solid’s dimensions when
its temperature changes.
Given by:
is the coefficient of thermal expansion.
α
Heat Capacity:
The amount of heat energy required to
raise the temperature of a unit mass of
the solid by one degree Celsius (or
Kelvin).
Specific Heat:
The amount of heat required to raise the
temperature of a given mass of material
by 1°C.
Thermal Insulation:
The ability of a material to reduce heat
flow through it. Materials with low
thermal conductivity are good insulators.
Melting Point:
The temperature at which a solid changes
to a liquid phase (also discussed under
physical properties).
54.
4. Chemical Properties
Chemicalproperties describe how a
solid reacts with other substances
or under different conditions.
Reactivity:
The ability of a material to undergo
chemical reactions, including
corrosion, oxidation, or degradation
in the presence of other chemicals.
Corrosion Resistance:
The ability of a material, such as
metals, to resist the process of
deterioration due to environmental
conditions like moisture, acids, and
gases.
Solubility:
The ability of a solid to dissolve in a
solvent. For example, salts and
sugars dissolve in water, but metals
typically do not.
Chemical Composition:
The proportions of different
elements or compounds that make
up the solid. It defines a material's
properties and behaviour.
Stability:
The ability of a material to remain
unchanged over time, without
undergoing chemical changes due to
environmental factors like heat,
light, or moisture
55.
5. Electrical andMagnetic Properties
These properties are relevant
for solid materials used in
electronics, magnetism, and
energy storage.
Electrical Conductivity:
The ability of a solid to conduct
electric current. Metals typically
have high conductivity, while
insulators like wood and rubber
have low conductivity.
Resistivity:
The opposite of conductivity,
describing how strongly a
material resists the flow of
electric current.
Dielectric Strength:
The maximum electric field a
material can withstand without
breaking down (important for
insulators).
Magnetic Properties:
Some solids exhibit magnetism,
including ferromagnetism
(e.g., iron), paramagnetism,
and diamagnetism.
Magnetic properties are
important in electronics, motors,
and sensors.
56.
6. Optical Properties
Opticalproperties describe
how a material interacts with
light.
Transparency:
The ability of a solid to allow
light to pass through it (e.g.,
glass).
Opacity:
The ability of a solid to block
light from passing through it
(e.g., metals).
Refractive Index:
How much light is bent or
refracted when passing through
a material (important in lenses
and optical fibers).
Reflectivity:
The ability of a material to
reflect light. Shiny metals like
aluminium and silver have high
reflectivity.
57.
7. Surface Properties
Surface properties determine how materials interact with
their environment at the surface level.
Surface Energy:
The energy required to increase the surface area of a solid. High
surface energy materials, like metals, tend to be more adhesive.
Surface Roughness:
A measure of the microscopic texture of the surface. It impacts
friction, wear resistance, and adhesion.
Wet ability:
The ability of a liquid to spread on a solid surface. Materials with
high surface energy tend to be more wet table.
58.
Applications of SolidProperties
Engineering and Construction: Strength, toughness, and
durability are critical for structural materials (e.g., concrete,
steel).
Electronics: Electrical conductivity and thermal properties are
essential for semiconductors, capacitors, and batteries.
Pharmaceuticals: Properties like solubility and hardness are
crucial for drug formulation and tablet manufacturing.
Materials Science:The understanding of properties helps in
developing new materials for specialized uses, such as
nanomaterials, composites, and biomaterials.
59.
1.10 Storage OfSolids (Bulk And Bin)
The storage of solids is a critical aspect of material handling in
industries such as agriculture, pharmaceuticals, food processing,
chemicals, and construction.
Proper storage of solids, whether in bulk or bins, is essential to
maintain material quality, ensure safety, prevent contamination, and
optimize space usage.
Consideration for storage
Ventilation
Moisture Control
Segregation:
Capacity Planning
60.
1. Bulk Storageof Solids
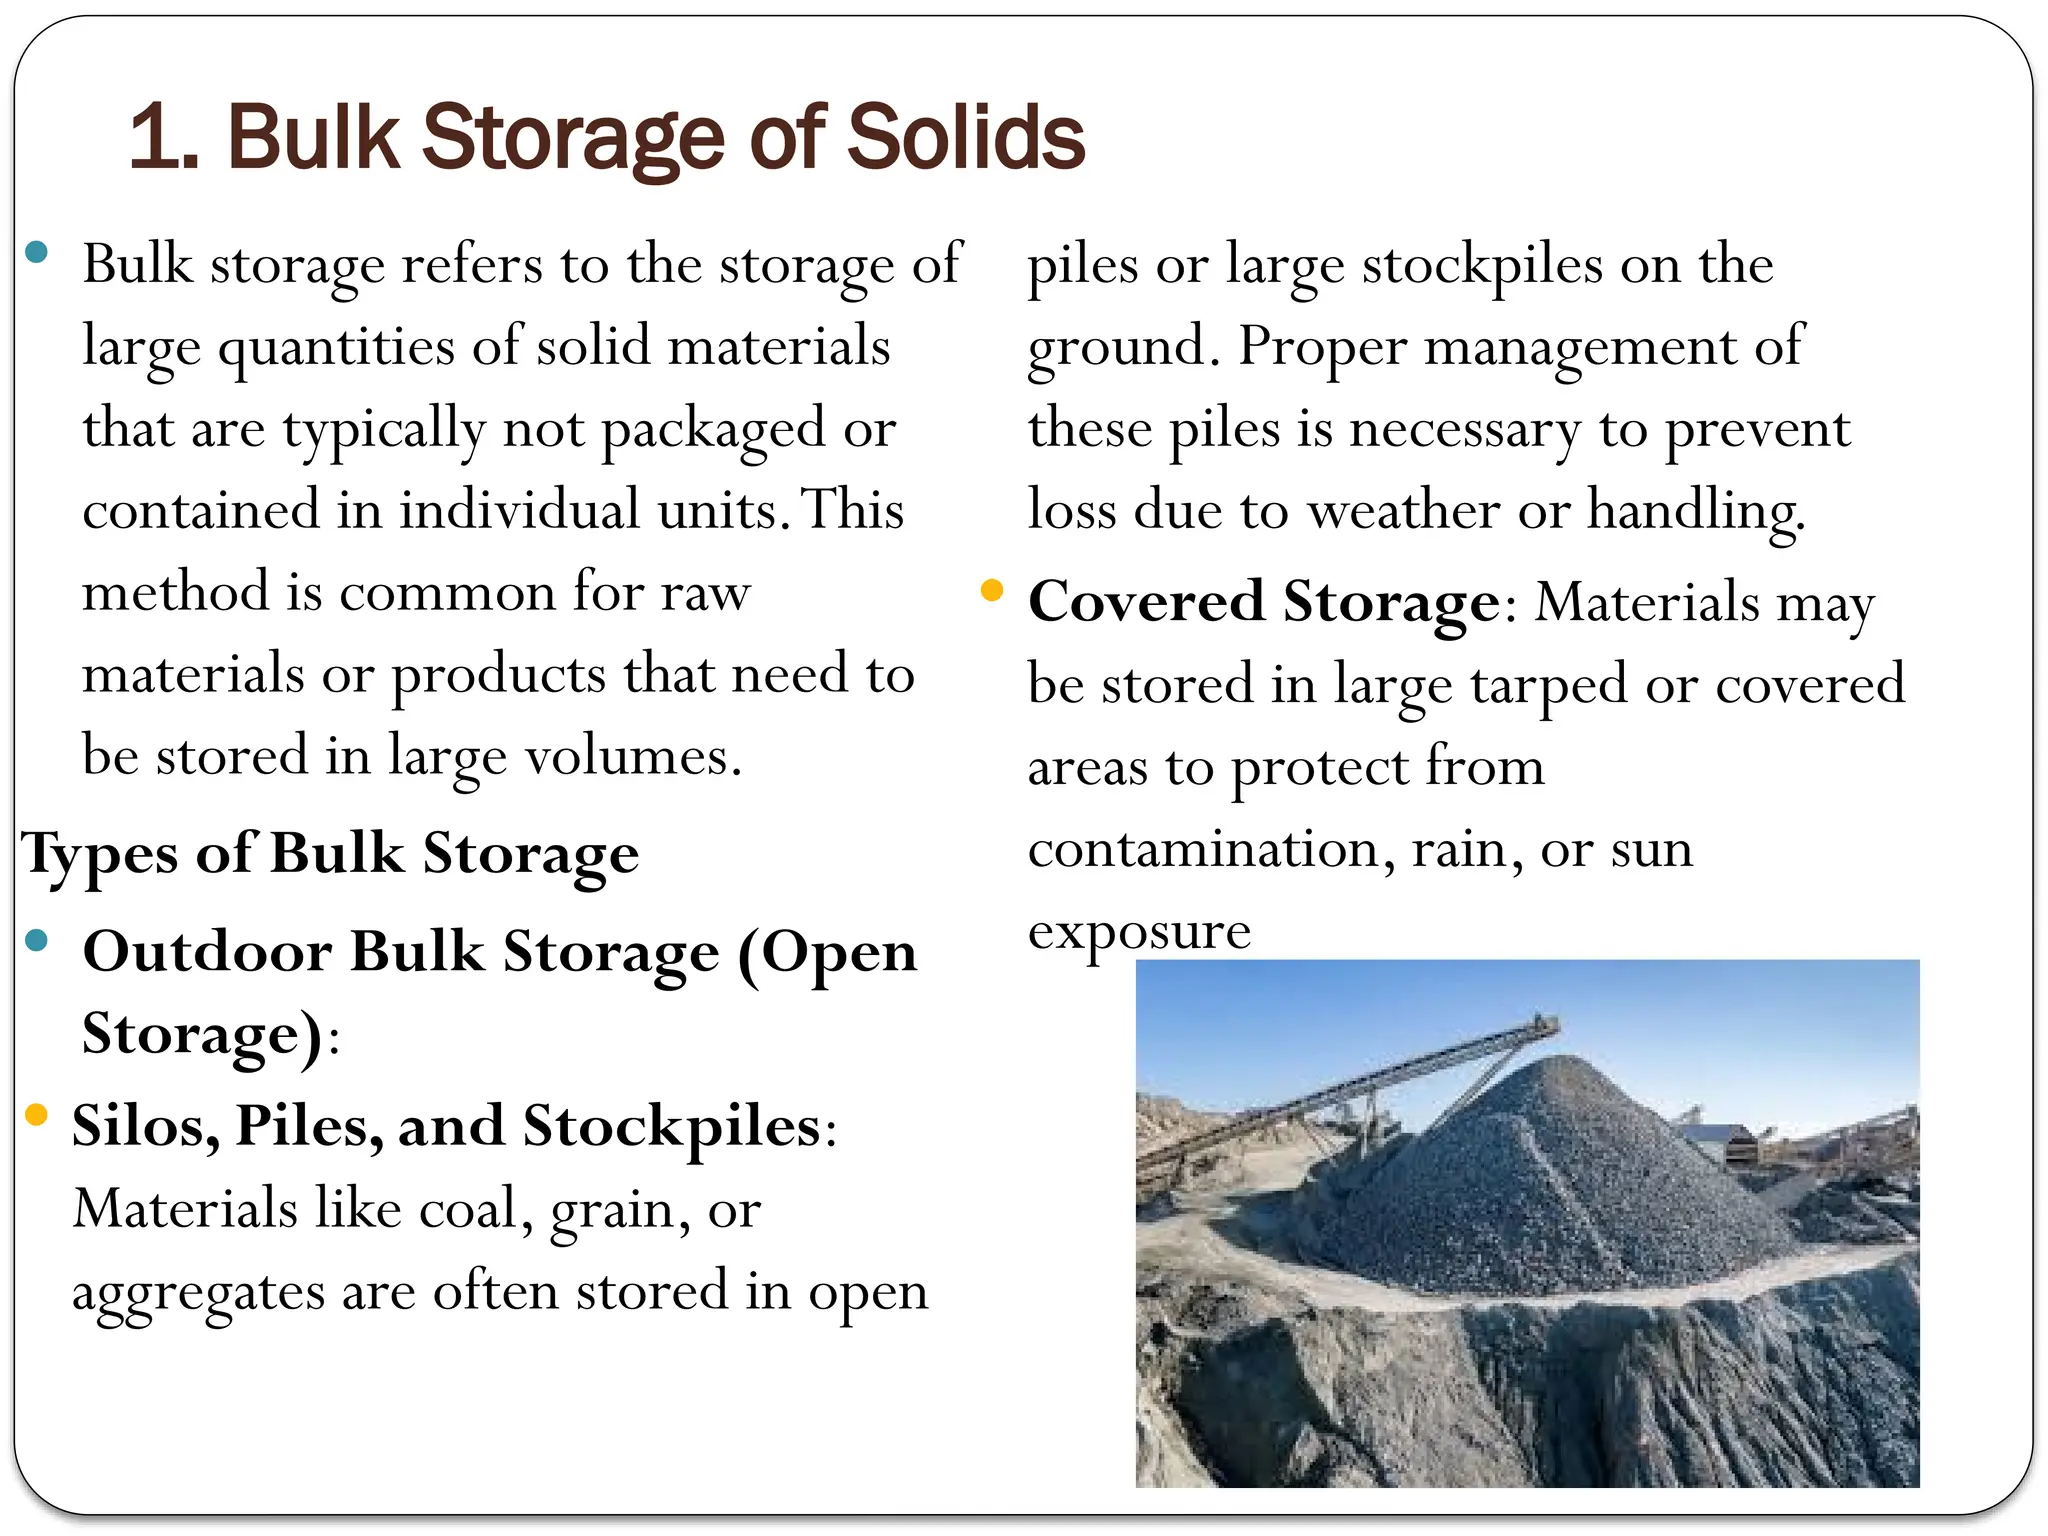
Bulk storage refers to the storage of
large quantities of solid materials
that are typically not packaged or
contained in individual units.This
method is common for raw
materials or products that need to
be stored in large volumes.
Types of Bulk Storage
Outdoor Bulk Storage (Open
Storage):
Silos, Piles, and Stockpiles:
Materials like coal, grain, or
aggregates are often stored in open
piles or large stockpiles on the
ground. Proper management of
these piles is necessary to prevent
loss due to weather or handling.
Covered Storage: Materials may
be stored in large tarped or covered
areas to protect from
contamination, rain, or sun
exposure
61.
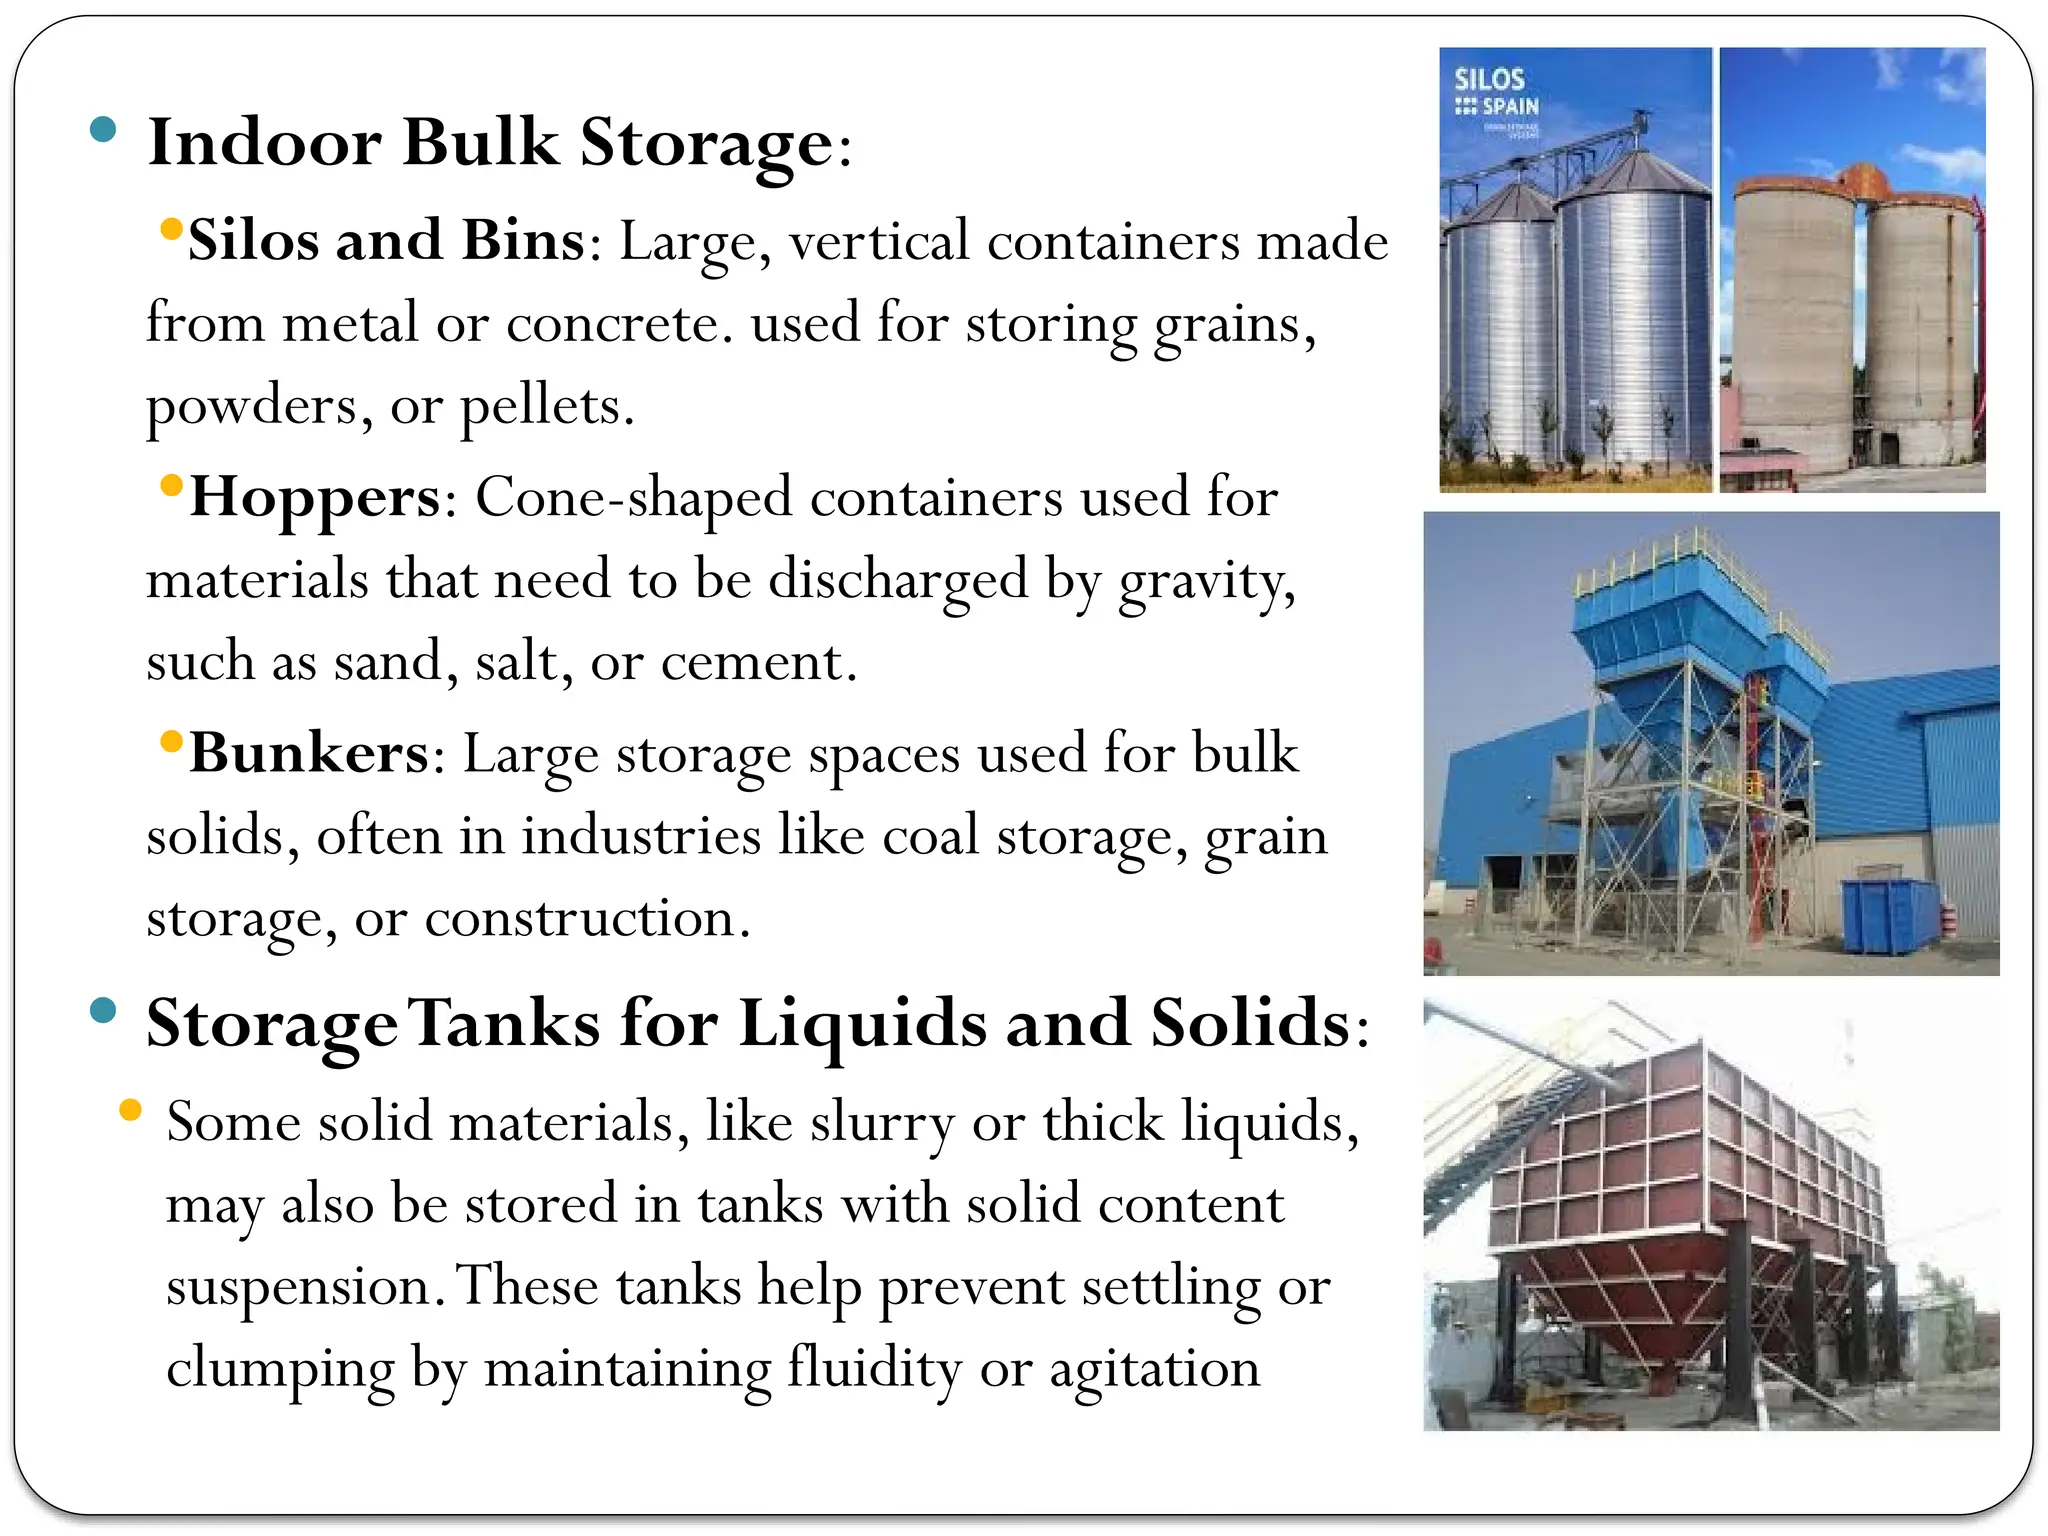
Indoor BulkStorage:
Silos and Bins: Large, vertical containers made
from metal or concrete. used for storing grains,
powders, or pellets.
Hoppers: Cone-shaped containers used for
materials that need to be discharged by gravity,
such as sand, salt, or cement.
Bunkers: Large storage spaces used for bulk
solids, often in industries like coal storage, grain
storage, or construction.
StorageTanks for Liquids and Solids:
Some solid materials, like slurry or thick liquids,
may also be stored in tanks with solid content
suspension.These tanks help prevent settling or
clumping by maintaining fluidity or agitation
62.
2. Bin Storageof Solids
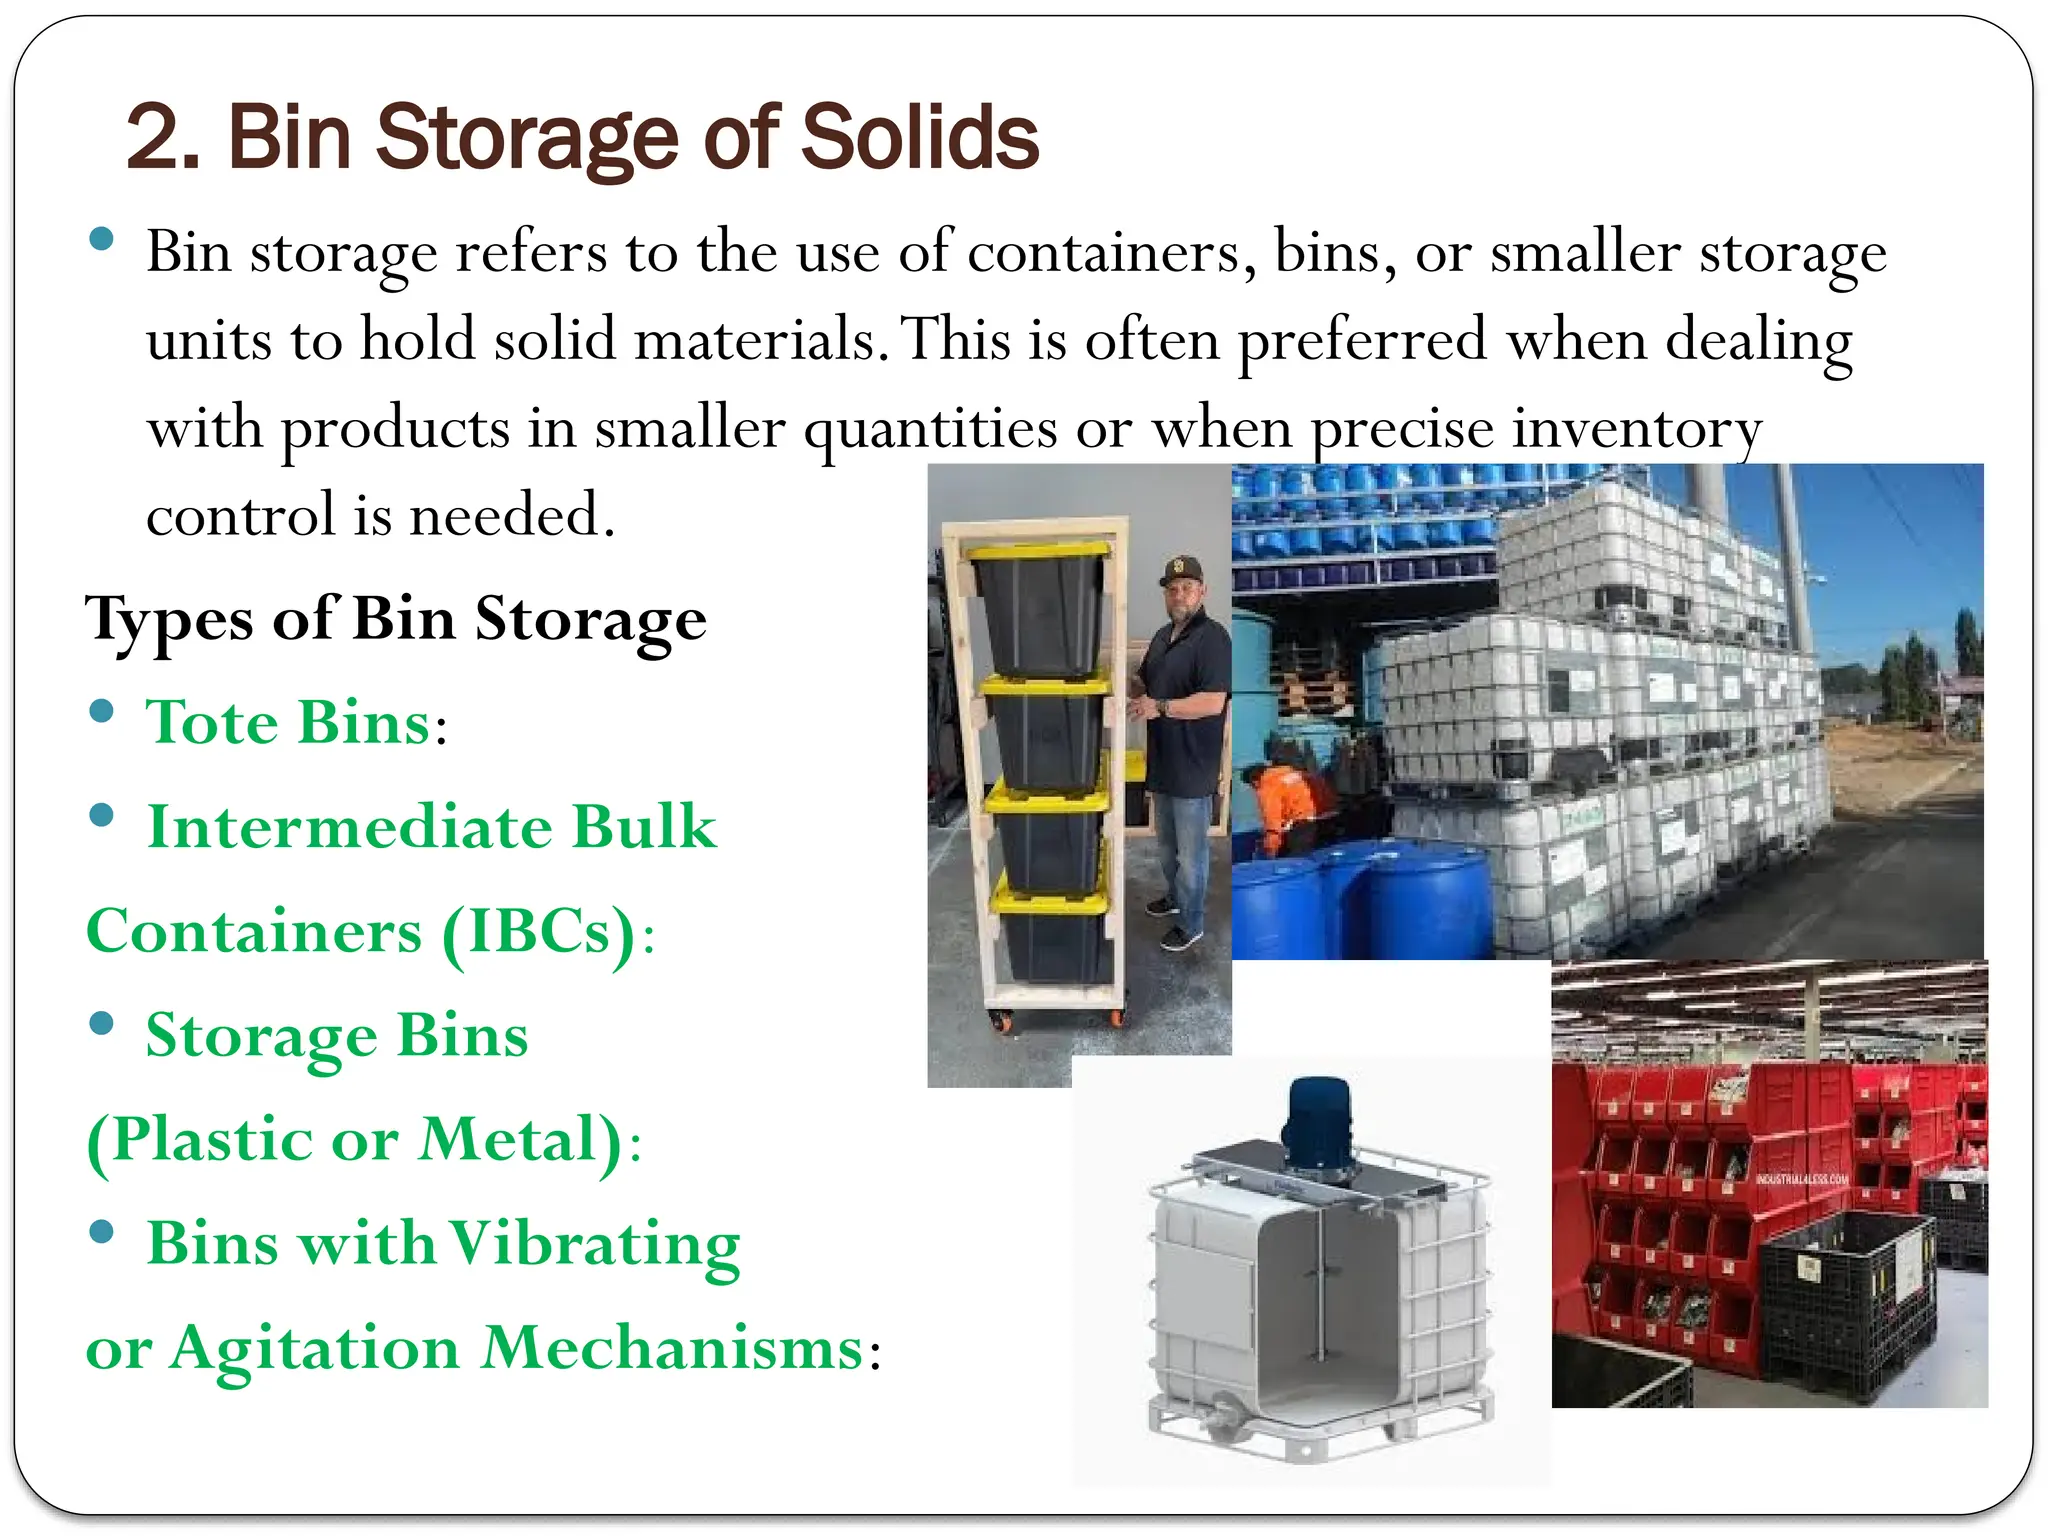
Bin storage refers to the use of containers, bins, or smaller storage
units to hold solid materials.This is often preferred when dealing
with products in smaller quantities or when precise inventory
control is needed.
Types of Bin Storage
Tote Bins:
Intermediate Bulk
Containers (IBCs):
Storage Bins
(Plastic or Metal):
Bins withVibrating
or Agitation Mechanisms:
63.
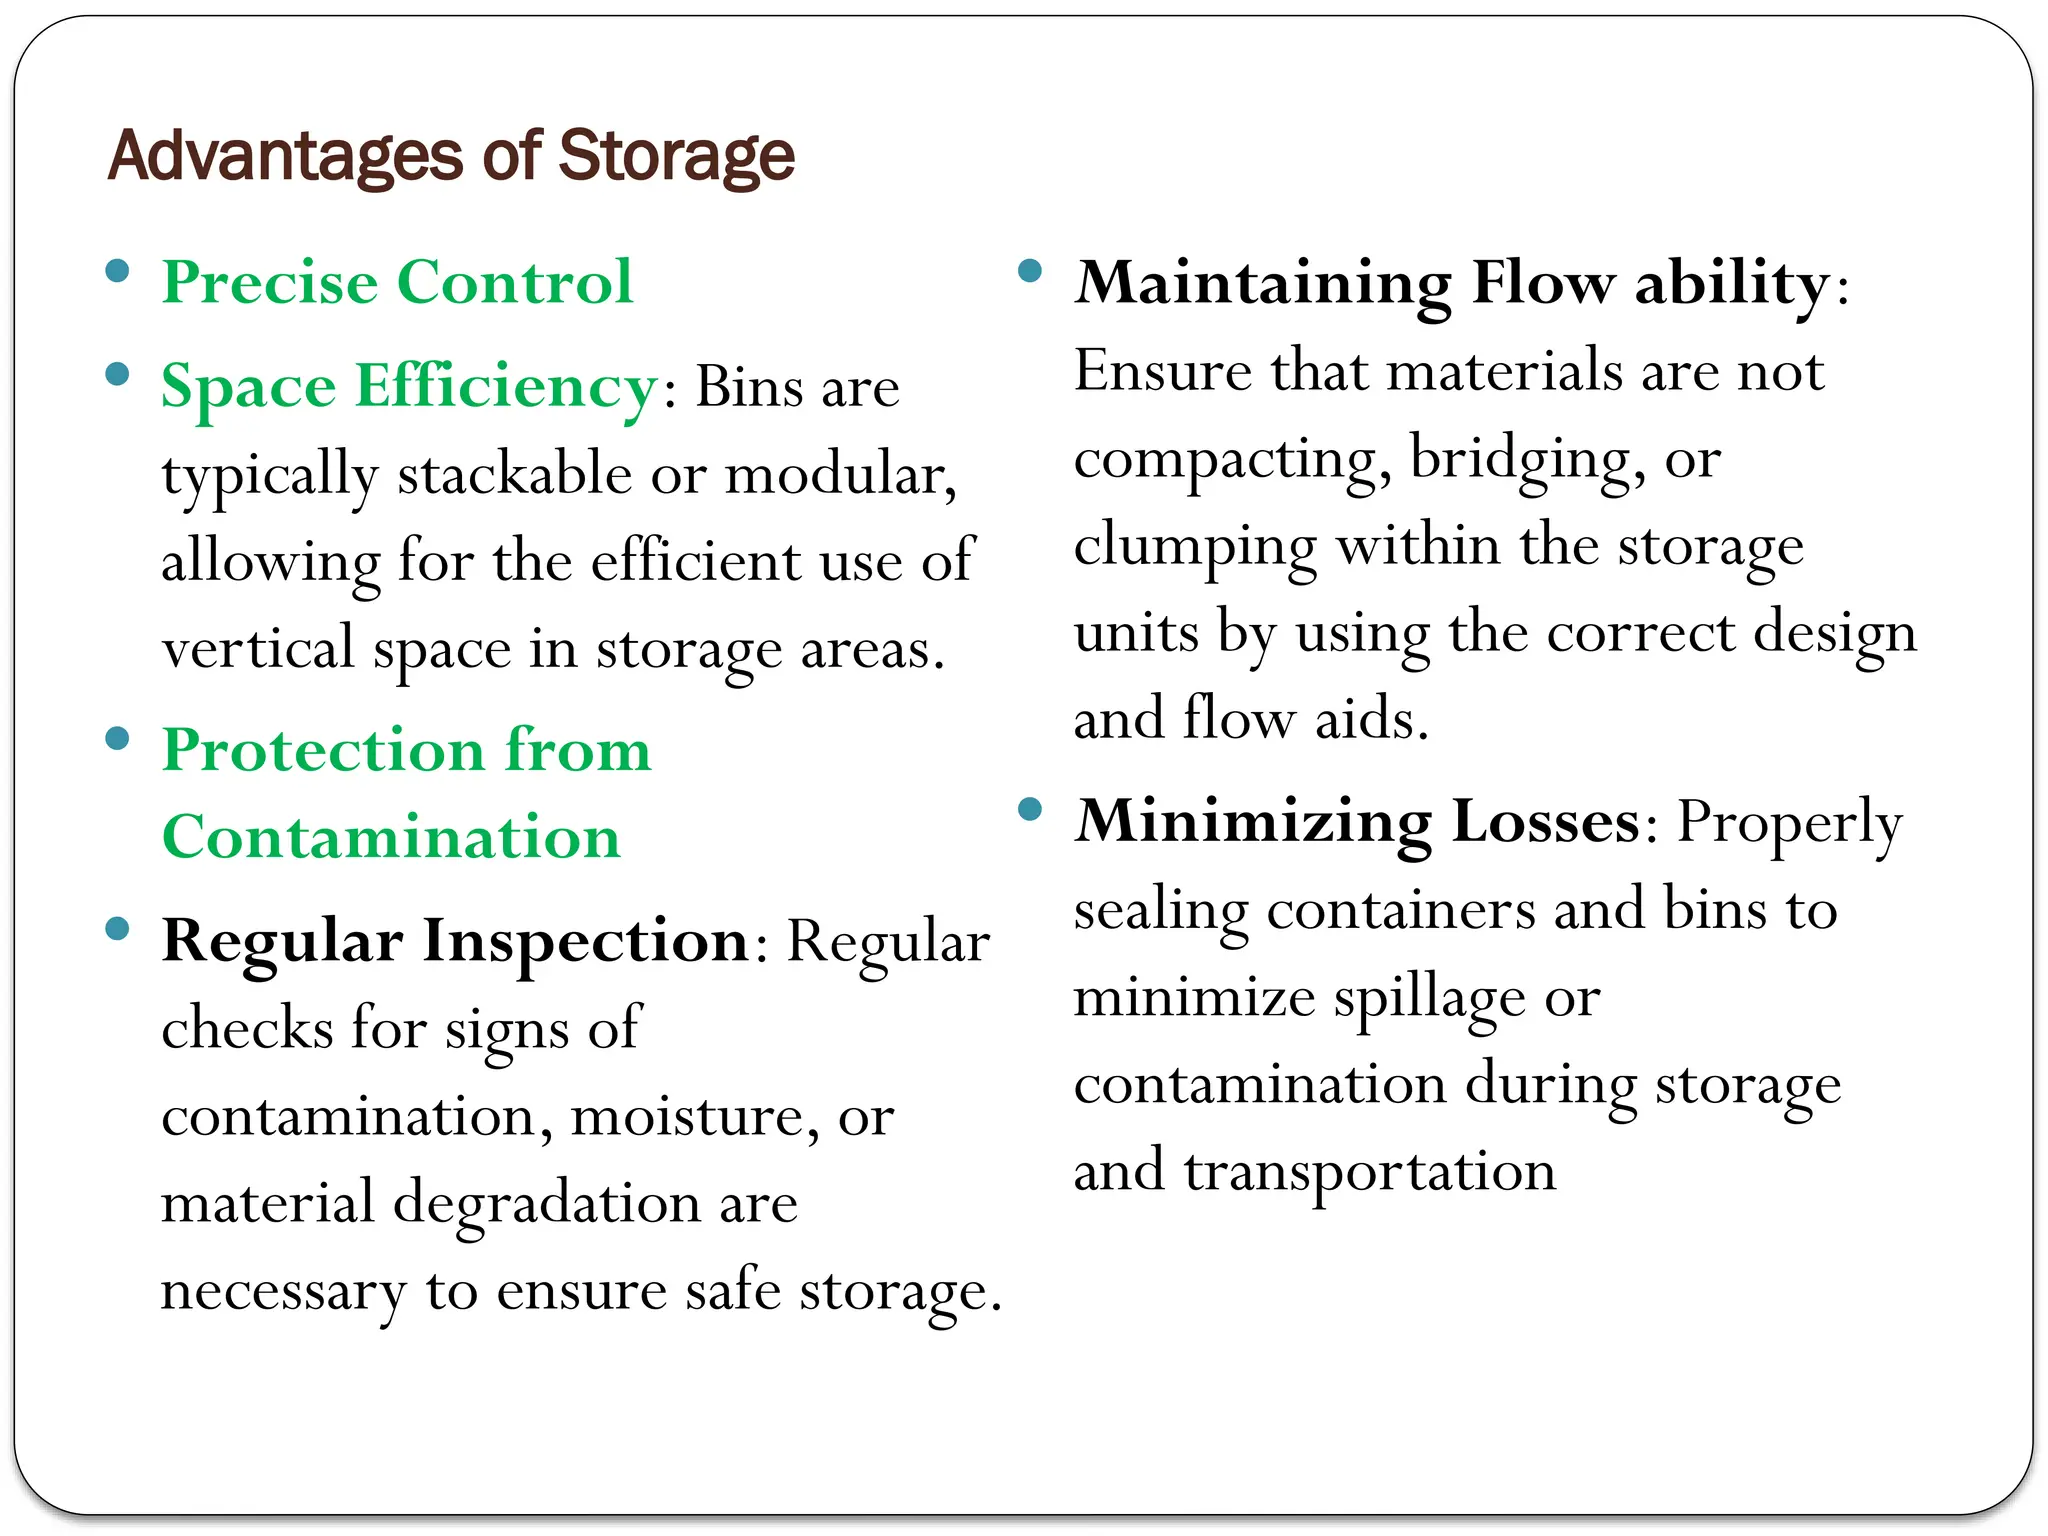
Advantages of Storage
Precise Control
Space Efficiency: Bins are
typically stackable or modular,
allowing for the efficient use of
vertical space in storage areas.
Protection from
Contamination
Regular Inspection: Regular
checks for signs of
contamination, moisture, or
material degradation are
necessary to ensure safe storage.
Maintaining Flow ability:
Ensure that materials are not
compacting, bridging, or
clumping within the storage
units by using the correct design
and flow aids.
Minimizing Losses: Properly
sealing containers and bins to
minimize spillage or
contamination during storage
and transportation
64.
Safety Considerations inSolid Storage
Explosion Risk:
Weight Distribution:
Pest and Contaminant Control:
65.
Conclusion
The storageof solid materials, whether in bulk or bins, requires
careful consideration of the material properties, storage
conditions, and handling mechanisms. Proper storage systems
ensure that the quality of the materials is maintained, and
operational efficiency is maximized. The choice between bulk or
bin storage depends on the nature of the material, required storage
volume, and the level of control needed
66.
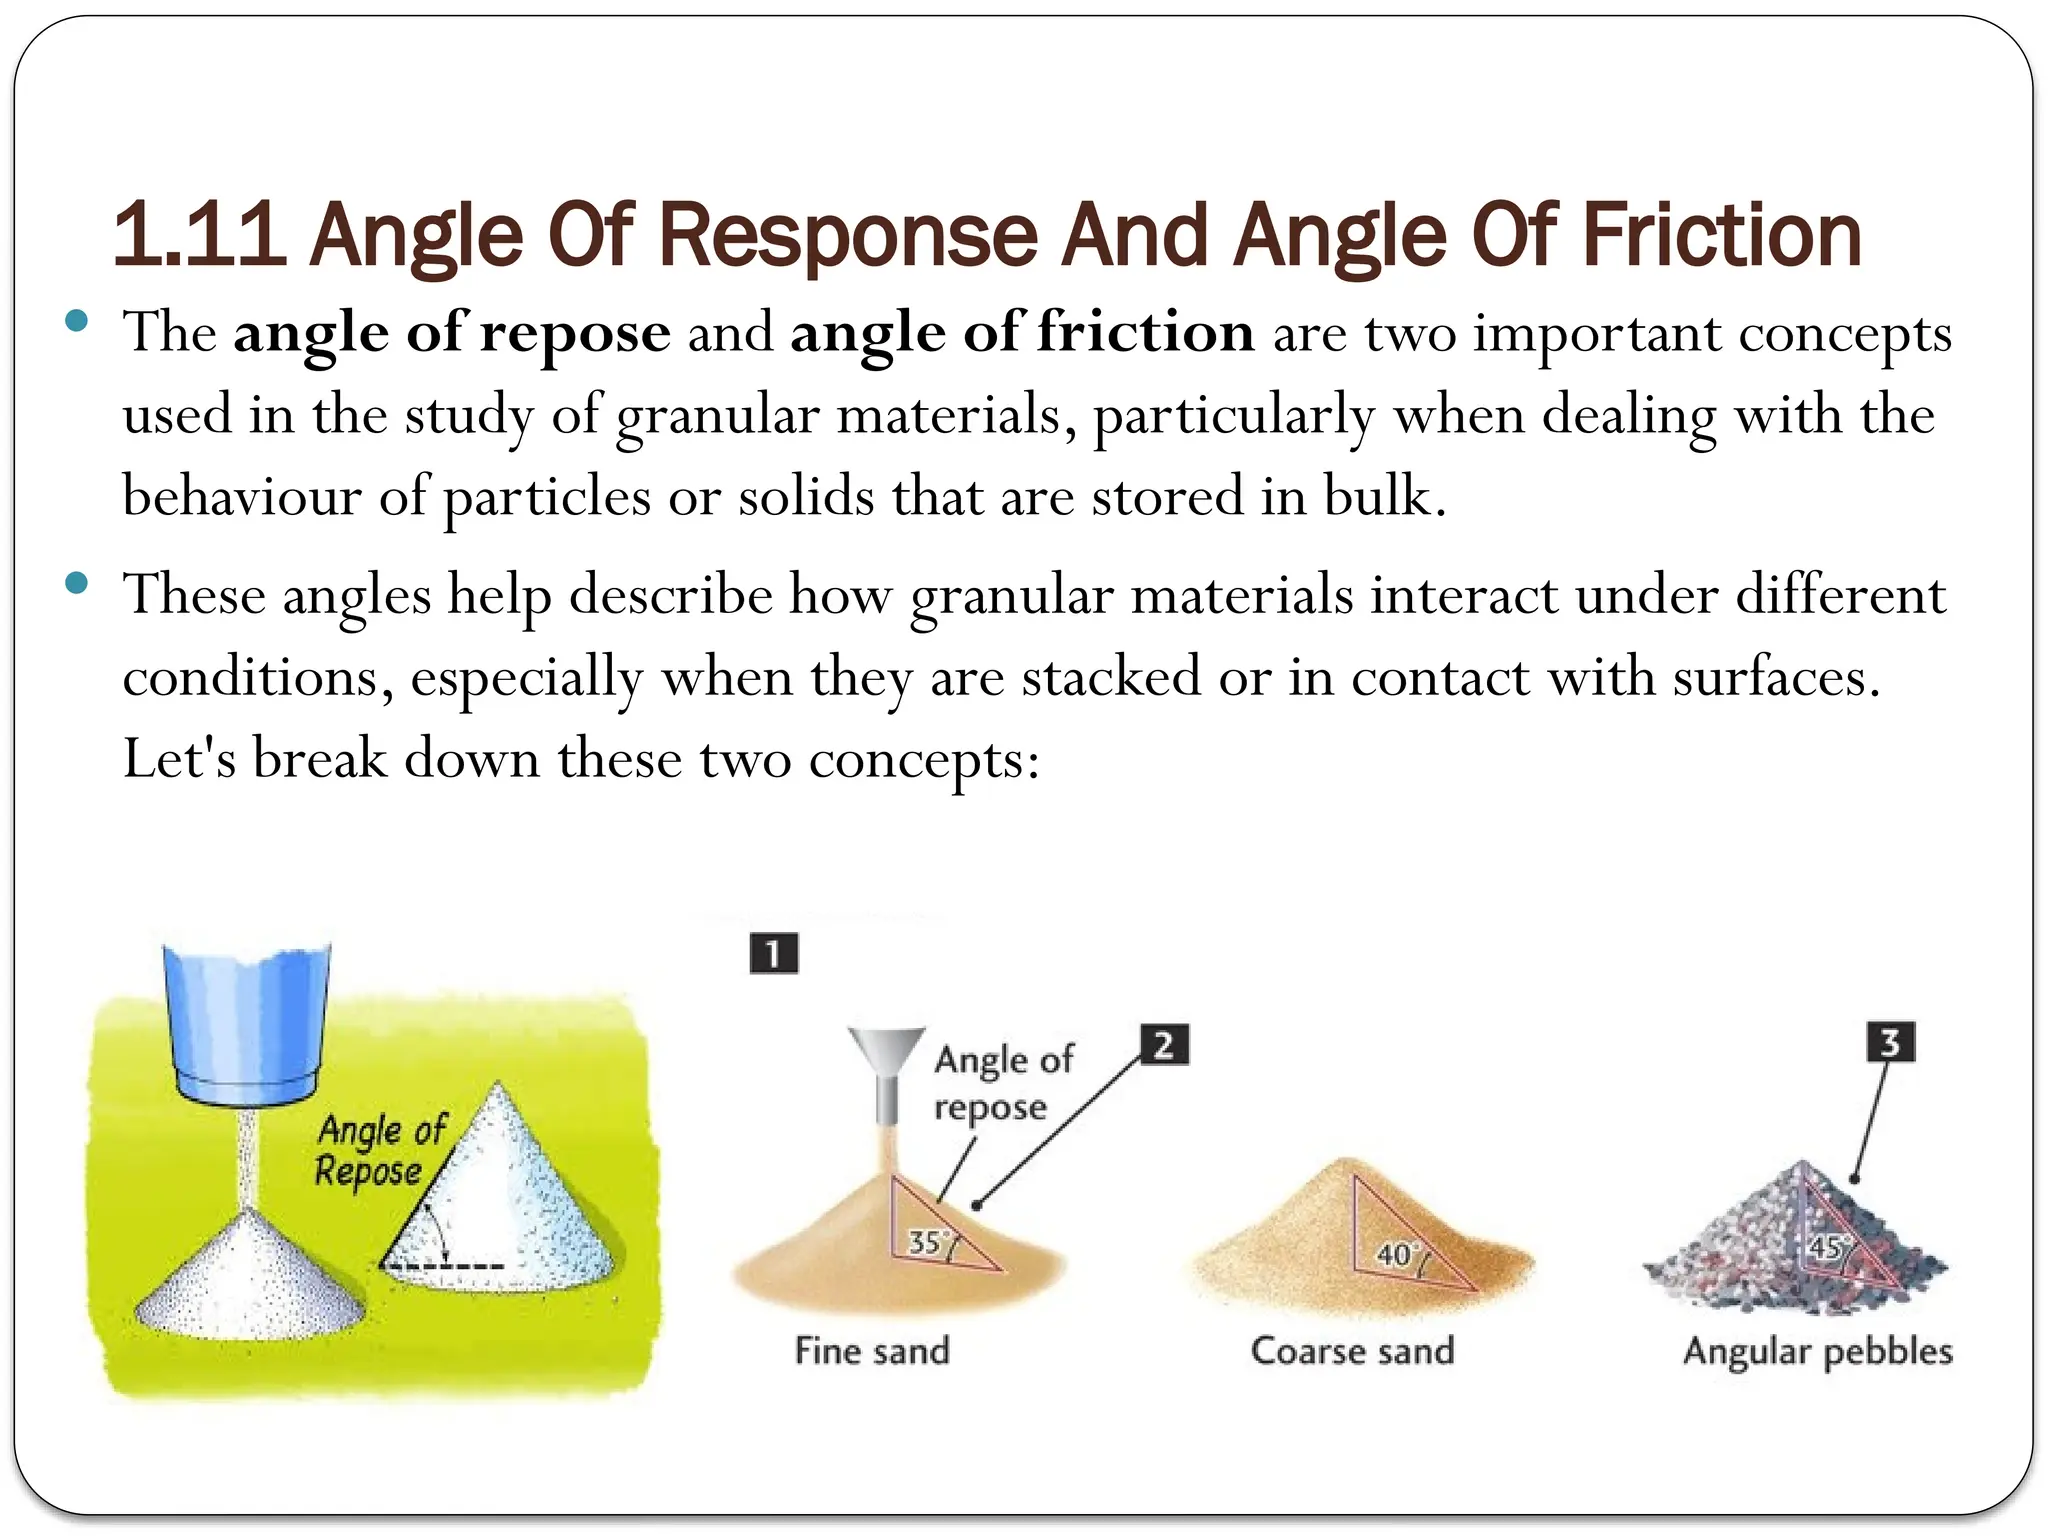
1.11 Angle OfResponse And Angle Of Friction
The angle of repose and angle of friction are two important concepts
used in the study of granular materials, particularly when dealing with the
behaviour of particles or solids that are stored in bulk.
These angles help describe how granular materials interact under different
conditions, especially when they are stacked or in contact with surfaces.
Let's break down these two concepts:
67.
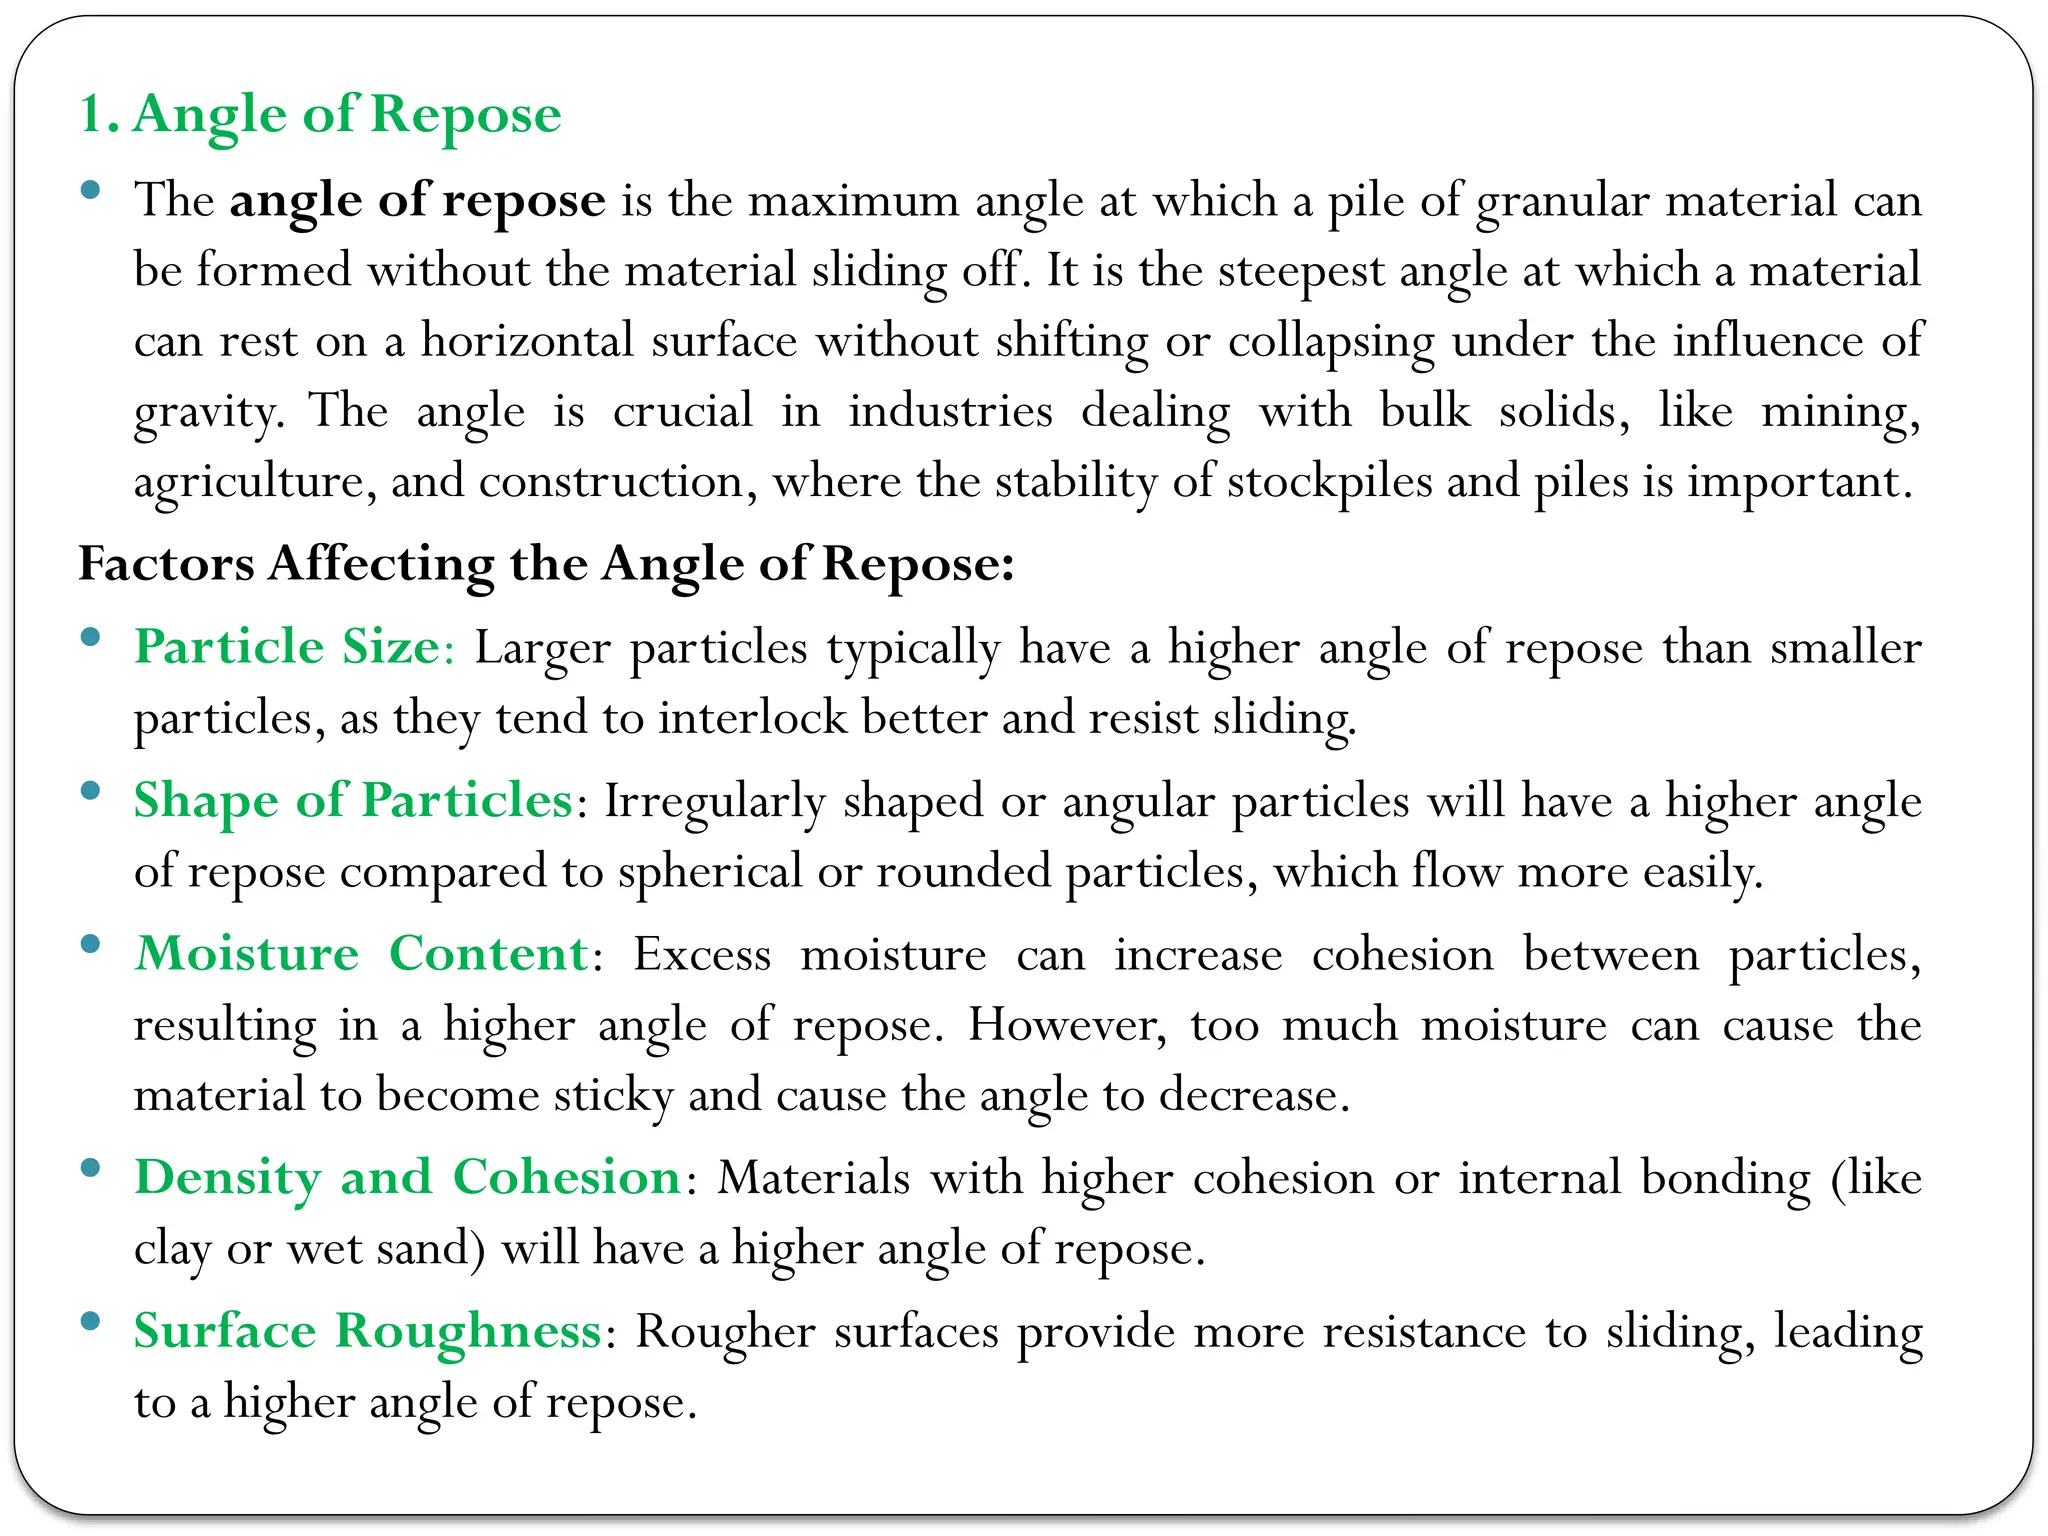
1.Angle of Repose
The angle of repose is the maximum angle at which a pile of granular material can
be formed without the material sliding off. It is the steepest angle at which a material
can rest on a horizontal surface without shifting or collapsing under the influence of
gravity. The angle is crucial in industries dealing with bulk solids, like mining,
agriculture, and construction, where the stability of stockpiles and piles is important.
Factors Affecting the Angle of Repose:
Particle Size: Larger particles typically have a higher angle of repose than smaller
particles, as they tend to interlock better and resist sliding.
Shape of Particles: Irregularly shaped or angular particles will have a higher angle
of repose compared to spherical or rounded particles, which flow more easily.
Moisture Content: Excess moisture can increase cohesion between particles,
resulting in a higher angle of repose. However, too much moisture can cause the
material to become sticky and cause the angle to decrease.
Density and Cohesion: Materials with higher cohesion or internal bonding (like
clay or wet sand) will have a higher angle of repose.
Surface Roughness: Rougher surfaces provide more resistance to sliding, leading
to a higher angle of repose.
68.
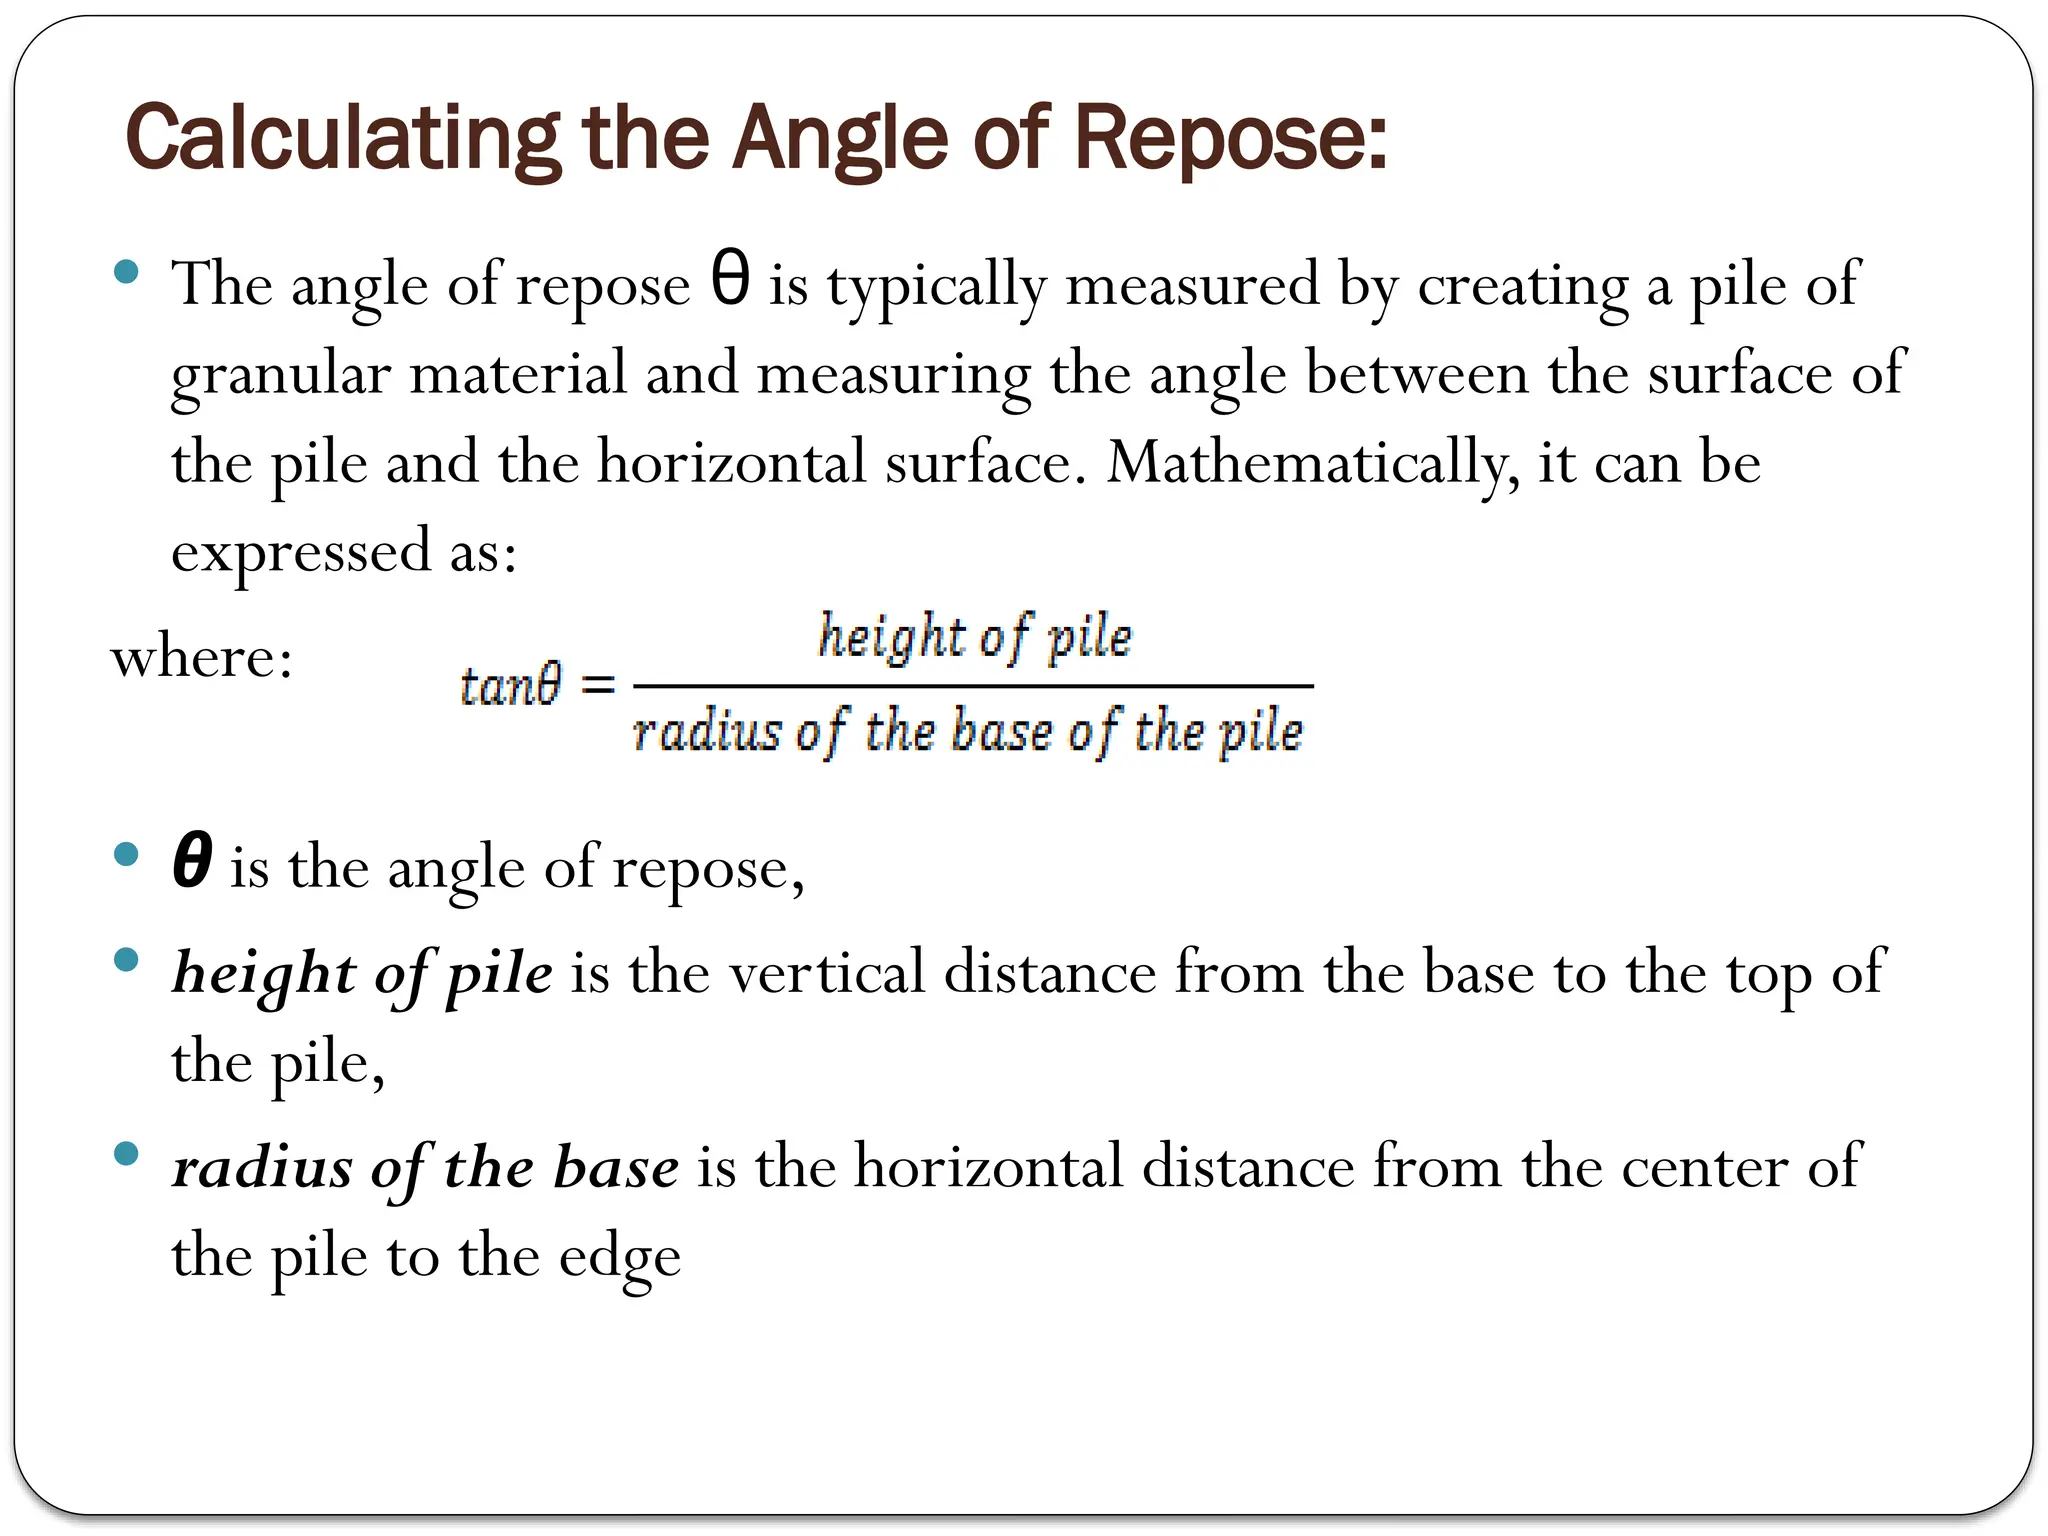
Calculating the Angleof Repose:
The angle of repose is typically measured by creating a pile of
θ
granular material and measuring the angle between the surface of
the pile and the horizontal surface. Mathematically, it can be
expressed as:
where:
θ is the angle of repose,
height of pile is the vertical distance from the base to the top of
the pile,
radius of the base is the horizontal distance from the center of
the pile to the edge
69.
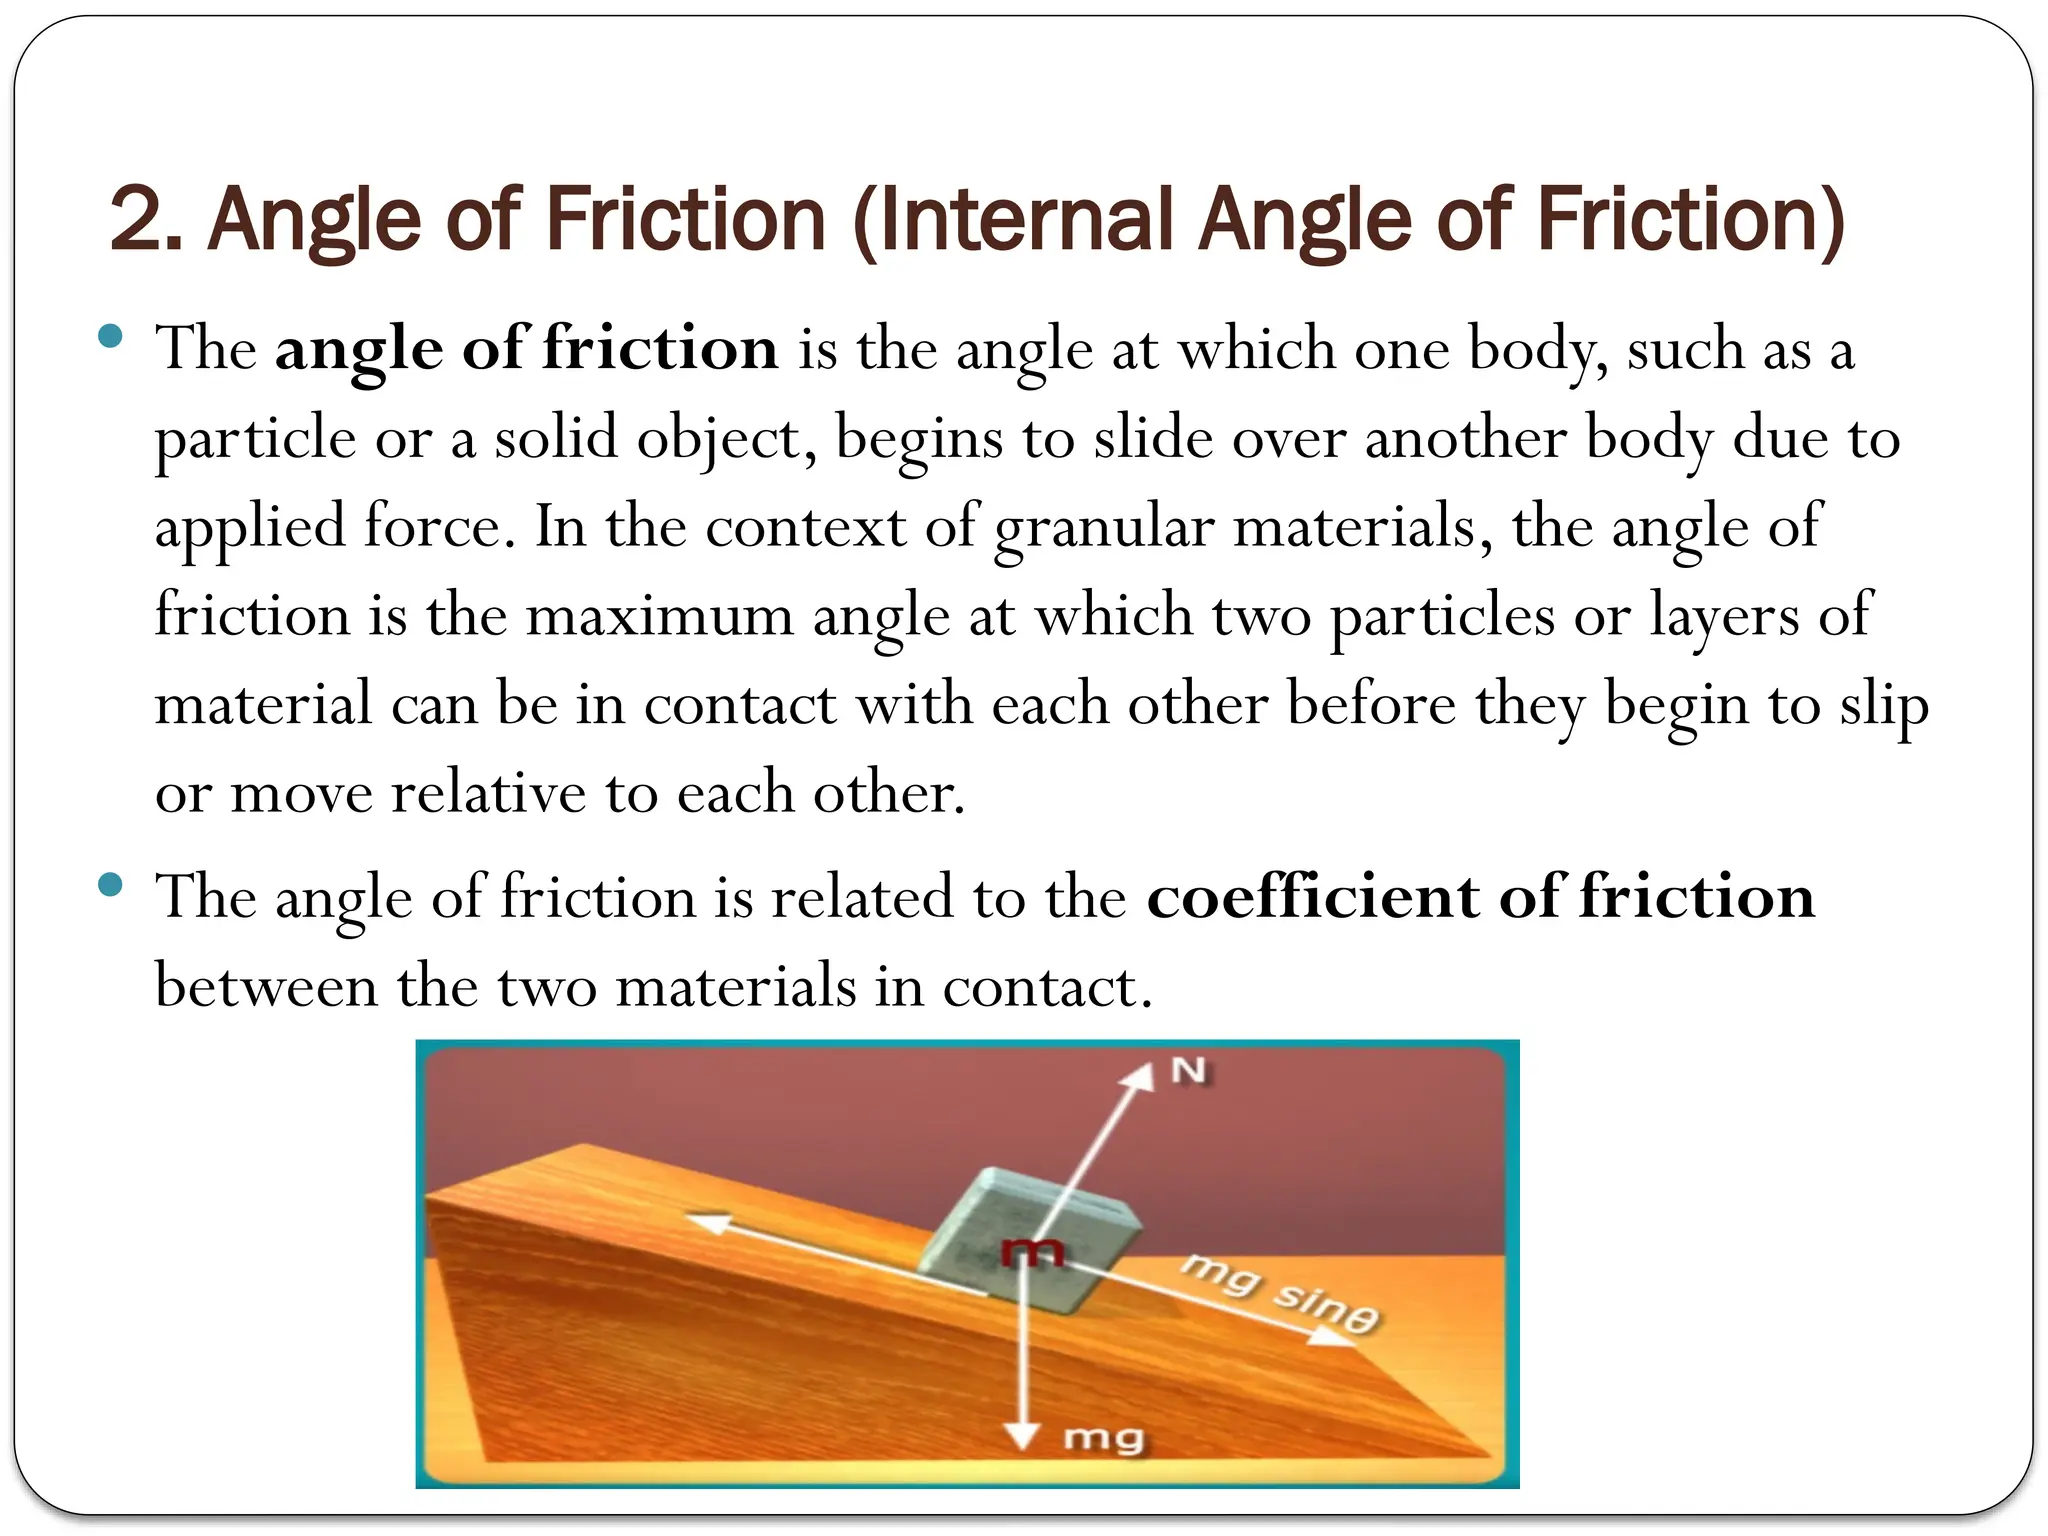
2. Angle ofFriction (Internal Angle of Friction)
The angle of friction is the angle at which one body, such as a
particle or a solid object, begins to slide over another body due to
applied force. In the context of granular materials, the angle of
friction is the maximum angle at which two particles or layers of
material can be in contact with each other before they begin to slip
or move relative to each other.
The angle of friction is related to the coefficient of friction
between the two materials in contact.
70.
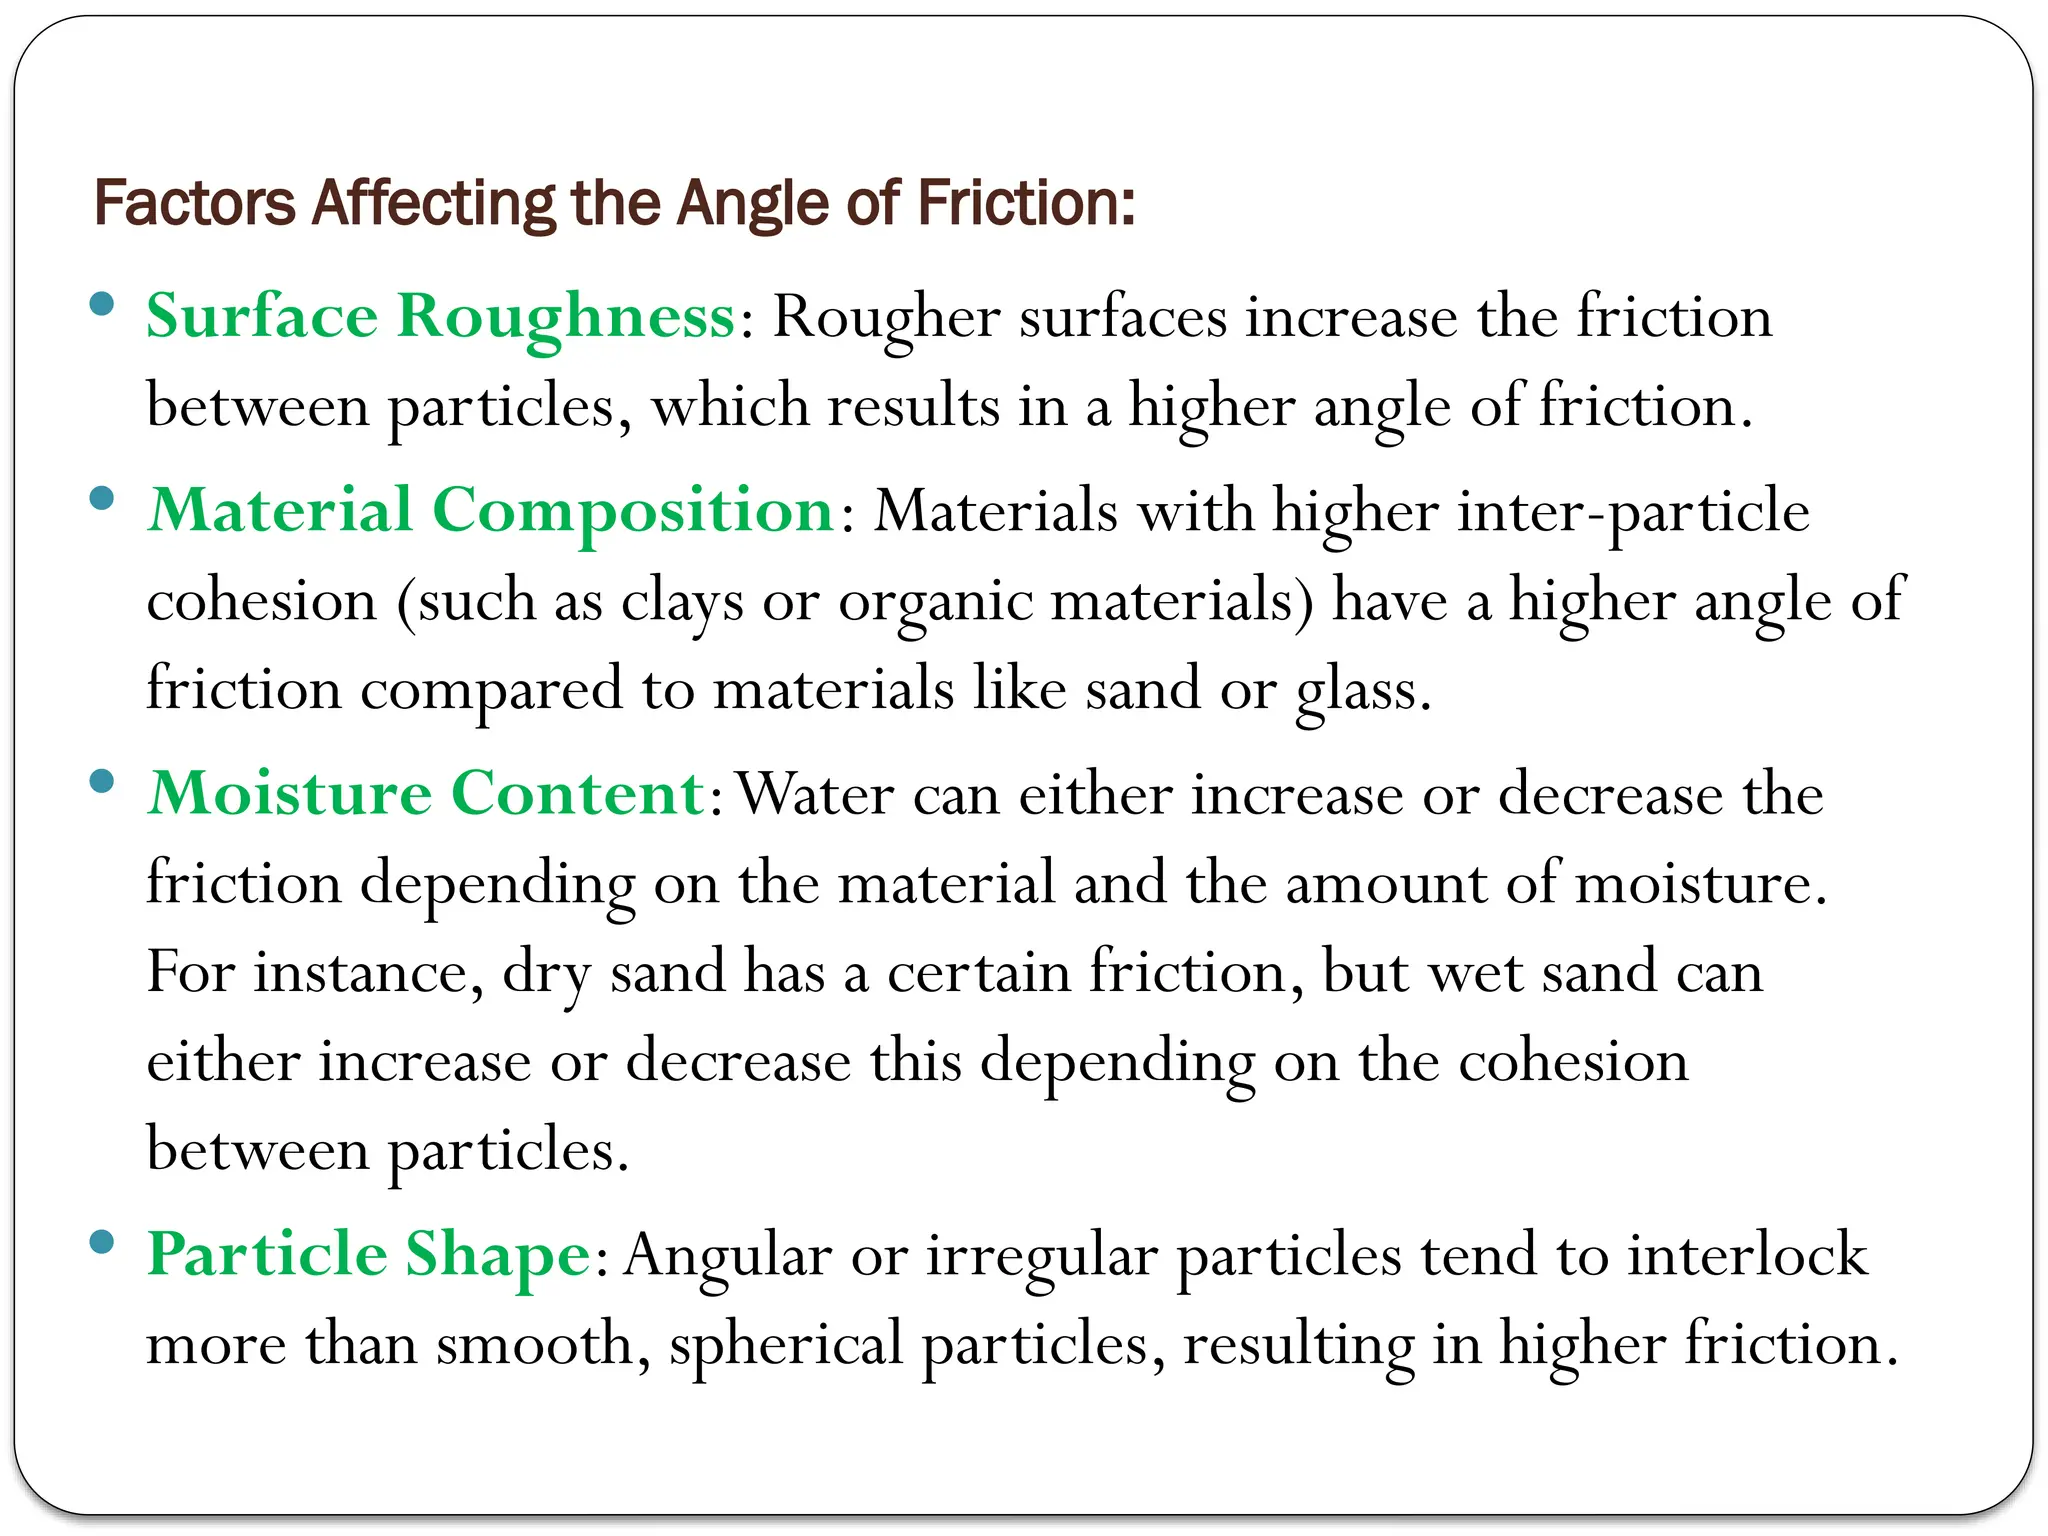
Factors Affecting theAngle of Friction:
Surface Roughness: Rougher surfaces increase the friction
between particles, which results in a higher angle of friction.
Material Composition: Materials with higher inter-particle
cohesion (such as clays or organic materials) have a higher angle of
friction compared to materials like sand or glass.
Moisture Content:Water can either increase or decrease the
friction depending on the material and the amount of moisture.
For instance, dry sand has a certain friction, but wet sand can
either increase or decrease this depending on the cohesion
between particles.
Particle Shape:Angular or irregular particles tend to interlock
more than smooth, spherical particles, resulting in higher friction.
71.
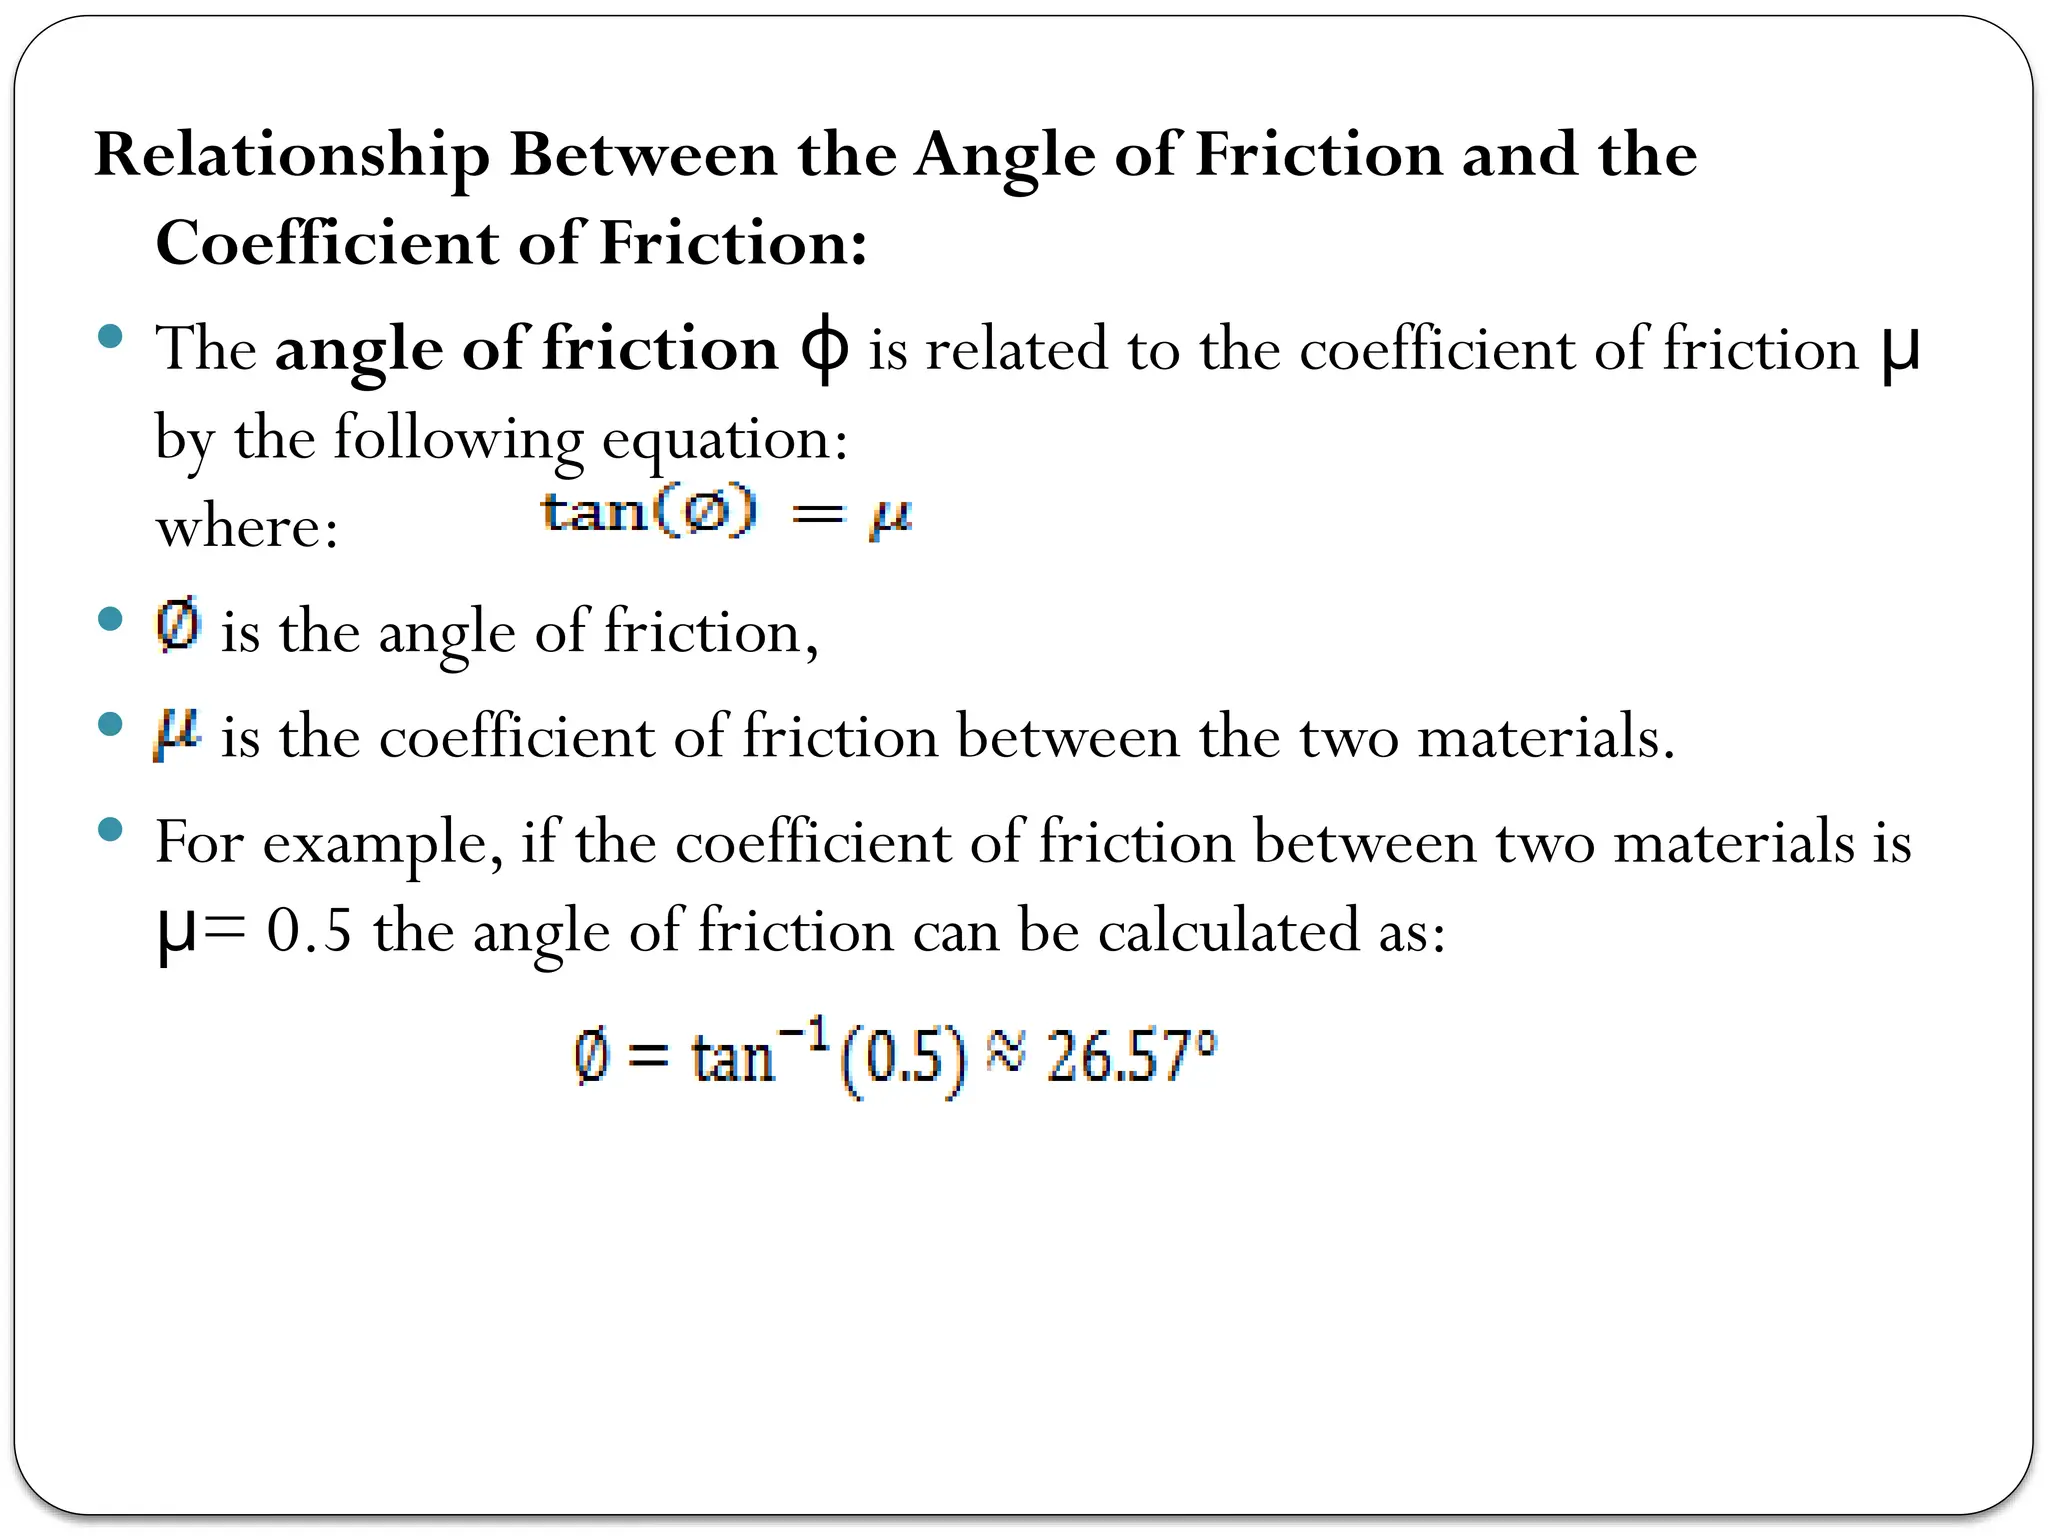
Relationship Between theAngle of Friction and the
Coefficient of Friction:
The angle of friction is related to the coefficient of friction
ϕ μ
by the following equation:
where:
is the angle of friction,
is the coefficient of friction between the two materials.
For example, if the coefficient of friction between two materials is
= 0.5 the angle of friction can be calculated as:
μ
72.
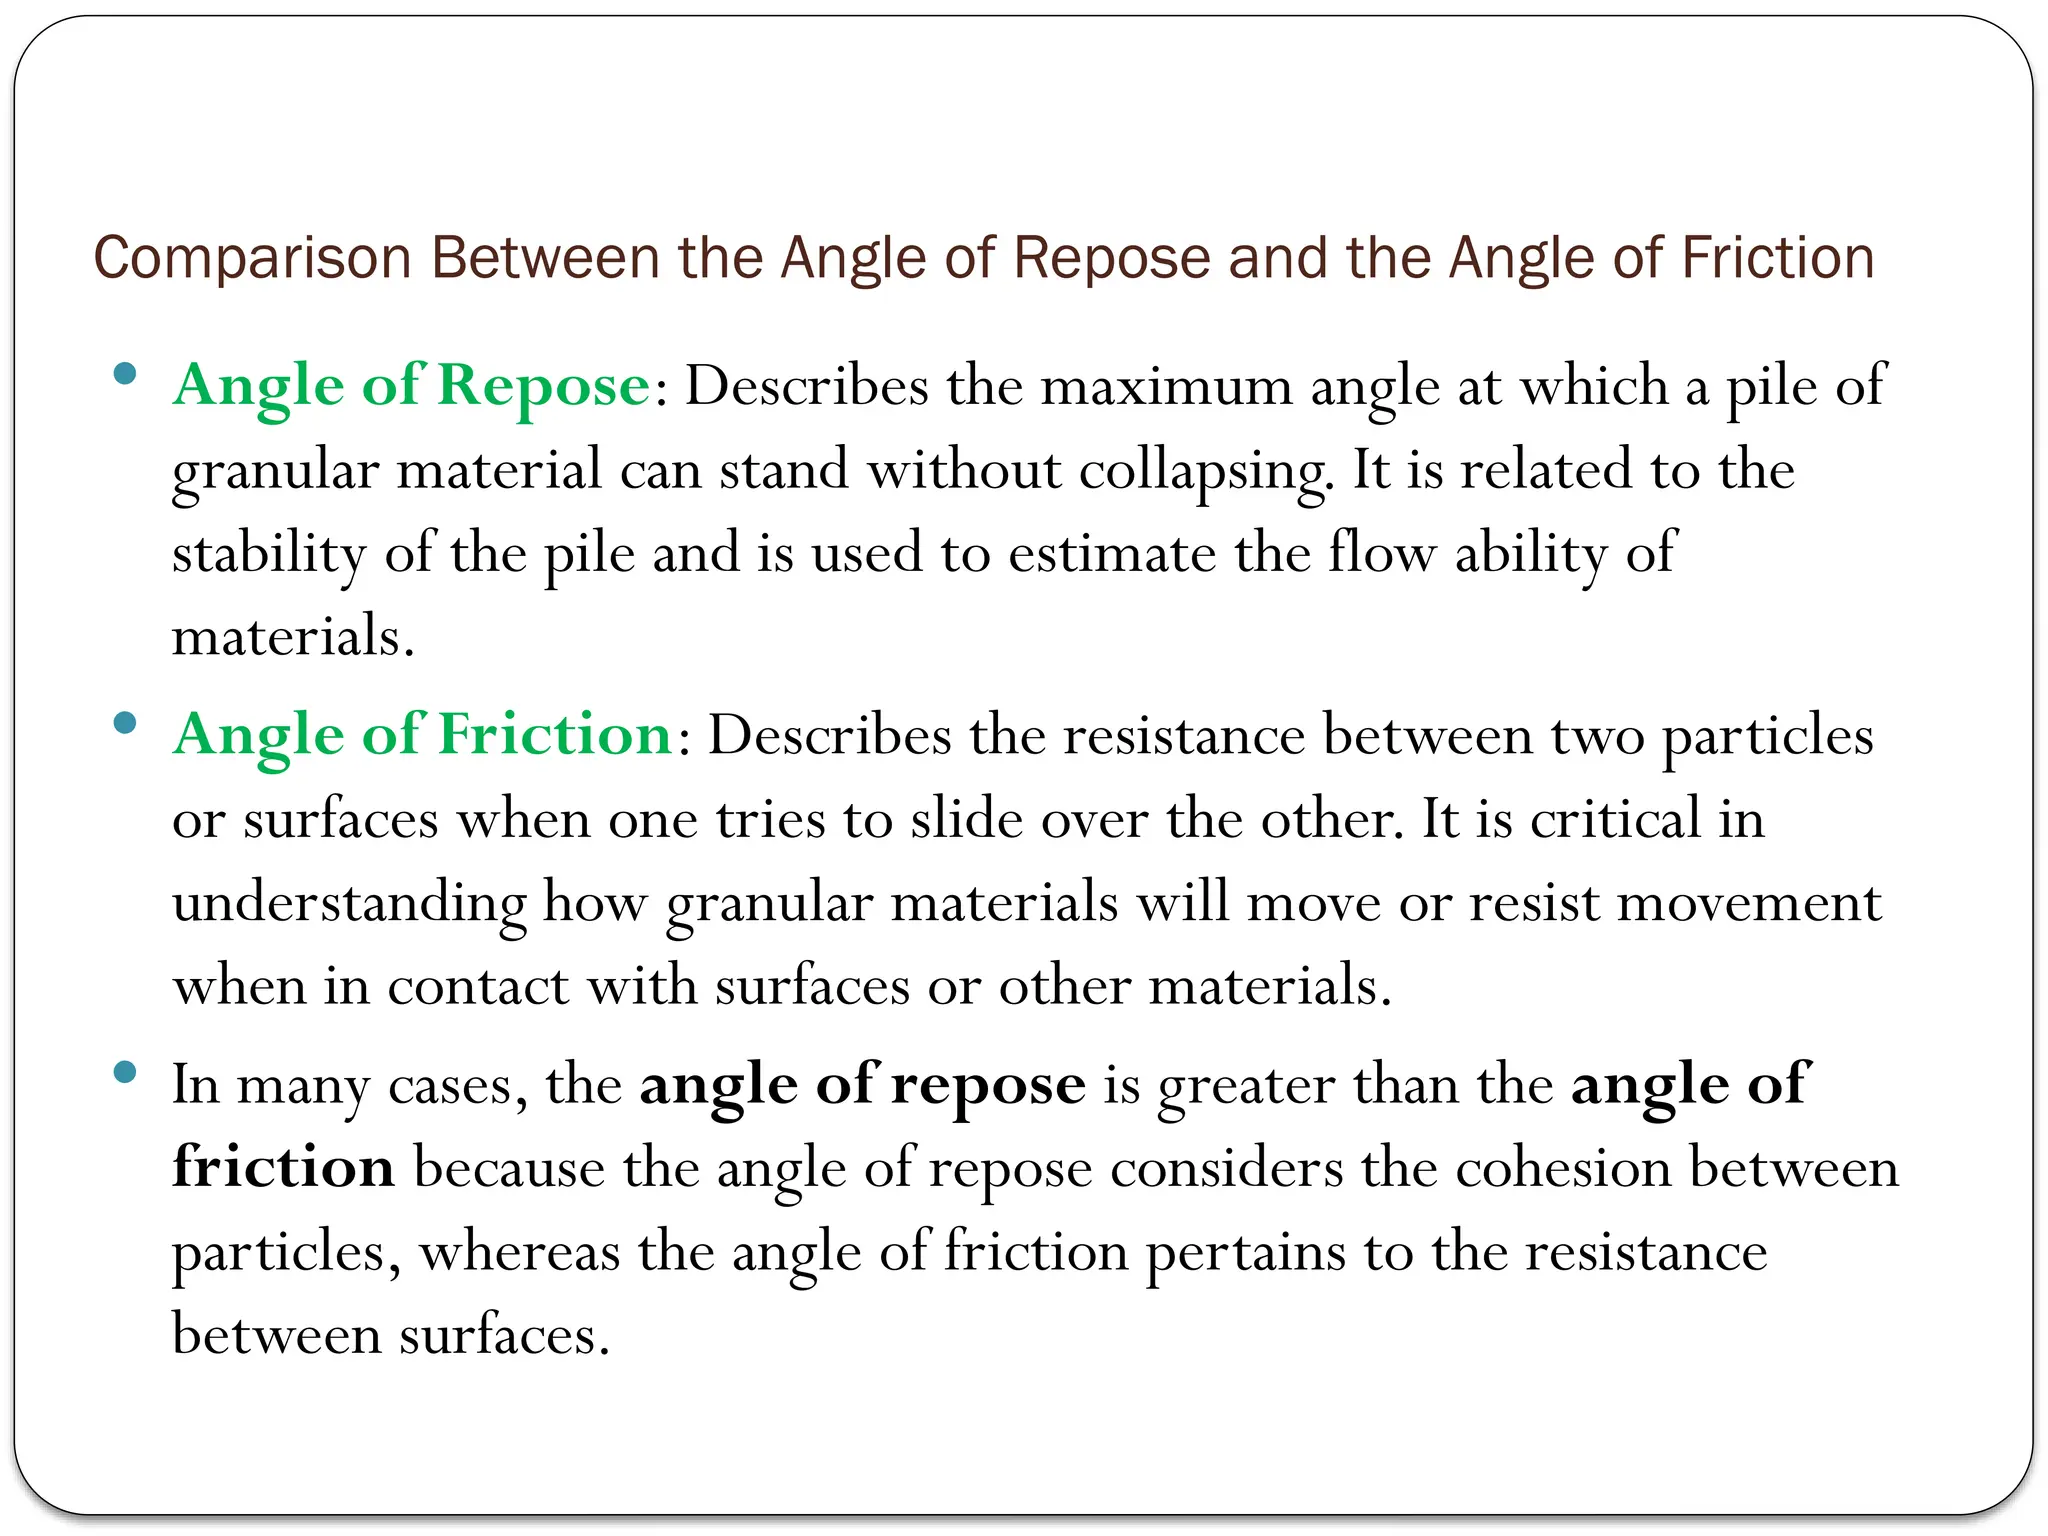
Comparison Between theAngle of Repose and the Angle of Friction
Angle of Repose: Describes the maximum angle at which a pile of
granular material can stand without collapsing. It is related to the
stability of the pile and is used to estimate the flow ability of
materials.
Angle of Friction: Describes the resistance between two particles
or surfaces when one tries to slide over the other. It is critical in
understanding how granular materials will move or resist movement
when in contact with surfaces or other materials.
In many cases, the angle of repose is greater than the angle of
friction because the angle of repose considers the cohesion between
particles, whereas the angle of friction pertains to the resistance
between surfaces.
73.
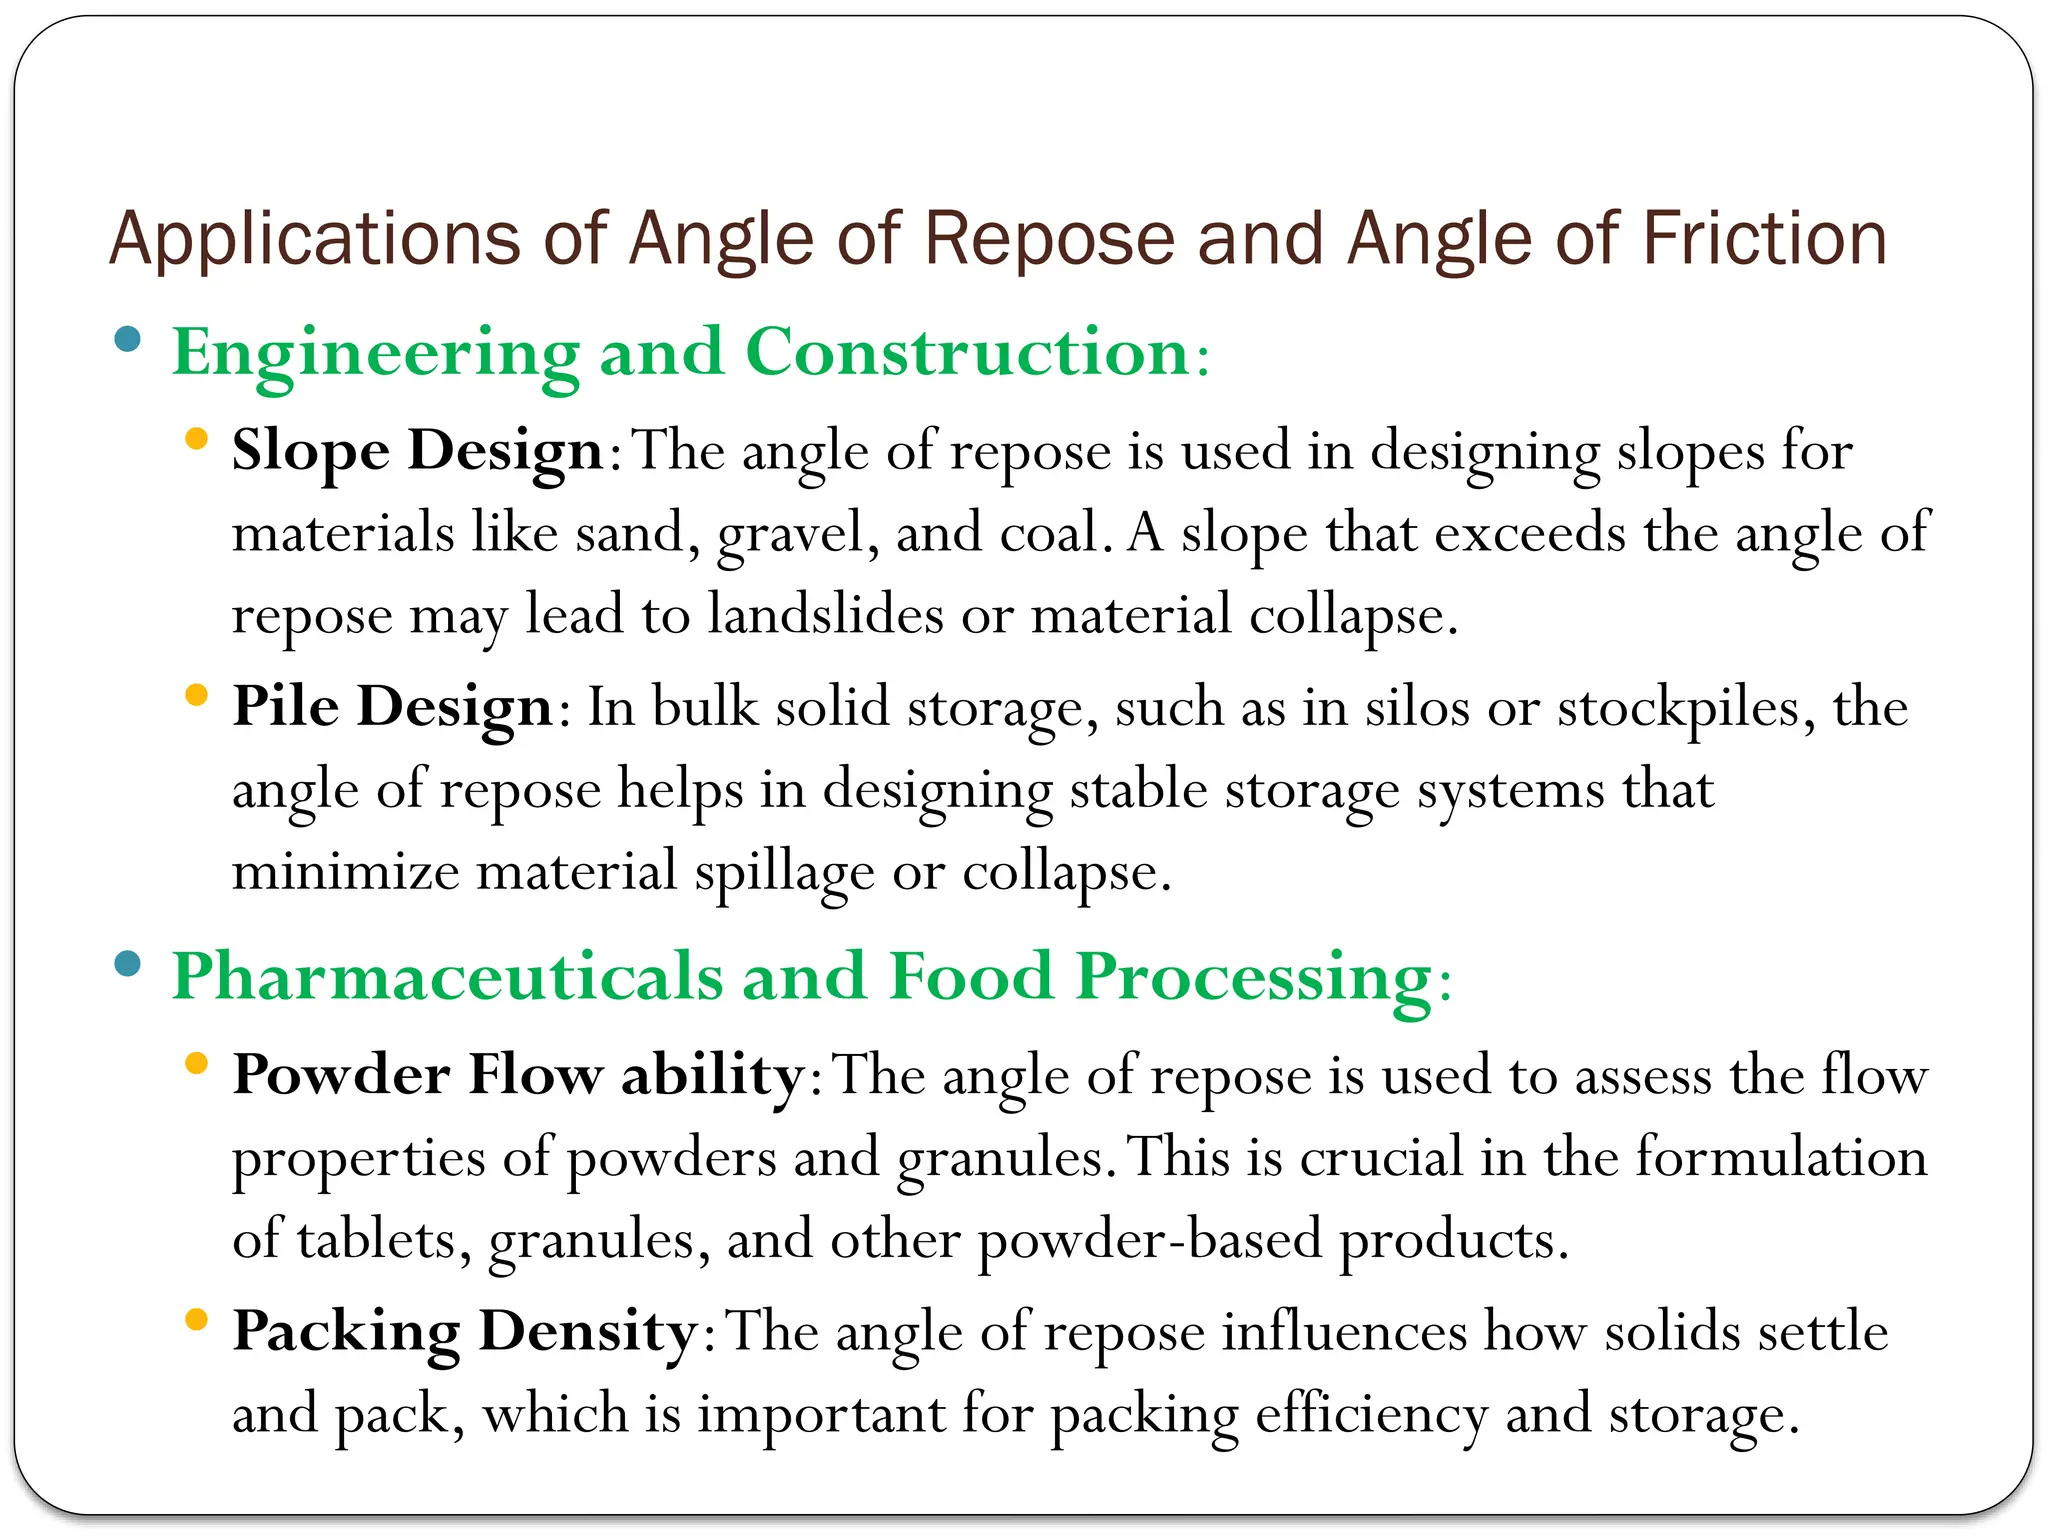
Applications of Angleof Repose and Angle of Friction
Engineering and Construction:
Slope Design:The angle of repose is used in designing slopes for
materials like sand, gravel, and coal.A slope that exceeds the angle of
repose may lead to landslides or material collapse.
Pile Design: In bulk solid storage, such as in silos or stockpiles, the
angle of repose helps in designing stable storage systems that
minimize material spillage or collapse.
Pharmaceuticals and Food Processing:
Powder Flow ability:The angle of repose is used to assess the flow
properties of powders and granules.This is crucial in the formulation
of tablets, granules, and other powder-based products.
Packing Density:The angle of repose influences how solids settle
and pack, which is important for packing efficiency and storage.
74.
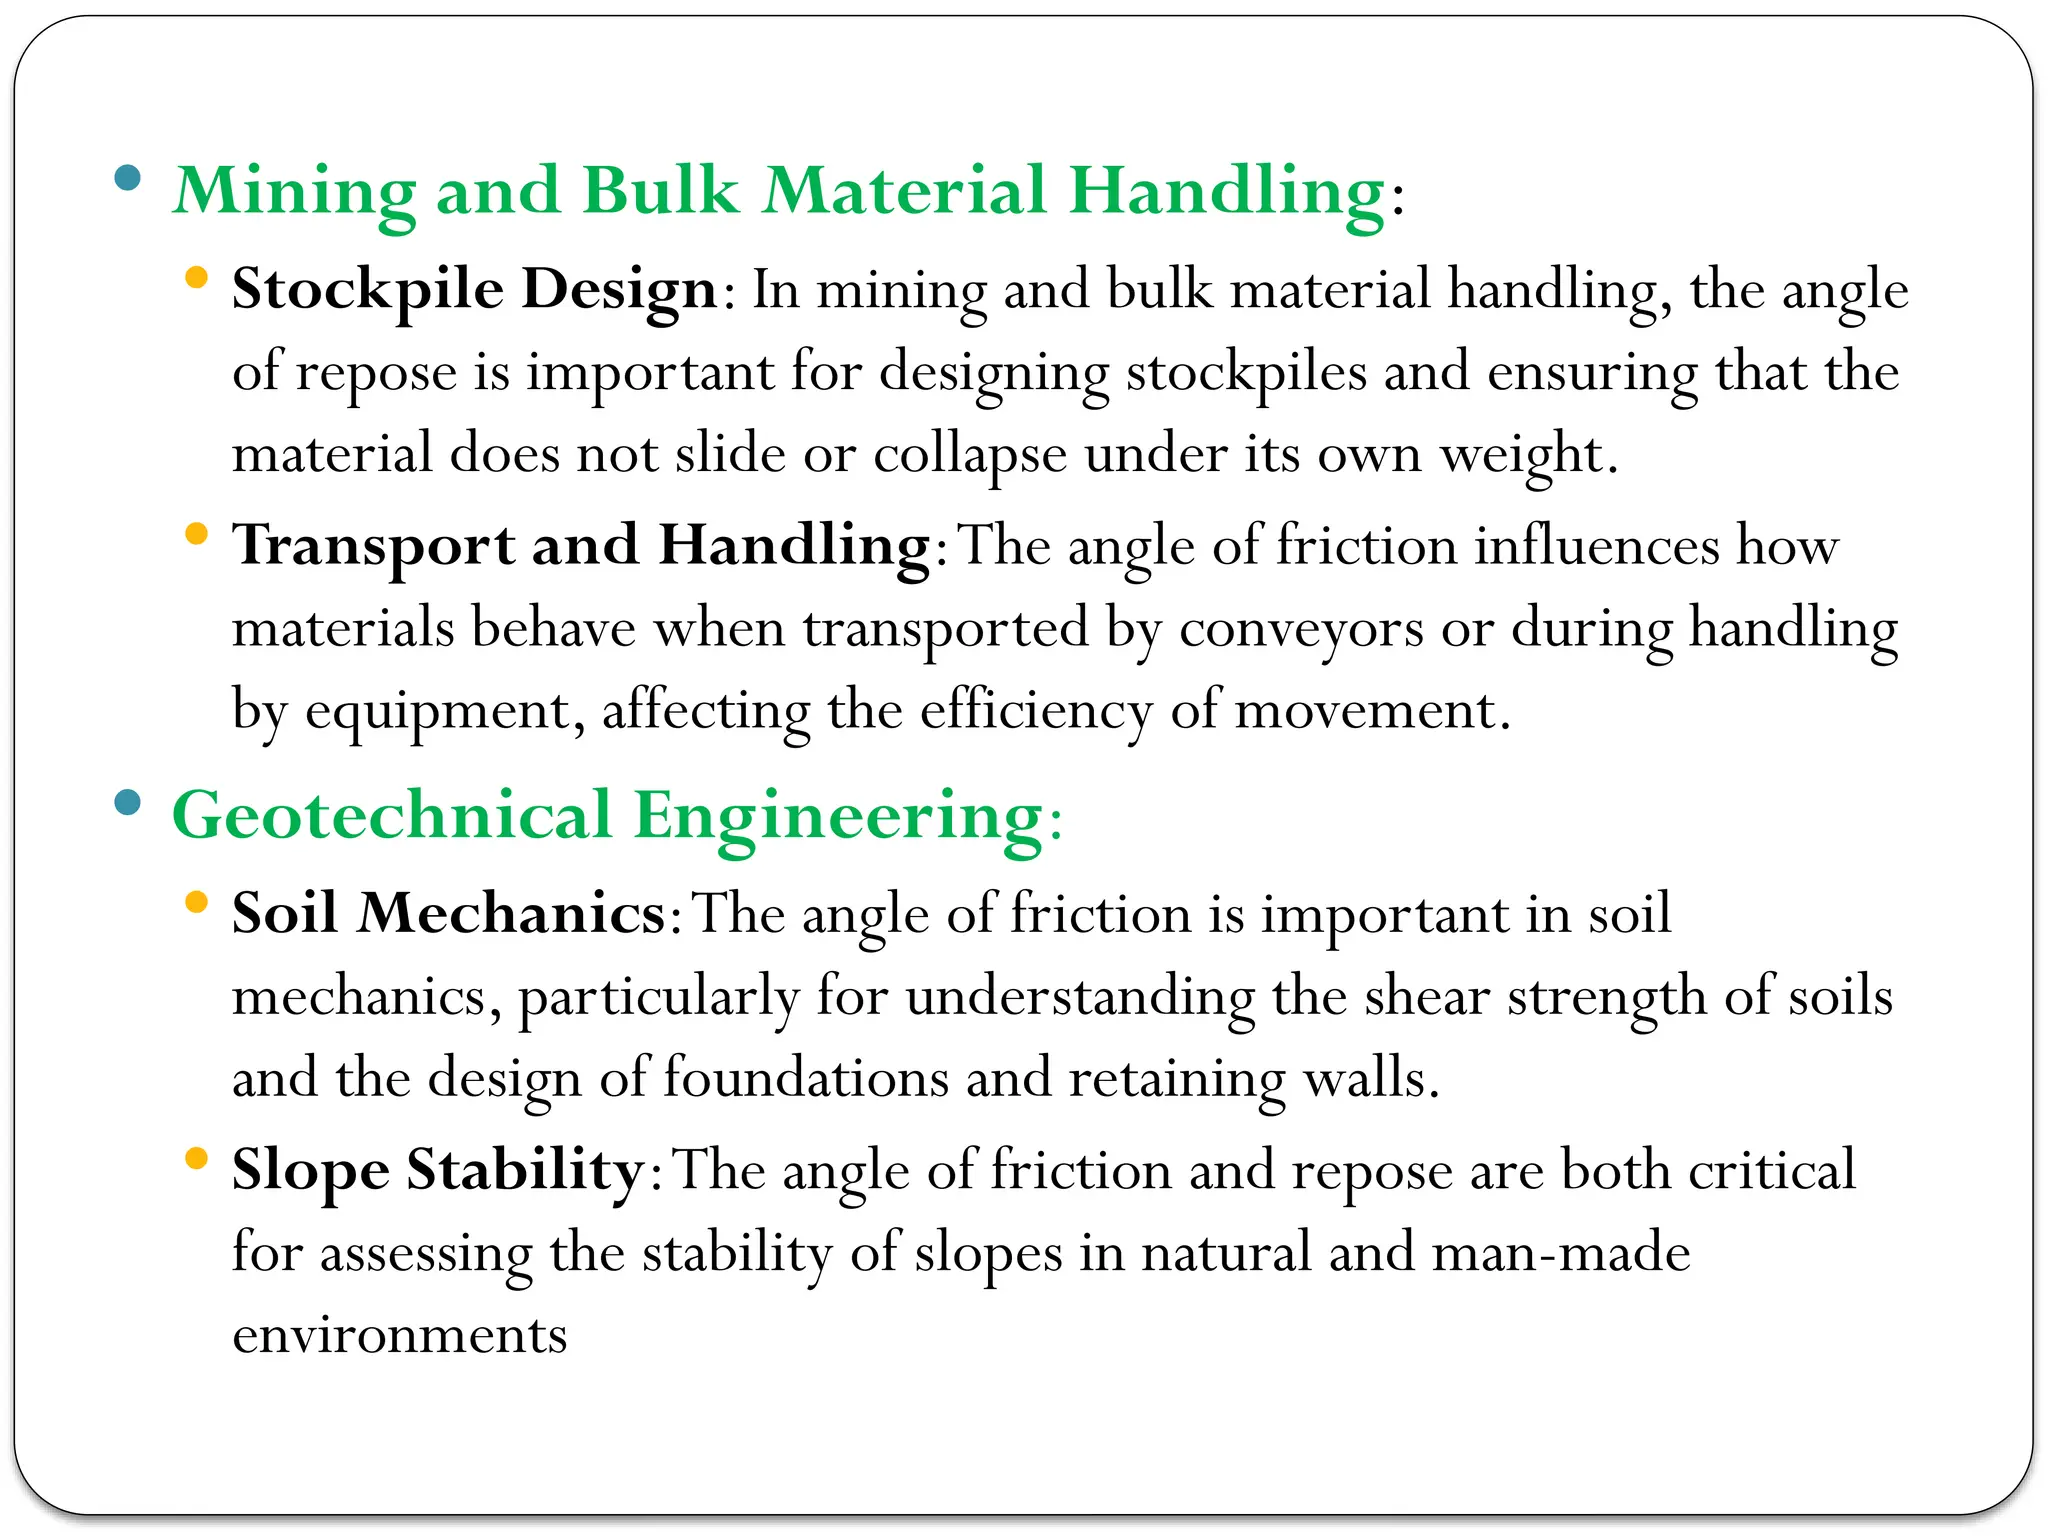
Mining andBulk Material Handling:
Stockpile Design: In mining and bulk material handling, the angle
of repose is important for designing stockpiles and ensuring that the
material does not slide or collapse under its own weight.
Transport and Handling:The angle of friction influences how
materials behave when transported by conveyors or during handling
by equipment, affecting the efficiency of movement.
Geotechnical Engineering:
Soil Mechanics:The angle of friction is important in soil
mechanics, particularly for understanding the shear strength of soils
and the design of foundations and retaining walls.
Slope Stability:The angle of friction and repose are both critical
for assessing the stability of slopes in natural and man-made
environments
75.
Conclusion
Both theangle of repose and the angle of friction provide
valuable insights into the behavior of granular materials, whether
in bulk storage, transportation, or when in contact with other
surfaces. Understanding these angles is critical in many industrial
applications, including material handling, construction, and
geotechnical engineering
76.
1.12 Introduction ToConveying Of Solid
Conveying of Solids refers to the process of transporting solid
materials from one location to another using various types of
mechanical or pneumatic systems.This is a key aspect in many
industries, such as mining, agriculture, food processing, chemicals,
pharmaceuticals, and construction, where the movement of bulk
solids like powders, grains, pellets, aggregates, and even heavy
materials like sand or cement is essential for manufacturing processes,
storage, and logistics.
Conveying systems are designed to move solids efficiently, safely, and
cost-effectively over varying distances, often in challenging conditions.
The choice of conveying method depends on factors like material
type, flowability, required throughput, distance, and environmental
conditions.
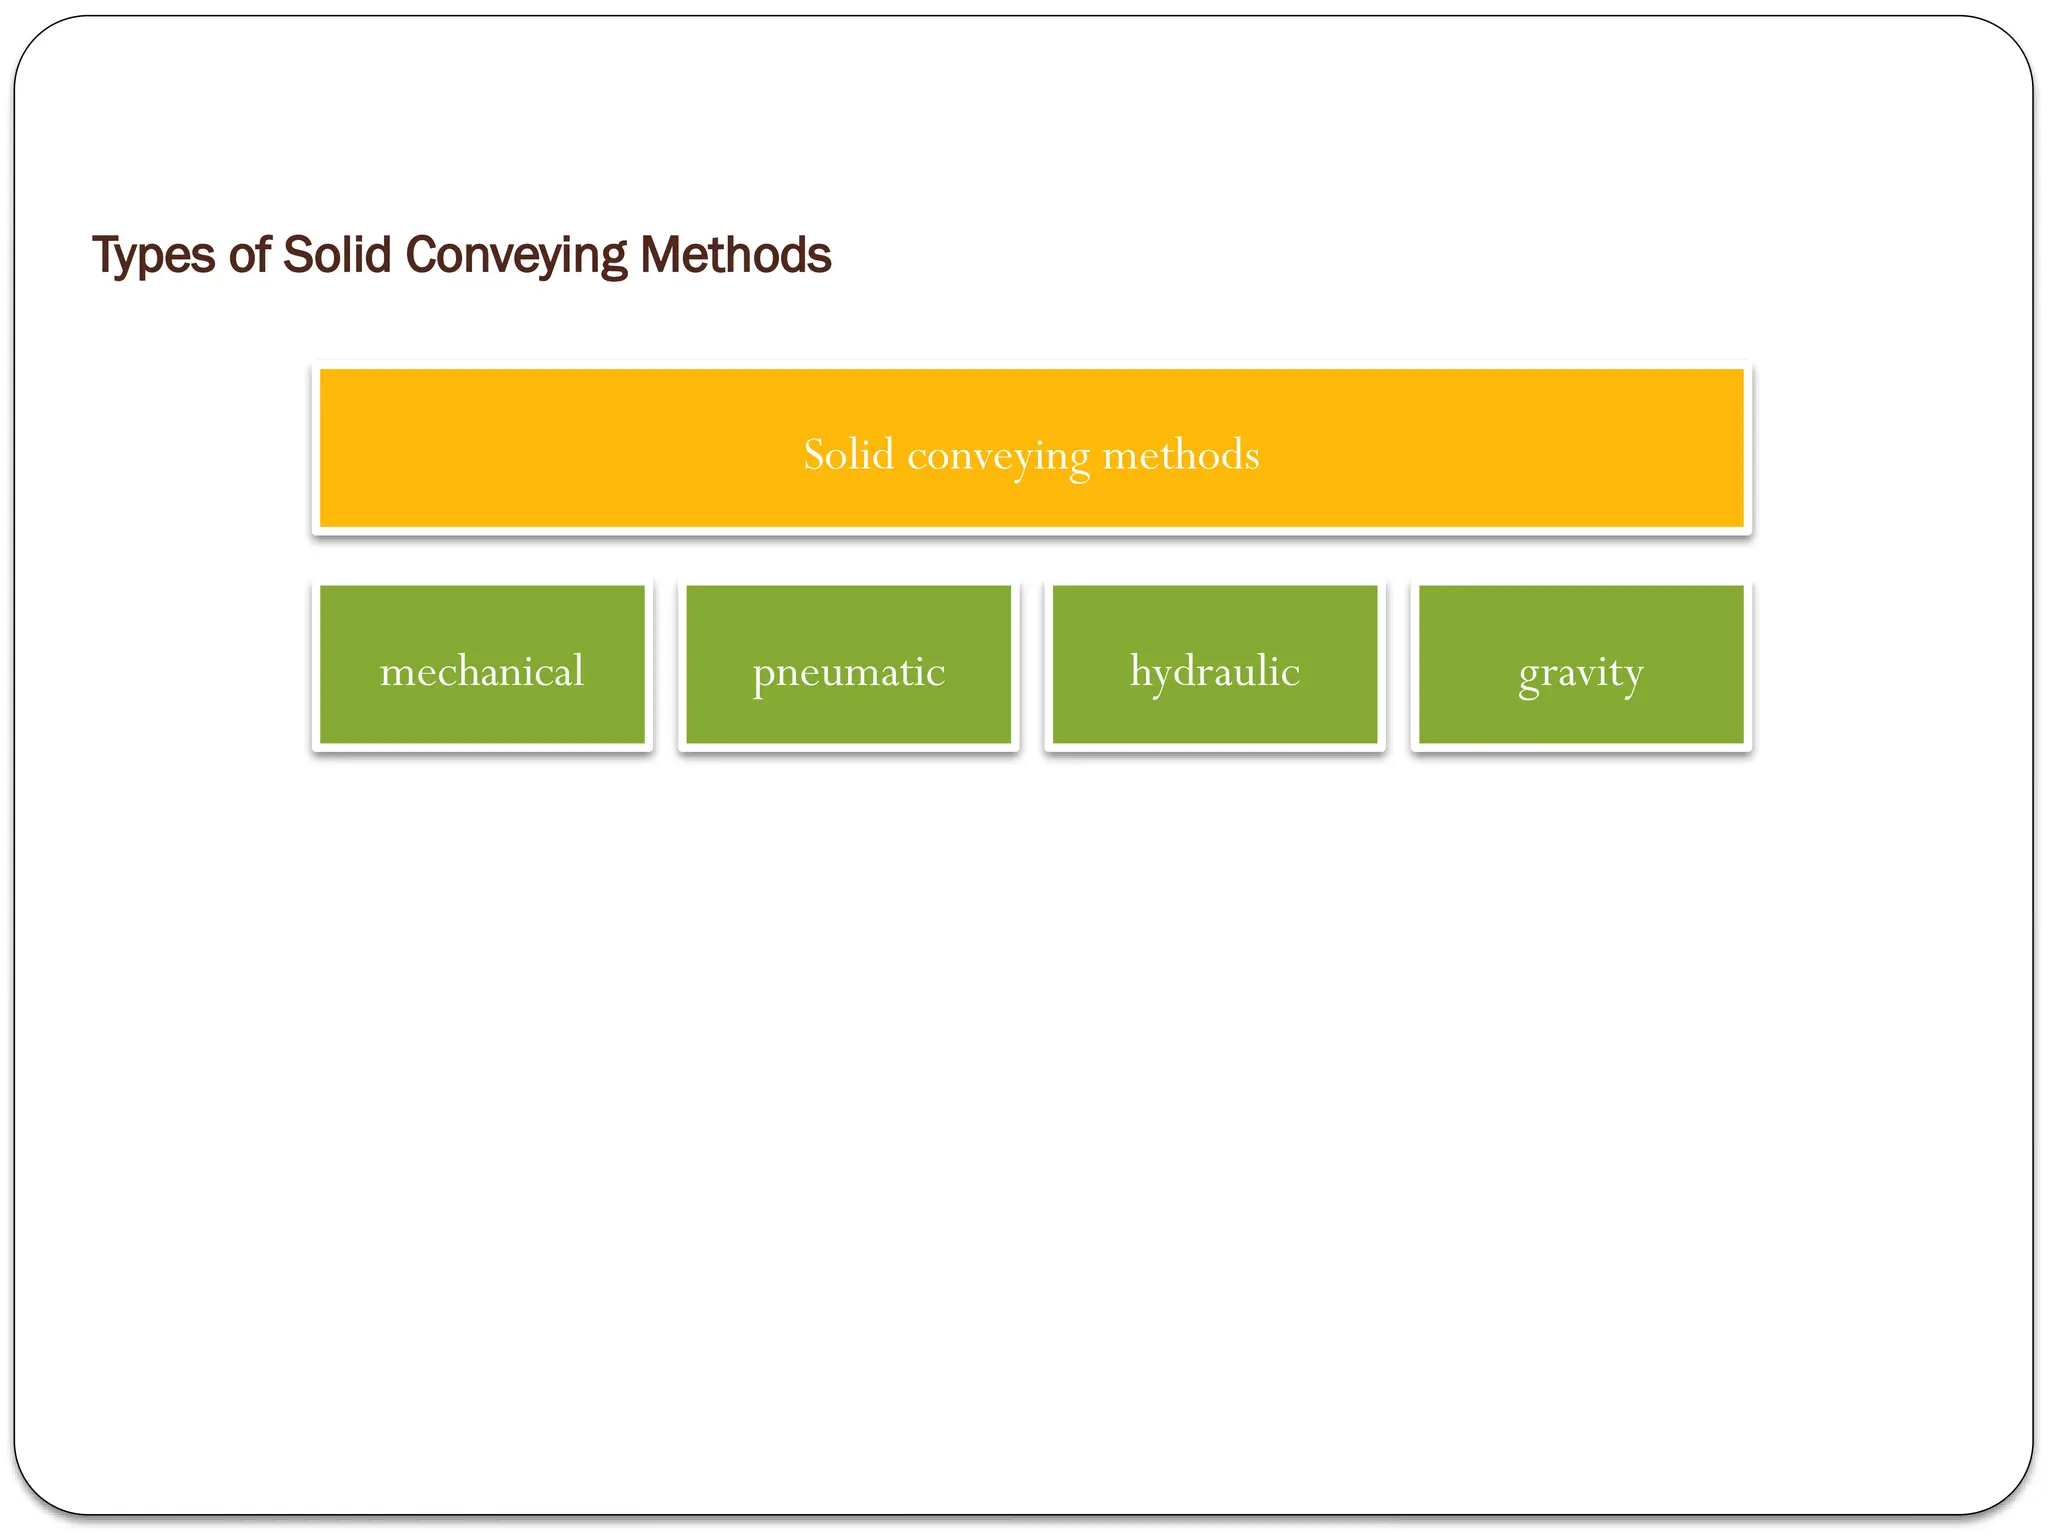
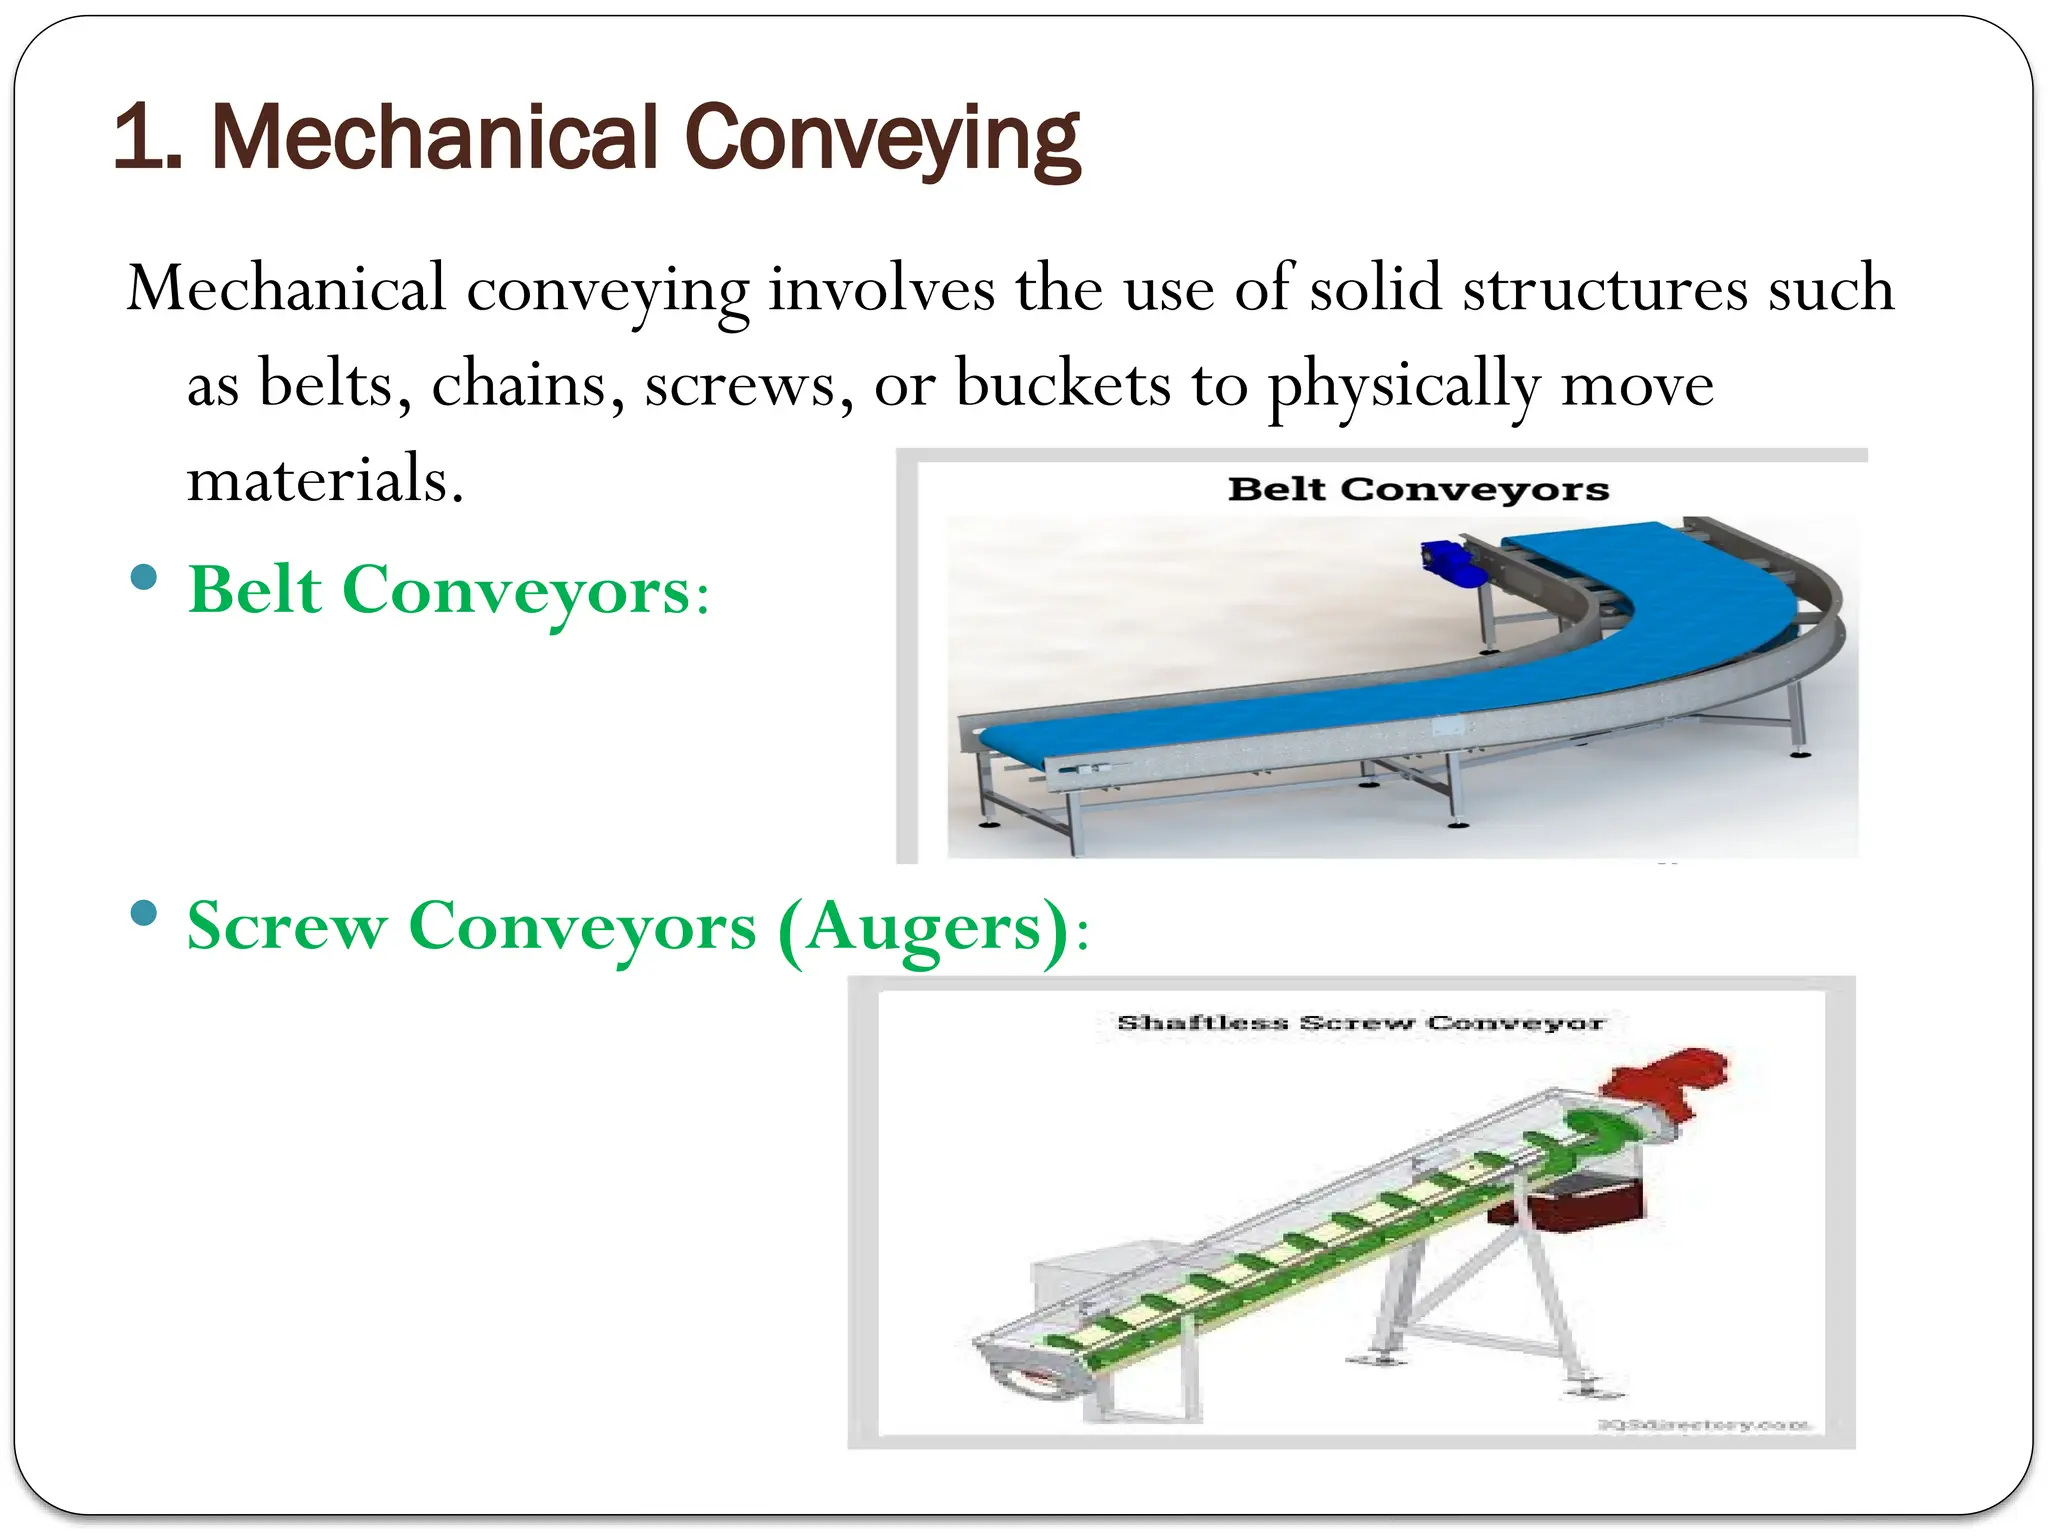
1. Mechanical Conveying
Mechanicalconveying involves the use of solid structures such
as belts, chains, screws, or buckets to physically move
materials.
Belt Conveyors:
Screw Conveyors (Augers):
2. Pneumatic Conveying
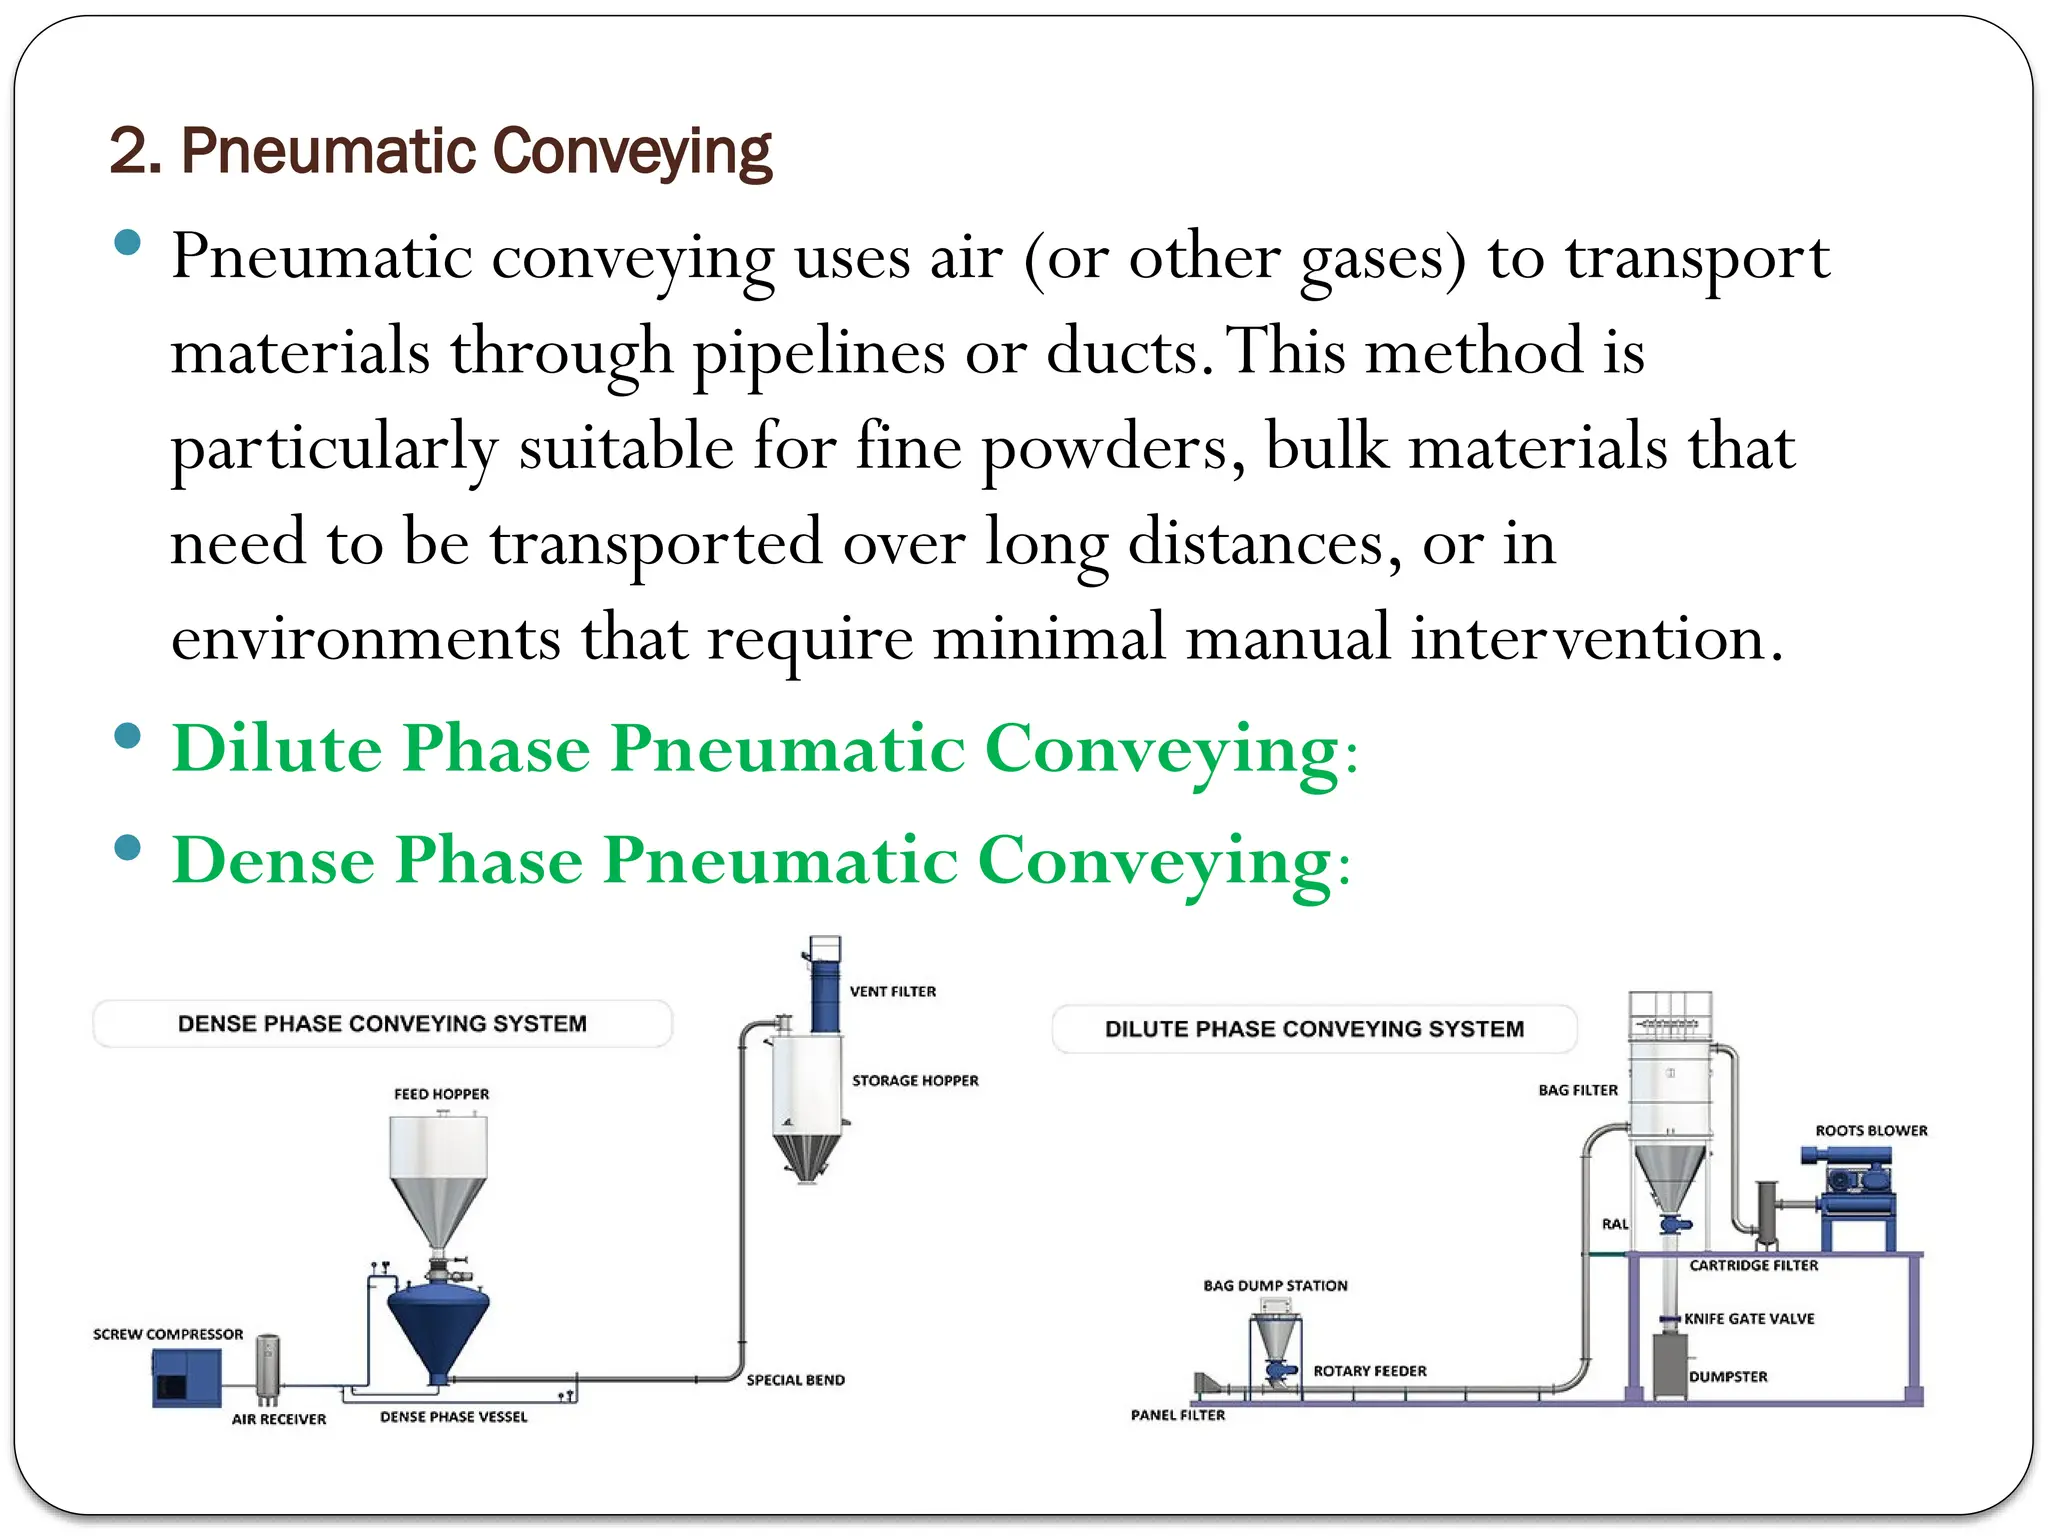
Pneumatic conveying uses air (or other gases) to transport
materials through pipelines or ducts.This method is
particularly suitable for fine powders, bulk materials that
need to be transported over long distances, or in
environments that require minimal manual intervention.
Dilute Phase Pneumatic Conveying:
Dense Phase Pneumatic Conveying:
81.
3. Hydraulic Conveying
Hydraulic conveying involves the use of water or another liquid
to transport solid materials in slurry form.This method is often
used in mining, wastewater treatment, and dredging industries.
82.
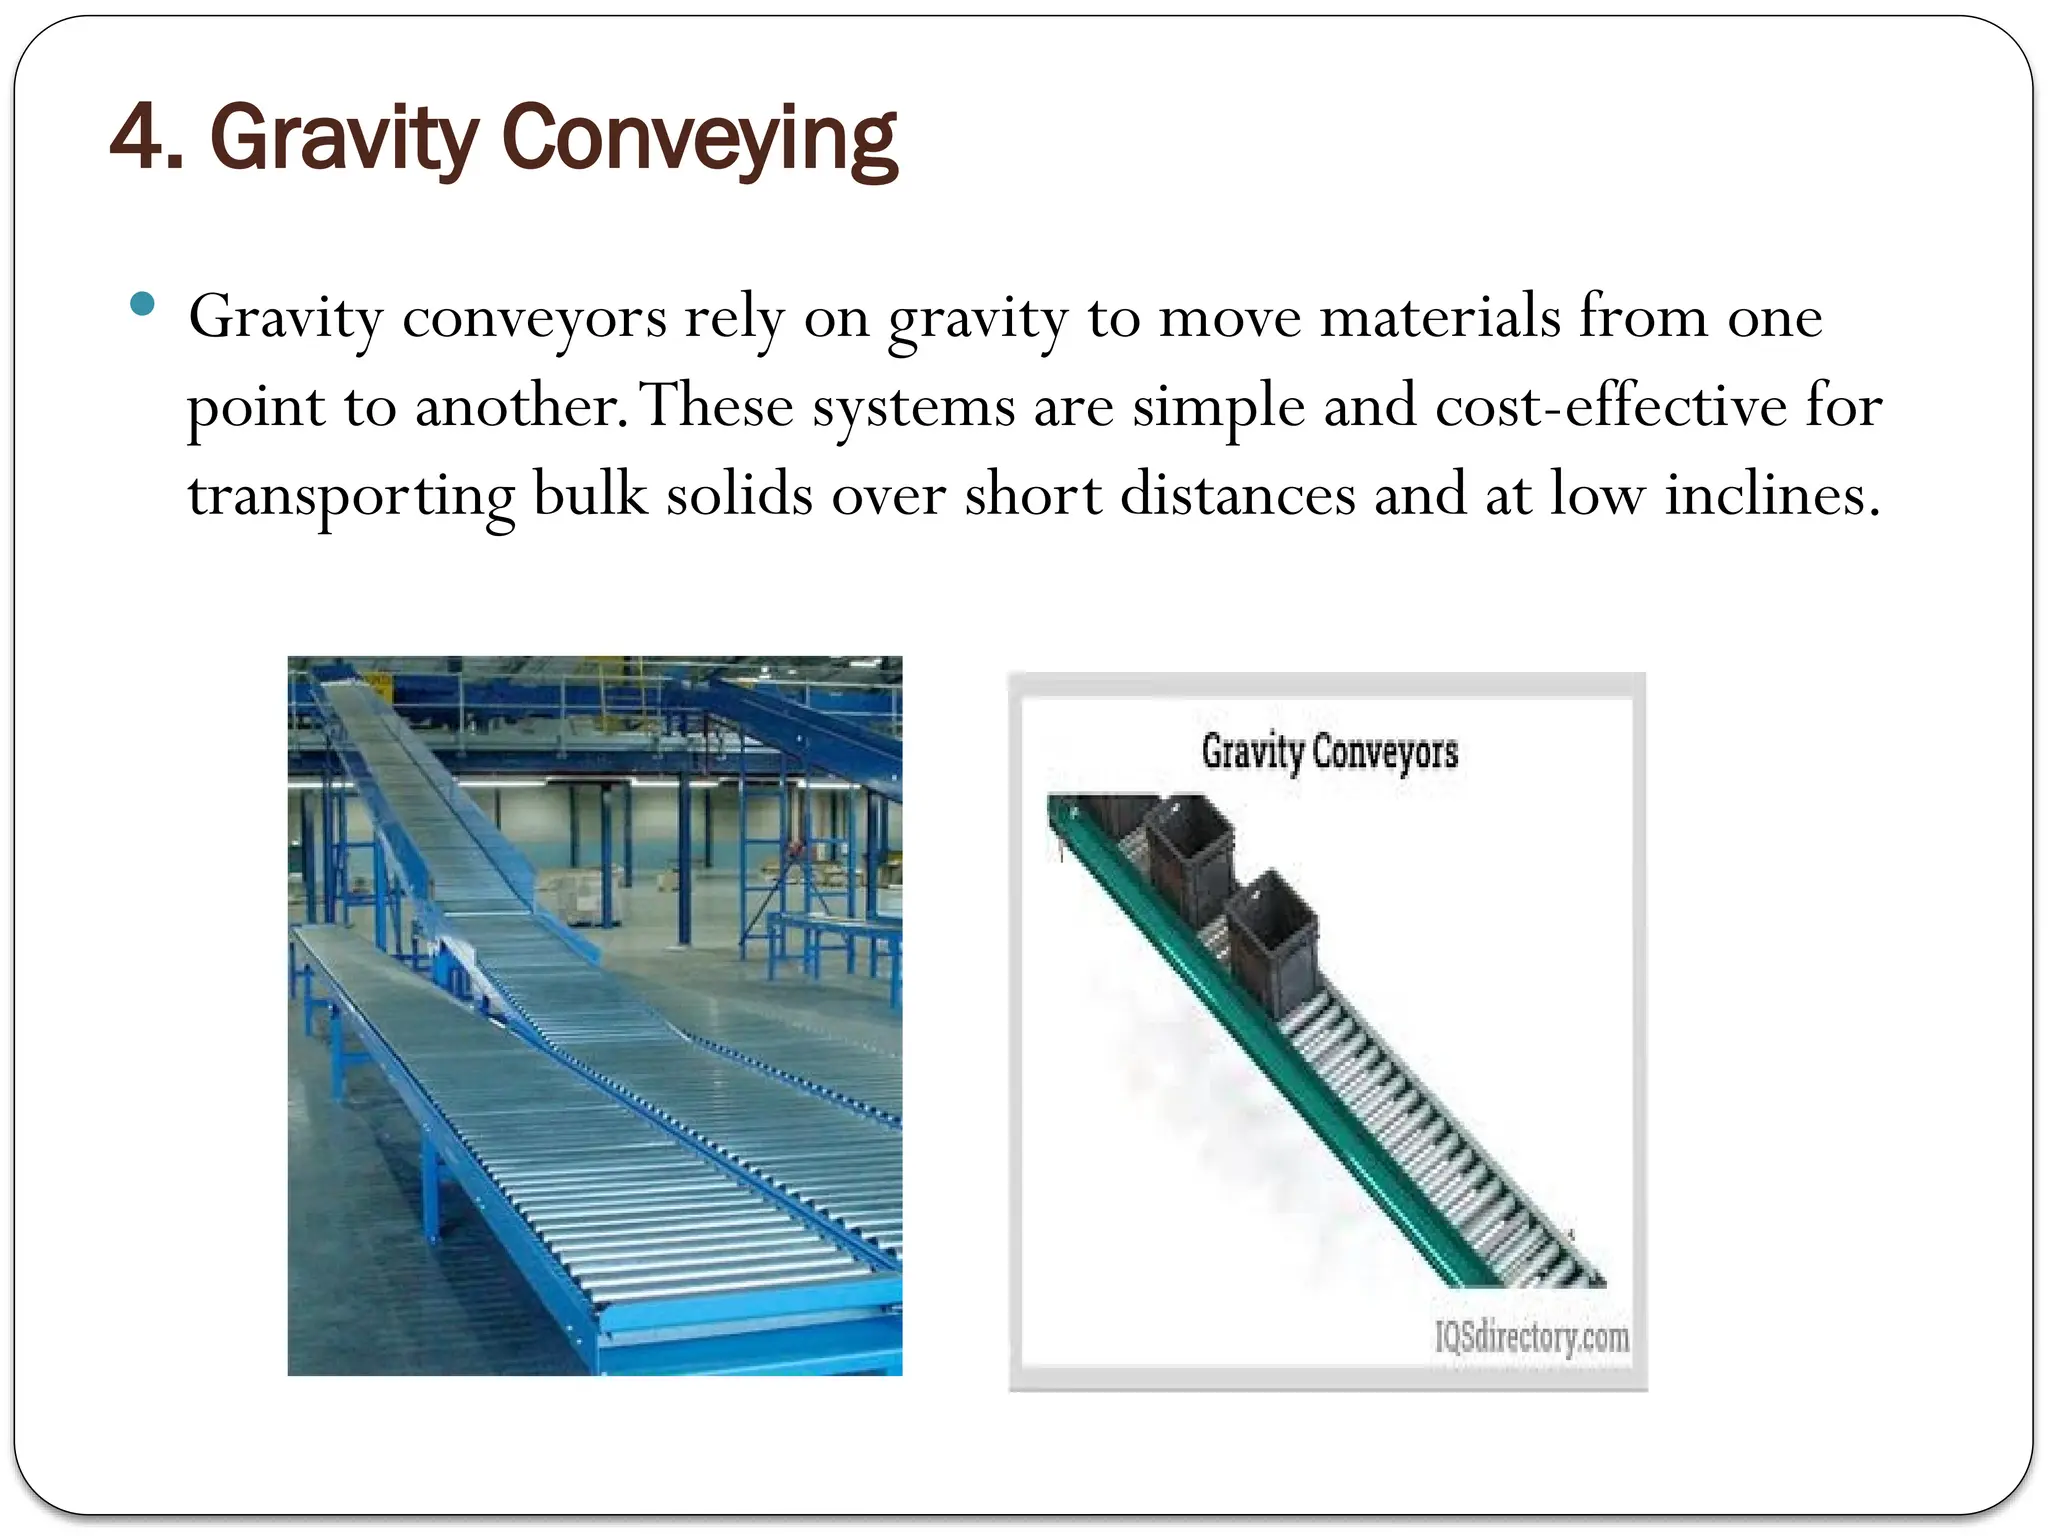
4. Gravity Conveying
Gravity conveyors rely on gravity to move materials from one
point to another.These systems are simple and cost-effective for
transporting bulk solids over short distances and at low inclines.
83.
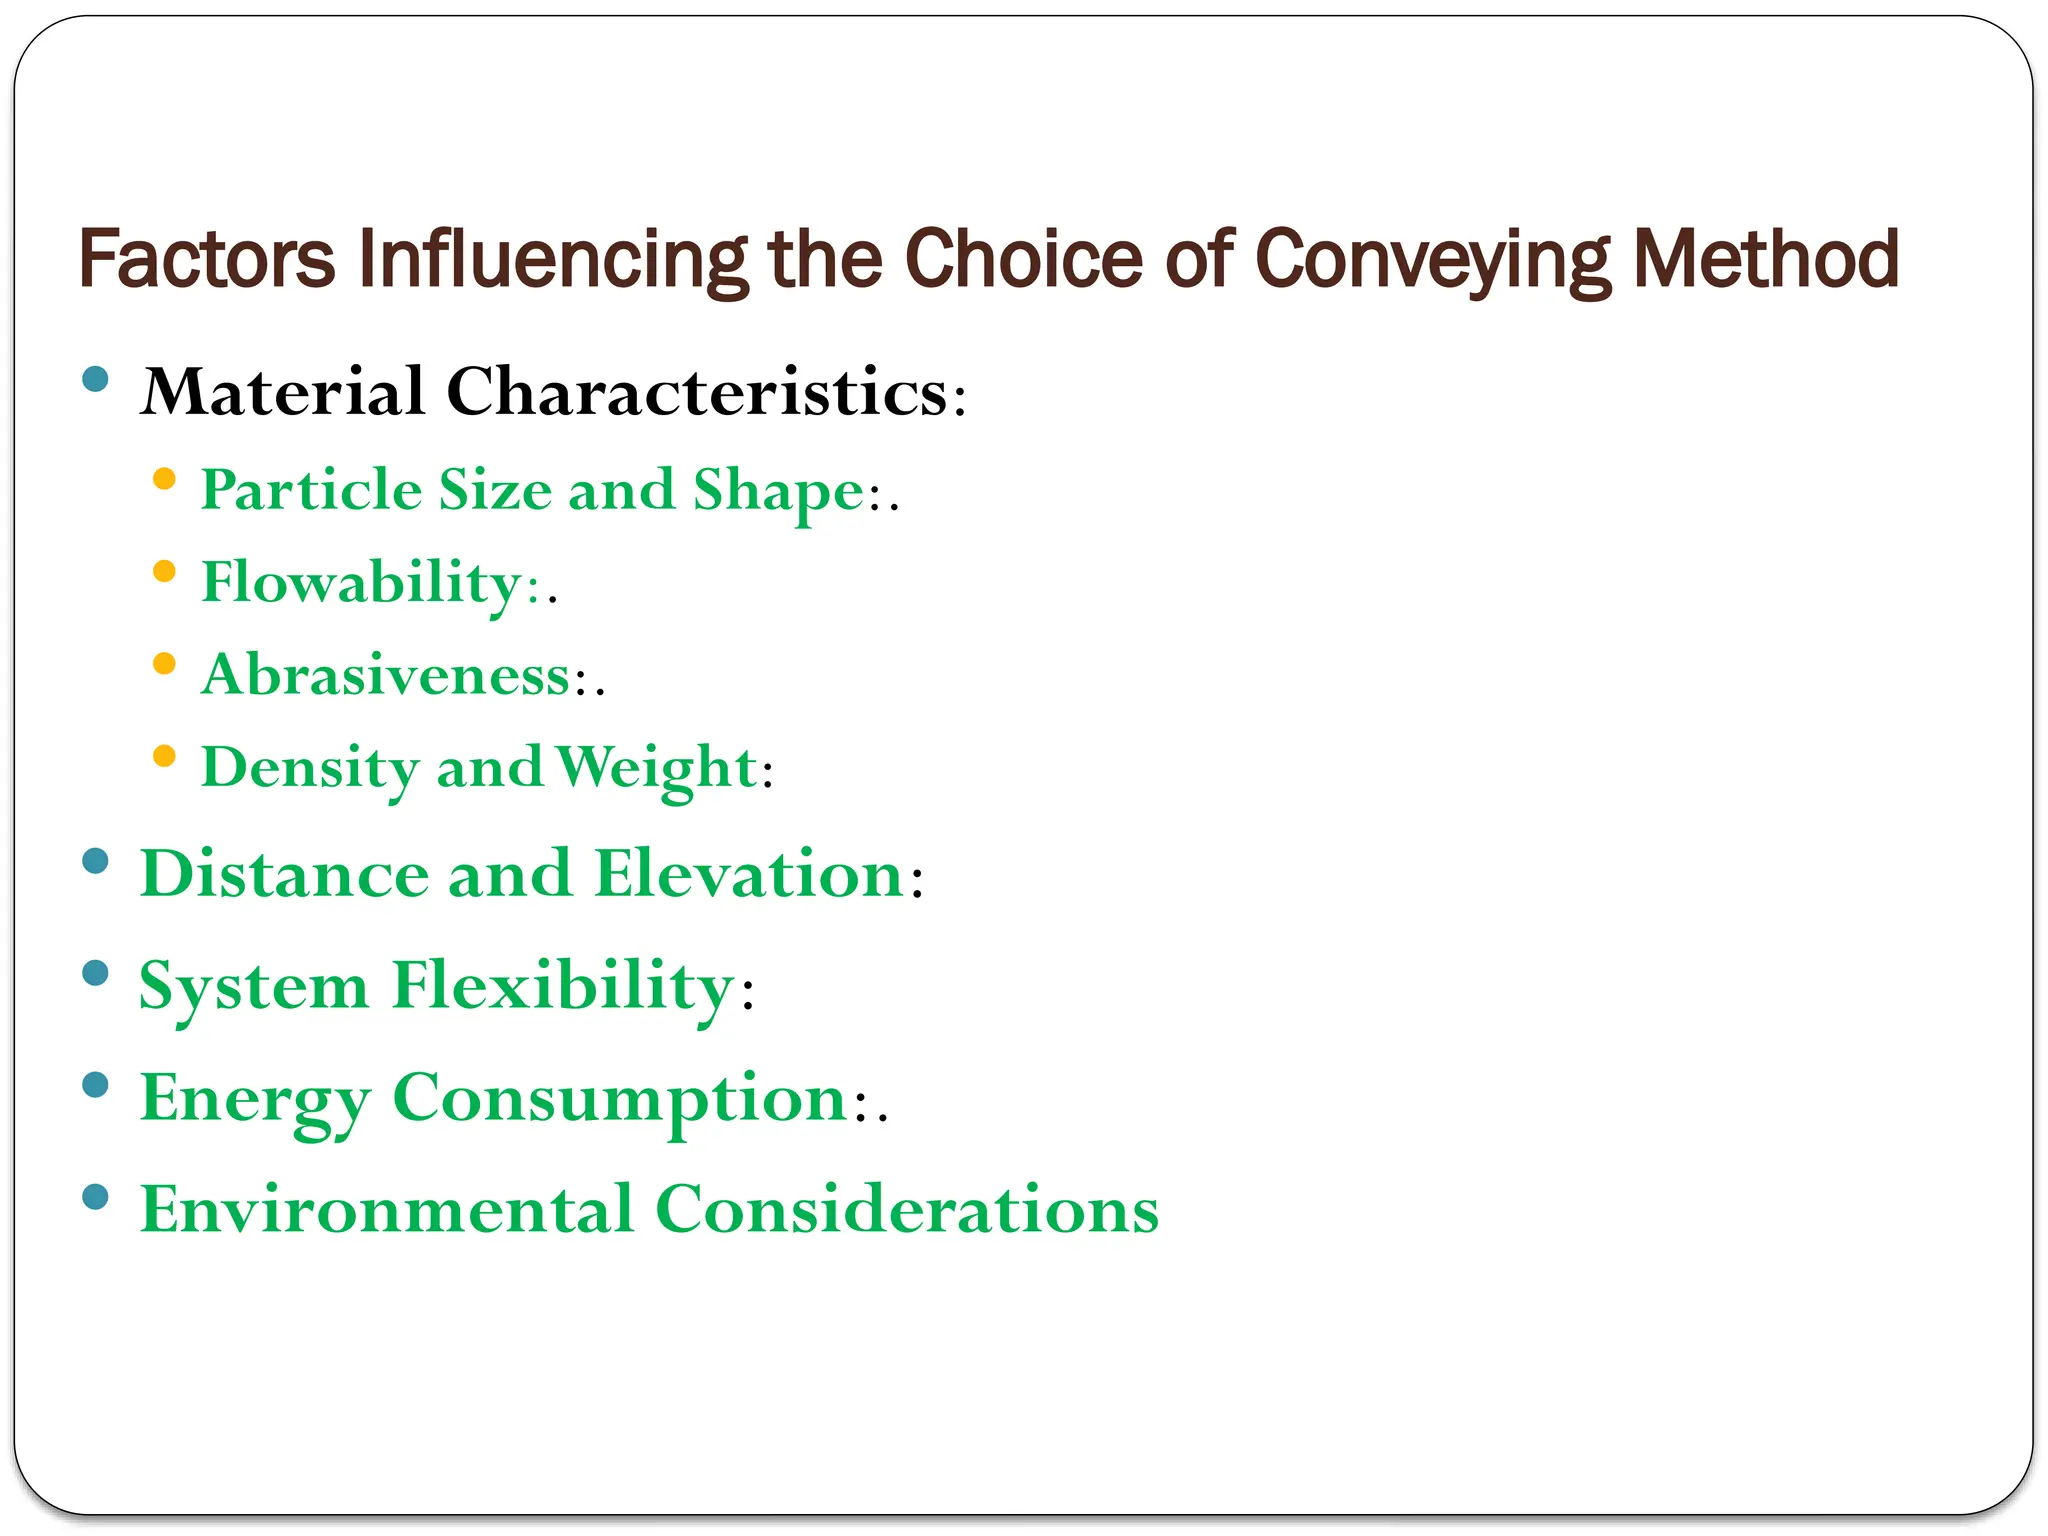
Factors Influencing theChoice of Conveying Method
Material Characteristics:
Particle Size and Shape:.
Flowability:.
Abrasiveness:.
Density andWeight:
Distance and Elevation:
System Flexibility:
Energy Consumption:.
Environmental Considerations
84.
Distance andElevation:
System Flexibility:
Energy Consumption:.
Environmental Considerations:
85.
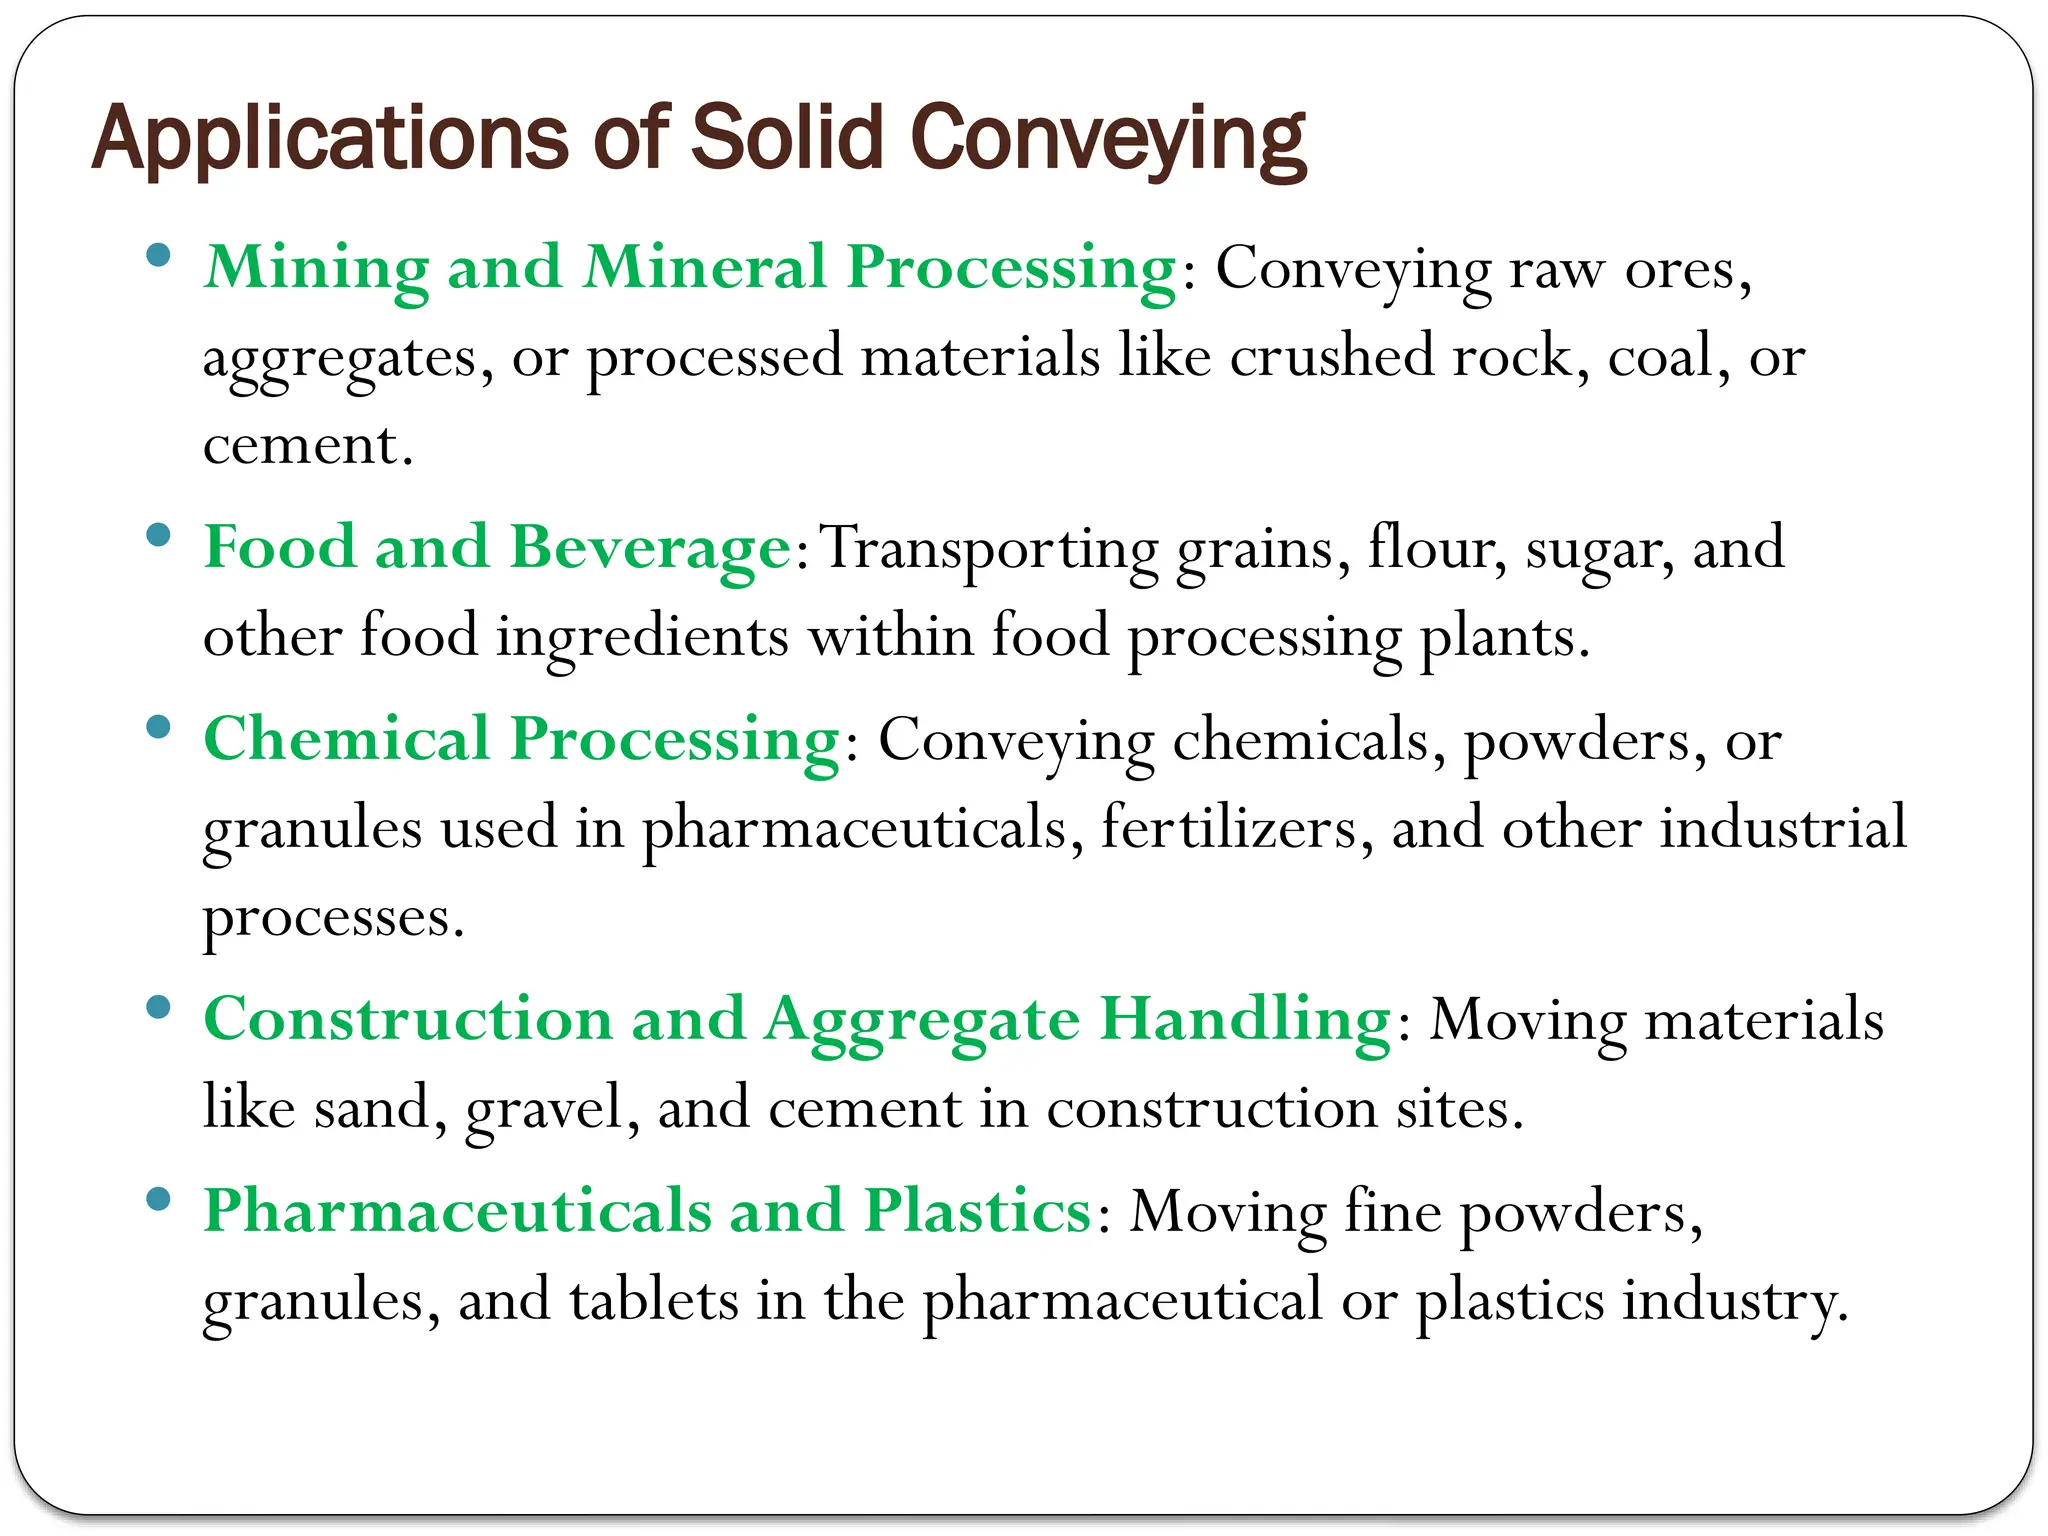
Applications of SolidConveying
Mining and Mineral Processing: Conveying raw ores,
aggregates, or processed materials like crushed rock, coal, or
cement.
Food and Beverage:Transporting grains, flour, sugar, and
other food ingredients within food processing plants.
Chemical Processing: Conveying chemicals, powders, or
granules used in pharmaceuticals, fertilizers, and other industrial
processes.
Construction and Aggregate Handling: Moving materials
like sand, gravel, and cement in construction sites.
Pharmaceuticals and Plastics: Moving fine powders,
granules, and tablets in the pharmaceutical or plastics industry.
86.
Conclusion
The conveyingof solids is an integral part of material handling in
many industries.The appropriate choice of conveying system
depends on material characteristics, system requirements
(distance, speed, capacity), environmental conditions, and cost
considerations.Whether using mechanical conveyors, pneumatic
systems, or hydraulic conveying, understanding the properties of
the material and the specific application is crucial for designing
an efficient and cost-effective material transport system