
Recommended
More Related Content
Similar to 189084.full
Similar to 189084.full (20)
Recently uploaded
Recently uploaded (20)
189084.full
- 1. On information metrics for spatial coding Bryan C. Souza1*,§ , Rodrigo Pavão1,2,§ , Hindiael Belchior3 , Adriano B.L. Tort1 ¹ Brain Institute, Federal University of Rio Grande do Norte, RN, Brazil ² Department of Neuroscience, Albert Einstein College of Medicine, NY, USA ³ Faculty of Health Sciences of Trairi, Federal University of Rio Grande do Norte, RN, Brazil § Equal contribution. * Correspondence to: bryancsouza@neuro.ufrn.br (BCS) Abstract The hippocampal formation is involved in navigation, and its neuronal activity exhibits a variety of spatial correlates (e.g., place cells, grid cells). The quantification of the information encoded by spikes has been standard procedure to identify which cells have spatial correlates. For place cells, most of the established metrics derive from Shannon’s mutual information (Shannon, 1948), and convey information in bits/sec or bits/spike (Skaggs et al., 1993; Skaggs et al., 1996). Despite their widespread use, the performance of these metrics in relation to the original mutual information metric has never been investigated. In this work, using simulated and real data, we find that the current spatial information metrics correlate less with the true information content in the data than the original mutual information metric. We propose corrections that yield more accurate and comparable spatial information estimates. Keywords Place cell; place field; spatial coding; information; entropy; spike train analysis; hippocampus. Introduction The hippocampus is known to be involved in memory formation (Eichenbaum, 2000; Scoville and Milner, 1957) and spatial navigation (Morris et al., 1982; O’Keefe and Dostrovsky, 1971; O’Keefe and Recce, 1993; Zola-Morgan andSquire,1990).Intheearly70s,O’KeefeandDostrovsky discovered that some hippocampal cells have firing rate modulated by the animal’s position, discharging more at a spatial region known as the place field of the cell (O’Keefe and Dostrovsky, 1971). These place cells were later found to relate to the theta rhythm, a prominent hippocampal oscillation present during locomotion and REM sleep (Vanderwolf, 1969). Namely, their spike times couple to theta, and their preferred phase progressively advances from the theta peak as the animal traverses the place field, a phenomenon called phase precession (Huxter et al., 2003; O’Keefe and Recce, 1993; Souza and Tort, 2017). Since the discovery of place cells, other types of spatial correlates emerged in related areas to the hippocampal circuitry, such as the head-direction cells in the postsubiculum (Taube et al., 1990), and the grid cells and speed cells in the entorhinal cortex (Fyhn et al., 2004; Hafting et al., 2005; Kropff et al., 2015; Moser et al., 2008). Properly identifying these cells requires estimates of the information contained in spikes about navigational features (i.e. position, speed, head angle). The main metrics used to estimate this type of information were proposed by Skaggs et al. (1993, 1996) and are adaptations of Shannon’s mutual information (MI). Information entropy, as originally proposed by Shannon, measures the amount of uncertainty in the outcome of a variable based on its probability of occurrence (Shannon, 1948). In other words, the more unpredictable the outcome is, the more entropy it has. On the other hand, the MI is a measure of the shared entropy between two variables; it indicates how much knowing a variable X reduces the uncertainty of a variable Y. While the MI is usually measured in bits, the two alternative metrics proposed by Skaggs et al. normalize information in such a way as to express it as bits per spike (Ispike ) or bits per second (Isec ). Although these metrics provide a meaningful interpretation of the relation between firing rate and navigational features, which led to their widespread use, the possible caveats introduced by these modifications were never investigated. In this work, we use simulated data to address how well the metrics Ispike , Isec and MI reflect the capacity of decoding the animal’s position based on the spikes of an individual neuron, which directly relates to the amount of spatial information conveyed by the cell (Quian Quiroga and Panzeri, 2009). We find that while MI values correlate well with decoding performance under a variety of scenarios, this is not always the case for Ispike and Isec . Similar results hold when analyzing real spikes from place cells of rats recorded on a linear track. Finally, we propose a correction based on surrogate analysis that can equalize the three metrics. Methods Simulating spatially modulated cells We simulated the firing rate of spatially modulated neurons across 30 trials on a linear track divided into 25 bins of space (Figure 1A). For simplicity, the animal speed and occupancy were considered constant over space. We modeledeighttypesofcells;foreachcelltype,wesimulated 10 levels of spatial modulation (Figure 1B, Neuron ID a to j). For the first 5 cell types (Neuronal type I to V), the firing rate of each trial was modeled as a Gaussian centered (on average) at bin 13 with (average) standard deviation of 5 bins. To introduce inter-trial variability, 0.5 and 0.1 white noise was added to the center and standard deviation of the Gaussian, respectively. The cell types mimicked the behavior of (I) a pyramidal-like place cell (low basal firing rate); (II) an interneuron-like place cell (high basal firing rate);(III)interneuron-likeplacecellnegativelymodulated by space; (IV) a pyramidal-like place cell exhibiting spatial modulation in a subset of trials; and (V) a cell as in IV, but with constant mean firing rate across trials. For cell types I-III, we varied spatial modulation strength (deviation from baseline), while for cell types IV and V the number .CC-BY-NC-ND 4.0 International licenseIt is made available under a (which was not peer-reviewed) is the author/funder, who has granted bioRxiv a license to display the preprint in perpetuity. The copyright holder for this preprint.http://dx.doi.org/10.1101/189084doi:bioRxiv preprint first posted online Sep. 15, 2017;
- 2. of modulated trials varied. Cell type VI was similar to cell type I but could have multiple, equally-spaced peaks as a grid cell. We also simulated cells behaving as ramp (VII) or constant functions (VIII) along space, with different slopes and firing rate levels, respectively. Estimating spatial information in the firing rate To estimate the spatial information contained in the firing rate of each cell we used Ispike and Isec – the standard approaches used for selecting place cells (Skaggs et al., 1996, 1993) – and the MI (Shannon, 1948). We computed the Isec metric from the average firing rate (over trials) in the 25 space bins using the following definition: where λi is the mean firing rate in the i-th space bin and pi the occupancy ratio of the bin, while λ is the overall mean firing rate of the cell. The Ispike metric is a normalization of Isec , defined as: This normalization yields values in bits per spike, while Isec is in bits per second. The MI was estimated using all firing rate values, which were binned into four non-overlapping quantiles: where pi and pj are the probabilities of position bin i and firing rate bin j, respectively. pij is the joint probability between position bin i and firing rate bin j. Estimating spatial information from decoding performance Decoding algorithms predict the most likely stimulus that generated a given response based on the previous observations of stimulus-response pairs (Quian Quiroga and Panzeri, 2009). We used a naïve Bayes classifier to predict the position of the animal based on the firing rate of a cell. For each cell, the firing rate values (trials x space bins) were used to train and test the decoder in a leave-one- out approach (Figure 2). We then computed the confusion matrix for the actual and decoded positions, and extracted the percentage of correct decoding. The percentage of correct decoding of the classifier was assumed to correlate with the true spatial information content of the cell, and was compared to the outcome of each of the three metrics of spatial information defined above (Figure 3). Normalizing spatial information metrics using surrogates To correct the estimates of spatial information, we first shuffled the position of firing rates on each trial (Figure 4A). This approach avoids any firing preference across trials and in the mean rate. We then computed the Ispike , Isec and MI metrics using the shuffled rates. This procedure was repeated 100 times and used to build a surrogate distribution for each metric. The information values were then corrected by expressing them as z-scores of the surrogate distribution. The corrected information metrics are referred to as normalized Ispike (Norm. Ispike ), Isec (Norm. Isec ) and MI (Norm. MI). Measuring the spatial information of real place cells To investigate the relation between the spatial information estimates and decoding performance for real neurons, we used a dataset with recordings from the CA1 region of the dorsal hippocampus of three rats running back and forth on a linear track (Mizuseki et al., 2013; 0 20 space bin trial# Neuronaltype Neuron ID Mean firing rate (Hz) 1 25 1 30 Firing rate (Hz) A B 0 20 Rightward run space trial# 0 41 Firingrate(Hz) 0 41 0 27 0 27 0 27 0 27 0 27 0 41 I a b c d e f g h i j II III IV V VI VII VIII Figure 1. Simulating the activity of spatially modulated neurons. A. Neuronal firing rate was simulated in 25 bins of space over 30 trials, meant to represent spiking activity of one cell during rightward runs on a linear track. In the rate-position map, pseudo-colors represent firing rate on each trial, while the white line is the mean firing rate over trials. B. Rows display 8 simulated neuronal types (I-VIII) of different spatial modulation profiles. Cell types I-V exhibit place-cell-like behavior, while types VI, VII and VIII represent grid cells, ramp and constant func- tions, respectively (see Methods for details). For each type, columns show the rate-position maps (pseudo-color scale) as well as the mean firing rate (overlaying white trace) for 10 distinct cells (a-j) differing in the level of spatial modulation. Isec = 25 i=1 piλilog2 λi λ Ispike = Isec λ MI = 25 i=1 4 j=1 pi,jlog2 pi,j pi · pj .CC-BY-NC-ND 4.0 International licenseIt is made available under a (which was not peer-reviewed) is the author/funder, who has granted bioRxiv a license to display the preprint in perpetuity. The copyright holder for this preprint.http://dx.doi.org/10.1101/189084doi:bioRxiv preprint first posted online Sep. 15, 2017;
- 3. Figure 2. Estimating spatial information using a Bayesian clas- sifier. A. All the (training) bins of the rate-position map except one were used to train a naïve Bayes classifier. The classifier was then used to decode the position of the remaining (test) bin using only its firing rate. Each bin was used once as a test bin (leave-one-out approach). B. We used all the decoded posi- tions to compute the confusion matrix, which relates decoded Figure 3. Assessing the performance of spatial information metrics. A. Examples of cell types I, II and V during three modulation conditions. Circles on top indicate the strength of spatial modulation, from black (low) to white (high). B. Isec , Ispike and MI values of the cell types in A plotted against the percentage of correct deco- ding of the animal position (see Methods). Note that the same level of decoding across different cell types can elicit distinct Isec and Ispike values (i.e. compare rows), and that similar values of Isec or Ispike within a same cell type may be associated to different decoding levels (i.e., cell type V). C. Percentage of correct decoding for all simulated cells vs. Isec , Ispike and MI along with the linear fit (red line). The MI best fits the percentage of cor- rect decoding. Correct decoding (%) 1 2 2 5 10 0 1 5 10 0 1.1 1.1 1 5 10 0 2.8 2.8 1 5 10 0 2 2 1 2 5 10 1 2 5 101 5 102 1 2 5 10 0 1.5 MIIsec Ispike 1 2 5 10 0 1.5 A C B ... ... ... ... II ... ... V I II I V MI 3.2 10 31.6 100 0 0.5 1 1.5 2 2.5 r2 = 0.95 Correct decoding (%) Isec 3.2 10 31.6 100 0 2 4 6 8 10 r2 = 0.05 Correct decoding (%) Ispike 3.2 10 31.6 100 0 0.5 1 1.5 r2 = 0.0001 Correct decoding (%) space trial# bits/sec bits/sec bits/sec bits/spikebits/spike bits/spike bits bits bits bits/sec bits/spike bits 0 3 0 15 0 5 data freely available at https://crcns.org/). We calculated the spatial information estimates and the decoding performance for all neurons in 75 recording sessions. Results We first computed the three spatial metrics for each of the 8 simulated cell types shown in Figure 1. These cell types vary in how their firing rate is modulated by space (see Methods). For instance, while cell type I fires at its place field location on every trial, cell type IV emits spatially modulated spikes only in a subset of trials. For test bin 210 test bin N ... Training bins Leave-one-out firing rate bin Test bin actual position trial# Confusion matrixA B 1 25 actual position decodedposition 1 25 1 25 Naïve Bayes classifier firing rate bin #210 decoded position 1 25 + Σdiag = % of correct decoding Σdiag Σall firing rate + position from training bins 1 30 } and actual positions. We divided the amount of times the classifier was correct (sum of the matrix diagonal) by the total number of classifications to calculate the decoding performance. each cell type, we varied the amount of spatial modulation in 10 levels. This was achieved by either changing the deviation of the firing rate from the basal level (cell types I-III), or the percentage of trials with modulated activity (cell types IV and V), number of place fields (cell type VI), spatial slope (cell type VII) or basal firing rate level (cell type VIII). The spatial metrics were then compared with the percentage of correct decoding of a Bayesian classifier. Figure 3A,B shows examples in which the same decoding performance could have either high or low values of Isec and Ispike (compare different rows in Figure .CC-BY-NC-ND 4.0 International licenseIt is made available under a (which was not peer-reviewed) is the author/funder, who has granted bioRxiv a license to display the preprint in perpetuity. The copyright holder for this preprint.http://dx.doi.org/10.1101/189084doi:bioRxiv preprint first posted online Sep. 15, 2017;
- 4. to build a surrogate distribution of information values (Figure 4A). The actual value was then compared to and z-scored in relation to the chance distribution. While the correlation between decoding performance and MI did not show major changes after the normalization, the correlation of Isec and Ispike with decoding substantially improved and became similar across metrics (Figure 4B). We tested this approach using spikes from real cells recorded from the rat hippocampus during traversals on a linear track. The original and normalized MI, Isec and Ispike 3B). Moreover, there were also cases in which Isec and Ispike were insensitive to changes in the percentage of correct decoding (see V in Figure 3B). Across all the simulated cells, we found a clear correlation between decoding performance and MI, but not between correct decoding and either Isec or Ispike (Figure 3C). We next corrected the spatial information metrics for the chance information level of each cell, which varies according to firing characteristics. To that end, we computed information in shuffled rate-position maps 3.2 10 31.6 100 0 50 100 150 r2 = 0.93 Correct decoding (%) 3.2 10 31.6 100 0 20 40 60 80 100 120 140 r2 = 0.73 Correct decoding (%) 3.2 10 31.6 100 0 20 40 60 80 100 120 140 r2 = 0.73 Correct decoding (%) 0.2 1.2 2.2 0.2 3.4 6.7 0.1 1.2 2.3 0 space 30 60 z-score Shuffling Surrogate distribution Z-scored distribution Real value Normalized values MI trial# space Mean firingrate Isec Ispike Norm. MINorm. Isec B A Norm. Ispike bits/sec bits bits/spike z-score z-score z-score Figure 4. Correcting spatial me- trics using surrogates. A. (Left) Example of shuffling procedure. To estimate chance information levels, the firing rate bins within trials were shuffled prior to com- puting the metrics. (Right) The actual value of each metric was compared to the surrogate distri- bution (n=100 shufflings) and z- -score normalized. B. Percentage of correct decoding vs. the norma- lized values of Isec , Ispike and MI for all simulated cells along with the linear fit (red line). Normalizing Isec and Ispike significantly improves their correlation with decoding performance. 0 25 0 55.8 0 25 0 52.1 0 25 0 97.7 0 0.2 0.4 0.6 r2 = 0.67 0 2 4 6 r2 = 0.51 0 1 2 r2 = 0.007 0 20 40 60 Correct decoding (%) r2 = 0.69 0 50 100 Correct decoding (%) r2 = 0.62 0 50 100 Correct decoding (%) Correct decoding (%)Correct decoding (%) Correct decoding (%) r2 = 0.66 0 25 1 25 1 71 0 7.8 space Firing rate (Hz) trial# 0 25 0 65.1 Mean FiringRate Norm. MINorm. Isec Norm. Ispike MIIsec Ispike 2 3 4 5 10 2 3 4 5 10 2 3 4 5 10 2 3 4 5 10 2 3 4 5 10 2 3 4 5 10 A B C bits/sec bits/spike bits z-score z-score z-score Figure 5. Spatial information metrics applied to real cell data. A. Example of the spatial ac- tivity of five neurons recorded in hippocampal CA1 of one rat during a linear track session. The recording included spatially modulated (i.e. pla- ce cells) as well as non-modulated cells. Colored circles mark the same cells highlighted in B and C. B. Scatter plots of information estimates and decoding performance for all recorded cells. Note that the MI exhibits the best correlation with de- coding performance. C. Same as in B but for the normalized metrics. As in simulated data (Figure 3), normalizing Isec and Ispike improves their corre- lation with decoding performance. .CC-BY-NC-ND 4.0 International licenseIt is made available under a (which was not peer-reviewed) is the author/funder, who has granted bioRxiv a license to display the preprint in perpetuity. The copyright holder for this preprint.http://dx.doi.org/10.1101/189084doi:bioRxiv preprint first posted online Sep. 15, 2017;
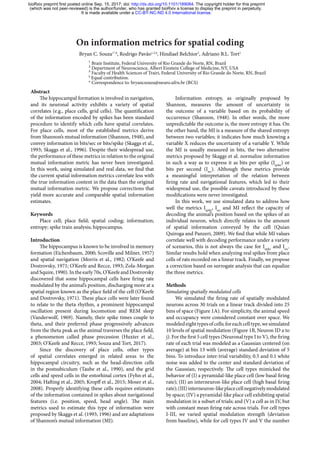
- 5. contained in the confusion matrix of a decoder provides a lower bound to the information between the two variables (Quian Quiroga and Panzeri, 2009), allowing the use of decoding performance as an empirical estimate of the real (spatial) information of the cell (Huxter et al., 2008; Jensen and Lisman, 2000; Lopes-dos-Santos et al., 2015; Robertson et al., 1999). Under this framework, our results show that the mutual information (MI) better correlates with spatial decoding performance than Isec and Ispike . Additionally, we found that the correlation with decoding performance achieves the same levels among the metrics following a surrogate-based normalization. The low correlation of Isec and Ispike with correct decoding in simulated data is a consequence of the way these metrics quantify information. Because they use the average firing rate over trials, a single trial with high firing rate can bias the metrics towards higher information values. This issue was apparent for simulated cells that were spatially modulated only in some of the trials (cell types IV and V): cells with different number of modulated trials but same mean firing rate showed similar information values (trial consistency; see Figure 7). This contrasts with the intuitive notion that the more consistent the spatial modulation of a cell across trials, the higher its spatial information. Another characteristic of Isec and Ispike metrics was their sensitivity to changes in basal firing rate. We found that the same increase in firing rate but from different baseline levels (e.g., 0 to 5 Hz vs. 10 to 15 Hz) leads to different information values for Isec and Ispike , favoring cells with low basal firing rate to have higher information (additive effect; Figure 7). Additionally, we found that the Isec metric was sensitive to changes in the mean firing rate of a cell upon a multiplicative factor (multiplicative effect; Figure 7). In contrast to Isec and Ispike , the MI was able to capture the true spatial information of the cells irrespective of rate-position map features. For instance, in the example cases shown in Figure 3, the MI was capable of properly estimating the information despite differences in mean firing rate (cell types I and II). This is because the MI is based on the probability of each firing rate value and not on the value itself. In other words, as opposed to Isec and Ispike , the MI is insensitive to additive and multiplicative effects (Figure 7). Moreover, the MI detected the increase of spatial information with higher trial consistency despite the constant mean firing rate across trials (cell type V). Notice that the MI takes into account the firing rate of every trial instead of the trial mean, making this metric more robust to inter-trial variability. We introduced a normalization that estimates and corrects for the intrinsic bias present in the rate-position map. This bias is due to the fact that even shuffled firing rate maps will have information estimates above zero (i.e., random firing rate maps are seldom constant over space). After normalizing Isec and Ispike by the mean and standard deviation of the shuffled distribution, we found an increase in their correlation with decoding performance, which reached the same level as the original MI (Figure 4). We found similar results when running our analyses on real linear-track data (Figures 5 and 6). Notably, Isec had better were computed for each cell, and plotted against decoding performance.Figure5showsresultsforanexamplesession. Notice in Figure 5B that the MI values correlated well with decoding performance, while Ispike showed no clear correlation (MI: r²=0.67; Ispike : r²=0.007). Unexpectedly, however, the Isec values were better correlated to decoding than in our simulations (Isec : r²=0.51). The correlation with decoding substantially improved for Isec and Ispike after the normalization, and reached similar values across all three metrics (Figure 5C). Figure 6A shows the r² values between each metric and decoding performance for 75 linear track sessions. Consistent with the example in Figure 5, we found that MI held the best correlations with decoding performance, followed by Isec , while Ispike was poorly correlated. After normalization, the three metrics correlated similarly well with decoding. Figure 6B shows the changes in r² between the original and normalized versions of each metric. While the r² of Isec and Ispike significantly increased, the r² changes for MI were not substantially different. Discussion We studied three metrics of spatial information using both simulated and real data. The performance of a Bayesian decoder was assumed to represent the gold standard of the true spatial information content of a cell. Decoders are used to predict the most likely stimulus that elicited a particular response; their performance is directly linked to the information about the stimulus contained in the response (Quian Quiroga and Panzeri, 2009). In other words, if two variables are related, it might be possible to use one of them to decode the other. The information r2 r2 (norm.) 0 0.2 0.4 0.6 0 0.2 0.4 0.6 0 0.8 0 0.8 r2 r2 (norm.) Isec Ispike MI Norm. Isec Norm. Ispike Norm. MIIsec Ispike MI n=75 ∆r2 0 0.2 0.4 0.6 * * * * * A B Figure 6. Correlation of spatial metrics and decoding per- formance. A. Boxplots show the distribution of coefficients of determination (r2 ) between the percentage of correct decoding and Isec , Ispike or MI for 75 linear track sessions. The original and normalized metrics are shown in the left and right panels, res- pectively. Notice similar r2 values for the normalized metrics. *p<0.001 (Wilcoxon signed-rank tests, Bonferroni corrected). B. Scatter plot of the r2 for each metric and its normalized ver- sion (left) and boxplots of the changes in r2 after normaliza- tion (right). There is significant increase in r2 for Isec and Ispike ; *p<0.001 (Wilcoxon signed-rank test, Bonferroni corrected). .CC-BY-NC-ND 4.0 International licenseIt is made available under a (which was not peer-reviewed) is the author/funder, who has granted bioRxiv a license to display the preprint in perpetuity. The copyright holder for this preprint.http://dx.doi.org/10.1101/189084doi:bioRxiv preprint first posted online Sep. 15, 2017;
- 6. existence of unconventional spatial representations has been recently demonstrated for medial entorhinal cortex neurons (Diehl et al., 2017; Hardcastle et al., 2017). In any case, irrespective of the diverging views, our results show that the MI and the corrections proposed here for Isec and Ispike are suitable metrics to capture other types of less canonical spatial correlates that may have gone undetected so far. Acknowledgements This work was supported by CAPES and CNPq, Brazil. We thank the Buzsáki laboratory for making data publicly available at http://crcns.org/, a data-sharing website supported by NSF and NIH, USA. We thank D. Laplagne and R. Romcy-Pereira for critical discussions. References Diehl, G.W., Hon, O.J., Leutgeb, S., Leutgeb, J.K., 2017. Grid and Nongrid Cells in Medial Entorhinal Cortex Represent Spatial Location and Environmental Features with Complementary Coding Schemes. Neuron 94, 83–92. Eichenbaum, H., 2000. A cortical–hippocampal system for declarative memory. Nat. Rev. Neurosci. 1, 41–50. Frank, L.M., Brown, E.N., Wilson, M., 2000. Trajectory Encoding in the Hippocampus and Entorhinal Cortex. Neuron 27, 169–178. Frank, L.M., Brown, E.N., Wilson, M.A., 2001. A comparison of the firing properties of putative excitatory and inhibitory neurons from CA1 and the entorhinal cortex. J. Neurophysiol. 86, 2029–2040. Fyhn, M., Molden, S., Witter, M.P., Moser, E.I., Moser, M.-B., 2004. Spatial representation in the entorhinal cortex. Science 305, 1258–1264. Hafting, T., Fyhn, M., Molden, S., Moser, M.-B., Moser, E.I., 2005. Microstructure of a spatial map in the entorhinal cortex. Nature 436, 801–806. Hardcastle, K., Maheswaranathan, N., Ganguli, S., Giocomo, L.M., 2017. A Multiplexed, Heterogeneous, and Adaptive Code for Navigation in Medial Entorhinal Cortex. Neuron 94, 375–387. Huxter, J., Burgess, N., O’Keefe, J., 2003. Independent rate and temporal coding in hippocampal pyramidal cells. Nature 425, 828–832. correlation with correct decoding in real than simulated data. This might be explained by the absence of some types of spatial modulation considered in our simulated cells, along with the expected presence of classical place cells in CA1 recordings. These findings may have implications on what we know about spatial representations in the brain. For instance, previous studies measured spatial information in entorhinal cortex and hippocampus and found higher spatial information in putative excitatory than inhibitory neurons (Frank et al., 2001, 2000). However, this could reflect the bias of Ispike towards higher information values in cells with low mean firing rate (Figure 7B). More generally, our observations raise the question of what defines the spatial information of a neuron. For instance, most of the known correlates of space in the hippocampus focus on neurons that typically spike at very low rates outside their receptive fields (Fyhn et al., 2004; Hafting et al., 2005; O’Keefe and Dostrovsky, 1971; Taube et al., 1990). While Ispike and (mainly) Isec work well to select cells with high spatial information in these cases, we wonder whether these metrics may have limited our understanding of spatial coding. In other words, the Isec and Ispike are well suited to detect “canonical” place cells (i.e., cells whose spatial firing rate is a unimodal function centered on the place field), but may fail to detect other spatially informative neurons whose firing rate map is not that of a canonical place cell. Notice that adding a constant factor to a spatial firing rate map does not influence decoding performance nor the information estimated by the original MI, but decreases the amount of spatial information estimated by Isec and Ispike (Figure 7). While some researchers may intuitively consider that cells which are silent outside the place field convey more information when they spike than cells with high basal firing rates, others may be more concerned as to whether it is possible or not to decode the animal position from the firing rate of the cell. The latter would further argue that every cell that carries information about the animal position (as retrieved by a decoder) could be called a “place cell”, independently of place field shape or mean firing rate. Noteworthy, the A B Addition Multiplication MIIsec Ispike space Mean firingrate space space Mean firingrate space Trial consistency trial# space space Mean firingrate 100 0 10 0 10 Additive factor 1 10 0 10 1 10 0 100 10 101 Multiplicative factor Number of modulated trials Informationestimate Figure 7. Influence of addition, multiplica- tion and trial consistency on spatial metrics. A. Schematic examples of firing rate addition (top) and multiplication (middle), as well as of consistency over trials (bottom). In the latter case, the mean firing rate over trials was fixed. B. Isec , Ispike and MI for different parameters of the cases in A. Isec and Ispike decay as the additive factor increases, while Isec linearly increases with the multiplication factor. Only the MI increases with trial consistency. The green curves are cases in which the metric behaves similarly to the de- coding performance. .CC-BY-NC-ND 4.0 International licenseIt is made available under a (which was not peer-reviewed) is the author/funder, who has granted bioRxiv a license to display the preprint in perpetuity. The copyright holder for this preprint.http://dx.doi.org/10.1101/189084doi:bioRxiv preprint first posted online Sep. 15, 2017;
- 7. Huxter, J.R., Senior, T.J., Allen, K., Csicsvari, J., 2008. Theta phase–specific codes for two-dimensional position, trajectory and heading in the hippocampus. Nat. Neurosci. 11, 587–594. Jensen, O., Lisman, J.E., 2000. Position reconstruction from an ensemble of hippocampal place cells: contribution of theta phase coding. J. Neurophysiol. 83, 2602–2609. Kropff, E., Carmichael, J.E., Moser, M.-B., Moser, E.I., 2015. Speed cells in the medial entorhinal cortex. Nature 523, 419. Lopes-dos-Santos, V., Panzeri, S., Kayser, C., Diamond, M.E., Quian Quiroga, R., 2015. Extracting information in spike time patterns with wavelets and information theory. J. Neurophysiol. 113, 1015–1033. Mizuseki, K., Sirota, A., Pastalkova, E., Diba, K., Buzsáki, G., 2013. Multiple single unit recordings from different rat hippocampal and entorhinal regions while the animals were performing multiple behavioral tasks. CRCNS Org. Morris, R.G.M., Garrud, P., Rawlins, J.N.P., O’Keefe, J., 1982. Place navigation impaired in rats with hippocampal lesions. Nature 297, 681–683. Moser, E.I., Kropff, E., Moser, M.-B., 2008. Place cells, grid cells, and the brain’s spatial representation system. Annu Rev Neurosci 31, 69–89. O’Keefe, J., Dostrovsky, J., 1971. The hippocampus as a spatial map. Preliminary evidence from unit activity in the freely- moving rat. Brain Res. 34, 171–175. O’Keefe, J., Recce, M.L., 1993. Phase relationship between hippocampal place units and the EEG theta rhythm. Hippocampus 3, 317–330. Quian Quiroga, R., Panzeri, S., 2009. Extracting information from neuronal populations: information theory and decoding approaches. Nat. Rev. Neurosci. 10, 173–185. Robertson, R.G., Rolls, E.T., Georges-François, P., Panzeri, S., others, 1999. Head direction cells in the primate pre- subiculum. Hippocampus 9, 206–219. Scoville, W.B., Milner, B., 1957. Loss of recent memory after bilateral hippocampal lesions. J. Neurol. Neurosurg. Psychiatry 20, 11. Shannon, C.E., 1948. A mathematical theory of communication, Part I, Part II. Bell Syst Tech J 27, 623–656. Skaggs, W.E., McNaughton, B.L., Gothard, K.M., Markus, E.J., 1993. An information-theoretic approach to deciphering the hippocampal code, in: Advances in Neural Information Processing Systems 5. eds. Hanson, S.J., Giles, C.L. & Cowan, J.D., pp. 1030–1037. Skaggs, W.E., McNaughton, B.L., Wilson, M.A., Barnes, C.A., 1996. Theta phase precession in hippocampal neuronal populations and the compression of temporal sequences. Hippocampus 6, 149–172. Souza, B.C., Tort, A.B.L., 2017. Asymmetry of the temporal code for space by hippocampal place cells. Sci. Rep. 7. Taube, J.S., Muller, R.U., Ranck, J.B., 1990. Head-direction cells recorded from the postsubiculum in freely moving rats. I. Description and quantitative analysis. J. Neurosci. 10, 420–435. Vanderwolf, C.H., 1969. Hippocampal electrical activity and voluntary movement in the rat. Electroencephalogr. Clin. Neurophysiol. 26, 407–418. Zola-Morgan, S.M., Squire, L.R., 1990. The primate hippocampal formation: evidence for a time-limited role in memory storage. Science 250, 288–290. .CC-BY-NC-ND 4.0 International licenseIt is made available under a (which was not peer-reviewed) is the author/funder, who has granted bioRxiv a license to display the preprint in perpetuity. The copyright holder for this preprint.http://dx.doi.org/10.1101/189084doi:bioRxiv preprint first posted online Sep. 15, 2017;