SlideShare a Scribd company logo
135
5Physical Development: Brain and Body
iStock/Thinkstock
Learning Objectives
After completing this chapter, you should be able to:
• Detail the process of nerve function and course of brain
development through the lifespan.
• Identify patterns of physical growth and change.
• Outline major milestones in motor development.
• Specify the physical signs of aging during adulthood, and
distinguish between primary and secondary aging.
• Describe the role of touch in psychosocial development.
• Explain how our sense of smell and taste develop and change.
• Compare the onset and consequences of various types of
hearing loss.
• Outline age-related developments in the visual system.
mos82599_05_c05_135-180.indd 135 2/11/16 8:24 AM
© 2016 Bridgepoint Education, Inc. All rights reserved. Not for
resale or redistribution.
136
Prologue
Chapter Outline
Prologue
5.1 Nervous System Development
Neurons and Synaptic Development
Timing of Growth
The Adaptive Brain
The Adolescent Brain
The Mature Brain
5.2 Patterns of Physical Growth
Weight and Height in Early Childhood
Adolescent Growth Spurt
Maximum Height and Diminishing Stature
5.3 Motor Development and Decline
Development in Infancy and Childhood
Development in Adolescence
Changes in Adulthood
Sex Differences in Motor Development
Physical Norms and Cultural Variations
5.4 Physical Aging in Adulthood
Programmed Theories of Aging
Damage Theories
Signs of Aging
5.5 Sensation and Perception: Touch, Smell, and Taste
Touch
Smell and Taste
5.6 Sensation and Perception: Hearing
Development of Hearing
Changes in Hearing
5.7 Sensation and Perception: Vision
Visions in Infancy and Childhood
Vision in Adulthood
Summary & Resources
Prologue
When my son Max was 3 years old he could consistently hit a
plastic baseball onto the tall roof
of his grandparents’ house. He could throw and catch better
than any kid his age. It was easy
to see that he had terrific hand-eye coordination and would
excel in the sport. By high school,
however, despite being an outstanding athlete who excelled at
basketball, soccer, and other
sports, Max could not have lasted a day on the baseball team.
mos82599_05_c05_135-180.indd 136 2/11/16 8:24 AM
© 2016 Bridgepoint Education, Inc. All rights reserved. Not for
resale or redistribution.
137
Section 5.1 Nervous System Development
What could have accounted for the change?
The answer is related brain and body development. For Max,
genetics and brain maturation
led to exceptional hand-eye coordination at a very early age; his
use of muscles that facilitated
growth of baseball skills supported increased brain expansion in
the areas best suited for that
sport. Then, for a number of reasons, it gradually became more
and more difficult for Max
to find opportunities to play baseball and he became interested
in other physical activities,
especially basketball. Because of plasticity, his brain began to
accommodate basketball skills
that the environment was dictating and (literally) pruned areas
involved in baseball skills
that were no longer being stimulated as before. The question
remains whether brain activity
stimulated basketball movements or if basketball movements
stimulated brain growth—or
maybe there is a reciprocal interaction we don’t yet understand.
Throughout the lifespan, hormonal, neuronal, and physical
changes of the brain and body are
unquestionably governed by programmed genes. However, as
you learned with regards to
critical and sensitive periods, the environment can have a
profound effect on developmental
trajectories. In this chapter, we will focus more on the first part
of the brain and body ques-
tion and explore the universal aspects of biological and physical
growth. In the chapter that
follows, we will account for more individual factors that affect
health and physical growth and
decline.
5.1 Nervous System Development
Every physical and mental action originates with the nervous
system. Without it, we would
not be able to engage in any processes that define us as human.
The mature nervous system
consists of the brain and spinal cord, designated the central
nervous system (CNS), and neu-
ral tissues in the peripheral nervous system that extend away
from the CNS into every other
part of the body (see Figure 5.1).
Beginning with a simple tube reminiscent of brains from
primitive organisms, in a short time
the human nervous system becomes extraordinarily complex.
Neural development in humans
begins when gastrulation occurs in the third week of gestation
(see Chapter 3). The mesoderm
sends signaling molecules to the ectoderm, which responds by
forming the neural plate. This
strip of neuronal stem cells will eventually configure the entire
nervous system. From the
neural plate, stem cells migrate and are involved in specific
areas of neural circuit generation.
The neural plate begins to fold and form grooves, forming the
neural tube. By the end of week
four, there are distinct areas that will later form the hindbrain,
the midbrain, and the forebrain.
These structures will form secondary structures by the end of
week 7. The optical vesicle also
appears during the fourth week, which will later form the eye
and the optic nerve. Part of
cell differentiation is dependent on proximity to the neural plate
and how the cells become
genetically programmed. Initial cell differentiation is expressed
independent of experience,
as the human genome directs the process. That is, cells are
guided by genetic programming to
become parts of various systems. Once cells reach their
intended destinations, neural activity
and experiences become a larger factor in determining emerging
neural pathways (Cooper,
2013). The production of functioning neurons commences
around post-conception day 42
and will continue for approximately 120 days (Stiles &
Jernigan, 2010).
mos82599_05_c05_135-180.indd 137 2/11/16 8:24 AM
© 2016 Bridgepoint Education, Inc. All rights reserved. Not for
resale or redistribution.
138
Brain
Spinal
cord
Central
nervous
system
Nerves of peripheral
nervous system
Section 5.1 Nervous System Development
By the end of the first trimester, the fetus will display reflexes.
It has also released the hor-
mones that will determine the outward appearance of genitalia.
The outer surface of the brain
is still relatively smooth, and lacks visible gyri (ridges) and
sulci (depressions). These will
develop rapidly during the second trimester (Figure 5.2). Their
convolutions allow for greater
surface area and are probably the reason human brains are more
advanced than any other
species (Zilles, Palomero-Gallagher, & Amunts, 2013).
However, the absolute number of brain
cells is thought to be a factor in relative mammalian
intelligence as well (Roth & Dicke, 2005).
Figure 5.1: The nervous system
The nervous system has two divisions: the central nervous
system (the brain and spinal cord) and the
peripheral nervous system (all of the nervous tissue located
outside the brain and spinal cord).
Brain
Spinal
cord
Central
nervous
system
Nerves of peripheral
nervous system
mos82599_05_c05_135-180.indd 138 2/11/16 8:24 AM
© 2016 Bridgepoint Education, Inc. All rights reserved. Not for
resale or redistribution.
139
Midbrain
Forebrain
Hindbrain
Section 5.1 Nervous System Development
During the second trimester additional structures mature and
cells continue to be formed.
By the end of this period, almost all neurons have been created
but are yet to develop most of
the connections that occur during the lifespan. Because most of
the cells have been generated
and structures are in place, the third trimester focuses on further
sophistication of structures
and systems.
Neurons and Synaptic Development
As is mentioned earlier in this section, the framework for the
nervous system begins to form
around day 14 of gestation, but its basic building block, the
neuron, does not begin develop-
ment until day 42. There are at least 100 billion neurons in the
human brain. Although neu-
rons come in many shapes and sizes, they have a number of
common features. Unlike other
cells, neurons communicate with each other in an elaborate
electrochemical relay system. As
depicted in Figure 5.3, information is first transmitted by
dendrites, structures that receive
incoming signals. The message then travels to the soma (cell
body). If the signal is to be con-
tinued, it travels via the axon. The transmission may be sped up
by a myelin sheath, which
provides electrical insulation and eventually covers most of the
long, threadlike axons. Unmy-
elinated fibers conduct impulses in a wave-like, energy
intensive, sequential fashion. After
myelination (the process of forming the sheath around the
nerve), the axon is only exposed
at regular gaps in the sheath, called the nodes of Ranvier. The
electrical impulse cannot
flow through the myelin, so it “jumps” to the next node, which
might be a millimeter or more
away (Morell & Quarles, 1999). This process speeds
transmission of impulses and also saves
energy since less surface area of the axonal membrane is used.
Therefore, myelination is an
important advance, as faster neural processing is necessary to
move faster physically and to
think in more complex ways.
Figure 5.2: Major regions of the mature brain
The midbrain, hindbrain, and forebrain (shown here in a mature
brain) begin to appear during week
four of development. The gyri and sulci (singular gyrus and
sulcus) refer to the ridges and depressions
of the brain.
Midbrain
Forebrain
Hindbrain
mos82599_05_c05_135-180.indd 139 2/11/16 8:24 AM
© 2016 Bridgepoint Education, Inc. All rights reserved. Not for
resale or redistribution.
140
Dendrite
Nucleus
Myelin
sheath
Terminal
buttons
Node of
ranvier
Axon
Section 5.1 Nervous System Development
The timing of myelination is governed by maturation. The
myelination of sensory and motor
neurons that are essential to early physical development is
mostly complete by 40 months,
whereas the neurons that are responsible for higher brain
functions like reasoning and com-
plex decision making are not myelinated until early adulthood.
When experiences are limited,
brain growth is similarly restricted. Compared to infants with
richer experiences, those raised
in less stimulating environments show significant brain
differences in structure, weight, and
volume (Lawson, Duda, Avants, Wu, & Farah, 2013; Luby,
2015). Not surprisingly, poor nutri-
tion leads to less myelin development and a general reduction in
brain size, though early
treatment can often reverse these negative effects (Atalabi,
Lagunju, Tongo, & Akinyinka,
2010; El-Sherif, Babrs, & Ismail, 2012; Gladstone et al., 2014).
Figure 5.3: The neuron
The neuron is the basic element of the nervous system.
Information is first received by the dendrites.
The message travels to the cell body (soma). If the message is
to be continued, it travels through the
axon. Transmission speed is increased when the axon is covered
in myelin, which allows the electrical
transmission to “jump” from node to node. At the terminal
buttons, neurotransmitters are released
into the synapse between the sending and receiving neurons.
Dendrite
Nucleus
Myelin
sheath
Terminal
buttons
Node of
ranvier
Axon
mos82599_05_c05_135-180.indd 140 2/11/16 8:24 AM
© 2016 Bridgepoint Education, Inc. All rights reserved. Not for
resale or redistribution.
141
Synaptic
cleftNeurotransmitter
molecule
Postsynaptic
membrane
Receptor
site
Presynaptic neuron
Presynaptic neuron
Presynaptic
membrane
Postsynaptic
neuron
Postsynaptic neuron
Neural
impulse
Neural impulse
Axon
Axon
Dendrites
Synaptic
vesicles
Axon
terminal
Neurotransmitter
molecule
Postsynaptic
membrane
Receptor
site
Synaptic
cleft
Section 5.1 Nervous System Development
Whether myelinated or not, neurons transmit electrochemical
impulses to neighboring neu-
rons (or glands or muscle fibers) at bulblike structures called
terminal buttons. This trans-
mission is achieved without the neurons actually touching each
other. Instead, they form a
synapse, or gap between the sending and receiving neurons.
Every terminal button contains
vesicles that release chemicals called neurotransmitters into the
synapse (see Figure 5.4).
Depending on a number of factors, especially the concentration
of the specific neurotransmit-
ter, the receiving neuron will either carry the message forward
or not (the “all-or-none” prin-
ciple). That is why sometimes people can perceive a faint sound
or a distant light while at
other times they cannot. The chemical messengers have either
reached a particular threshold
to transmit the sensory information or not.
Figure 5.4: Neural transmission
These neighboring neurons are able to share information using a
complex process that involves
transferring information as an electrical impulse within the
sending neuron and as a chemical
message between neurons.
Synaptic
cleftNeurotransmitter
molecule
Postsynaptic
membrane
Receptor
site
Presynaptic neuron
Presynaptic neuron
Presynaptic
membrane
Postsynaptic
neuron
Postsynaptic neuron
Neural
impulse
Neural impulse
Axon
Axon
Dendrites
Synaptic
vesicles
Axon
terminal
Neurotransmitter
molecule
Postsynaptic
membrane
Receptor
site
Synaptic
cleft
mos82599_05_c05_135-180.indd 141 2/11/16 8:24 AM
© 2016 Bridgepoint Education, Inc. All rights reserved. Not for
resale or redistribution.
142
Section 5.1 Nervous System Development
Timing of Growth
At birth the infant brain weighs only about 25% of its adult
weight, though the head is pro-
portionately closer to adult size than other body parts; because
of increased mass, by 2 years
old the weight of the brain will have tripled. A popular theory
to explain the rapid postnatal
brain growth is based in evolution. Natural selection promoted a
large and more sophisti-
cated brain while also providing advantage to an upright gait.
The vertical posture changed
the position of the pelvis and made for a narrower birth canal
that limited fetal brain growth.
Therefore, in order to have a large, sophisticated brain, it would
need to continue growing
after exiting the relatively small birth canal. So instead of a
brain that is mostly developed in
the womb to allow locomotion and other tasks immediately after
birth (like other mammals),
humans have relatively undeveloped brains that continue to
need plenty of attention.
Variations in synaptogenesis (synaptic growth) correspond to
sensitive periods in brain
development. Therefore, the rate and timing of synapse and
dendrite formation are impor-
tant to understanding development (Tierney & Nelson, 2009;
Twardosz, 2012). At birth, the
vast majority of synapses have yet to form, setting the stage for
explosive growth. As a new
object is seen, a new sound is heard, or a new movement is
made, neurons branch and extend
their reach to other neurons and form new synapses. Although
synaptic development initially
unfolds by genetic programming (maturation), experience
dictates which synapses receive
the most stimulation and make the most connections. Although
active changes in the brain
are especially noticeable for the first 20 years or more,
postnatal brain development is par-
ticularly concentrated during infancy and early childhood
(Kolb, 2009). In just a few years,
children become able to think, use language, practice most of
the physical skills they will use
as adults, and learn social behaviors that will aid their survival.
When brain development peaks, as many as 250,000 neurons are
born every minute; by the
time a child is 2 years old, some cells may have up to 10,000
connections (Kolb & Gibb, 2011).
Note in Figure 5.5 that synapses in the visual cortex that are
responsible for sight reach peak
production between the 4th and 8th postnatal months. Synapses
in the more sophisticated
reasoning centers of the prefrontal cortex do not peak until the
15th month; growth in lan-
guage areas peaks just before infants begin to speak. Later,
reasoning centers in the prefrontal
cortex do not reach maturity until early adulthood.
In total, our 100 billion neurons establish trillions of synapses,
forming a complex yet inte-
grated communication network. If stimulation is lacking during
sensitive periods of brain
development, prospects for growth, including psychosocial
processes, fine and gross motor
behavior, and language, can become limited (Gladstone et al.,
2014; Vandersmissen & Peeters,
2015). Therefore, children must be given opportunities for new
experiences and shielded
from negative environmental effects like malnutrition.
mos82599_05_c05_135-180.indd 142 2/11/16 8:24 AM
© 2016 Bridgepoint Education, Inc. All rights reserved. Not for
resale or redistribution.
143
Age in yearsAge in months
0 1 2 3-3 -2 -1 4 5 6 7 8 9 10 11 122 3 4 5 6 7 8 9 10 15 1613
1411 12 1
Visual/auditory cortex (seeing and hearing)
Prefrontal cortex (higher cognitive functions)
Angular gyrus/Broca’s area (language areas/speech production)
R
e
la
ti
v
e
g
ro
w
th
Section 5.1 Nervous System Development
The Adaptive Brain
Rate and timing of physical growth in the brain also allows us
to better understand the rela-
tionship between sensitive periods and neuroplasticity (the
ability of the brain to adapt to
experience). The younger the brain, the more “uncommitted”
areas there are for neuroplas-
ticity to operate. Sometimes another part of the brain will
assume functioning; other times,
functioning cells migrate to damaged areas. (In the adult brain,
much of the research in the
treatment of neurodegenerative disorders like spinal cord
injuries and Alzheimer’s disease
focuses on this knowledge that certain stem cells can become
integrated into existing circuits
[Lindvall & Kokaia, 2010; Obernier, Tong, & Alvarez-Buylla,
2014]).
Figure 5.5: Timing of synapse and dendrite formation
The rate and timing of synapse and dendrite formation vary by
age and are important to
understanding development. Notice, for example, that growth in
language areas peaks just before
infants begin to speak.
Source: From R. A. Thompson and C. A. Nelson,
“Developmental science and the media: Early brain
development,” American
Psychologist, 56(1): 5–15. Copyright . 2001. Reprinted by
permission of the American Psychological Association.
Age in yearsAge in months
0 1 2 3-3 -2 -1 4 5 6 7 8 9 10 11 122 3 4 5 6 7 8 9 10 15 1613
1411 12 1
Visual/auditory cortex (seeing and hearing)
Prefrontal cortex (higher cognitive functions)
Angular gyrus/Broca’s area (language areas/speech production)
R
e
la
ti
v
e
g
ro
w
th
mos82599_05_c05_135-180.indd 143 2/11/16 8:24 AM
© 2016 Bridgepoint Education, Inc. All rights reserved. Not for
resale or redistribution.
144
Section 5.1 Nervous System Development
To facilitate neuroplasticity during early brain development,
there is a massive overproduc-
tion of synapses during infancy (as shown in Figure 5.6) before
engaging in a process of reduc-
tion, called synaptic pruning, in order to create an individual
network of connections for
each person. This principle of “use it or lose it” serves as a
biological foundation for learning,
as mentioned in the prologue. Pruning is natural and desirable
because brain efficiency
improves and behaves adaptively. This favoritism allows
neurons that receive the most stimu-
lation—and thus are interpreted as the most important—to be
given space to grow more
elaborate connections. Like synapse formation, timing of
pruning varies depending on brain
areas. In some instances, pruning is not complete until
adolescence or beyond (Selemon,
2013).
Not only does the brain adapt to stimulation, but if a part of the
brain is damaged before it
has begun its major synaptic growth, other cells can take the
place of those that are damaged.
For example, researchers have surgically removed brain parts of
one-day old ferrets that are
essential to hearing. Neural pathways that would otherwise have
been eliminated through
pruning replaced the missing cells and became functional for
hearing instead (Sur & Leamey,
2001). In humans, when either visual or auditory loss occurs
without damage to the brain, the
area that would have been dedicated to providing sensory
information is recruited for other
Figure 5.6: Neuron growth and pruning
According to scientists, the brain overproduces synapses during
early childhood and then goes
through a pruning process later. Neurons that receive the most
stimulation are favored over those
that receive less stimulation.
Source: From Reynolds and Fletcher-Janzen, Eds, Handbook of
Clinical Child Neuropsychology, Figure 4, p. 25. Copyright .
2009.
Reprinted with kind permission from Springer Science+Business
Media B.V.
mos82599_05_c05_135-180.indd 144 2/11/16 8:24 AM
© 2016 Bridgepoint Education, Inc. All rights reserved. Not for
resale or redistribution.
145
Section 5.1 Nervous System Development
means (Merabet & Pascual-Leone, 2010). In addition,
neuroplasticity sometimes produces
apparently random effects. For instance, there appears to be a
complete absence of schizo-
phrenia among individuals are born blind or lose vision shortly
after birth (Silverstein, Wang,
& Keane, 2012). For unknown reasons, the loss of some neural
pathways apparently provides
a protective factor in schizophrenia.
In adults, a well-known example of neuroplasticity has been
measured in London cab driv-
ers, who must acquire “the Knowledge” of London streets.
London taxi drivers spend 3 to 4
years learning the layout of the city and acquire an exceptional
spatial representation of the
streets. Not only can experienced cab drivers relate information
about various routes, but
areas in the brain that are responsible for spatial representation
are significantly larger than
in London bus drivers, who do not have to learn the Knowledge
(Maguire, Woollett, & Spiers,
2006; Woollett & Maguire, 2011).
The Adolescent Brain
Specific kinds of stimulation continue to predict outcomes well
beyond the first three years.
Studies have shown that cognitive stimulation at age 4 predicts
thickness of cognitive areas of
the brain around 15 years later (Lawson et al., 2013). Although
this study showed that stimu-
lation leads to specific growth, we know that maturation
provides general growth patterns as
well. Gogtay and his colleagues obtained brain scans every 2
years among individuals between
5 and 20 years of age, resulting in a dynamic map of
development (Gogtay et al., 2004). Figure
5.7 shows the sophistication of cortical development that is
evident throughout childhood
and adolescence. Well into adolescence, axons continue to grow
and expand connections,
supplanting cell bodies in the process. Basic sensory and motor
functions mature first, coin-
ciding with the basic learning outcomes of infancy. Speech and
language areas come next. The
areas in the frontal lobe (one of the four major brain divisions,
including the parietal, occipi-
tal, and temporal lobes) that are related to judgment and the
inhibition of impulses are last to
develop.
Adolescence also marks a second wave of overproduc-
tion of synapses and neural pruning, and the architec-
ture of the prefrontal cortex begins to change rapidly
(Hedman, van Haren, Schnack, Kahn, & Hulshoff Pol,
2012). Because these centers are not mature until after
adolescence, some researchers have speculated that
immature frontal lobe development is linked to the
risky behaviors that are indicative of adolescence. This
possibility also raises questions about public policy
and whether adolescents should be considered more
like children or more like adults with regard to forensic
examinations, driving, and other adult-like responsi-
bilities. (See especially Bonnie & Scott, 2013, Steinberg,
2013, and Steinberg & Scott, 2003.) For instance, if judgment
among teens is developmen-
tally compromised, then there are implications for holding them
completely accountable for
crimes.
Critical Thinking
Should the knowledge that the reasoning
centers of adolescents are not fully mature
have an impact on how they are treated
when they commit crimes? For further
information and discussion, see Aronson
(2007), Beckman (2004), Bonnie and Scott
(2013), Steinberg (2013), and the case
against Christopher Simmons (APA, 2004).
mos82599_05_c05_135-180.indd 145 2/11/16 8:24 AM
© 2016 Bridgepoint Education, Inc. All rights reserved. Not for
resale or redistribution.
146
Section 5.1 Nervous System Development
Figure 5.7: Brain development through childhood and
adolescence
In an extensive project to map brain development, scientists
found that axons (white matter)
continued to replace cell bodies (gray matter) well into
adolescence.
Source: Image courtesy of Paul Thompson (USC) and the
NIMH.
The Mature Brain
After reaching its maximum mass of a little over 3 pounds by
the beginning of adulthood, the
cortical volume of the brain begins shrinking with age, by
approximately 2 grams per year, or
1.9% per decade (DeCarli, Massaro, et al., 2005). Nevertheless,
some brain parts become more
active. We continue to create new neural pathways and change
existing ones in adulthood as
we adapt to new experiences. For instance, researchers recorded
specific areas of growth and
change in the brains of adults who learned a new video game
(Kühn, Gleich, Lorenz, Linden-
berger, & Gallinat, 2014). It is thought that this plasticity, along
with increased neuron firing,
allows brains of older adults to compensate and maintain their
functionality despite the age-
related loss of mass (Daselaar et al., 2015; Sale, Berardi, &
Maffei, 2014).
It is still unclear why some parts of the brain adapt while others
do not, but exploring the rea-
sons why may have important implications for understanding
neurodegenerative diseases and
mos82599_05_c05_135-180.indd 146 2/11/16 8:24 AM
© 2016 Bridgepoint Education, Inc. All rights reserved. Not for
resale or redistribution.
147
Newborn 2 years 5 years 15 years Adult
Section 5.2 Patterns of Physical Growth
the ability for the brain to recover from injury. For instance,
evidence indicates that neural
growth can be promoted in the hippocampus and other areas,
possibly slowing or reversing the
effects of memory loss in dementia and other chronic kinds of
neurodegeneration (Gladstone
et al., 2014; Ho, Hooker, Sahay, Holt, & Roffman, 2013;
Regensburger, Prots, & Winner, 2014). In
Chapter 6, we will consider the changes in the most common
degenerative brain diseases,
including information about the diagnosis, prevalence, and
treatment of these diseases.
Section Review
Summarize how the transmission of neural signals occurs and
outline how brain activity
changes with time.
5.2 Patterns of Physical Growth
Because brain volumes of infants are relatively close to adult
size, the heads of infants are
disproportionately large as well. On their way to adult
proportions, the torso and limbs grow
faster than the head. This pattern of growth is an example of
directionality, one of the gen-
eral principles of human growth. In this case, the direction is
cephalocaudal, literally mean-
ing “head to tail.” Notice from Figure 5.8 that the head
represents about 25% of the body
length at birth and then decreases with age. During the first 2
years, the torso and limbs
quickly begin to catch up. By adulthood, the head makes up less
than one-seventh of an indi-
vidual’s height, or about half of the body proportion it held at
infancy.
Figure 5.8: Change in body proportion, by age
One representation of the cephalocaudal principle is the change
in body proportion by age. The
proportion of head-to-body size decreases by about half from
infancy to adulthood, and secondary
sex characteristics develop through the teenage years until
adulthood.
Newborn 2 years 5 years 15 years Adult
mos82599_05_c05_135-180.indd 147 2/11/16 8:24 AM
© 2016 Bridgepoint Education, Inc. All rights reserved. Not for
resale or redistribution.
148
S
iz
e
i
n
t
e
rm
s
o
f
p
e
rc
e
n
ta
g
e
o
f
to
ta
l
g
ro
w
th
Age in years
0
20
Birth 2 4 6 8 10 12 14 16 18 20
40
60
80
100
120
140
160
180
200
Lymph tissue Brain and head
General growth curveGenitals
Section 5.2 Patterns of Physical Growth
Physical growth also occurs in a proximodistal pattern—from
the inside out. The pattern
begins in the prenatal environment and continues after birth, as
infants learn to move their
torsos before their extremities. Babies learn to use their arms to
maintain balance before they
use their hands and fingers to reach for an object. This pattern
also overlaps the orthoge-
netic principle, which states that development begins rather
globally and undifferentiated,
and gradually increases its differentiation. For example, when
infants first eat, they are only
concerned with latching onto a nipple, sucking, and swallowing.
Months later, they will ori-
ent their heads on their own, move their arms, and reposition
their bodies. When infants are
offered a bottle, they begin to coordinate actions of arms,
hands, and mouth. Still later, chil-
dren will learn to hold utensils, drink from a glass, and employ
different manners of eating.
They may learn to vary their posture or language depending on
the company or where they
are eating. In this way, the concept of eating transitions from a
simple view of suck and swal-
low to one that is highly differentiated.
We also know conclusively that different body systems grow
and mature independently. As
seen in Figure 5.9, the nervous system matures quite rapidly
beginning in childhood, whereas
the pattern of growth of overall stature (body size) is a bit more
even. And neither the timing
nor the rate of sexual maturation mirrors that of either the
nervous system or stature, dem-
onstrating relative autonomous development of body systems.
This is the principle of inde-
pendence of systems. These general principles will become
quite apparent as we expand on
physical growth and development.
Figure 5.9: Independence of systems
This graph illustrates that different body systems grow and
mature independently.
Source: Tanner, J. M. (1962) Growth At Adolescence, 2nd ed.,
Oxford: Blackwell Scientific Publications. John Wiley & Sons.
S
iz
e
i
n
t
e
rm
s
o
f
p
e
rc
e
n
ta
g
e
o
f
to
ta
l
g
ro
w
th
Age in years
0
20
Birth 2 4 6 8 10 12 14 16 18 20
40
60
80
100
120
140
160
180
200
Lymph tissue Brain and head
General growth curveGenitals
mos82599_05_c05_135-180.indd 148 2/11/16 8:24 AM
© 2016 Bridgepoint Education, Inc. All rights reserved. Not for
resale or redistribution.
149
2
3
4
5
6
7
8
9
10
11
12
13
14
15
16
17
18
19
lb kg
6
4
8
10
12
14
16
18
20
22
24
26
28
30
32
34
36
38
40
Age (months)
Weight-for-age percentiles:
Girls, birth to 36 months
30 6 9 12 15 18 21 24 27 30 33 36
97th
95th
90th
75th
25th
10th
5th
50th
3rd
2
3
4
5
6
7
8
9
10
11
12
13
14
15
16
17
18
19
lb kg
6
4
8
10
12
14
16
18
20
22
24
26
28
30
32
34
36
38
40
30 6 9 12 15 18 21 24 27 30 33 36
97th
95th
90th
75th
25th
10th
5th
50th
3rd
Age (months)
Weight-for-age percentiles:
Boys, birth to 36 months
Section 5.2 Patterns of Physical Growth
Weight and Height in Early Childhood
Height is perhaps the most obvious feature of physical
maturation. Whether a child is short,
tall, or average, doctors measure patterns of development by
consistency of growth. The chart
in Figure 5.10 is typical of those used by researchers and
professionals in the healthcare field
to gauge normal changes in weight. In this case, it does not
matter much which path children
follow; it is more important to see that they are following a
consistent pattern and that their
weight is not fluctuating excessively.
Figure 5.10: CDC weight-for-age percentiles, birth to 36 months
This standard growth chart shows weight-for-age percentiles for
children up to 36 months old.
Source: Adapted from Kuczmarski, R. J., Ogden, C. L, Guo, S.
S., et al. 2000 CDC growth charts for the United States:
Methods and
development. National Center for Health Statistics. Vital Health
Statistics 11(246). 2002.
2
3
4
5
6
7
8
9
10
11
12
13
14
15
16
17
18
19
lb kg
6
4
8
10
12
14
16
18
20
22
24
26
28
30
32
34
36
38
40
Age (months)
Weight-for-age percentiles:
Girls, birth to 36 months
30 6 9 12 15 18 21 24 27 30 33 36
97th
95th
90th
75th
25th
10th
5th
50th
3rd
2
3
4
5
6
7
8
9
10
11
12
13
14
15
16
17
18
19
lb kg
6
4
8
10
12
14
16
18
20
22
24
26
28
30
32
34
36
38
40
30 6 9 12 15 18 21 24 27 30 33 36
97th
95th
90th
75th
25th
10th
5th
50th
3rd
Age (months)
Weight-for-age percentiles:
Boys, birth to 36 months
mos82599_05_c05_135-180.indd 149 2/11/16 8:24 AM
© 2016 Bridgepoint Education, Inc. All rights reserved. Not for
resale or redistribution.
150
Age in years
1 2 3 4 5 6 7 8 9 10 14 15 16 17 18 19 2011 12 13
GirlsBoys
C
e
n
ti
m
e
te
rs
80
90
100
110
120
130
150
170
140
160
180
35
42
49
56
63
70
I
n
c
h
e
s
Age in years
1 2 3 4 5 6 7 8 9 10 14 15 16 17 18 19 2011 12 13
C
e
n
ti
m
e
te
rs
0
1
2
3
4
5
6
7
8
9
12
0
1
1.5
0.5
2
2.5
3
3.5
5
I
n
c
h
e
s
GirlsBoys
a) Average annual growth rate b) Average height
Section 5.2 Patterns of Physical Growth
Infants grow in length by about 50%, on average, in the first
year, from a little over 20 inches
(51cm) to about 30 inches (76 cm). During the second year, they
add another 5 inches (13 cm).
Until adolescence, the annual growth in height decreases
gradually, as shown in Figure 5.11.
Height can vary dramatically in poor countries where adequate
nutrition is not available, like
parts of India, Indonesia, and Africa. In areas where children
receive sufficient nutrition, most
global variations in height are due to genetic factors. For
instance, children of European
ancestry tend to be slightly taller than Asian children regardless
of where the children reside
(Deurenberg, Deurenberg-Yap, Foo, Schmidt, & Wang, 2003;
Nightingale, Rudnicka, Owen,
Cook, & Whincup, 2011).
Figure 5.11: Average growth rates and heights of girls and boys
in the United
States
Growth rates for boys and girls show similar patterns, with girls
beginning the adolescent growth
spurt, on average, about 2 years earlier than boys. On average,
girls are taller than boys during early
adolescence. After age 14, though, girls grow, on average, only
a little more than 1/2 an inch (1.4 cm),
whereas boys grow another 3 1/3 inches (8.5 cm).
Source: Adapted from Ogden, Fryar, Carroll & Flegal, 2004.
Advance Data No. 347. National Center for Health Statistics.
October
27, 2004.
Age in years
1 2 3 4 5 6 7 8 9 10 14 15 16 17 18 19 2011 12 13
GirlsBoys
C
e
n
ti
m
e
te
rs
80
90
100
110
120
130
150
170
140
160
180
35
42
49
56
63
70
I
n
c
h
e
s
Age in years
1 2 3 4 5 6 7 8 9 10 14 15 16 17 18 19 2011 12 13
C
e
n
ti
m
e
te
rs
0
1
2
3
4
5
6
7
8
9
12
0
1
1.5
0.5
2
2.5
3
3.5
5
I
n
c
h
e
s
GirlsBoys
a) Average annual growth rate b) Average height
Adolescent Growth Spurt
Regardless of where healthy children grow up, their bodies
eventually undergo a number of
physical changes that mark the transition into adulthood. Part of
the tremendous change is
the sudden growth in height and weight. This development is
often referred to as the ado-
lescent growth spurt and can add 5 inches (12.7 cm) or more in
a single year. Girls begin
the spurt at about age 10 and boys at about age 12 (refer back to
Figure 5.11). Therefore,
on average, 12-year-old girls are taller than their male
counterparts. In addition, because of
their earlier accelerated growth, girls on average grow only
about 1/2 inch (1.4 cm) after the
age of 14 years, whereas boys grow another 3 1/3 inches (8.5
cm). During this growth spurt,
there are also considerable adolescent physical changes
associated with sexuality, which will
be explored in Chapter 12.
mos82599_05_c05_135-180.indd 150 2/11/16 8:24 AM
© 2016 Bridgepoint Education, Inc. All rights reserved. Not for
resale or redistribution.
151
Section 5.3 Motor Development and Decline
Maximum Height and Diminishing Stature
It has been suggested that because of modern advantages in
nutrition it is now possible to
gain optimum genetic height, which is a function of both
genetic and environmental vari-
ables (Silventoinen, 2003; Steckel, 2002). It is estimated that,
in modern Western societies,
about 20% of final body height is due to environmental
variation, including nutrition and
physical stimulation; in settings with fewer resources,
environmental variation is responsible
for more than 20% of final height. In developing countries and
among some families in the
United States, food variety is limited. For instance, there are
areas all over Asia where protein
is lacking and rice makes up the majority of every meal. In
isolated communities at higher
elevations in South America, produce may be at a premium but
animal protein plentiful. And
in the United States, many inner-city areas lack easy access to
fresh produce and children
often grow up eating only limited amounts. As a result, children
may lack some vitamins and
minerals that are essential for growth. Therefore, heritability of
height (the proportion due
to genetics) increases as a function of advantages in health,
nutrition, and medical science.
Short stature varies inversely with both education and social
position, so height can often be
used as an indicator of the health and welfare of a population.
For instance, in the United
States the average person is nearly 3 inches (7.6 cm) taller
today than when the country was
founded in 1776. And during the 20th century, average body
height increased throughout the
industrialized world. From the 1870s to the 1970s alone,
average height in Western European
countries increased by 4.3 inches (11 cm) or nearly half of an
inch per decade (Hatton & Bray,
2010). On the other hand, as people moved to cities in the 1700s
and 1800s, diseases spread
more easily and access to food was more inconsistent compared
to when more people lived
on farms (Komlos, 1998). These factors probably contributed to
the finding that some cohorts
occasionally had lower stature than the previous generation.
However, overall, figures indi-
cate that technological development has led to improved health
and living conditions, includ-
ing the ability to transport foods and services.
Section Review
Describe some universal patterns of physical growth, including
stature, and how they may be
influenced by contextual factors.
5.3 Motor Development and Decline
As babies grow, parents anxiously look for their children to roll
over, stand, and walk. Later,
pediatricians will ask about catching a ball, using eating
utensils, and manipulating a pencil.
These normative milestones are important in the study and
understanding of motor devel-
opment (the ability to control and coordinate body movements).
By adolescence, many teens
can perform physically as well as or better than many adults.
But there is tremendous indi-
vidual variation, including factors related to genetics, culture,
and gender that will influence
how motor development will occur. As we move into middle and
late adulthood, deterioration
in motor skills is universal, but how we use our bodies
throughout the lifespan will contribute
substantially to the course of decline. These features of physical
growth will be explored next.
mos82599_05_c05_135-180.indd 151 2/11/16 8:24 AM
© 2016 Bridgepoint Education, Inc. All rights reserved. Not for
resale or redistribution.
152
Section 5.3 Motor Development and Decline
Development in Infancy and Childhood
Physical movements are categorized as either gross motor skills
or fine motor skills. Gross
motor skills involve large movements of the head, torso, arms,
and legs. The first signs of
gross motor skills related to locomotion occur when children
develop the muscle control to
roll over at between 2 and 3 months of age (refer to Table 5.1).
Interestingly, although infancy
is often associated with a crawling baby, it is not unusual for
infants to skip the crawling stage
and move right into cruising (walking while holding on to
furniture) and then walking.
In contrast, fine motor skills involve
more precise dexterity of the hands
and fingers, initially coordinating with
vision. Following the proximal-distal
pattern, infants begin to integrate
gross motor abilities with smaller
hand movements at around 4 months
of age. A few months later they are
able to hold a bottle, but immature
brain development will at first cause
them to have difficulty guiding it to
their mouths. Toward the end of the
first year, they will transition from
using the whole-hand palmar grasp
to picking up cereal and other small
objects between the thumb and fore-
finger using what is called the pincer
grip. Infants will also begin to bang
two toys together and can use eat-
ing utensils and cups. These activi-
ties coincide with greater mobility, as
infants delight in scanning for objects, moving toward them,
and picking them up with their
more advanced hold. At just a few months of age, infants are
becoming less dependent on oth-
ers for stimulation.
The second year brings added coordination between eye and
hand movements. Children
learn to get water from a faucet and put together and take apart
simple toys. Preschoolers can
manipulate pencils and crayons and can color within
boundaries. They can also use safety
scissors to cut out objects from paper. Well before they reach
elementary school, most chil-
dren are able to acquire the skills needed to accurately use a
touch screen, computer key-
board, and mouse.
The Brazelton Neonatal Behavioral Assessment Scale
(Brazelton & Nugent, 2011), Gesell Developmental
Schedules (Gesell, 1925), and the Bayley Scales (Bay-
ley, 1969) are used in various settings to assess normal
developmental milestones. Together, they provide a
comprehensive battery of instruments and test individ-
ual variation in motor and mental skills for children up
iStock/Thinkstock
As children grow, they develop the ability to control
and coordinate their bodies. From rolling over to
feeding themselves frozen treats, these milestones
are key to motor development.
Critical Thinking
How do changes in motor skills affect
the way infants interact with their
environment?
mos82599_05_c05_135-180.indd 152 2/11/16 8:24 AM
© 2016 Bridgepoint Education, Inc. All rights reserved. Not for
resale or redistribution.
153
Section 5.3 Motor Development and Decline
to 42 months, or 3 1/2 years of age. The general idea of these
schedules is that development
is maturational and does not change very much within a healthy
population. An individual’s
specific behaviors can be assessed and then compared to the
norm, or average performance,
of a similar group. A series of scores significantly below a
standard often indicates a disability.
Table 5.1 offers examples of milestones that might typically be
evaluated.
Table 5.1: Milestones in motor development, ages 0–4 years
Age Behavior Fine (f ) or gross (g) motor behavior
0–6 months Exhibits reflexes —
Holds head up g
Rolls over g
Will reach and grasp f
Physically pursues objects f + g
Can sit without support g
Stands while holding on to a parent’s hand g
Pulls self to standing position g
6–12 months Has the skill to crawl (but may not) g
Walks with support g
Stands alone g
Cruises (walks while holding on to furniture) f + g
Grasps with thumb and forefinger (pincer grip) f
12–18 months Walks without support g
Throws objects f + g
Ascends steps with help g
18–24 months Climbs f + g
Turns on faucet to get water f
Dresses self with help f + g
Drinks from a cup f
Jumps g
2–3 years Dresses self (without buttons) f + g
Ascends steps unaided, alternating feet g
Hops irregularly g
Pours liquid from one container to another f
Draws simple figures (e.g., circles, crosses,
stick figures)
f
continued
mos82599_05_c05_135-180.indd 153 2/11/16 8:24 AM
© 2016 Bridgepoint Education, Inc. All rights reserved. Not for
resale or redistribution.
154
Section 5.3 Motor Development and Decline
Age Behavior Fine (f ) or gross (g) motor behavior
3–4 years Can run, jump, and ride a tricycle g
Throws and catches a ball f + g
Jumps 12 inches from a climber to the ground g
Puts together simple puzzles f
Strings beads f
Cuts and pastes f
Draws shapes and symbols holding pencil or
crayon between thumb and first two fingers
f
If children are exposed to the fine motor activity necessary for
musical instruments like the
piano and violin, most 5-year-olds can begin to play. With some
practice, the average kinder-
gartener can tie shoes and easily manipulate zippers, snaps, and
buttons. Though these chil-
dren do not yet fully comprehend visual-spatial movement such
as the trajectory of a rolling
ball in soccer, a bouncing ball in basketball, or a pitched ball in
baseball, they can still engage
physically in those activities. Because movement is slower and
reaction time is thrown off,
accommodations like a batting tee (“T-Ball”) are made for
younger elementary-school-age
children. Table 5.2 includes examples of milestones that might
typically be evaluated.
Table 5.2: Milestones of motor development, ages 4–7 years
Age Behavior Fine (f ) or gross (g) motor behavior
4–5 years Hops with purpose g
Ties shoes f
Descends stairs, alternating feet g
Prints recognizable letters and numbers f
Walks across a balance beam g
5–6 years Hand dominance usually apparent —
Skips g
Skips rope g
Connects zippers, buttons, and snaps f
Traces accurately f
Copies shapes f
Uses school supplies appropriately f
7 years Physical movement resembles adult movement —
Uses tools f
Can anticipate trajectory of rolling balls —
Table 5.1: Milestones in motor development, ages 0–4 years
(continued)
mos82599_05_c05_135-180.indd 154 2/11/16 8:24 AM
© 2016 Bridgepoint Education, Inc. All rights reserved. Not for
resale or redistribution.
155
Section 5.3 Motor Development and Decline
By late elementary school (10 or 12 years of age), children can
throw a ball, run smoothly,
hop, jump with purpose, and kick with great agility and skill.
They show outstanding coordi-
nation dribbling a soccer ball or a basketball. They have great
body control on a skateboard or
rollerblades. Though they still lag behind adults in strength and
speed, 12-year-olds show
adult-like hand-eye coordination in most physical activities,
quite unlike the 6-year-old bod-
ies they left behind. The advancement of physical skills also
depends on brain maturation
because more cognitive sophistication is required to coordinate
advanced movements. For
the most part, by the end of elementary school children can
perform the same movements as
adults, though without the same skill or strength.
Although there are clear consequences of experience in
motor development, inherited traits have been found
to have a stronger effect on motor development than
quality of life (Puciato, Mynarski, Rozpara, Borysiuk,
& Szyguła, 2011). Among children aged 8–16, height
and body fat are more highly correlated with speed and
strength than social factors. That is, there is evidence
that a person’s genotype indeed is a determining factor
in the performance of skills that are universal to many
physical endeavors.
Development in Adolescence
The adolescent body is decidedly adult-like. After all, puberty
marks the transition into an
adult body. Physical abilities of many adolescents exceed that
of their parents. Notably, peak
swimming ability, as measured among athletes in world
competitions, occurs between 18 and
21 years of age (König et al., 2014). In contrast, motor ability,
strength, speed, and coordina-
tion in other physical tasks generally does not peak until the
mid to late 20s (depending on
the skills and muscles involved). As noted, genotype is a strong
determinant in many motor
abilities related to speed and strength. However, other than
those aspiring to be elite ath-
letes, most ordinary variations in motor abilities do not
necessarily have a global impact on
development.
Changes in Adulthood
Strength, stamina, and speed can continue to improve during the
20s. For most of us, biological
declines in mobility and potential peak performance have little
effect until middle adulthood
(Elmenshawy, Machin, & Tanaka, 2015; Schaie, 2005). At that
time, we generally begin to com-
pensate for physical changes by increased anticipatory skills
and expertise (Krampe & Char-
ness, 2006; Wright, Bishop, Jackson, & Abernethy, 2011). That
is, in competitions adults tend
to use experience and finesse to make up for the physical losses
of sarcopenia (natural muscle
loss) that begin in the early 30s. In everyday tasks, older adults
tend to slow down some activi-
ties and break up tasks into smaller units, like using a greater
number of grocery bags and per-
forming some activities more slowly than previously.
Sometimes the convergence of reduced
coordination and osteoporosis becomes quite problematic.
Compared to uncoordinated tod-
dlers who fall frequently, the elderly who fall have wrists, arms,
and hips that are much more
fragile and farther from the ground, and thus they suffer bone
fractures much more often.
Critical Thinking
Consider again the story about Max’s
experiences with physical activities, which
is provided in the chapter prologue. How
would you design a research study that
investigates the relationship between
early motor activity and later athletic
ability?
mos82599_05_c05_135-180.indd 155 2/11/16 8:24 AM
© 2016 Bridgepoint Education, Inc. All rights reserved. Not for
resale or redistribution.
156
270
240
210
180
150
120
300
240
270
210
Sitting without support
270
240
210
180
150
120
90
Ghana India Norway Oman USA All
Hands-and-knees crawling
390
360
330
300
270
240
210
180
150
120
90
Ghana India Norway Oman USA All
Standing with assistance
360
330
300
90
Ghana India Norway Oman USA All
Walking with assistance
420
390
360
330
300
270
240
210
180
150
Ghana India Norway Oman USA All
Standing alone
480
450
420
390
360
330
180
150
Ghana India Norway Oman USA All
Walking alone
510
480
450
420
390
360
330
270
300
240
210
180
150
Ghana India Norway Oman USA All
A
v
e
ra
g
e
a
g
e
o
f
a
c
h
ie
v
e
m
e
n
t
(i
n
d
a
y
s
)
Boys Girls 95% Confidence interval
Section 5.3 Motor Development and Decline
Sex Differences in Motor Development
There is a common assumption among parents in the United
States that infant girls are more
advanced physically than infant boys. Overall though, it is the
result of anecdotal information
more than scientific evidence. As depicted in Figure 5.12,
small, statistically significant differ-
ences sometimes exist, but they vary by country and by
behavior (WHO Multicentre Growth
Reference Study Group, 2006). Importantly, when there are
milestone differences between
sexes within a country, it is due to culture-specific behaviors.
When data are pooled for all
countries and for both sexes, the size of any differences is “too
small to justify sex-specific
norms” (p. 71).
Figure 5.12: Sex differences in motor development
Statistically significant differences in motor development exist,
but they are likely due to cultural
differences in the way that boys and girls are treated. Overall,
evidence does not justify identifying a
separate set of norms for boys and girls.
Source: de Onis, Mercedes (2006). Assessment of sex difference
and heterogeneity in motor milestone attainment among
populations in the WHO Multicentre Growth Reference Study.
Acta Paediatricia, 450, 66–75. (Figure 1 ). Copyright © 2007
John
Wiley and Sons. Published by Jon Wiley & Sons.
270
240
210
180
150
120
300
240
270
210
Sitting without support
270
240
210
180
150
120
90
Ghana India Norway Oman USA All
Hands-and-knees crawling
390
360
330
300
270
240
210
180
150
120
90
Ghana India Norway Oman USA All
Standing with assistance
360
330
300
90
Ghana India Norway Oman USA All
Walking with assistance
420
390
360
330
300
270
240
210
180
150
Ghana India Norway Oman USA All
Standing alone
480
450
420
390
360
330
180
150
Ghana India Norway Oman USA All
Walking alone
510
480
450
420
390
360
330
270
300
240
210
180
150
Ghana India Norway Oman USA All
A
v
e
ra
g
e
a
g
e
o
f
a
c
h
ie
v
e
m
e
n
t
(i
n
d
a
y
s
)
Boys Girls 95% Confidence interval
mos82599_05_c05_135-180.indd 156 2/11/16 8:24 AM
© 2016 Bridgepoint Education, Inc. All rights reserved. Not for
resale or redistribution.
157
Section 5.3 Motor Development and Decline
As children mature, there is no doubt that sex differences in
brain development affect motor
behaviors and skills. Studies confirm that physical disparities
exist between boys and girls
because of physiological and maturational differences (e.g.,
Eaton & Yu, 1989; Pellegrini &
Smith, 1998). Girls perform better at balancing skills like
walking on a beam, balancing on one
foot, and playing hopscotch. On the other hand, it should come
as no surprise that boys gener-
ally outperform girls in gross motor skills that require speed or
strength. Beginning at about
3 years old, boys on average jump higher and run faster than
girls. These differences are gen-
erally due to variability in muscle strength. Even from birth,
boys are more active than girls.
Perspectives on evolution and neurobiology reveal that the
greater activity level of male
infants accelerates brain growth of the motor neurons needed
for strength and speed. But
beginning at an early age boys on average are also conditioned
to be more active than girls.
Adults treat girls more delicately and use softer language within
24 hours of birth, a pattern
that continues during infancy (Beal, 1994; Johnson, Caskey,
Rand, Tucker, & Vohr, 2014). Com-
pared to their interactions with boys, mothers cuddle girls more,
and they are more emotion-
ally expressive, smile and talk more, and are more responsive to
the needs of girls. Boys are
given more latitude, whereas girls tend to be more restricted. In
this way, boys may learn to
be more independent, which translates to greater activity.
Regardless of the reasons, boys get
more practice using their motor skills, perhaps laying the
groundwork for increased strength
later.
Physical Norms and Cultural Variations
Recently it has been suggested that there is more diversity than
was once thought in the acqui-
sition of motor skills, providing substance for the nature-
nurture debate. Karasik, Adolph,
Tamis-LeMonda, and Bornstein (2010) argue that traditional
developmental scales are based
on Western-educated populations. They highlight a number of
cultures in which the envi-
ronment seems to play a larger role in development. For
example, some cultures specifically
target infant muscles that are later necessary for walking. These
muscles are massaged and
stretched, and infants are engaged in various motor exercises in
an effort to get the children
walking sooner. This treatment would be an advantage within
environments where there are
few safe places for children to crawl.
Contemporary environmental variations can affect other kinds
of movement as well, even the
seemingly benign use of diapers. In a newer study, researchers
asked if the relatively new cul-
tural invention of various diapering practices contribute to
differences in motor development
and walking behavior (Cole, Lingeman, & Adolph, 2012). In
many poorer countries where dia-
pering is a luxury, until children are toilet trained it is typical
for them to remain naked during
the day. Infants who had been accustomed to walking in
disposable diapers were documented
walking in one of three conditions: naked, in a cloth diaper, and
in a disposable diaper. The
resultant footprint paths for the three conditions in Figure 5.13
were noticeably different,
with the naked condition providing the most mature pattern.
This study shows that cross-
cultural research that compares locomotion skills may be less
reliable if diapering practices
are not taken into account. Furthermore, it is not clear whether
the contextual differences of
diapering lead to significant changes in later development, such
as athletic skills or hip inju-
ries among the elderly.
mos82599_05_c05_135-180.indd 157 2/11/16 8:24 AM
© 2016 Bridgepoint Education, Inc. All rights reserved. Not for
resale or redistribution.
158
Dynamic
base
Step length
Step width
Gait ParametersClothDisposableNaked
(a) (b)
Section 5.3 Motor Development and Decline
For the most part, accelerating early physical milestones like
walking is probably unneces-
sary in most developed nations. Parents may want to show off
that their not-yet-one-year-old
is walking, but the fact is that children will learn to walk
anyway. The child who was pushed
to walk early may simply begin walking at 12 months instead of
12 months and 2 weeks. So
while Karasik et al. (2010) explain that “the field suffers from
long-standing assumptions of
universality based on norms established with [Western]
populations” (p. 95), a strong case
has yet to be made against the continued use of those norms.
Whether milestones are repre-
sentative of and appropriate for non-Western-educated
populations appears to be an impor-
tant question for further research.
Figure 5.13: Environmental context on walking behavior
Footprint paths of a single child in three conditions show that
diapers change walking behavior.
When children are naked, they demonstrate the most mature
gait.
Source: Adapted from Go naked: Diapers affect infant walking,
by Whitney G. Cole, Jesse M. Lingeman and Karen E. Adolph.
Developmental Science, Volume 15, Issue 6, pages 783–790,
November 2012. John Wiley & Sons. . 2012 Blackwell
Publishing Ltd.
Dynamic
base
Step length
Step width
Gait ParametersClothDisposableNaked
(a) (b)
mos82599_05_c05_135-180.indd 158 2/11/16 8:24 AM
© 2016 Bridgepoint Education, Inc. All rights reserved. Not for
resale or redistribution.
159
Section 5.4 Physical Aging in Adulthood
5.4 Physical Aging in Adulthood
Overall, two key processes influence
aging processes such as decline in stat-
ure. The first process includes gradual
but inevitable physical changes that
occur in adulthood over the years.
This type of biological change, or pri-
mary aging, is responsible for gray
hair, wrinkles, and reduced efficiency
of the body’s respiratory, circula-
tory, and digestive systems. Primary
aging is unavoidable, regardless of
how healthy a person is, since it is
programmed into our species. On the
other hand, secondary aging results
from disease, poor health habits, and
environmental hazards. These factors
are more individualized, and will be a
primary topic of Chapter 6.
Theoretical perspectives on primary
aging generally fall into two catego-
ries: programmed aging and damage theories. Despite advances
in molecular biology and
genetics, no single theory exists that adequately explains the
limitations of the human lifes-
pan (Kunlin, 2010). Most likely, the interaction among the
various theories may ultimately
provide the best explanation for why our bodies age.
Programmed Theories of Aging
Programmed theories of aging (also called adaptive theories)
suggest that there are bio-
logical and genetic limits to how long we can live. From this
perspective, our bodies are “pro-
grammed” to last for a certain amount of time, based on a
biologic timetable. Some people
who live longer than others may inherit a cell structure that has
more potential to regenerate
rather than turn self-destructive (Davidovic et al., 2010;
Guarner & Rubio-Ruiz, 2012). We use
the term senescence to describe the biological decline brought
about by aging. Senescence
decreases immune system functioning and increases our
vulnerability to infections, which
threatens our ability to survive (Castelo-Branco & Soveral,
2014).
Eric Raptosh Photography/Blend Images/Superstock
Getting gray hair, wrinkles, and other signs of
primary aging are unavoidable because the physical
changes are programmed into our bodies.
Section Review
How does motor ability change from infancy through old age?
Give a brief outline of the
changes in motor behavior that take place across the lifespan,
and consider the possible influ-
ences of gender and culture on such changes.
mos82599_05_c05_135-180.indd 159 2/11/16 8:24 AM
© 2016 Bridgepoint Education, Inc. All rights reserved. Not for
resale or redistribution.
160
Section 5.4 Physical Aging in Adulthood
But none of these theories taken alone can account for the
complexity of aging. In fact, sci-
entists know that genes become unstable, hormones diminish,
and immunity weakens as
part of the aging process, but a great deal is still unknown about
how these changes hap-
pen. Researchers would like to better understand programmed
aging so they can eventually
discover a way to reprogram certain aspects of aging to lower
the occurrence of age-related
diseases (Goldsmith, 2008).
Programmed Senescence
The length or duration of life is called longevity. Every species
has a specific longevity that is
a part of their cellular makeup. In 1961, Leonard Hayflick
discovered that cells divide a pre-
determined number of times. Human cells (lung, skin, muscle,
heart) divide approximately 50
times and then slowly come to a stop. The cells stay in a period
of senescence while they are
still alive but no longer divide; eventually they die (Hayflick &
Moorhead, 1961). The number
of times a cell can divide before senescence is known as the
Hayflick limit. The cells’ ability to
divide only so many times is an explanation for aging and
suggests that the human lifespan
has an upper limit.
Building on Hayflick’s discovery, other scientists have found
that cells keep track of the num-
ber of times they have divided. Chromosomes have structures
called telomeres at either end.
These have been likened to the tips of shoelaces in the way they
hold the ends of the laces
together. Each time a cell divides, the telomeres become
shorter. After numerous divisions,
the telomeres are too short to allow the cell to divide, and the
cells reach their Hayflick limit
and begin apoptosis (normal cell death) (Watts, 2011). This is
one of the origins of the idea
that we have a biological clock that limits the amount of time
we will live.
Endocrine Theory
Rather than mutating genes, the endocrine theory says that
lower hormone levels secreted
by the endocrine glands are responsible for the aging process.
Our complex endocrine sys-
tem controls the many different hormones that regulate many of
the body’s processes. The
amount of hormones decreases as we age. For example, the
onset of menopause can result
from a natural decline in reproductive hormones such as
estrogen. In middle age, as well,
growth hormone levels decline (Kunlin, 2010). It is possible
that hormones initiate the action
of certain genes being switched on or off, a process that may
also be impacted by epigenetics.
Immunological Theory
Immunological theory claims that the immune system is
programmed to decline over time,
making us more vulnerable to disease, which promotes
mortality. Scientists suggest that the
immune system peaks during adolescence, possibly to assure the
continuation of our human
species through reproduction. The immune system helps protect
the body from harmful sub-
stances like bacteria and viruses.
Regardless of the reason, as we age, the response of the immune
system grows weaker
(Castelo-Branco & Soveral, 2014). As yet, we have failed to
identify the specific mechanisms
by which the destructive processes take place. In addition, we
do not have a complete under-
standing of how they work. And if the immune system were the
primary mechanism that
influences aging, then it is likely that diseases would be more
predictable than they are.
mos82599_05_c05_135-180.indd 160 2/11/16 8:24 AM
© 2016 Bridgepoint Education, Inc. All rights reserved. Not for
resale or redistribution.
161
Section 5.4 Physical Aging in Adulthood
Damage Theories
There are a number of damage theories, but they too have
limitations. The wear-and-tear
theory makes intuitive sense as it compares the body to a
machine. Like a new vehicle or other
machine, the body can simply wear out. If you buy a new car,
eventually you will begin to see
signs of damage—the fenders get scratched, the brakes wear
out, and the tires lose their
tread. The more you use it, the more wear and tear will occur.
Likewise, over time the body
experiences damages that add up until there is a failure of a
critical organ, such as the heart.
Comparing a body to a machine makes this theory seem
reasonable because the more we use
our bodies, the more it seems like “parts” deteriorate. For
instance, a common way to describe
aching joints is that they are “worn out.” The number of older
people who lose cartilage in
their joints and undergo joint replacement surgery provides
support for this theory.
On the other hand, a limitation of this
theory is that it fails to explain why
repeated use has the potential to cre-
ate positive effect by maintaining flex-
ibility and improving overall health.
Adults who stress their joints and
organs through exercise increase their
overall health. On average, people who
are active throughout their lifetimes
outlive people who are more sedentary,
even when weight is not a consider-
ation (Moore et al., 2012). Pulmonary
(lungs) and cardiac (heart) functions
improve with more use as well.
Free Radical Theory
One specific damage theory involves a
by-product of normal cell metabolism.
Cells, the basic building block of all life,
begin by having pairs of electrons surrounding their atoms.
However, through the process
of oxidation, the atoms lose one electron, which leaves the atom
with an unpaired electron.
When an atom has only one electron instead of a pair, it is
called a free radical. These unpaired
electrons go hunting for mates, damaging cells in the process.
In order to neutralize the oxi-
dation damage, the body naturally produces antioxidants. These
scavenger molecules hunt
excess free radicals and balance the damage by converting them
into less harmful molecules
(Rahman, 2007). This process is part of normal cell functioning,
but damage occurs when
free radicals accumulate and overwhelm antioxidant defenses.
Over a lifetime, the cumula-
tive effect of free radicals causes cells to deteriorate,
malfunction, and become susceptible to
chronic age-related diseases like cancer and Alzheimer’s
disease (Indo et al., 2015; Kunlin,
2010). Furthermore, oxidation is aggravated by known health
detriments like smoking and
air pollution (Rylance et al., 2015).
It has been theorized that one way to slow the cumulative
damage is to consume a diet that
is rich in multiple types of antioxidants, like berries, broccoli,
red wine, and tea. In theory,
supplementing your body’s natural antioxidant defenses stops
free radicals from doing dam-
age and hence slows the processes of primary aging (Carocho &
Ferreira, 2013; Haryonto,
iStock/Thinkstock
It is common for people who are active throughout
their lifetimes to outlive people who are more
sedentary.
mos82599_05_c05_135-180.indd 161 2/11/16 8:24 AM
© 2016 Bridgepoint Education, Inc. All rights reserved. Not for
resale or redistribution.
162
Section 5.4 Physical Aging in Adulthood
Suksmasari, Wintergerst, & Maggini, 2015). Although this
theory makes intuitive sense, there
are still significant challenges to accepting the idea that
limiting free-radical production is
essential to reversing the aging process (e.g., Zuo, Zhou,
Pannell, Ziegler, & Best, 2015).
Signs of Aging
Once we enter adulthood, observable changes take place no
matter what we do. Aging skin
loses moisture and fat, making it dryer. It will eventually
become thinner, splotchy, and wrin-
kled. Hair turns gray and thins. These distinctions are apparent
as people look in the mirror,
but the external signs have relatively little effect on physical
health. That is, when comparing
people of the same ages who have wrinkles or hair loss versus
those who do not, there are no
differences in longevity (Schnohr, Nyboe, Lange, & Jensen,
1998). In contrast to what a mirror
might reflect, reduced organ and immune functioning are two
areas of biological aging.
Internal Systems
Throughout the lifespan, the body continues to change in
stature. Around the age of 50, height
decreases because of changes in the muscles, bones, and joints.
The tendency to become
shorter over time occurs among all races and both sexes
(Minaker, 2011). On average, men
lose 1 inch (3 cm) and women nearly 2 inches (5 cm) before
they are 70 years old. Over the 15
to 20 years after age 70, the loss in stature is doubled (Sorkin,
Muller, & Andres, 1999). As peo-
ple get older, the bones in the spine actually shrink in both
density and size, and this shrinkage
results in height reduction (Sorkin, Muller, & Andres, 1999;
Yeoum & Lee, 2011). Conditions
like Parkinson’s disease and osteoporosis contribute to more
extreme declines in height.
Like other muscles, the heart becomes less efficient beginning
in middle age. Across every
ethnic group, the heart shrinks, changes shape, and takes longer
to squeeze and relax, result-
ing in reduced blood flow (Cheng et al., 2009). And since
virtually all tissues and organs
depend on adequate blood flow, this change has a strong effect
on aging. In addition, in most
of the body’s systems, cellular energy production is reduced,
which contributes to diminished
capacity to repair itself and therefore greater physiological
stress and disease (Mangoni &
Jackson, 2004; Sonntag, Eckman, Ingraham, & Riddle, 2007).
Not all the news is bad, however.
Diet, exercise, and other protective factors can mitigate the
natural effects of advanced age.
The Skeletal System
While deterioration of internal systems has a direct effect on
mortality, changes in the skel-
etal system are not usually life threatening. They can, however,
cause secondary aging effects
related to movements and cause substantial pain and discomfort.
The two most common age-
related developments of the skeletal system are osteoporosis
and osteoarthritis.
Human bones under a microscope appear full of holes. Instead
of having a smooth, solid tex-
ture, they look more like a honeycomb (see Figure 5.14). Bones
get weaker when the “holes”
in the structures become larger. Although doctors consider this
process of osteoporosis a
disease, it is partly maturational. The loss of bone accelerates
the compression of the spinal
column, and individuals often develop a hunchback as the spine
bends forward. Osteoporosis
is the primary reason that hip fractures occur so often among
the elderly. There is strong evi-
dence that osteoporosis can be prevented or slowed.
Interventions include engaging in regu-
lar exercise, consuming adequate amounts of calcium, obtaining
enough vitamin D, avoiding
smoking, and drinking alcohol only in moderation.
mos82599_05_c05_135-180.indd 162 2/11/16 8:24 AM
© 2016 Bridgepoint Education, Inc. All rights reserved. Not for
resale or redistribution.
163
Section 5.4 Physical Aging in Adulthood
In contrast to osteoporosis, osteoarthritis (also called
degenerative joint disease) is only
partly the result of genetics and the “normal” wear and tear of
joints. It occurs when the pro-
tective soft tissue that protects the ends of bones deteriorates,
resulting in pain when bone
grinds against bone. Osteoarthritis is often the result of
secondary influences like repetitive
movement, overuse, physical traumas, and the added weight that
obese people carry (Hoot-
man, Helmick, Hannan, & Liping Pan, 2011; Murphy &
Helmick, 2012). More men than women
under 45 have osteoarthritis, probably because of different
environmental stressors (e.g.,
physical careers) on joints. In the older population, it is unclear
why more women than men
are affected. In the United States alone, over 27 million people
have osteoarthritis.
Section Review
Describe some of the changes that the body experiences during
adulthood.
Figure 5.14: Normal/osteoporotic bones under a microscope
Osteoporosis results in less dense, more porous bones (image on
right) as compared to healthy bones
(image on left).
JACOPIN/BSIP/SuperStock
mos82599_05_c05_135-180.indd 163 2/11/16 8:24 AM
© 2016 Bridgepoint Education, Inc. All rights reserved. Not for
resale or redistribution.
164
Phase 1
Pha
se 2
Section 5.5 Sensation and Perception: Touch, Smell, and Taste
5.5 Sensation and Perception: Touch, Smell, and Taste
For centuries, it has been common to talk about five senses:
vision, hearing, taste, smell, and
touch. We also have a somatosensory (body) system dedicated
to skin pressure, pain, and
temperature. The senses contain receptors that make up what
might be called an information
highway in the body. Sensation is the activation of nerves by
certain stimuli, and perception
is the interpretation of the stimuli through the senses.
Visual, auditory, olfactory, and other sensations are already
well developed and can be inter-
preted in 1-month-old infants, but since infants cannot verbally
communicate like adults, the
most common method of testing what infants can perceive is
through the process of habitu-
ation (see Figure 5.15). Like anybody else, infants stop paying
attention when they get bored
with a particular stimulus. At first, they attend to novel stimuli,
but their attention gradually
diminishes. When they finally stop responding altogether, we
say they habituate. For instance,
the first time newborns are presented with a rattle, they will
turn their heads, curious. Over
time, they will lose interest until further stimulation no longer
causes any response. They
have become habituated to the sound and sight of that particular
toy. If infants then pay atten-
tion to a different rattle that makes a new sound or looks
different, we know that they can
discriminate among different sounds, colors, or shapes of
rattles. Because they habituate to
the first rattle but pay attention to the second, we know that
they have perceived a change.
Psychologists and developmentalists can use the process of
habituation to understand and
explore an infant’s sensory and perceptual capabilities.
Figure 5.15: Habituation and dishabituation
In phase 1, the experimenter waits until the infant becomes
habituated to the pattern (uninterested
in the stimulus). In phase 2, the experimenter presents either the
original stimulus or one that is
novel. Infants who have habituated in phase 1 attend to the
original stimulus for a shorter period of
time compared to the novel one. Infants who did not participate
in phase 1 will attend equally to both
stimuli. Habituation allows us to know when infants can
discriminate between two stimuli.
Phase 1
Pha
se 2
mos82599_05_c05_135-180.indd 164 2/11/16 8:24 AM
© 2016 Bridgepoint Education, Inc. All rights reserved. Not for
resale or redistribution.
165
Section 5.5 Sensation and Perception: Touch, Smell, and Taste
Later in life, when and how a change in the senses occurs will
vary by individual. But for most
individuals, senses will begin changing during middle
adulthood, with the exception of vision,
which may begin to change earlier. These developments are
gradual and only noticeable later.
Important new research suggests that there is a link between the
strength of various senses
as we age, and maintaining cognitive functioning (Rogers &
Langa, 2010; Velayudhan, 2015).
Psychology in Action: Habituation
If you have children, you know that the coolest toys, the ones
children really like, are those
that are at someone else’s house. So you go out and purchase
one of those cool toys, only to
find your child is bored with it. When you go back to the other
house, your child again finds
that there are cooler toys there. Buying one of those new toys
will once again leave you disap-
pointed. Understanding habituation can save you money and
some frustration. Like anyone
else, children are attracted to novel stimuli. Children become
habituated to their own toys,
whereas toys that someone else has are new and exciting. So
how can you combat this natural
process?
One way is to use different containers for toys and activities.
When every toy is always avail-
able, children habituate to all of them. If, instead, containers of
toys are rotated every few
weeks, they remain fresh and novel whenever they appear
(dishabituation). Many parents
make the mistake of constantly buying toys to keep their
children stimulated, when they may
have enough already.
Touch
We know that touch is important for infants (see Chapter 4). It
stimulates growth and show-
cases the beginning of psychosocial development. Studies with
orphans who are deprived of
touch have repeatedly shown that reciprocal physical
interactions during early infancy and
childhood are essential to healthy development (Carlson,
Hostinar, Mliner, & Gunnar, 2014).
One demonstration of touch occurred when French researchers
used the process of habitu-
ation to see if 45 full-term neonates could tell the difference
between a prism and a cylinder
(Streri, Lhote, & Dutilleul, 2000). The objects were first placed
into the children’s palms; the
grasping reflex caused the neonates to reflexively grab on to
them. Approximately half the
neonates were given prisms, and the others were given
cylinders. The children would eventu-
ally drop the object, but the research team would place it back
into the palm. This pattern was
repeated through nine trials. By the ninth trial, the children held
the object, on average, for
less than half the time of the first trial. They had begun to
habituate.
The second part of the experiment involved placing the other
object in the palm after the
ninth trial. That is, if the neonate was in the cylinder group, he
or she was given a prism, and
vice versa. On average, the children held on to the novel stimuli
more than twice as long as
on the ninth trial with the habituated object, demonstrating a
somewhat sophisticated sense
of touch. According to the authors, this study provided the first
experimental evidence of the
ability of neonates to discriminate by touch between two
different objects.
mos82599_05_c05_135-180.indd 165 2/11/16 8:24 AM
© 2016 Bridgepoint Education, Inc. All rights reserved. Not for
resale or redistribution.
166
Section 5.5 Sensation and Perception: Touch, Smell, and Taste
Beginning in late adulthood we know that advancing age is
responsible for reduced sensitiv-
ity to touch and other somatosenses, but interpreting how the
information is useful is diffi-
cult. It is anticipated that understanding how accuracy of touch
declines in old age will lead
to new discoveries in such areas as pain management and stroke
recovery, but standardized
somatosensory measures have only recently been developed
(Dunn et al., 2015; Wickrema-
ratchi & Llewelyn, 2006).
Smell and Taste
Taste and smell are intertwined and contribute to our enjoyment
of life by, among other things,
stimulating our desire to eat. In nearly all culture, food is also a
social experience, steeped in
traditions, meaningfulness, and custom. Taste and smell also
provide warning signs of danger,
such as tasting spoiled food or smelling smoke. Taste and smell
receptors are two areas of
the nervous system that are regenerative. The lifespan of these
nerve cells is limited—taste
receptors are replaced as early as every 10 days—so they must
constantly reproduce them-
selves (Hamamichi, Asano-Miyoshi, & Emori, 2006; Gaillard,
Rouquier, & Giorgi, 2004). The
ability to detect different tastes undergoes only moderate
maturational changes over time,
though environmental events, like dental procedures or
malnutrition, can have more dra-
matic effects (Su, Ching, & Grushka, 2015).
Development in Infancy
When newborns turn in the direction of one smell over another,
it indicates that they can
discriminate between the two odors. Although the sense of smell
is not as well developed in
humans as in other mammals, it appears that neonates can
discriminate among odors quite
well. If 2- to 4-day-old neonates are exposed to their own or
another baby’s amniotic fluid,
they prefer their own (Marlier, Schaal, & Soussignan, 1998).
And there is convincing evidence
that neonates prefer their mother’s smell to that of strangers,
including many studies that
show breastfed infants are attracted to both the smell of their
own mothers and the smell
of her milk (e.g., Lipchock, Reed, & Mennella, 2011). Further,
neonates who experience pain
are calmed when they smell their own mother’s milk compared
to another mother’s milk or
formula (Nishitani et al., 2009).
Experiments on odors mimic the way that infants orient toward
familiar taste. For instance,
parents who feed their infants soy-based formula (because of
allergies to animal-based for-
mulas) are often concerned when their children initially reject
the formula. However, infants
readily begin to associate the new formula with hunger relief
and soon learn to prefer its taste
to other formulas. And Zhang and Li (2007) showed that
newborns as young as 90 minutes
can discriminate among four primary tastes. Neonates were
exposed to sweet, salty, sour,
and bitter tastes and then graded on intensity of expression and
mouth actions. Over 93% of
infants showed no distinct mouth expression when introduced to
a sugar solution, compared
to only 27% for a salt solution, 3% for a sour solution, and 21%
for a bitter solution. For each
taste, infants showed a different range of expressions, as shown
in Figure 5.16.
mos82599_05_c05_135-180.indd 166 2/11/16 8:24 AM
© 2016 Bridgepoint Education, Inc. All rights reserved. Not for
resale or redistribution.
167
Section 5.5 Sensation and Perception: Touch, Smell, and Taste
Changes in Adulthood
Although there is evidence that smell and taste change with age,
it is not clear exactly how
they change. Changes in taste are likely due in part to a
shrinking number of taste and odor
receptors beginning in early adulthood, as well as the reduction
of saliva that would other-
wise release food molecules and trigger flavor; people between
70 and 85 years of age have
only about one-third as many taste buds as young adults have
(Moller, 2003). A focus of recent
research is the finding that the inability to identify odors is
associated with memory for
Figure 5.16: Infant discrimination of taste
By administering different taste solutions to 90-minute-old
babies, Zhang and Li (2007) showed that
infants can discriminate among a number of different tastes.
Facial changes in response to taste
stimuli could be categorized among nine different expressions:
Row A represents no distinct mouth
action, B is a pursing action, and C is a gaping action. Whereas
over 93% of newborns showed no
distinct mouth or facial action (A1) when exposed to a sweet
solution, nearly 70% exhibited one of
the B responses when given the sour solution. Studies like this
one show that even newborns have
well-developed taste sensitivity.
Source: Used with permission of Zhang & Li (2007).
mos82599_05_c05_135-180.indd 167 2/11/16 8:24 AM
© 2016 Bridgepoint Education, Inc. All rights reserved. Not for
resale or redistribution.
168
Section 5.6 Sensation and Perception: Hearing
specific events and with cognitive impairment in general.
Furthermore, among individuals
with specific genetic markers for Alzheimer’s disease, impaired
odor identification predicts
later dementia, even when symptoms are not yet present
(Rahayel, Frasnelli, & Joubert, 2012;
Velayudhan et al., 2015).
Section Review
What do we learn by studying smell, taste, and touch? Consider
some of the changes that occur
to each of these senses as we develop and age.
5.6 Sensation and Perception: Hearing
There are several components in the ear working together to
allow us to hear and distinguish
among different sounds. When sound waves reach the tiny hair-
like cells in the inner ear,
the hair-like cells respond to the vibrations and initiate neural
transmissions. The inner ear
contains specific kinds of sensory receptors that allow us to
distinguish between different
tones, pitch, and volume. Transmissions of sound travel via the
auditory nerve to the auditory
centers in the brain.
Development of Hearing
The structure of the ear is nearly complete in the 4-month-old
fetus. Perhaps that is why audi-
tory processing of newborns appears to be similar to that of
adults and fully functioning at
birth. Fetuses remember voices, language, rhymes, and
melodies, which we will learn more
about in Chapter 7. However, in general, sounds need to be
louder and higher in pitch than is
necessary for adults (Olsho & Gillenwater, 1989; Werner &
Gillenwater, 1990). The tendency
of adults—and even older siblings—to use the high pitched,
sing-song intonation of infant-
directed speech might be nature’s
way of responding to infant needs.
At birth, infants will startle at loud
noises and can be quieted by familiar
voices and soft sounds. By 4 months,
children notice different sounds of
toys and appear to enjoy making gur-
gling and babbling sounds. Beginning
at around 6 months, children ori-
ent towards adults who are speak-
ing to them and will understand spe-
cific nouns, like “bottle,” “Mommy,” or
“sock,” demonstrating an ability to dis-
criminate among sounds. Before long,
infants will begin speaking and learn
other aspects of language, a topic of
Chapter 8.
Blend Images/Superstock
With infant-directed speech, adults and siblings
tend to use high-pitched voices and sing-song
intonation.
mos82599_05_c05_135-180.indd 168 2/11/16 8:24 AM
© 2016 Bridgepoint Education, Inc. All rights reserved. Not for
resale or redistribution.
169
Section 5.6 Sensation and Perception: Hearing
Changes in Hearing
For most of us, hearing and other senses are taken for granted—
until and unless they are
impaired. At all ages, ears must be protected from very loud
noises. A very loud volume causes
the hair-like cells in the ear to begin to split and fray. After a
short period of loud noise, the ear
returns to normal. If the cells fray severely, as in a bomb blast,
or repeatedly, as in the constant
use of earbuds at high volume, the person may no longer be able
to hear certain tones in the
normal range (National Institute of Health, 2015a). Early
hearing loss affects many aspects of
language and learning, whereas age-related hearing loss often
barely receives notice at first.
The ability to clearly differentiate sounds begins to decline
around age 50, likely because of
changes in the way the auditory nerve transmits signals to the
brain. This next section will
consider these and other types of hearing loss.
Early Hearing Loss
When hearing of young children is impaired, it can have far-
reaching effects. Because of the
critical period for language, when children have severe hearing
loss before the age of 3, they
usually have difficulty producing oral language. But even those
who experience hearing loss
after the age of 3 often experience speech impairments. Early
auditory impairment is also
associated with difficulties in abstract thought, including
solving math problems and under-
standing concepts, which creates academic problems
(Marschark, 2003a, 2003b). It is theo-
rized that these cognitive deficits are due to the ways in which
those with hearing impair-
ments process language, but clear evidence about the causal
factors behind differences in
cognition has remained elusive. Without hearing aids or
cochlear implants, children with
hearing loss risk psychosocial problems, such as low self-
esteem, because of poor communi-
cation skills. However, upon receiving hearing aids or cochlear
implants, self-esteem sharply
rises, even surpassing that of non-hearing impaired peers
(Theunissen et al., 2014; Warner-
Czyz, Loy, Evans, Wetsel, & Tobey, 2015).
Activity
Cochlear implants can help provide a sense of sound for those
who have severe hearing loss or
are deaf. Visit the National Institute on Deafness and Other
Communication Disorders to learn
more about these implants
(http://www.nidcd.nih.gov/health/hearing/pages/coch.aspx).
Some parents of deaf children are in favor of cochlear implants
but others are not. Why might
some parents decide to reject this technology?
Noise-Induced Hearing Loss
During adolescence, contemporary teens may be particularly
vulnerable to hearing problems.
Music players, concerts, home theaters, and outdoor power tools
have a cumulative effect that
can cause sensorineural hearing loss by damaging auditory
receptors in the ear, or the neural
pathways that lead from the ear to the brain. At present, this
type of hearing loss cannot be
repaired. How long does it take for loud music or other noise to
cause permanent damage to
the auditory system? A simple blast of a firearm or exposure to
loud music over just several
months can cause permanent hearing damage called noise-
induced hearing loss (Harrison,
mos82599_05_c05_135-180.indd 169 2/11/16 8:24 AM
© 2016 Bridgepoint Education, Inc. All rights reserved. Not for
resale or redistribution.
http://www.nidcd.nih.gov/health/hearing/pages/coch.aspx
170
Section 5.7 Sensation and Perception: Vision
2008; Segal, Eviatar, Lapinsky, Shlamkovitch, & Kessler,
2003). By the time North American
teenagers graduate from high school, up to one out of five will
have noise-related preventable
hearing loss (Sekhar, Clark, Davis, Singer, & Paul, 2014).
Evidence from both industrialized
and developing countries show similar results elsewhere as well
(Beach, Williams, & Gilliver,
2013; Biassoni et al., 2014; Zia et al., 2014).
Age-Related Hearing Loss
In contrast to noise-induced hearing loss, age-related hearing
loss (AHL), or presbycusis,
is a natural occurrence. AHL causes people to have more
difficulty differentiating sounds,
such as listening to one voice in a room full of people talking.
In addition, the ability to hear
soft sounds, such as a whisper, or higher frequency sounds, such
as a certain letter in words,
can be a struggle. As a result, older adults may sometimes think
that young people are mum-
bling. These experiences in social settings can lead the hearing
impaired to withdraw from
activities and affect quality of life (Ciorba, Bianchini, Pelucchi,
& Pastore, 2012). Though AHL
will minimally afflict about half of the population by age 65, a
significant proportion of adults
do not self-report a hearing loss (Gopinath et al., 2009). This
finding highlights the subtle
nature of AHL; the majority of people with moderate hearing
loss avoid hearing aids (Firman,
2014). Studies consistently find that men on average experience
earlier hearing loss and a
greater degree of it than women, though they each suffer
deficits of slightly different frequen-
cies (e.g., Kim et al., 2010). While hearing aids have improved
considerably in recent years,
they are still far from perfect in recreating unassisted hearing.
That is, AHL typically affects
perception differently, yet hearing aids amplify all sounds
equally, creating discomfort. With
a rapidly aging population, these are important concerns.
Section Review
Describe the various types of hearing loss and how such
changes may influence the individual
affected.
5.7 Sensation and Perception: Vision
Surprisingly, neither the World Health Organization nor the
United States has systematically
collected prevalence data on typical vision. Smaller studies
exist, but they are likely to be
biased and unreliable. One survey of 14,213 adults in the United
States indicated a bit more
than half of adults have correctable refractive errors, meaning
that it is “normal” for many
people that the lens of the eye does not correctly bend, or
refract, light after it enters the
eye (Vitale, Ellwein, Cotch, Ferris, & Sperduto, 2008).
Refractive errors result in conditions
like nearsightedness (myopia) and farsightedness (hyperopia).
For them, glasses or contact
lenses prevent otherwise serious impairment. In poorer
countries, it is estimated that limited
access to prescriptive eyewear causes inadequate vision for over
165 million people (Resn-
ikoff, Pascolini, Mariotti, & Pokharel, 2008). Early visual
impairments, in particular, pose aca-
demic problems, contributing to lifelong consequences.
mos82599_05_c05_135-180.indd 170 2/11/16 8:24 AM
© 2016 Bridgepoint Education, Inc. All rights reserved. Not for
resale or redistribution.
171
most preferred least preferred
Section 5.7 Sensation and Perception: Vision
Vision in Infancy and Childhood
Even though sight is highly developed in humans, it is the least
developed of the senses at
birth. The overall structure of the eye is mostly complete when
the fetus is 4 months old, but
the retinas (where the visual receptors are located) are not fully
developed. Neonates can see
at least 12 inches (30 cm), which is about the distance from the
breast to a mother’s face. By
12 weeks postnatal, color perception may be so well developed
that infants begin to show
preferences for certain colors over others; by 30 weeks, they
can discriminate between the
slight variations of one hue (Yang, Kanazawa, & Yamaguchi,
2013; Zemach & Teller, 2007).
Though some controversy exists, infant vision is thought to
become similar to that of an adult
as early as 6 months (Cavallini et al., 2002).
Though newborn vision is not sharp, infants can perceive shapes
and patterns. Robert Fantz
(1961) famously demonstrated that even 2-week-old babies
prefer to look at patterns rather
than plain stimuli. Infants are initially interested in simple
contrasts like a bull’s eye, and by
their third month, they begin to prefer more complex patterns
(Brennan, Ames, & Moore,
1966). When given a choice among a number of objects, infants
will stare longest at a human
face (see Figure 5.17). Evolutionary psychology suggests that a
built-in preference for faces
allows infants to read the environment, increasing their chances
for survival.
Figure 5.17: Infant visual perception
Robert Fantz famously demonstrated that infants prefer to look
at more complex patterns, with
human faces being most preferred.
most preferred least preferred
In a famous experiment, Eleanor Gibson and Richard Walk
(1960) constructed a “visual cliff ”
to investigate whether or not infants had depth perception, or
the ability to perceive dis-
tance and see in three dimensions. They built an elevated glass
table, with one side consisting
of a checkerboard pattern and the other a sheet of clear glass
that gave the illusion of a cliff.
Infants aged 6–12 months were placed on the edge of the “cliff
” between the checkerboard
and the perceived drop. Then their mothers tried to coax them
over the cliff. If the infants
refused to crawl over the clear glass, it was hypothesized that
they could see that the “drop”
was dangerous because they perceived depth. With few
exceptions, the infants would not
crawl over to their mothers, indicating that infants do indeed
have depth perception. Devel-
opmentalists do not know the precise age at which infants
acquire this skill, but the visual cliff
demonstrated that humans attain the ability before they are able
to crawl.
mos82599_05_c05_135-180.indd 171 2/11/16 8:24 AM
© 2016 Bridgepoint Education, Inc. All rights reserved. Not for
resale or redistribution.
172
Section 5.7 Sensation and Perception: Vision
Other kinds of visual perception are difficult to define.
Typically, the operational definition of
normal distance vision is described as 20/20. This ratio refers to
the ability to discriminate
objects (usually letters or symbols) at 20 feet compared to the
average person at 20 feet. A
ratio of 20/40 means that you can see clearly at 20 feet what
others see at 40 feet; if you have
20/15 vision, it means you perceive objects better than most
people. Before children can accu-
rately identify objects, large scale testing is complicated. When
we know clearly that vision
is compromised, it is difficult to know how many children
suffer because there are so many
ways to define visual impairment. There are legal definitions
for blindness (vision of less
than 20/200 after using corrective lenses) and partial
sightedness (visual acuity between
20/70 and 20/200 after correction), but those definitions refer
only to distance vision. Other
children have difficulty with near vision that severely affects
reading, writing, and learning.
This contrast of the legal and practical applications of the term
visual impairment is therefore
problematic.
Vision in Adulthood
Vision typically remains somewhat consistent from middle
childhood until about 40, when
age-related changes become noticeable (Weale, 2003). A variety
of gradual changes in vision
take place as we age. The lenses of the eyes—the tissue
responsible for focusing images—
change shape and become less elastic. Muscle flexibility needed
for focusing diminishes.
Lenses become less transparent, so less light enters the eyes,
resulting in more difficulty see-
ing print material in low light conditions. Adults in their early
40s may not notice these age-
related changes when in bright light conditions, but eventually
everyone needs corrective
lenses when reading smaller print like food labels (Strenk,
Strenk, & Koretz, 2005). This age-
related loss of near vision is called presbyopia. Older adults
will find it easier to see when
lights are brighter, so menus in dimly lit restaurants can be
especially challenging when vision
is less acute.
In addition to the normal changes of presbyopia, more than half
of adults in the United States
over the age of 60 will develop a cataract, or a gradual clouding
of the lens of the eye (Gohdes,
Balamurugan, Larsen, & Maylahn, 2005). People with cataracts
may have more difficulty
viewing screen media, reading, or driving. Lights may appear to
have a halo around them or
produce excessive glare. This makes driving at night, for
example, more challenging. World-
wide, cataracts are the leading cause of blindness because they
are not often treated in the
developing world (Bourne et al., 2013). In countries with
available health care, surgery to
remove the cloudy part of the lens has become somewhat
1355Physical Development  Brain and BodyiStockThinks.docx

More Related Content

Similar to 1355Physical Development Brain and BodyiStockThinks.docx

Final project (UNDERSTANDING THE BRAIN)
Final project (UNDERSTANDING THE BRAIN)Final project (UNDERSTANDING THE BRAIN)
Final project (UNDERSTANDING THE BRAIN)
dhritigoyal3
 
Occipital Neuralgia Surgery
Occipital Neuralgia SurgeryOccipital Neuralgia Surgery
Occipital Neuralgia Surgery
Patricia Viljoen
 
chapter7.pptx
chapter7.pptxchapter7.pptx
chapter7.pptx
Kaustubh Lanje
 
chapter7.ppt
chapter7.pptchapter7.ppt
chapter7.ppt
Kaustubh Lanje
 
Neuroscience and education
Neuroscience and educationNeuroscience and education
Neuroscience and educationmrlile
 
Topic 4 The brain and neuropsychology - how does your brain affect you?
Topic 4 The brain and neuropsychology - how does your brain affect you?Topic 4 The brain and neuropsychology - how does your brain affect you?
Topic 4 The brain and neuropsychology - how does your brain affect you?
NHS England
 
MÔ HỌC HỆ THẦN KINH
MÔ HỌC HỆ THẦN KINHMÔ HỌC HỆ THẦN KINH
MÔ HỌC HỆ THẦN KINH
SoM
 
Brain-Based Learning
Brain-Based LearningBrain-Based Learning
Brain-Based Learningdrburwell
 
Understanding the Brain : The Neurobiology of Everyday Life Final Project
Understanding the Brain : The Neurobiology of Everyday Life Final ProjectUnderstanding the Brain : The Neurobiology of Everyday Life Final Project
Understanding the Brain : The Neurobiology of Everyday Life Final Project
SwethaPenmetsa2
 
Dean r berry nervous system revised 6 6-18
Dean r berry nervous system revised 6 6-18Dean r berry nervous system revised 6 6-18
Dean r berry nervous system revised 6 6-18
Riverside County Office of Education
 
Neuromarketing
NeuromarketingNeuromarketing
Neuromarketing
Melissa Moore
 
G017434861
G017434861G017434861
G017434861
IOSR Journals
 

Similar to 1355Physical Development Brain and BodyiStockThinks.docx (16)

Final project (UNDERSTANDING THE BRAIN)
Final project (UNDERSTANDING THE BRAIN)Final project (UNDERSTANDING THE BRAIN)
Final project (UNDERSTANDING THE BRAIN)
 
Occipital Neuralgia Surgery
Occipital Neuralgia SurgeryOccipital Neuralgia Surgery
Occipital Neuralgia Surgery
 
chapter7.pptx
chapter7.pptxchapter7.pptx
chapter7.pptx
 
chapter7.ppt
chapter7.pptchapter7.ppt
chapter7.ppt
 
Neuroscience and education
Neuroscience and educationNeuroscience and education
Neuroscience and education
 
Topic 4 The brain and neuropsychology - how does your brain affect you?
Topic 4 The brain and neuropsychology - how does your brain affect you?Topic 4 The brain and neuropsychology - how does your brain affect you?
Topic 4 The brain and neuropsychology - how does your brain affect you?
 
Neurophysiology complete note (hphy 305) 2
Neurophysiology complete note (hphy 305) 2Neurophysiology complete note (hphy 305) 2
Neurophysiology complete note (hphy 305) 2
 
MÔ HỌC HỆ THẦN KINH
MÔ HỌC HỆ THẦN KINHMÔ HỌC HỆ THẦN KINH
MÔ HỌC HỆ THẦN KINH
 
Brain-Based Learning
Brain-Based LearningBrain-Based Learning
Brain-Based Learning
 
Understanding the Brain : The Neurobiology of Everyday Life Final Project
Understanding the Brain : The Neurobiology of Everyday Life Final ProjectUnderstanding the Brain : The Neurobiology of Everyday Life Final Project
Understanding the Brain : The Neurobiology of Everyday Life Final Project
 
Pinel basics ch07
Pinel basics ch07Pinel basics ch07
Pinel basics ch07
 
Dean r berry human body nervous system
Dean r berry human body  nervous systemDean r berry human body  nervous system
Dean r berry human body nervous system
 
Dean r berry nervous system revised 6 6-18
Dean r berry nervous system revised 6 6-18Dean r berry nervous system revised 6 6-18
Dean r berry nervous system revised 6 6-18
 
Neuromarketing
NeuromarketingNeuromarketing
Neuromarketing
 
Neuroplasticity
NeuroplasticityNeuroplasticity
Neuroplasticity
 
G017434861
G017434861G017434861
G017434861
 

More from drennanmicah

Case Study RubricCriterionStrongAverageWeakInt.docx
Case Study RubricCriterionStrongAverageWeakInt.docxCase Study RubricCriterionStrongAverageWeakInt.docx
Case Study RubricCriterionStrongAverageWeakInt.docx
drennanmicah
 
Case Study Rubric  Directly respond to each questi.docx
Case Study Rubric   Directly respond to each questi.docxCase Study Rubric   Directly respond to each questi.docx
Case Study Rubric  Directly respond to each questi.docx
drennanmicah
 
Case Study Scenario Part 3IntroductionThis media piece exp.docx
Case Study Scenario Part 3IntroductionThis media piece exp.docxCase Study Scenario Part 3IntroductionThis media piece exp.docx
Case Study Scenario Part 3IntroductionThis media piece exp.docx
drennanmicah
 
Case Study RubricYour case study will be assessed as follows•.docx
Case Study RubricYour case study will be assessed as follows•.docxCase Study RubricYour case study will be assessed as follows•.docx
Case Study RubricYour case study will be assessed as follows•.docx
drennanmicah
 
Case study RubricCriterionOutstanding 3.75Very Good 3 .docx
Case study RubricCriterionOutstanding  3.75Very Good  3 .docxCase study RubricCriterionOutstanding  3.75Very Good  3 .docx
Case study RubricCriterionOutstanding 3.75Very Good 3 .docx
drennanmicah
 
CASE STUDY RUBRIC MICROBIOLOGY For the Case Study assig.docx
CASE STUDY RUBRIC MICROBIOLOGY  For the Case Study assig.docxCASE STUDY RUBRIC MICROBIOLOGY  For the Case Study assig.docx
CASE STUDY RUBRIC MICROBIOLOGY For the Case Study assig.docx
drennanmicah
 
Case Study Rubric .docx
Case Study Rubric                                                 .docxCase Study Rubric                                                 .docx
Case Study Rubric .docx
drennanmicah
 
Case Study ReflectionWrite a 4-5 page paper. Your written assi.docx
Case Study ReflectionWrite a 4-5 page paper. Your written assi.docxCase Study ReflectionWrite a 4-5 page paper. Your written assi.docx
Case Study ReflectionWrite a 4-5 page paper. Your written assi.docx
drennanmicah
 
Case Study Questions (Each question is worth 6 marks)1. Defi.docx
Case Study Questions (Each question is worth 6 marks)1. Defi.docxCase Study Questions (Each question is worth 6 marks)1. Defi.docx
Case Study Questions (Each question is worth 6 marks)1. Defi.docx
drennanmicah
 
Case Study Reorganizing Human Resources at ASP SoftwareRead the.docx
Case Study Reorganizing Human Resources at ASP SoftwareRead the.docxCase Study Reorganizing Human Resources at ASP SoftwareRead the.docx
Case Study Reorganizing Human Resources at ASP SoftwareRead the.docx
drennanmicah
 
Case Study Report Rubric CriterionWeakAverageStrongIdent.docx
Case Study Report Rubric CriterionWeakAverageStrongIdent.docxCase Study Report Rubric CriterionWeakAverageStrongIdent.docx
Case Study Report Rubric CriterionWeakAverageStrongIdent.docx
drennanmicah
 
Case Study Project (A) Hefty Hardware - Be sure to address each .docx
Case Study Project (A) Hefty Hardware - Be sure to address each .docxCase Study Project (A) Hefty Hardware - Be sure to address each .docx
Case Study Project (A) Hefty Hardware - Be sure to address each .docx
drennanmicah
 
Case Study Proposing a Data Gathering Approach at TLG Solutions (.docx
Case Study Proposing a Data Gathering Approach at TLG Solutions (.docxCase Study Proposing a Data Gathering Approach at TLG Solutions (.docx
Case Study Proposing a Data Gathering Approach at TLG Solutions (.docx
drennanmicah
 
Case Study Project Part I Declared JurisdictionTemplate Sta.docx
Case Study Project Part I   Declared JurisdictionTemplate Sta.docxCase Study Project Part I   Declared JurisdictionTemplate Sta.docx
Case Study Project Part I Declared JurisdictionTemplate Sta.docx
drennanmicah
 
Case Study Proposing a Data Gathering Approach at TLG Solutions.docx
Case Study Proposing a Data Gathering Approach at TLG Solutions.docxCase Study Proposing a Data Gathering Approach at TLG Solutions.docx
Case Study Proposing a Data Gathering Approach at TLG Solutions.docx
drennanmicah
 
Case Study Peer Comments In each case study, you are expected.docx
Case Study Peer Comments In each case study, you are expected.docxCase Study Peer Comments In each case study, you are expected.docx
Case Study Peer Comments In each case study, you are expected.docx
drennanmicah
 
Case Study ProblemLeadership appears as a popular agenda it.docx
Case Study ProblemLeadership appears as a popular agenda it.docxCase Study ProblemLeadership appears as a popular agenda it.docx
Case Study ProblemLeadership appears as a popular agenda it.docx
drennanmicah
 
Case Study Planning for GrowthKelly’s Sandwich Stop is one of t.docx
Case Study Planning for GrowthKelly’s Sandwich Stop is one of t.docxCase Study Planning for GrowthKelly’s Sandwich Stop is one of t.docx
Case Study Planning for GrowthKelly’s Sandwich Stop is one of t.docx
drennanmicah
 
Case Study People v. Smith, 470 NW2d 70, Michigan Supreme Court (19.docx
Case Study People v. Smith, 470 NW2d 70, Michigan Supreme Court (19.docxCase Study People v. Smith, 470 NW2d 70, Michigan Supreme Court (19.docx
Case Study People v. Smith, 470 NW2d 70, Michigan Supreme Court (19.docx
drennanmicah
 
Case Study OneBMGT 464 Portfolio Activity TwoPurposeIn thi.docx
Case Study OneBMGT 464 Portfolio Activity TwoPurposeIn thi.docxCase Study OneBMGT 464 Portfolio Activity TwoPurposeIn thi.docx
Case Study OneBMGT 464 Portfolio Activity TwoPurposeIn thi.docx
drennanmicah
 

More from drennanmicah (20)

Case Study RubricCriterionStrongAverageWeakInt.docx
Case Study RubricCriterionStrongAverageWeakInt.docxCase Study RubricCriterionStrongAverageWeakInt.docx
Case Study RubricCriterionStrongAverageWeakInt.docx
 
Case Study Rubric  Directly respond to each questi.docx
Case Study Rubric   Directly respond to each questi.docxCase Study Rubric   Directly respond to each questi.docx
Case Study Rubric  Directly respond to each questi.docx
 
Case Study Scenario Part 3IntroductionThis media piece exp.docx
Case Study Scenario Part 3IntroductionThis media piece exp.docxCase Study Scenario Part 3IntroductionThis media piece exp.docx
Case Study Scenario Part 3IntroductionThis media piece exp.docx
 
Case Study RubricYour case study will be assessed as follows•.docx
Case Study RubricYour case study will be assessed as follows•.docxCase Study RubricYour case study will be assessed as follows•.docx
Case Study RubricYour case study will be assessed as follows•.docx
 
Case study RubricCriterionOutstanding 3.75Very Good 3 .docx
Case study RubricCriterionOutstanding  3.75Very Good  3 .docxCase study RubricCriterionOutstanding  3.75Very Good  3 .docx
Case study RubricCriterionOutstanding 3.75Very Good 3 .docx
 
CASE STUDY RUBRIC MICROBIOLOGY For the Case Study assig.docx
CASE STUDY RUBRIC MICROBIOLOGY  For the Case Study assig.docxCASE STUDY RUBRIC MICROBIOLOGY  For the Case Study assig.docx
CASE STUDY RUBRIC MICROBIOLOGY For the Case Study assig.docx
 
Case Study Rubric .docx
Case Study Rubric                                                 .docxCase Study Rubric                                                 .docx
Case Study Rubric .docx
 
Case Study ReflectionWrite a 4-5 page paper. Your written assi.docx
Case Study ReflectionWrite a 4-5 page paper. Your written assi.docxCase Study ReflectionWrite a 4-5 page paper. Your written assi.docx
Case Study ReflectionWrite a 4-5 page paper. Your written assi.docx
 
Case Study Questions (Each question is worth 6 marks)1. Defi.docx
Case Study Questions (Each question is worth 6 marks)1. Defi.docxCase Study Questions (Each question is worth 6 marks)1. Defi.docx
Case Study Questions (Each question is worth 6 marks)1. Defi.docx
 
Case Study Reorganizing Human Resources at ASP SoftwareRead the.docx
Case Study Reorganizing Human Resources at ASP SoftwareRead the.docxCase Study Reorganizing Human Resources at ASP SoftwareRead the.docx
Case Study Reorganizing Human Resources at ASP SoftwareRead the.docx
 
Case Study Report Rubric CriterionWeakAverageStrongIdent.docx
Case Study Report Rubric CriterionWeakAverageStrongIdent.docxCase Study Report Rubric CriterionWeakAverageStrongIdent.docx
Case Study Report Rubric CriterionWeakAverageStrongIdent.docx
 
Case Study Project (A) Hefty Hardware - Be sure to address each .docx
Case Study Project (A) Hefty Hardware - Be sure to address each .docxCase Study Project (A) Hefty Hardware - Be sure to address each .docx
Case Study Project (A) Hefty Hardware - Be sure to address each .docx
 
Case Study Proposing a Data Gathering Approach at TLG Solutions (.docx
Case Study Proposing a Data Gathering Approach at TLG Solutions (.docxCase Study Proposing a Data Gathering Approach at TLG Solutions (.docx
Case Study Proposing a Data Gathering Approach at TLG Solutions (.docx
 
Case Study Project Part I Declared JurisdictionTemplate Sta.docx
Case Study Project Part I   Declared JurisdictionTemplate Sta.docxCase Study Project Part I   Declared JurisdictionTemplate Sta.docx
Case Study Project Part I Declared JurisdictionTemplate Sta.docx
 
Case Study Proposing a Data Gathering Approach at TLG Solutions.docx
Case Study Proposing a Data Gathering Approach at TLG Solutions.docxCase Study Proposing a Data Gathering Approach at TLG Solutions.docx
Case Study Proposing a Data Gathering Approach at TLG Solutions.docx
 
Case Study Peer Comments In each case study, you are expected.docx
Case Study Peer Comments In each case study, you are expected.docxCase Study Peer Comments In each case study, you are expected.docx
Case Study Peer Comments In each case study, you are expected.docx
 
Case Study ProblemLeadership appears as a popular agenda it.docx
Case Study ProblemLeadership appears as a popular agenda it.docxCase Study ProblemLeadership appears as a popular agenda it.docx
Case Study ProblemLeadership appears as a popular agenda it.docx
 
Case Study Planning for GrowthKelly’s Sandwich Stop is one of t.docx
Case Study Planning for GrowthKelly’s Sandwich Stop is one of t.docxCase Study Planning for GrowthKelly’s Sandwich Stop is one of t.docx
Case Study Planning for GrowthKelly’s Sandwich Stop is one of t.docx
 
Case Study People v. Smith, 470 NW2d 70, Michigan Supreme Court (19.docx
Case Study People v. Smith, 470 NW2d 70, Michigan Supreme Court (19.docxCase Study People v. Smith, 470 NW2d 70, Michigan Supreme Court (19.docx
Case Study People v. Smith, 470 NW2d 70, Michigan Supreme Court (19.docx
 
Case Study OneBMGT 464 Portfolio Activity TwoPurposeIn thi.docx
Case Study OneBMGT 464 Portfolio Activity TwoPurposeIn thi.docxCase Study OneBMGT 464 Portfolio Activity TwoPurposeIn thi.docx
Case Study OneBMGT 464 Portfolio Activity TwoPurposeIn thi.docx
 

Recently uploaded

Polish students' mobility in the Czech Republic
Polish students' mobility in the Czech RepublicPolish students' mobility in the Czech Republic
Polish students' mobility in the Czech Republic
Anna Sz.
 
Overview on Edible Vaccine: Pros & Cons with Mechanism
Overview on Edible Vaccine: Pros & Cons with MechanismOverview on Edible Vaccine: Pros & Cons with Mechanism
Overview on Edible Vaccine: Pros & Cons with Mechanism
DeeptiGupta154
 
Additional Benefits for Employee Website.pdf
Additional Benefits for Employee Website.pdfAdditional Benefits for Employee Website.pdf
Additional Benefits for Employee Website.pdf
joachimlavalley1
 
How libraries can support authors with open access requirements for UKRI fund...
How libraries can support authors with open access requirements for UKRI fund...How libraries can support authors with open access requirements for UKRI fund...
How libraries can support authors with open access requirements for UKRI fund...
Jisc
 
The approach at University of Liverpool.pptx
The approach at University of Liverpool.pptxThe approach at University of Liverpool.pptx
The approach at University of Liverpool.pptx
Jisc
 
"Protectable subject matters, Protection in biotechnology, Protection of othe...
"Protectable subject matters, Protection in biotechnology, Protection of othe..."Protectable subject matters, Protection in biotechnology, Protection of othe...
"Protectable subject matters, Protection in biotechnology, Protection of othe...
SACHIN R KONDAGURI
 
Synthetic Fiber Construction in lab .pptx
Synthetic Fiber Construction in lab .pptxSynthetic Fiber Construction in lab .pptx
Synthetic Fiber Construction in lab .pptx
Pavel ( NSTU)
 
A Strategic Approach: GenAI in Education
A Strategic Approach: GenAI in EducationA Strategic Approach: GenAI in Education
A Strategic Approach: GenAI in Education
Peter Windle
 
Home assignment II on Spectroscopy 2024 Answers.pdf
Home assignment II on Spectroscopy 2024 Answers.pdfHome assignment II on Spectroscopy 2024 Answers.pdf
Home assignment II on Spectroscopy 2024 Answers.pdf
Tamralipta Mahavidyalaya
 
2024.06.01 Introducing a competency framework for languag learning materials ...
2024.06.01 Introducing a competency framework for languag learning materials ...2024.06.01 Introducing a competency framework for languag learning materials ...
2024.06.01 Introducing a competency framework for languag learning materials ...
Sandy Millin
 
The Challenger.pdf DNHS Official Publication
The Challenger.pdf DNHS Official PublicationThe Challenger.pdf DNHS Official Publication
The Challenger.pdf DNHS Official Publication
Delapenabediema
 
Guidance_and_Counselling.pdf B.Ed. 4th Semester
Guidance_and_Counselling.pdf B.Ed. 4th SemesterGuidance_and_Counselling.pdf B.Ed. 4th Semester
Guidance_and_Counselling.pdf B.Ed. 4th Semester
Atul Kumar Singh
 
CLASS 11 CBSE B.St Project AIDS TO TRADE - INSURANCE
CLASS 11 CBSE B.St Project AIDS TO TRADE - INSURANCECLASS 11 CBSE B.St Project AIDS TO TRADE - INSURANCE
CLASS 11 CBSE B.St Project AIDS TO TRADE - INSURANCE
BhavyaRajput3
 
1.4 modern child centered education - mahatma gandhi-2.pptx
1.4 modern child centered education - mahatma gandhi-2.pptx1.4 modern child centered education - mahatma gandhi-2.pptx
1.4 modern child centered education - mahatma gandhi-2.pptx
JosvitaDsouza2
 
Introduction to AI for Nonprofits with Tapp Network
Introduction to AI for Nonprofits with Tapp NetworkIntroduction to AI for Nonprofits with Tapp Network
Introduction to AI for Nonprofits with Tapp Network
TechSoup
 
Thesis Statement for students diagnonsed withADHD.ppt
Thesis Statement for students diagnonsed withADHD.pptThesis Statement for students diagnonsed withADHD.ppt
Thesis Statement for students diagnonsed withADHD.ppt
EverAndrsGuerraGuerr
 
Welcome to TechSoup New Member Orientation and Q&A (May 2024).pdf
Welcome to TechSoup   New Member Orientation and Q&A (May 2024).pdfWelcome to TechSoup   New Member Orientation and Q&A (May 2024).pdf
Welcome to TechSoup New Member Orientation and Q&A (May 2024).pdf
TechSoup
 
CACJapan - GROUP Presentation 1- Wk 4.pdf
CACJapan - GROUP Presentation 1- Wk 4.pdfCACJapan - GROUP Presentation 1- Wk 4.pdf
CACJapan - GROUP Presentation 1- Wk 4.pdf
camakaiclarkmusic
 
Sha'Carri Richardson Presentation 202345
Sha'Carri Richardson Presentation 202345Sha'Carri Richardson Presentation 202345
Sha'Carri Richardson Presentation 202345
beazzy04
 
Chapter 3 - Islamic Banking Products and Services.pptx
Chapter 3 - Islamic Banking Products and Services.pptxChapter 3 - Islamic Banking Products and Services.pptx
Chapter 3 - Islamic Banking Products and Services.pptx
Mohd Adib Abd Muin, Senior Lecturer at Universiti Utara Malaysia
 

Recently uploaded (20)

Polish students' mobility in the Czech Republic
Polish students' mobility in the Czech RepublicPolish students' mobility in the Czech Republic
Polish students' mobility in the Czech Republic
 
Overview on Edible Vaccine: Pros & Cons with Mechanism
Overview on Edible Vaccine: Pros & Cons with MechanismOverview on Edible Vaccine: Pros & Cons with Mechanism
Overview on Edible Vaccine: Pros & Cons with Mechanism
 
Additional Benefits for Employee Website.pdf
Additional Benefits for Employee Website.pdfAdditional Benefits for Employee Website.pdf
Additional Benefits for Employee Website.pdf
 
How libraries can support authors with open access requirements for UKRI fund...
How libraries can support authors with open access requirements for UKRI fund...How libraries can support authors with open access requirements for UKRI fund...
How libraries can support authors with open access requirements for UKRI fund...
 
The approach at University of Liverpool.pptx
The approach at University of Liverpool.pptxThe approach at University of Liverpool.pptx
The approach at University of Liverpool.pptx
 
"Protectable subject matters, Protection in biotechnology, Protection of othe...
"Protectable subject matters, Protection in biotechnology, Protection of othe..."Protectable subject matters, Protection in biotechnology, Protection of othe...
"Protectable subject matters, Protection in biotechnology, Protection of othe...
 
Synthetic Fiber Construction in lab .pptx
Synthetic Fiber Construction in lab .pptxSynthetic Fiber Construction in lab .pptx
Synthetic Fiber Construction in lab .pptx
 
A Strategic Approach: GenAI in Education
A Strategic Approach: GenAI in EducationA Strategic Approach: GenAI in Education
A Strategic Approach: GenAI in Education
 
Home assignment II on Spectroscopy 2024 Answers.pdf
Home assignment II on Spectroscopy 2024 Answers.pdfHome assignment II on Spectroscopy 2024 Answers.pdf
Home assignment II on Spectroscopy 2024 Answers.pdf
 
2024.06.01 Introducing a competency framework for languag learning materials ...
2024.06.01 Introducing a competency framework for languag learning materials ...2024.06.01 Introducing a competency framework for languag learning materials ...
2024.06.01 Introducing a competency framework for languag learning materials ...
 
The Challenger.pdf DNHS Official Publication
The Challenger.pdf DNHS Official PublicationThe Challenger.pdf DNHS Official Publication
The Challenger.pdf DNHS Official Publication
 
Guidance_and_Counselling.pdf B.Ed. 4th Semester
Guidance_and_Counselling.pdf B.Ed. 4th SemesterGuidance_and_Counselling.pdf B.Ed. 4th Semester
Guidance_and_Counselling.pdf B.Ed. 4th Semester
 
CLASS 11 CBSE B.St Project AIDS TO TRADE - INSURANCE
CLASS 11 CBSE B.St Project AIDS TO TRADE - INSURANCECLASS 11 CBSE B.St Project AIDS TO TRADE - INSURANCE
CLASS 11 CBSE B.St Project AIDS TO TRADE - INSURANCE
 
1.4 modern child centered education - mahatma gandhi-2.pptx
1.4 modern child centered education - mahatma gandhi-2.pptx1.4 modern child centered education - mahatma gandhi-2.pptx
1.4 modern child centered education - mahatma gandhi-2.pptx
 
Introduction to AI for Nonprofits with Tapp Network
Introduction to AI for Nonprofits with Tapp NetworkIntroduction to AI for Nonprofits with Tapp Network
Introduction to AI for Nonprofits with Tapp Network
 
Thesis Statement for students diagnonsed withADHD.ppt
Thesis Statement for students diagnonsed withADHD.pptThesis Statement for students diagnonsed withADHD.ppt
Thesis Statement for students diagnonsed withADHD.ppt
 
Welcome to TechSoup New Member Orientation and Q&A (May 2024).pdf
Welcome to TechSoup   New Member Orientation and Q&A (May 2024).pdfWelcome to TechSoup   New Member Orientation and Q&A (May 2024).pdf
Welcome to TechSoup New Member Orientation and Q&A (May 2024).pdf
 
CACJapan - GROUP Presentation 1- Wk 4.pdf
CACJapan - GROUP Presentation 1- Wk 4.pdfCACJapan - GROUP Presentation 1- Wk 4.pdf
CACJapan - GROUP Presentation 1- Wk 4.pdf
 
Sha'Carri Richardson Presentation 202345
Sha'Carri Richardson Presentation 202345Sha'Carri Richardson Presentation 202345
Sha'Carri Richardson Presentation 202345
 
Chapter 3 - Islamic Banking Products and Services.pptx
Chapter 3 - Islamic Banking Products and Services.pptxChapter 3 - Islamic Banking Products and Services.pptx
Chapter 3 - Islamic Banking Products and Services.pptx
 

1355Physical Development Brain and BodyiStockThinks.docx

  • 1. 135 5Physical Development: Brain and Body iStock/Thinkstock Learning Objectives After completing this chapter, you should be able to: • Detail the process of nerve function and course of brain development through the lifespan. • Identify patterns of physical growth and change. • Outline major milestones in motor development. • Specify the physical signs of aging during adulthood, and distinguish between primary and secondary aging. • Describe the role of touch in psychosocial development. • Explain how our sense of smell and taste develop and change. • Compare the onset and consequences of various types of hearing loss. • Outline age-related developments in the visual system. mos82599_05_c05_135-180.indd 135 2/11/16 8:24 AM © 2016 Bridgepoint Education, Inc. All rights reserved. Not for
  • 2. resale or redistribution. 136 Prologue Chapter Outline Prologue 5.1 Nervous System Development Neurons and Synaptic Development Timing of Growth The Adaptive Brain The Adolescent Brain The Mature Brain 5.2 Patterns of Physical Growth Weight and Height in Early Childhood Adolescent Growth Spurt Maximum Height and Diminishing Stature 5.3 Motor Development and Decline Development in Infancy and Childhood Development in Adolescence Changes in Adulthood Sex Differences in Motor Development Physical Norms and Cultural Variations 5.4 Physical Aging in Adulthood Programmed Theories of Aging Damage Theories Signs of Aging
  • 3. 5.5 Sensation and Perception: Touch, Smell, and Taste Touch Smell and Taste 5.6 Sensation and Perception: Hearing Development of Hearing Changes in Hearing 5.7 Sensation and Perception: Vision Visions in Infancy and Childhood Vision in Adulthood Summary & Resources Prologue When my son Max was 3 years old he could consistently hit a plastic baseball onto the tall roof of his grandparents’ house. He could throw and catch better than any kid his age. It was easy to see that he had terrific hand-eye coordination and would excel in the sport. By high school, however, despite being an outstanding athlete who excelled at basketball, soccer, and other sports, Max could not have lasted a day on the baseball team. mos82599_05_c05_135-180.indd 136 2/11/16 8:24 AM © 2016 Bridgepoint Education, Inc. All rights reserved. Not for resale or redistribution. 137 Section 5.1 Nervous System Development
  • 4. What could have accounted for the change? The answer is related brain and body development. For Max, genetics and brain maturation led to exceptional hand-eye coordination at a very early age; his use of muscles that facilitated growth of baseball skills supported increased brain expansion in the areas best suited for that sport. Then, for a number of reasons, it gradually became more and more difficult for Max to find opportunities to play baseball and he became interested in other physical activities, especially basketball. Because of plasticity, his brain began to accommodate basketball skills that the environment was dictating and (literally) pruned areas involved in baseball skills that were no longer being stimulated as before. The question remains whether brain activity stimulated basketball movements or if basketball movements stimulated brain growth—or maybe there is a reciprocal interaction we don’t yet understand. Throughout the lifespan, hormonal, neuronal, and physical changes of the brain and body are unquestionably governed by programmed genes. However, as you learned with regards to critical and sensitive periods, the environment can have a profound effect on developmental trajectories. In this chapter, we will focus more on the first part of the brain and body ques- tion and explore the universal aspects of biological and physical growth. In the chapter that follows, we will account for more individual factors that affect health and physical growth and decline.
  • 5. 5.1 Nervous System Development Every physical and mental action originates with the nervous system. Without it, we would not be able to engage in any processes that define us as human. The mature nervous system consists of the brain and spinal cord, designated the central nervous system (CNS), and neu- ral tissues in the peripheral nervous system that extend away from the CNS into every other part of the body (see Figure 5.1). Beginning with a simple tube reminiscent of brains from primitive organisms, in a short time the human nervous system becomes extraordinarily complex. Neural development in humans begins when gastrulation occurs in the third week of gestation (see Chapter 3). The mesoderm sends signaling molecules to the ectoderm, which responds by forming the neural plate. This strip of neuronal stem cells will eventually configure the entire nervous system. From the neural plate, stem cells migrate and are involved in specific areas of neural circuit generation. The neural plate begins to fold and form grooves, forming the neural tube. By the end of week four, there are distinct areas that will later form the hindbrain, the midbrain, and the forebrain. These structures will form secondary structures by the end of week 7. The optical vesicle also appears during the fourth week, which will later form the eye and the optic nerve. Part of cell differentiation is dependent on proximity to the neural plate and how the cells become genetically programmed. Initial cell differentiation is expressed independent of experience,
  • 6. as the human genome directs the process. That is, cells are guided by genetic programming to become parts of various systems. Once cells reach their intended destinations, neural activity and experiences become a larger factor in determining emerging neural pathways (Cooper, 2013). The production of functioning neurons commences around post-conception day 42 and will continue for approximately 120 days (Stiles & Jernigan, 2010). mos82599_05_c05_135-180.indd 137 2/11/16 8:24 AM © 2016 Bridgepoint Education, Inc. All rights reserved. Not for resale or redistribution. 138 Brain Spinal cord Central nervous system Nerves of peripheral nervous system Section 5.1 Nervous System Development By the end of the first trimester, the fetus will display reflexes. It has also released the hor-
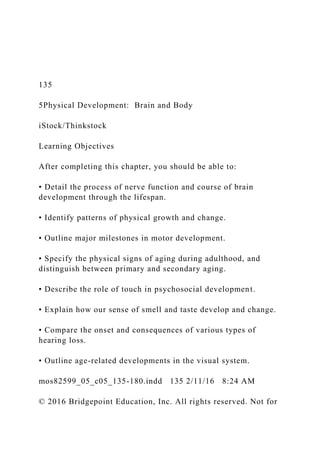
  • 7. mones that will determine the outward appearance of genitalia. The outer surface of the brain is still relatively smooth, and lacks visible gyri (ridges) and sulci (depressions). These will develop rapidly during the second trimester (Figure 5.2). Their convolutions allow for greater surface area and are probably the reason human brains are more advanced than any other species (Zilles, Palomero-Gallagher, & Amunts, 2013). However, the absolute number of brain cells is thought to be a factor in relative mammalian intelligence as well (Roth & Dicke, 2005). Figure 5.1: The nervous system The nervous system has two divisions: the central nervous system (the brain and spinal cord) and the peripheral nervous system (all of the nervous tissue located outside the brain and spinal cord). Brain Spinal cord Central nervous system Nerves of peripheral nervous system mos82599_05_c05_135-180.indd 138 2/11/16 8:24 AM © 2016 Bridgepoint Education, Inc. All rights reserved. Not for resale or redistribution.
  • 8. 139 Midbrain Forebrain Hindbrain Section 5.1 Nervous System Development During the second trimester additional structures mature and cells continue to be formed. By the end of this period, almost all neurons have been created but are yet to develop most of the connections that occur during the lifespan. Because most of the cells have been generated and structures are in place, the third trimester focuses on further sophistication of structures and systems. Neurons and Synaptic Development As is mentioned earlier in this section, the framework for the nervous system begins to form around day 14 of gestation, but its basic building block, the neuron, does not begin develop- ment until day 42. There are at least 100 billion neurons in the human brain. Although neu- rons come in many shapes and sizes, they have a number of common features. Unlike other cells, neurons communicate with each other in an elaborate electrochemical relay system. As depicted in Figure 5.3, information is first transmitted by dendrites, structures that receive
  • 9. incoming signals. The message then travels to the soma (cell body). If the signal is to be con- tinued, it travels via the axon. The transmission may be sped up by a myelin sheath, which provides electrical insulation and eventually covers most of the long, threadlike axons. Unmy- elinated fibers conduct impulses in a wave-like, energy intensive, sequential fashion. After myelination (the process of forming the sheath around the nerve), the axon is only exposed at regular gaps in the sheath, called the nodes of Ranvier. The electrical impulse cannot flow through the myelin, so it “jumps” to the next node, which might be a millimeter or more away (Morell & Quarles, 1999). This process speeds transmission of impulses and also saves energy since less surface area of the axonal membrane is used. Therefore, myelination is an important advance, as faster neural processing is necessary to move faster physically and to think in more complex ways. Figure 5.2: Major regions of the mature brain The midbrain, hindbrain, and forebrain (shown here in a mature brain) begin to appear during week four of development. The gyri and sulci (singular gyrus and sulcus) refer to the ridges and depressions of the brain. Midbrain Forebrain Hindbrain
  • 10. mos82599_05_c05_135-180.indd 139 2/11/16 8:24 AM © 2016 Bridgepoint Education, Inc. All rights reserved. Not for resale or redistribution. 140 Dendrite Nucleus Myelin sheath Terminal buttons Node of ranvier Axon Section 5.1 Nervous System Development The timing of myelination is governed by maturation. The myelination of sensory and motor neurons that are essential to early physical development is mostly complete by 40 months, whereas the neurons that are responsible for higher brain functions like reasoning and com- plex decision making are not myelinated until early adulthood. When experiences are limited, brain growth is similarly restricted. Compared to infants with richer experiences, those raised
  • 11. in less stimulating environments show significant brain differences in structure, weight, and volume (Lawson, Duda, Avants, Wu, & Farah, 2013; Luby, 2015). Not surprisingly, poor nutri- tion leads to less myelin development and a general reduction in brain size, though early treatment can often reverse these negative effects (Atalabi, Lagunju, Tongo, & Akinyinka, 2010; El-Sherif, Babrs, & Ismail, 2012; Gladstone et al., 2014). Figure 5.3: The neuron The neuron is the basic element of the nervous system. Information is first received by the dendrites. The message travels to the cell body (soma). If the message is to be continued, it travels through the axon. Transmission speed is increased when the axon is covered in myelin, which allows the electrical transmission to “jump” from node to node. At the terminal buttons, neurotransmitters are released into the synapse between the sending and receiving neurons. Dendrite Nucleus Myelin sheath Terminal buttons Node of ranvier Axon
  • 12. mos82599_05_c05_135-180.indd 140 2/11/16 8:24 AM © 2016 Bridgepoint Education, Inc. All rights reserved. Not for resale or redistribution. 141 Synaptic cleftNeurotransmitter molecule Postsynaptic membrane Receptor site Presynaptic neuron Presynaptic neuron Presynaptic membrane Postsynaptic neuron Postsynaptic neuron Neural impulse
  • 13. Neural impulse Axon Axon Dendrites Synaptic vesicles Axon terminal Neurotransmitter molecule Postsynaptic membrane Receptor site Synaptic cleft Section 5.1 Nervous System Development Whether myelinated or not, neurons transmit electrochemical impulses to neighboring neu- rons (or glands or muscle fibers) at bulblike structures called terminal buttons. This trans- mission is achieved without the neurons actually touching each other. Instead, they form a synapse, or gap between the sending and receiving neurons. Every terminal button contains
  • 14. vesicles that release chemicals called neurotransmitters into the synapse (see Figure 5.4). Depending on a number of factors, especially the concentration of the specific neurotransmit- ter, the receiving neuron will either carry the message forward or not (the “all-or-none” prin- ciple). That is why sometimes people can perceive a faint sound or a distant light while at other times they cannot. The chemical messengers have either reached a particular threshold to transmit the sensory information or not. Figure 5.4: Neural transmission These neighboring neurons are able to share information using a complex process that involves transferring information as an electrical impulse within the sending neuron and as a chemical message between neurons. Synaptic cleftNeurotransmitter molecule Postsynaptic membrane Receptor site Presynaptic neuron Presynaptic neuron Presynaptic
  • 16. mos82599_05_c05_135-180.indd 141 2/11/16 8:24 AM © 2016 Bridgepoint Education, Inc. All rights reserved. Not for resale or redistribution. 142 Section 5.1 Nervous System Development Timing of Growth At birth the infant brain weighs only about 25% of its adult weight, though the head is pro- portionately closer to adult size than other body parts; because of increased mass, by 2 years old the weight of the brain will have tripled. A popular theory to explain the rapid postnatal brain growth is based in evolution. Natural selection promoted a large and more sophisti- cated brain while also providing advantage to an upright gait. The vertical posture changed the position of the pelvis and made for a narrower birth canal that limited fetal brain growth. Therefore, in order to have a large, sophisticated brain, it would need to continue growing after exiting the relatively small birth canal. So instead of a brain that is mostly developed in the womb to allow locomotion and other tasks immediately after birth (like other mammals), humans have relatively undeveloped brains that continue to need plenty of attention. Variations in synaptogenesis (synaptic growth) correspond to sensitive periods in brain development. Therefore, the rate and timing of synapse and
  • 17. dendrite formation are impor- tant to understanding development (Tierney & Nelson, 2009; Twardosz, 2012). At birth, the vast majority of synapses have yet to form, setting the stage for explosive growth. As a new object is seen, a new sound is heard, or a new movement is made, neurons branch and extend their reach to other neurons and form new synapses. Although synaptic development initially unfolds by genetic programming (maturation), experience dictates which synapses receive the most stimulation and make the most connections. Although active changes in the brain are especially noticeable for the first 20 years or more, postnatal brain development is par- ticularly concentrated during infancy and early childhood (Kolb, 2009). In just a few years, children become able to think, use language, practice most of the physical skills they will use as adults, and learn social behaviors that will aid their survival. When brain development peaks, as many as 250,000 neurons are born every minute; by the time a child is 2 years old, some cells may have up to 10,000 connections (Kolb & Gibb, 2011). Note in Figure 5.5 that synapses in the visual cortex that are responsible for sight reach peak production between the 4th and 8th postnatal months. Synapses in the more sophisticated reasoning centers of the prefrontal cortex do not peak until the 15th month; growth in lan- guage areas peaks just before infants begin to speak. Later, reasoning centers in the prefrontal cortex do not reach maturity until early adulthood. In total, our 100 billion neurons establish trillions of synapses,
  • 18. forming a complex yet inte- grated communication network. If stimulation is lacking during sensitive periods of brain development, prospects for growth, including psychosocial processes, fine and gross motor behavior, and language, can become limited (Gladstone et al., 2014; Vandersmissen & Peeters, 2015). Therefore, children must be given opportunities for new experiences and shielded from negative environmental effects like malnutrition. mos82599_05_c05_135-180.indd 142 2/11/16 8:24 AM © 2016 Bridgepoint Education, Inc. All rights reserved. Not for resale or redistribution. 143 Age in yearsAge in months 0 1 2 3-3 -2 -1 4 5 6 7 8 9 10 11 122 3 4 5 6 7 8 9 10 15 1613 1411 12 1 Visual/auditory cortex (seeing and hearing) Prefrontal cortex (higher cognitive functions) Angular gyrus/Broca’s area (language areas/speech production) R e la ti v
  • 19. e g ro w th Section 5.1 Nervous System Development The Adaptive Brain Rate and timing of physical growth in the brain also allows us to better understand the rela- tionship between sensitive periods and neuroplasticity (the ability of the brain to adapt to experience). The younger the brain, the more “uncommitted” areas there are for neuroplas- ticity to operate. Sometimes another part of the brain will assume functioning; other times, functioning cells migrate to damaged areas. (In the adult brain, much of the research in the treatment of neurodegenerative disorders like spinal cord injuries and Alzheimer’s disease focuses on this knowledge that certain stem cells can become integrated into existing circuits [Lindvall & Kokaia, 2010; Obernier, Tong, & Alvarez-Buylla, 2014]). Figure 5.5: Timing of synapse and dendrite formation The rate and timing of synapse and dendrite formation vary by age and are important to understanding development. Notice, for example, that growth in language areas peaks just before infants begin to speak.
  • 20. Source: From R. A. Thompson and C. A. Nelson, “Developmental science and the media: Early brain development,” American Psychologist, 56(1): 5–15. Copyright . 2001. Reprinted by permission of the American Psychological Association. Age in yearsAge in months 0 1 2 3-3 -2 -1 4 5 6 7 8 9 10 11 122 3 4 5 6 7 8 9 10 15 1613 1411 12 1 Visual/auditory cortex (seeing and hearing) Prefrontal cortex (higher cognitive functions) Angular gyrus/Broca’s area (language areas/speech production) R e la ti v e g ro w th mos82599_05_c05_135-180.indd 143 2/11/16 8:24 AM © 2016 Bridgepoint Education, Inc. All rights reserved. Not for resale or redistribution.
  • 21. 144 Section 5.1 Nervous System Development To facilitate neuroplasticity during early brain development, there is a massive overproduc- tion of synapses during infancy (as shown in Figure 5.6) before engaging in a process of reduc- tion, called synaptic pruning, in order to create an individual network of connections for each person. This principle of “use it or lose it” serves as a biological foundation for learning, as mentioned in the prologue. Pruning is natural and desirable because brain efficiency improves and behaves adaptively. This favoritism allows neurons that receive the most stimu- lation—and thus are interpreted as the most important—to be given space to grow more elaborate connections. Like synapse formation, timing of pruning varies depending on brain areas. In some instances, pruning is not complete until adolescence or beyond (Selemon, 2013). Not only does the brain adapt to stimulation, but if a part of the brain is damaged before it has begun its major synaptic growth, other cells can take the place of those that are damaged. For example, researchers have surgically removed brain parts of one-day old ferrets that are essential to hearing. Neural pathways that would otherwise have been eliminated through pruning replaced the missing cells and became functional for hearing instead (Sur & Leamey, 2001). In humans, when either visual or auditory loss occurs
  • 22. without damage to the brain, the area that would have been dedicated to providing sensory information is recruited for other Figure 5.6: Neuron growth and pruning According to scientists, the brain overproduces synapses during early childhood and then goes through a pruning process later. Neurons that receive the most stimulation are favored over those that receive less stimulation. Source: From Reynolds and Fletcher-Janzen, Eds, Handbook of Clinical Child Neuropsychology, Figure 4, p. 25. Copyright . 2009. Reprinted with kind permission from Springer Science+Business Media B.V. mos82599_05_c05_135-180.indd 144 2/11/16 8:24 AM © 2016 Bridgepoint Education, Inc. All rights reserved. Not for resale or redistribution. 145 Section 5.1 Nervous System Development means (Merabet & Pascual-Leone, 2010). In addition, neuroplasticity sometimes produces apparently random effects. For instance, there appears to be a complete absence of schizo- phrenia among individuals are born blind or lose vision shortly after birth (Silverstein, Wang, & Keane, 2012). For unknown reasons, the loss of some neural
  • 23. pathways apparently provides a protective factor in schizophrenia. In adults, a well-known example of neuroplasticity has been measured in London cab driv- ers, who must acquire “the Knowledge” of London streets. London taxi drivers spend 3 to 4 years learning the layout of the city and acquire an exceptional spatial representation of the streets. Not only can experienced cab drivers relate information about various routes, but areas in the brain that are responsible for spatial representation are significantly larger than in London bus drivers, who do not have to learn the Knowledge (Maguire, Woollett, & Spiers, 2006; Woollett & Maguire, 2011). The Adolescent Brain Specific kinds of stimulation continue to predict outcomes well beyond the first three years. Studies have shown that cognitive stimulation at age 4 predicts thickness of cognitive areas of the brain around 15 years later (Lawson et al., 2013). Although this study showed that stimu- lation leads to specific growth, we know that maturation provides general growth patterns as well. Gogtay and his colleagues obtained brain scans every 2 years among individuals between 5 and 20 years of age, resulting in a dynamic map of development (Gogtay et al., 2004). Figure 5.7 shows the sophistication of cortical development that is evident throughout childhood and adolescence. Well into adolescence, axons continue to grow and expand connections, supplanting cell bodies in the process. Basic sensory and motor functions mature first, coin-
  • 24. ciding with the basic learning outcomes of infancy. Speech and language areas come next. The areas in the frontal lobe (one of the four major brain divisions, including the parietal, occipi- tal, and temporal lobes) that are related to judgment and the inhibition of impulses are last to develop. Adolescence also marks a second wave of overproduc- tion of synapses and neural pruning, and the architec- ture of the prefrontal cortex begins to change rapidly (Hedman, van Haren, Schnack, Kahn, & Hulshoff Pol, 2012). Because these centers are not mature until after adolescence, some researchers have speculated that immature frontal lobe development is linked to the risky behaviors that are indicative of adolescence. This possibility also raises questions about public policy and whether adolescents should be considered more like children or more like adults with regard to forensic examinations, driving, and other adult-like responsi- bilities. (See especially Bonnie & Scott, 2013, Steinberg, 2013, and Steinberg & Scott, 2003.) For instance, if judgment among teens is developmen- tally compromised, then there are implications for holding them completely accountable for crimes. Critical Thinking Should the knowledge that the reasoning centers of adolescents are not fully mature have an impact on how they are treated when they commit crimes? For further information and discussion, see Aronson (2007), Beckman (2004), Bonnie and Scott (2013), Steinberg (2013), and the case
  • 25. against Christopher Simmons (APA, 2004). mos82599_05_c05_135-180.indd 145 2/11/16 8:24 AM © 2016 Bridgepoint Education, Inc. All rights reserved. Not for resale or redistribution. 146 Section 5.1 Nervous System Development Figure 5.7: Brain development through childhood and adolescence In an extensive project to map brain development, scientists found that axons (white matter) continued to replace cell bodies (gray matter) well into adolescence. Source: Image courtesy of Paul Thompson (USC) and the NIMH. The Mature Brain After reaching its maximum mass of a little over 3 pounds by the beginning of adulthood, the cortical volume of the brain begins shrinking with age, by approximately 2 grams per year, or 1.9% per decade (DeCarli, Massaro, et al., 2005). Nevertheless, some brain parts become more active. We continue to create new neural pathways and change existing ones in adulthood as we adapt to new experiences. For instance, researchers recorded specific areas of growth and change in the brains of adults who learned a new video game
  • 26. (Kühn, Gleich, Lorenz, Linden- berger, & Gallinat, 2014). It is thought that this plasticity, along with increased neuron firing, allows brains of older adults to compensate and maintain their functionality despite the age- related loss of mass (Daselaar et al., 2015; Sale, Berardi, & Maffei, 2014). It is still unclear why some parts of the brain adapt while others do not, but exploring the rea- sons why may have important implications for understanding neurodegenerative diseases and mos82599_05_c05_135-180.indd 146 2/11/16 8:24 AM © 2016 Bridgepoint Education, Inc. All rights reserved. Not for resale or redistribution. 147 Newborn 2 years 5 years 15 years Adult Section 5.2 Patterns of Physical Growth the ability for the brain to recover from injury. For instance, evidence indicates that neural growth can be promoted in the hippocampus and other areas, possibly slowing or reversing the effects of memory loss in dementia and other chronic kinds of neurodegeneration (Gladstone et al., 2014; Ho, Hooker, Sahay, Holt, & Roffman, 2013; Regensburger, Prots, & Winner, 2014). In Chapter 6, we will consider the changes in the most common degenerative brain diseases,
  • 27. including information about the diagnosis, prevalence, and treatment of these diseases. Section Review Summarize how the transmission of neural signals occurs and outline how brain activity changes with time. 5.2 Patterns of Physical Growth Because brain volumes of infants are relatively close to adult size, the heads of infants are disproportionately large as well. On their way to adult proportions, the torso and limbs grow faster than the head. This pattern of growth is an example of directionality, one of the gen- eral principles of human growth. In this case, the direction is cephalocaudal, literally mean- ing “head to tail.” Notice from Figure 5.8 that the head represents about 25% of the body length at birth and then decreases with age. During the first 2 years, the torso and limbs quickly begin to catch up. By adulthood, the head makes up less than one-seventh of an indi- vidual’s height, or about half of the body proportion it held at infancy. Figure 5.8: Change in body proportion, by age One representation of the cephalocaudal principle is the change in body proportion by age. The proportion of head-to-body size decreases by about half from infancy to adulthood, and secondary sex characteristics develop through the teenage years until adulthood. Newborn 2 years 5 years 15 years Adult
  • 28. mos82599_05_c05_135-180.indd 147 2/11/16 8:24 AM © 2016 Bridgepoint Education, Inc. All rights reserved. Not for resale or redistribution. 148 S iz e i n t e rm s o f p e rc e n ta g
  • 29. e o f to ta l g ro w th Age in years 0 20 Birth 2 4 6 8 10 12 14 16 18 20 40 60 80 100 120 140 160
  • 30. 180 200 Lymph tissue Brain and head General growth curveGenitals Section 5.2 Patterns of Physical Growth Physical growth also occurs in a proximodistal pattern—from the inside out. The pattern begins in the prenatal environment and continues after birth, as infants learn to move their torsos before their extremities. Babies learn to use their arms to maintain balance before they use their hands and fingers to reach for an object. This pattern also overlaps the orthoge- netic principle, which states that development begins rather globally and undifferentiated, and gradually increases its differentiation. For example, when infants first eat, they are only concerned with latching onto a nipple, sucking, and swallowing. Months later, they will ori- ent their heads on their own, move their arms, and reposition their bodies. When infants are offered a bottle, they begin to coordinate actions of arms, hands, and mouth. Still later, chil- dren will learn to hold utensils, drink from a glass, and employ different manners of eating. They may learn to vary their posture or language depending on the company or where they are eating. In this way, the concept of eating transitions from a simple view of suck and swal- low to one that is highly differentiated.
  • 31. We also know conclusively that different body systems grow and mature independently. As seen in Figure 5.9, the nervous system matures quite rapidly beginning in childhood, whereas the pattern of growth of overall stature (body size) is a bit more even. And neither the timing nor the rate of sexual maturation mirrors that of either the nervous system or stature, dem- onstrating relative autonomous development of body systems. This is the principle of inde- pendence of systems. These general principles will become quite apparent as we expand on physical growth and development. Figure 5.9: Independence of systems This graph illustrates that different body systems grow and mature independently. Source: Tanner, J. M. (1962) Growth At Adolescence, 2nd ed., Oxford: Blackwell Scientific Publications. John Wiley & Sons. S iz e i n t e rm s o
  • 33. 40 60 80 100 120 140 160 180 200 Lymph tissue Brain and head General growth curveGenitals mos82599_05_c05_135-180.indd 148 2/11/16 8:24 AM © 2016 Bridgepoint Education, Inc. All rights reserved. Not for resale or redistribution. 149 2 3 4
  • 36. Weight-for-age percentiles: Girls, birth to 36 months 30 6 9 12 15 18 21 24 27 30 33 36 97th 95th 90th 75th 25th 10th 5th 50th 3rd 2 3 4 5 6 7 8 9
  • 38. 18 20 22 24 26 28 30 32 34 36 38 40 30 6 9 12 15 18 21 24 27 30 33 36 97th 95th 90th 75th 25th
  • 39. 10th 5th 50th 3rd Age (months) Weight-for-age percentiles: Boys, birth to 36 months Section 5.2 Patterns of Physical Growth Weight and Height in Early Childhood Height is perhaps the most obvious feature of physical maturation. Whether a child is short, tall, or average, doctors measure patterns of development by consistency of growth. The chart in Figure 5.10 is typical of those used by researchers and professionals in the healthcare field to gauge normal changes in weight. In this case, it does not matter much which path children follow; it is more important to see that they are following a consistent pattern and that their weight is not fluctuating excessively. Figure 5.10: CDC weight-for-age percentiles, birth to 36 months This standard growth chart shows weight-for-age percentiles for children up to 36 months old. Source: Adapted from Kuczmarski, R. J., Ogden, C. L, Guo, S. S., et al. 2000 CDC growth charts for the United States: Methods and
  • 40. development. National Center for Health Statistics. Vital Health Statistics 11(246). 2002. 2 3 4 5 6 7 8 9 10 11 12 13 14 15 16 17 18
  • 42. 36 38 40 Age (months) Weight-for-age percentiles: Girls, birth to 36 months 30 6 9 12 15 18 21 24 27 30 33 36 97th 95th 90th 75th 25th 10th 5th 50th 3rd 2 3 4 5
  • 45. 95th 90th 75th 25th 10th 5th 50th 3rd Age (months) Weight-for-age percentiles: Boys, birth to 36 months mos82599_05_c05_135-180.indd 149 2/11/16 8:24 AM © 2016 Bridgepoint Education, Inc. All rights reserved. Not for resale or redistribution. 150 Age in years 1 2 3 4 5 6 7 8 9 10 14 15 16 17 18 19 2011 12 13 GirlsBoys C
  • 47. 42 49 56 63 70 I n c h e s Age in years 1 2 3 4 5 6 7 8 9 10 14 15 16 17 18 19 2011 12 13 C e n ti m e te rs 0
  • 49. 5 I n c h e s GirlsBoys a) Average annual growth rate b) Average height Section 5.2 Patterns of Physical Growth Infants grow in length by about 50%, on average, in the first year, from a little over 20 inches (51cm) to about 30 inches (76 cm). During the second year, they add another 5 inches (13 cm). Until adolescence, the annual growth in height decreases gradually, as shown in Figure 5.11. Height can vary dramatically in poor countries where adequate nutrition is not available, like parts of India, Indonesia, and Africa. In areas where children receive sufficient nutrition, most global variations in height are due to genetic factors. For instance, children of European ancestry tend to be slightly taller than Asian children regardless of where the children reside (Deurenberg, Deurenberg-Yap, Foo, Schmidt, & Wang, 2003; Nightingale, Rudnicka, Owen, Cook, & Whincup, 2011).
  • 50. Figure 5.11: Average growth rates and heights of girls and boys in the United States Growth rates for boys and girls show similar patterns, with girls beginning the adolescent growth spurt, on average, about 2 years earlier than boys. On average, girls are taller than boys during early adolescence. After age 14, though, girls grow, on average, only a little more than 1/2 an inch (1.4 cm), whereas boys grow another 3 1/3 inches (8.5 cm). Source: Adapted from Ogden, Fryar, Carroll & Flegal, 2004. Advance Data No. 347. National Center for Health Statistics. October 27, 2004. Age in years 1 2 3 4 5 6 7 8 9 10 14 15 16 17 18 19 2011 12 13 GirlsBoys C e n ti m e te rs
  • 52. c h e s Age in years 1 2 3 4 5 6 7 8 9 10 14 15 16 17 18 19 2011 12 13 C e n ti m e te rs 0 1 2 3 4 5 6
  • 54. GirlsBoys a) Average annual growth rate b) Average height Adolescent Growth Spurt Regardless of where healthy children grow up, their bodies eventually undergo a number of physical changes that mark the transition into adulthood. Part of the tremendous change is the sudden growth in height and weight. This development is often referred to as the ado- lescent growth spurt and can add 5 inches (12.7 cm) or more in a single year. Girls begin the spurt at about age 10 and boys at about age 12 (refer back to Figure 5.11). Therefore, on average, 12-year-old girls are taller than their male counterparts. In addition, because of their earlier accelerated growth, girls on average grow only about 1/2 inch (1.4 cm) after the age of 14 years, whereas boys grow another 3 1/3 inches (8.5 cm). During this growth spurt, there are also considerable adolescent physical changes associated with sexuality, which will be explored in Chapter 12. mos82599_05_c05_135-180.indd 150 2/11/16 8:24 AM © 2016 Bridgepoint Education, Inc. All rights reserved. Not for resale or redistribution. 151 Section 5.3 Motor Development and Decline
  • 55. Maximum Height and Diminishing Stature It has been suggested that because of modern advantages in nutrition it is now possible to gain optimum genetic height, which is a function of both genetic and environmental vari- ables (Silventoinen, 2003; Steckel, 2002). It is estimated that, in modern Western societies, about 20% of final body height is due to environmental variation, including nutrition and physical stimulation; in settings with fewer resources, environmental variation is responsible for more than 20% of final height. In developing countries and among some families in the United States, food variety is limited. For instance, there are areas all over Asia where protein is lacking and rice makes up the majority of every meal. In isolated communities at higher elevations in South America, produce may be at a premium but animal protein plentiful. And in the United States, many inner-city areas lack easy access to fresh produce and children often grow up eating only limited amounts. As a result, children may lack some vitamins and minerals that are essential for growth. Therefore, heritability of height (the proportion due to genetics) increases as a function of advantages in health, nutrition, and medical science. Short stature varies inversely with both education and social position, so height can often be used as an indicator of the health and welfare of a population. For instance, in the United States the average person is nearly 3 inches (7.6 cm) taller today than when the country was founded in 1776. And during the 20th century, average body height increased throughout the
  • 56. industrialized world. From the 1870s to the 1970s alone, average height in Western European countries increased by 4.3 inches (11 cm) or nearly half of an inch per decade (Hatton & Bray, 2010). On the other hand, as people moved to cities in the 1700s and 1800s, diseases spread more easily and access to food was more inconsistent compared to when more people lived on farms (Komlos, 1998). These factors probably contributed to the finding that some cohorts occasionally had lower stature than the previous generation. However, overall, figures indi- cate that technological development has led to improved health and living conditions, includ- ing the ability to transport foods and services. Section Review Describe some universal patterns of physical growth, including stature, and how they may be influenced by contextual factors. 5.3 Motor Development and Decline As babies grow, parents anxiously look for their children to roll over, stand, and walk. Later, pediatricians will ask about catching a ball, using eating utensils, and manipulating a pencil. These normative milestones are important in the study and understanding of motor devel- opment (the ability to control and coordinate body movements). By adolescence, many teens can perform physically as well as or better than many adults. But there is tremendous indi- vidual variation, including factors related to genetics, culture, and gender that will influence how motor development will occur. As we move into middle and late adulthood, deterioration
  • 57. in motor skills is universal, but how we use our bodies throughout the lifespan will contribute substantially to the course of decline. These features of physical growth will be explored next. mos82599_05_c05_135-180.indd 151 2/11/16 8:24 AM © 2016 Bridgepoint Education, Inc. All rights reserved. Not for resale or redistribution. 152 Section 5.3 Motor Development and Decline Development in Infancy and Childhood Physical movements are categorized as either gross motor skills or fine motor skills. Gross motor skills involve large movements of the head, torso, arms, and legs. The first signs of gross motor skills related to locomotion occur when children develop the muscle control to roll over at between 2 and 3 months of age (refer to Table 5.1). Interestingly, although infancy is often associated with a crawling baby, it is not unusual for infants to skip the crawling stage and move right into cruising (walking while holding on to furniture) and then walking. In contrast, fine motor skills involve more precise dexterity of the hands and fingers, initially coordinating with vision. Following the proximal-distal pattern, infants begin to integrate gross motor abilities with smaller
  • 58. hand movements at around 4 months of age. A few months later they are able to hold a bottle, but immature brain development will at first cause them to have difficulty guiding it to their mouths. Toward the end of the first year, they will transition from using the whole-hand palmar grasp to picking up cereal and other small objects between the thumb and fore- finger using what is called the pincer grip. Infants will also begin to bang two toys together and can use eat- ing utensils and cups. These activi- ties coincide with greater mobility, as infants delight in scanning for objects, moving toward them, and picking them up with their more advanced hold. At just a few months of age, infants are becoming less dependent on oth- ers for stimulation. The second year brings added coordination between eye and hand movements. Children learn to get water from a faucet and put together and take apart simple toys. Preschoolers can manipulate pencils and crayons and can color within boundaries. They can also use safety scissors to cut out objects from paper. Well before they reach elementary school, most chil- dren are able to acquire the skills needed to accurately use a touch screen, computer key- board, and mouse. The Brazelton Neonatal Behavioral Assessment Scale (Brazelton & Nugent, 2011), Gesell Developmental Schedules (Gesell, 1925), and the Bayley Scales (Bay-
  • 59. ley, 1969) are used in various settings to assess normal developmental milestones. Together, they provide a comprehensive battery of instruments and test individ- ual variation in motor and mental skills for children up iStock/Thinkstock As children grow, they develop the ability to control and coordinate their bodies. From rolling over to feeding themselves frozen treats, these milestones are key to motor development. Critical Thinking How do changes in motor skills affect the way infants interact with their environment? mos82599_05_c05_135-180.indd 152 2/11/16 8:24 AM © 2016 Bridgepoint Education, Inc. All rights reserved. Not for resale or redistribution. 153 Section 5.3 Motor Development and Decline to 42 months, or 3 1/2 years of age. The general idea of these schedules is that development is maturational and does not change very much within a healthy population. An individual’s specific behaviors can be assessed and then compared to the norm, or average performance, of a similar group. A series of scores significantly below a
  • 60. standard often indicates a disability. Table 5.1 offers examples of milestones that might typically be evaluated. Table 5.1: Milestones in motor development, ages 0–4 years Age Behavior Fine (f ) or gross (g) motor behavior 0–6 months Exhibits reflexes — Holds head up g Rolls over g Will reach and grasp f Physically pursues objects f + g Can sit without support g Stands while holding on to a parent’s hand g Pulls self to standing position g 6–12 months Has the skill to crawl (but may not) g Walks with support g Stands alone g Cruises (walks while holding on to furniture) f + g Grasps with thumb and forefinger (pincer grip) f 12–18 months Walks without support g
  • 61. Throws objects f + g Ascends steps with help g 18–24 months Climbs f + g Turns on faucet to get water f Dresses self with help f + g Drinks from a cup f Jumps g 2–3 years Dresses self (without buttons) f + g Ascends steps unaided, alternating feet g Hops irregularly g Pours liquid from one container to another f Draws simple figures (e.g., circles, crosses, stick figures) f continued mos82599_05_c05_135-180.indd 153 2/11/16 8:24 AM © 2016 Bridgepoint Education, Inc. All rights reserved. Not for resale or redistribution.
  • 62. 154 Section 5.3 Motor Development and Decline Age Behavior Fine (f ) or gross (g) motor behavior 3–4 years Can run, jump, and ride a tricycle g Throws and catches a ball f + g Jumps 12 inches from a climber to the ground g Puts together simple puzzles f Strings beads f Cuts and pastes f Draws shapes and symbols holding pencil or crayon between thumb and first two fingers f If children are exposed to the fine motor activity necessary for musical instruments like the piano and violin, most 5-year-olds can begin to play. With some practice, the average kinder- gartener can tie shoes and easily manipulate zippers, snaps, and buttons. Though these chil- dren do not yet fully comprehend visual-spatial movement such as the trajectory of a rolling ball in soccer, a bouncing ball in basketball, or a pitched ball in baseball, they can still engage physically in those activities. Because movement is slower and reaction time is thrown off, accommodations like a batting tee (“T-Ball”) are made for
  • 63. younger elementary-school-age children. Table 5.2 includes examples of milestones that might typically be evaluated. Table 5.2: Milestones of motor development, ages 4–7 years Age Behavior Fine (f ) or gross (g) motor behavior 4–5 years Hops with purpose g Ties shoes f Descends stairs, alternating feet g Prints recognizable letters and numbers f Walks across a balance beam g 5–6 years Hand dominance usually apparent — Skips g Skips rope g Connects zippers, buttons, and snaps f Traces accurately f Copies shapes f Uses school supplies appropriately f 7 years Physical movement resembles adult movement — Uses tools f
  • 64. Can anticipate trajectory of rolling balls — Table 5.1: Milestones in motor development, ages 0–4 years (continued) mos82599_05_c05_135-180.indd 154 2/11/16 8:24 AM © 2016 Bridgepoint Education, Inc. All rights reserved. Not for resale or redistribution. 155 Section 5.3 Motor Development and Decline By late elementary school (10 or 12 years of age), children can throw a ball, run smoothly, hop, jump with purpose, and kick with great agility and skill. They show outstanding coordi- nation dribbling a soccer ball or a basketball. They have great body control on a skateboard or rollerblades. Though they still lag behind adults in strength and speed, 12-year-olds show adult-like hand-eye coordination in most physical activities, quite unlike the 6-year-old bod- ies they left behind. The advancement of physical skills also depends on brain maturation because more cognitive sophistication is required to coordinate advanced movements. For the most part, by the end of elementary school children can perform the same movements as adults, though without the same skill or strength. Although there are clear consequences of experience in motor development, inherited traits have been found
  • 65. to have a stronger effect on motor development than quality of life (Puciato, Mynarski, Rozpara, Borysiuk, & Szyguła, 2011). Among children aged 8–16, height and body fat are more highly correlated with speed and strength than social factors. That is, there is evidence that a person’s genotype indeed is a determining factor in the performance of skills that are universal to many physical endeavors. Development in Adolescence The adolescent body is decidedly adult-like. After all, puberty marks the transition into an adult body. Physical abilities of many adolescents exceed that of their parents. Notably, peak swimming ability, as measured among athletes in world competitions, occurs between 18 and 21 years of age (König et al., 2014). In contrast, motor ability, strength, speed, and coordina- tion in other physical tasks generally does not peak until the mid to late 20s (depending on the skills and muscles involved). As noted, genotype is a strong determinant in many motor abilities related to speed and strength. However, other than those aspiring to be elite ath- letes, most ordinary variations in motor abilities do not necessarily have a global impact on development. Changes in Adulthood Strength, stamina, and speed can continue to improve during the 20s. For most of us, biological declines in mobility and potential peak performance have little effect until middle adulthood (Elmenshawy, Machin, & Tanaka, 2015; Schaie, 2005). At that time, we generally begin to com- pensate for physical changes by increased anticipatory skills
  • 66. and expertise (Krampe & Char- ness, 2006; Wright, Bishop, Jackson, & Abernethy, 2011). That is, in competitions adults tend to use experience and finesse to make up for the physical losses of sarcopenia (natural muscle loss) that begin in the early 30s. In everyday tasks, older adults tend to slow down some activi- ties and break up tasks into smaller units, like using a greater number of grocery bags and per- forming some activities more slowly than previously. Sometimes the convergence of reduced coordination and osteoporosis becomes quite problematic. Compared to uncoordinated tod- dlers who fall frequently, the elderly who fall have wrists, arms, and hips that are much more fragile and farther from the ground, and thus they suffer bone fractures much more often. Critical Thinking Consider again the story about Max’s experiences with physical activities, which is provided in the chapter prologue. How would you design a research study that investigates the relationship between early motor activity and later athletic ability? mos82599_05_c05_135-180.indd 155 2/11/16 8:24 AM © 2016 Bridgepoint Education, Inc. All rights reserved. Not for resale or redistribution. 156
  • 68. Ghana India Norway Oman USA All Hands-and-knees crawling 390 360 330 300 270 240 210 180 150 120 90 Ghana India Norway Oman USA All Standing with assistance 360 330 300
  • 69. 90 Ghana India Norway Oman USA All Walking with assistance 420 390 360 330 300 270 240 210 180 150 Ghana India Norway Oman USA All Standing alone 480 450 420
  • 70. 390 360 330 180 150 Ghana India Norway Oman USA All Walking alone 510 480 450 420 390 360 330 270 300 240 210
  • 71. 180 150 Ghana India Norway Oman USA All A v e ra g e a g e o f a c h ie v e m e n t (i
  • 72. n d a y s ) Boys Girls 95% Confidence interval Section 5.3 Motor Development and Decline Sex Differences in Motor Development There is a common assumption among parents in the United States that infant girls are more advanced physically than infant boys. Overall though, it is the result of anecdotal information more than scientific evidence. As depicted in Figure 5.12, small, statistically significant differ- ences sometimes exist, but they vary by country and by behavior (WHO Multicentre Growth Reference Study Group, 2006). Importantly, when there are milestone differences between sexes within a country, it is due to culture-specific behaviors. When data are pooled for all countries and for both sexes, the size of any differences is “too small to justify sex-specific norms” (p. 71). Figure 5.12: Sex differences in motor development Statistically significant differences in motor development exist, but they are likely due to cultural differences in the way that boys and girls are treated. Overall, evidence does not justify identifying a separate set of norms for boys and girls.
  • 73. Source: de Onis, Mercedes (2006). Assessment of sex difference and heterogeneity in motor milestone attainment among populations in the WHO Multicentre Growth Reference Study. Acta Paediatricia, 450, 66–75. (Figure 1 ). Copyright © 2007 John Wiley and Sons. Published by Jon Wiley & Sons. 270 240 210 180 150 120 300 240 270 210 Sitting without support 270 240 210
  • 74. 180 150 120 90 Ghana India Norway Oman USA All Hands-and-knees crawling 390 360 330 300 270 240 210 180 150 120 90 Ghana India Norway Oman USA All
  • 75. Standing with assistance 360 330 300 90 Ghana India Norway Oman USA All Walking with assistance 420 390 360 330 300 270 240 210 180 150 Ghana India Norway Oman USA All
  • 76. Standing alone 480 450 420 390 360 330 180 150 Ghana India Norway Oman USA All Walking alone 510 480 450 420 390 360 330
  • 77. 270 300 240 210 180 150 Ghana India Norway Oman USA All A v e ra g e a g e o f a c h ie v e m
  • 78. e n t (i n d a y s ) Boys Girls 95% Confidence interval mos82599_05_c05_135-180.indd 156 2/11/16 8:24 AM © 2016 Bridgepoint Education, Inc. All rights reserved. Not for resale or redistribution. 157 Section 5.3 Motor Development and Decline As children mature, there is no doubt that sex differences in brain development affect motor behaviors and skills. Studies confirm that physical disparities exist between boys and girls because of physiological and maturational differences (e.g., Eaton & Yu, 1989; Pellegrini & Smith, 1998). Girls perform better at balancing skills like walking on a beam, balancing on one
  • 79. foot, and playing hopscotch. On the other hand, it should come as no surprise that boys gener- ally outperform girls in gross motor skills that require speed or strength. Beginning at about 3 years old, boys on average jump higher and run faster than girls. These differences are gen- erally due to variability in muscle strength. Even from birth, boys are more active than girls. Perspectives on evolution and neurobiology reveal that the greater activity level of male infants accelerates brain growth of the motor neurons needed for strength and speed. But beginning at an early age boys on average are also conditioned to be more active than girls. Adults treat girls more delicately and use softer language within 24 hours of birth, a pattern that continues during infancy (Beal, 1994; Johnson, Caskey, Rand, Tucker, & Vohr, 2014). Com- pared to their interactions with boys, mothers cuddle girls more, and they are more emotion- ally expressive, smile and talk more, and are more responsive to the needs of girls. Boys are given more latitude, whereas girls tend to be more restricted. In this way, boys may learn to be more independent, which translates to greater activity. Regardless of the reasons, boys get more practice using their motor skills, perhaps laying the groundwork for increased strength later. Physical Norms and Cultural Variations Recently it has been suggested that there is more diversity than was once thought in the acqui- sition of motor skills, providing substance for the nature- nurture debate. Karasik, Adolph,
  • 80. Tamis-LeMonda, and Bornstein (2010) argue that traditional developmental scales are based on Western-educated populations. They highlight a number of cultures in which the envi- ronment seems to play a larger role in development. For example, some cultures specifically target infant muscles that are later necessary for walking. These muscles are massaged and stretched, and infants are engaged in various motor exercises in an effort to get the children walking sooner. This treatment would be an advantage within environments where there are few safe places for children to crawl. Contemporary environmental variations can affect other kinds of movement as well, even the seemingly benign use of diapers. In a newer study, researchers asked if the relatively new cul- tural invention of various diapering practices contribute to differences in motor development and walking behavior (Cole, Lingeman, & Adolph, 2012). In many poorer countries where dia- pering is a luxury, until children are toilet trained it is typical for them to remain naked during the day. Infants who had been accustomed to walking in disposable diapers were documented walking in one of three conditions: naked, in a cloth diaper, and in a disposable diaper. The resultant footprint paths for the three conditions in Figure 5.13 were noticeably different, with the naked condition providing the most mature pattern. This study shows that cross- cultural research that compares locomotion skills may be less reliable if diapering practices are not taken into account. Furthermore, it is not clear whether the contextual differences of
  • 81. diapering lead to significant changes in later development, such as athletic skills or hip inju- ries among the elderly. mos82599_05_c05_135-180.indd 157 2/11/16 8:24 AM © 2016 Bridgepoint Education, Inc. All rights reserved. Not for resale or redistribution. 158 Dynamic base Step length Step width Gait ParametersClothDisposableNaked (a) (b) Section 5.3 Motor Development and Decline For the most part, accelerating early physical milestones like walking is probably unneces- sary in most developed nations. Parents may want to show off that their not-yet-one-year-old is walking, but the fact is that children will learn to walk anyway. The child who was pushed to walk early may simply begin walking at 12 months instead of 12 months and 2 weeks. So while Karasik et al. (2010) explain that “the field suffers from long-standing assumptions of
  • 82. universality based on norms established with [Western] populations” (p. 95), a strong case has yet to be made against the continued use of those norms. Whether milestones are repre- sentative of and appropriate for non-Western-educated populations appears to be an impor- tant question for further research. Figure 5.13: Environmental context on walking behavior Footprint paths of a single child in three conditions show that diapers change walking behavior. When children are naked, they demonstrate the most mature gait. Source: Adapted from Go naked: Diapers affect infant walking, by Whitney G. Cole, Jesse M. Lingeman and Karen E. Adolph. Developmental Science, Volume 15, Issue 6, pages 783–790, November 2012. John Wiley & Sons. . 2012 Blackwell Publishing Ltd. Dynamic base Step length Step width Gait ParametersClothDisposableNaked (a) (b) mos82599_05_c05_135-180.indd 158 2/11/16 8:24 AM © 2016 Bridgepoint Education, Inc. All rights reserved. Not for resale or redistribution.
  • 83. 159 Section 5.4 Physical Aging in Adulthood 5.4 Physical Aging in Adulthood Overall, two key processes influence aging processes such as decline in stat- ure. The first process includes gradual but inevitable physical changes that occur in adulthood over the years. This type of biological change, or pri- mary aging, is responsible for gray hair, wrinkles, and reduced efficiency of the body’s respiratory, circula- tory, and digestive systems. Primary aging is unavoidable, regardless of how healthy a person is, since it is programmed into our species. On the other hand, secondary aging results from disease, poor health habits, and environmental hazards. These factors are more individualized, and will be a primary topic of Chapter 6. Theoretical perspectives on primary aging generally fall into two catego- ries: programmed aging and damage theories. Despite advances in molecular biology and genetics, no single theory exists that adequately explains the limitations of the human lifes- pan (Kunlin, 2010). Most likely, the interaction among the various theories may ultimately provide the best explanation for why our bodies age.
  • 84. Programmed Theories of Aging Programmed theories of aging (also called adaptive theories) suggest that there are bio- logical and genetic limits to how long we can live. From this perspective, our bodies are “pro- grammed” to last for a certain amount of time, based on a biologic timetable. Some people who live longer than others may inherit a cell structure that has more potential to regenerate rather than turn self-destructive (Davidovic et al., 2010; Guarner & Rubio-Ruiz, 2012). We use the term senescence to describe the biological decline brought about by aging. Senescence decreases immune system functioning and increases our vulnerability to infections, which threatens our ability to survive (Castelo-Branco & Soveral, 2014). Eric Raptosh Photography/Blend Images/Superstock Getting gray hair, wrinkles, and other signs of primary aging are unavoidable because the physical changes are programmed into our bodies. Section Review How does motor ability change from infancy through old age? Give a brief outline of the changes in motor behavior that take place across the lifespan, and consider the possible influ- ences of gender and culture on such changes. mos82599_05_c05_135-180.indd 159 2/11/16 8:24 AM © 2016 Bridgepoint Education, Inc. All rights reserved. Not for resale or redistribution.
  • 85. 160 Section 5.4 Physical Aging in Adulthood But none of these theories taken alone can account for the complexity of aging. In fact, sci- entists know that genes become unstable, hormones diminish, and immunity weakens as part of the aging process, but a great deal is still unknown about how these changes hap- pen. Researchers would like to better understand programmed aging so they can eventually discover a way to reprogram certain aspects of aging to lower the occurrence of age-related diseases (Goldsmith, 2008). Programmed Senescence The length or duration of life is called longevity. Every species has a specific longevity that is a part of their cellular makeup. In 1961, Leonard Hayflick discovered that cells divide a pre- determined number of times. Human cells (lung, skin, muscle, heart) divide approximately 50 times and then slowly come to a stop. The cells stay in a period of senescence while they are still alive but no longer divide; eventually they die (Hayflick & Moorhead, 1961). The number of times a cell can divide before senescence is known as the Hayflick limit. The cells’ ability to divide only so many times is an explanation for aging and suggests that the human lifespan has an upper limit.
  • 86. Building on Hayflick’s discovery, other scientists have found that cells keep track of the num- ber of times they have divided. Chromosomes have structures called telomeres at either end. These have been likened to the tips of shoelaces in the way they hold the ends of the laces together. Each time a cell divides, the telomeres become shorter. After numerous divisions, the telomeres are too short to allow the cell to divide, and the cells reach their Hayflick limit and begin apoptosis (normal cell death) (Watts, 2011). This is one of the origins of the idea that we have a biological clock that limits the amount of time we will live. Endocrine Theory Rather than mutating genes, the endocrine theory says that lower hormone levels secreted by the endocrine glands are responsible for the aging process. Our complex endocrine sys- tem controls the many different hormones that regulate many of the body’s processes. The amount of hormones decreases as we age. For example, the onset of menopause can result from a natural decline in reproductive hormones such as estrogen. In middle age, as well, growth hormone levels decline (Kunlin, 2010). It is possible that hormones initiate the action of certain genes being switched on or off, a process that may also be impacted by epigenetics. Immunological Theory Immunological theory claims that the immune system is programmed to decline over time, making us more vulnerable to disease, which promotes mortality. Scientists suggest that the
  • 87. immune system peaks during adolescence, possibly to assure the continuation of our human species through reproduction. The immune system helps protect the body from harmful sub- stances like bacteria and viruses. Regardless of the reason, as we age, the response of the immune system grows weaker (Castelo-Branco & Soveral, 2014). As yet, we have failed to identify the specific mechanisms by which the destructive processes take place. In addition, we do not have a complete under- standing of how they work. And if the immune system were the primary mechanism that influences aging, then it is likely that diseases would be more predictable than they are. mos82599_05_c05_135-180.indd 160 2/11/16 8:24 AM © 2016 Bridgepoint Education, Inc. All rights reserved. Not for resale or redistribution. 161 Section 5.4 Physical Aging in Adulthood Damage Theories There are a number of damage theories, but they too have limitations. The wear-and-tear theory makes intuitive sense as it compares the body to a machine. Like a new vehicle or other machine, the body can simply wear out. If you buy a new car, eventually you will begin to see signs of damage—the fenders get scratched, the brakes wear
  • 88. out, and the tires lose their tread. The more you use it, the more wear and tear will occur. Likewise, over time the body experiences damages that add up until there is a failure of a critical organ, such as the heart. Comparing a body to a machine makes this theory seem reasonable because the more we use our bodies, the more it seems like “parts” deteriorate. For instance, a common way to describe aching joints is that they are “worn out.” The number of older people who lose cartilage in their joints and undergo joint replacement surgery provides support for this theory. On the other hand, a limitation of this theory is that it fails to explain why repeated use has the potential to cre- ate positive effect by maintaining flex- ibility and improving overall health. Adults who stress their joints and organs through exercise increase their overall health. On average, people who are active throughout their lifetimes outlive people who are more sedentary, even when weight is not a consider- ation (Moore et al., 2012). Pulmonary (lungs) and cardiac (heart) functions improve with more use as well. Free Radical Theory One specific damage theory involves a by-product of normal cell metabolism. Cells, the basic building block of all life, begin by having pairs of electrons surrounding their atoms. However, through the process of oxidation, the atoms lose one electron, which leaves the atom
  • 89. with an unpaired electron. When an atom has only one electron instead of a pair, it is called a free radical. These unpaired electrons go hunting for mates, damaging cells in the process. In order to neutralize the oxi- dation damage, the body naturally produces antioxidants. These scavenger molecules hunt excess free radicals and balance the damage by converting them into less harmful molecules (Rahman, 2007). This process is part of normal cell functioning, but damage occurs when free radicals accumulate and overwhelm antioxidant defenses. Over a lifetime, the cumula- tive effect of free radicals causes cells to deteriorate, malfunction, and become susceptible to chronic age-related diseases like cancer and Alzheimer’s disease (Indo et al., 2015; Kunlin, 2010). Furthermore, oxidation is aggravated by known health detriments like smoking and air pollution (Rylance et al., 2015). It has been theorized that one way to slow the cumulative damage is to consume a diet that is rich in multiple types of antioxidants, like berries, broccoli, red wine, and tea. In theory, supplementing your body’s natural antioxidant defenses stops free radicals from doing dam- age and hence slows the processes of primary aging (Carocho & Ferreira, 2013; Haryonto, iStock/Thinkstock It is common for people who are active throughout their lifetimes to outlive people who are more sedentary.
  • 90. mos82599_05_c05_135-180.indd 161 2/11/16 8:24 AM © 2016 Bridgepoint Education, Inc. All rights reserved. Not for resale or redistribution. 162 Section 5.4 Physical Aging in Adulthood Suksmasari, Wintergerst, & Maggini, 2015). Although this theory makes intuitive sense, there are still significant challenges to accepting the idea that limiting free-radical production is essential to reversing the aging process (e.g., Zuo, Zhou, Pannell, Ziegler, & Best, 2015). Signs of Aging Once we enter adulthood, observable changes take place no matter what we do. Aging skin loses moisture and fat, making it dryer. It will eventually become thinner, splotchy, and wrin- kled. Hair turns gray and thins. These distinctions are apparent as people look in the mirror, but the external signs have relatively little effect on physical health. That is, when comparing people of the same ages who have wrinkles or hair loss versus those who do not, there are no differences in longevity (Schnohr, Nyboe, Lange, & Jensen, 1998). In contrast to what a mirror might reflect, reduced organ and immune functioning are two areas of biological aging. Internal Systems Throughout the lifespan, the body continues to change in
  • 91. stature. Around the age of 50, height decreases because of changes in the muscles, bones, and joints. The tendency to become shorter over time occurs among all races and both sexes (Minaker, 2011). On average, men lose 1 inch (3 cm) and women nearly 2 inches (5 cm) before they are 70 years old. Over the 15 to 20 years after age 70, the loss in stature is doubled (Sorkin, Muller, & Andres, 1999). As peo- ple get older, the bones in the spine actually shrink in both density and size, and this shrinkage results in height reduction (Sorkin, Muller, & Andres, 1999; Yeoum & Lee, 2011). Conditions like Parkinson’s disease and osteoporosis contribute to more extreme declines in height. Like other muscles, the heart becomes less efficient beginning in middle age. Across every ethnic group, the heart shrinks, changes shape, and takes longer to squeeze and relax, result- ing in reduced blood flow (Cheng et al., 2009). And since virtually all tissues and organs depend on adequate blood flow, this change has a strong effect on aging. In addition, in most of the body’s systems, cellular energy production is reduced, which contributes to diminished capacity to repair itself and therefore greater physiological stress and disease (Mangoni & Jackson, 2004; Sonntag, Eckman, Ingraham, & Riddle, 2007). Not all the news is bad, however. Diet, exercise, and other protective factors can mitigate the natural effects of advanced age. The Skeletal System While deterioration of internal systems has a direct effect on mortality, changes in the skel-
  • 92. etal system are not usually life threatening. They can, however, cause secondary aging effects related to movements and cause substantial pain and discomfort. The two most common age- related developments of the skeletal system are osteoporosis and osteoarthritis. Human bones under a microscope appear full of holes. Instead of having a smooth, solid tex- ture, they look more like a honeycomb (see Figure 5.14). Bones get weaker when the “holes” in the structures become larger. Although doctors consider this process of osteoporosis a disease, it is partly maturational. The loss of bone accelerates the compression of the spinal column, and individuals often develop a hunchback as the spine bends forward. Osteoporosis is the primary reason that hip fractures occur so often among the elderly. There is strong evi- dence that osteoporosis can be prevented or slowed. Interventions include engaging in regu- lar exercise, consuming adequate amounts of calcium, obtaining enough vitamin D, avoiding smoking, and drinking alcohol only in moderation. mos82599_05_c05_135-180.indd 162 2/11/16 8:24 AM © 2016 Bridgepoint Education, Inc. All rights reserved. Not for resale or redistribution. 163 Section 5.4 Physical Aging in Adulthood
  • 93. In contrast to osteoporosis, osteoarthritis (also called degenerative joint disease) is only partly the result of genetics and the “normal” wear and tear of joints. It occurs when the pro- tective soft tissue that protects the ends of bones deteriorates, resulting in pain when bone grinds against bone. Osteoarthritis is often the result of secondary influences like repetitive movement, overuse, physical traumas, and the added weight that obese people carry (Hoot- man, Helmick, Hannan, & Liping Pan, 2011; Murphy & Helmick, 2012). More men than women under 45 have osteoarthritis, probably because of different environmental stressors (e.g., physical careers) on joints. In the older population, it is unclear why more women than men are affected. In the United States alone, over 27 million people have osteoarthritis. Section Review Describe some of the changes that the body experiences during adulthood. Figure 5.14: Normal/osteoporotic bones under a microscope Osteoporosis results in less dense, more porous bones (image on right) as compared to healthy bones (image on left). JACOPIN/BSIP/SuperStock mos82599_05_c05_135-180.indd 163 2/11/16 8:24 AM © 2016 Bridgepoint Education, Inc. All rights reserved. Not for resale or redistribution.
  • 94. 164 Phase 1 Pha se 2 Section 5.5 Sensation and Perception: Touch, Smell, and Taste 5.5 Sensation and Perception: Touch, Smell, and Taste For centuries, it has been common to talk about five senses: vision, hearing, taste, smell, and touch. We also have a somatosensory (body) system dedicated to skin pressure, pain, and temperature. The senses contain receptors that make up what might be called an information highway in the body. Sensation is the activation of nerves by certain stimuli, and perception is the interpretation of the stimuli through the senses. Visual, auditory, olfactory, and other sensations are already well developed and can be inter- preted in 1-month-old infants, but since infants cannot verbally communicate like adults, the most common method of testing what infants can perceive is through the process of habitu- ation (see Figure 5.15). Like anybody else, infants stop paying attention when they get bored with a particular stimulus. At first, they attend to novel stimuli, but their attention gradually diminishes. When they finally stop responding altogether, we say they habituate. For instance, the first time newborns are presented with a rattle, they will turn their heads, curious. Over
  • 95. time, they will lose interest until further stimulation no longer causes any response. They have become habituated to the sound and sight of that particular toy. If infants then pay atten- tion to a different rattle that makes a new sound or looks different, we know that they can discriminate among different sounds, colors, or shapes of rattles. Because they habituate to the first rattle but pay attention to the second, we know that they have perceived a change. Psychologists and developmentalists can use the process of habituation to understand and explore an infant’s sensory and perceptual capabilities. Figure 5.15: Habituation and dishabituation In phase 1, the experimenter waits until the infant becomes habituated to the pattern (uninterested in the stimulus). In phase 2, the experimenter presents either the original stimulus or one that is novel. Infants who have habituated in phase 1 attend to the original stimulus for a shorter period of time compared to the novel one. Infants who did not participate in phase 1 will attend equally to both stimuli. Habituation allows us to know when infants can discriminate between two stimuli. Phase 1 Pha se 2 mos82599_05_c05_135-180.indd 164 2/11/16 8:24 AM © 2016 Bridgepoint Education, Inc. All rights reserved. Not for resale or redistribution.
  • 96. 165 Section 5.5 Sensation and Perception: Touch, Smell, and Taste Later in life, when and how a change in the senses occurs will vary by individual. But for most individuals, senses will begin changing during middle adulthood, with the exception of vision, which may begin to change earlier. These developments are gradual and only noticeable later. Important new research suggests that there is a link between the strength of various senses as we age, and maintaining cognitive functioning (Rogers & Langa, 2010; Velayudhan, 2015). Psychology in Action: Habituation If you have children, you know that the coolest toys, the ones children really like, are those that are at someone else’s house. So you go out and purchase one of those cool toys, only to find your child is bored with it. When you go back to the other house, your child again finds that there are cooler toys there. Buying one of those new toys will once again leave you disap- pointed. Understanding habituation can save you money and some frustration. Like anyone else, children are attracted to novel stimuli. Children become habituated to their own toys, whereas toys that someone else has are new and exciting. So how can you combat this natural process?
  • 97. One way is to use different containers for toys and activities. When every toy is always avail- able, children habituate to all of them. If, instead, containers of toys are rotated every few weeks, they remain fresh and novel whenever they appear (dishabituation). Many parents make the mistake of constantly buying toys to keep their children stimulated, when they may have enough already. Touch We know that touch is important for infants (see Chapter 4). It stimulates growth and show- cases the beginning of psychosocial development. Studies with orphans who are deprived of touch have repeatedly shown that reciprocal physical interactions during early infancy and childhood are essential to healthy development (Carlson, Hostinar, Mliner, & Gunnar, 2014). One demonstration of touch occurred when French researchers used the process of habitu- ation to see if 45 full-term neonates could tell the difference between a prism and a cylinder (Streri, Lhote, & Dutilleul, 2000). The objects were first placed into the children’s palms; the grasping reflex caused the neonates to reflexively grab on to them. Approximately half the neonates were given prisms, and the others were given cylinders. The children would eventu- ally drop the object, but the research team would place it back into the palm. This pattern was repeated through nine trials. By the ninth trial, the children held the object, on average, for less than half the time of the first trial. They had begun to habituate.
  • 98. The second part of the experiment involved placing the other object in the palm after the ninth trial. That is, if the neonate was in the cylinder group, he or she was given a prism, and vice versa. On average, the children held on to the novel stimuli more than twice as long as on the ninth trial with the habituated object, demonstrating a somewhat sophisticated sense of touch. According to the authors, this study provided the first experimental evidence of the ability of neonates to discriminate by touch between two different objects. mos82599_05_c05_135-180.indd 165 2/11/16 8:24 AM © 2016 Bridgepoint Education, Inc. All rights reserved. Not for resale or redistribution. 166 Section 5.5 Sensation and Perception: Touch, Smell, and Taste Beginning in late adulthood we know that advancing age is responsible for reduced sensitiv- ity to touch and other somatosenses, but interpreting how the information is useful is diffi- cult. It is anticipated that understanding how accuracy of touch declines in old age will lead to new discoveries in such areas as pain management and stroke recovery, but standardized somatosensory measures have only recently been developed (Dunn et al., 2015; Wickrema- ratchi & Llewelyn, 2006).
  • 99. Smell and Taste Taste and smell are intertwined and contribute to our enjoyment of life by, among other things, stimulating our desire to eat. In nearly all culture, food is also a social experience, steeped in traditions, meaningfulness, and custom. Taste and smell also provide warning signs of danger, such as tasting spoiled food or smelling smoke. Taste and smell receptors are two areas of the nervous system that are regenerative. The lifespan of these nerve cells is limited—taste receptors are replaced as early as every 10 days—so they must constantly reproduce them- selves (Hamamichi, Asano-Miyoshi, & Emori, 2006; Gaillard, Rouquier, & Giorgi, 2004). The ability to detect different tastes undergoes only moderate maturational changes over time, though environmental events, like dental procedures or malnutrition, can have more dra- matic effects (Su, Ching, & Grushka, 2015). Development in Infancy When newborns turn in the direction of one smell over another, it indicates that they can discriminate between the two odors. Although the sense of smell is not as well developed in humans as in other mammals, it appears that neonates can discriminate among odors quite well. If 2- to 4-day-old neonates are exposed to their own or another baby’s amniotic fluid, they prefer their own (Marlier, Schaal, & Soussignan, 1998). And there is convincing evidence that neonates prefer their mother’s smell to that of strangers, including many studies that show breastfed infants are attracted to both the smell of their own mothers and the smell
  • 100. of her milk (e.g., Lipchock, Reed, & Mennella, 2011). Further, neonates who experience pain are calmed when they smell their own mother’s milk compared to another mother’s milk or formula (Nishitani et al., 2009). Experiments on odors mimic the way that infants orient toward familiar taste. For instance, parents who feed their infants soy-based formula (because of allergies to animal-based for- mulas) are often concerned when their children initially reject the formula. However, infants readily begin to associate the new formula with hunger relief and soon learn to prefer its taste to other formulas. And Zhang and Li (2007) showed that newborns as young as 90 minutes can discriminate among four primary tastes. Neonates were exposed to sweet, salty, sour, and bitter tastes and then graded on intensity of expression and mouth actions. Over 93% of infants showed no distinct mouth expression when introduced to a sugar solution, compared to only 27% for a salt solution, 3% for a sour solution, and 21% for a bitter solution. For each taste, infants showed a different range of expressions, as shown in Figure 5.16. mos82599_05_c05_135-180.indd 166 2/11/16 8:24 AM © 2016 Bridgepoint Education, Inc. All rights reserved. Not for resale or redistribution. 167
  • 101. Section 5.5 Sensation and Perception: Touch, Smell, and Taste Changes in Adulthood Although there is evidence that smell and taste change with age, it is not clear exactly how they change. Changes in taste are likely due in part to a shrinking number of taste and odor receptors beginning in early adulthood, as well as the reduction of saliva that would other- wise release food molecules and trigger flavor; people between 70 and 85 years of age have only about one-third as many taste buds as young adults have (Moller, 2003). A focus of recent research is the finding that the inability to identify odors is associated with memory for Figure 5.16: Infant discrimination of taste By administering different taste solutions to 90-minute-old babies, Zhang and Li (2007) showed that infants can discriminate among a number of different tastes. Facial changes in response to taste stimuli could be categorized among nine different expressions: Row A represents no distinct mouth action, B is a pursing action, and C is a gaping action. Whereas over 93% of newborns showed no distinct mouth or facial action (A1) when exposed to a sweet solution, nearly 70% exhibited one of the B responses when given the sour solution. Studies like this one show that even newborns have well-developed taste sensitivity. Source: Used with permission of Zhang & Li (2007). mos82599_05_c05_135-180.indd 167 2/11/16 8:24 AM
  • 102. © 2016 Bridgepoint Education, Inc. All rights reserved. Not for resale or redistribution. 168 Section 5.6 Sensation and Perception: Hearing specific events and with cognitive impairment in general. Furthermore, among individuals with specific genetic markers for Alzheimer’s disease, impaired odor identification predicts later dementia, even when symptoms are not yet present (Rahayel, Frasnelli, & Joubert, 2012; Velayudhan et al., 2015). Section Review What do we learn by studying smell, taste, and touch? Consider some of the changes that occur to each of these senses as we develop and age. 5.6 Sensation and Perception: Hearing There are several components in the ear working together to allow us to hear and distinguish among different sounds. When sound waves reach the tiny hair- like cells in the inner ear, the hair-like cells respond to the vibrations and initiate neural transmissions. The inner ear contains specific kinds of sensory receptors that allow us to distinguish between different tones, pitch, and volume. Transmissions of sound travel via the auditory nerve to the auditory centers in the brain. Development of Hearing
  • 103. The structure of the ear is nearly complete in the 4-month-old fetus. Perhaps that is why audi- tory processing of newborns appears to be similar to that of adults and fully functioning at birth. Fetuses remember voices, language, rhymes, and melodies, which we will learn more about in Chapter 7. However, in general, sounds need to be louder and higher in pitch than is necessary for adults (Olsho & Gillenwater, 1989; Werner & Gillenwater, 1990). The tendency of adults—and even older siblings—to use the high pitched, sing-song intonation of infant- directed speech might be nature’s way of responding to infant needs. At birth, infants will startle at loud noises and can be quieted by familiar voices and soft sounds. By 4 months, children notice different sounds of toys and appear to enjoy making gur- gling and babbling sounds. Beginning at around 6 months, children ori- ent towards adults who are speak- ing to them and will understand spe- cific nouns, like “bottle,” “Mommy,” or “sock,” demonstrating an ability to dis- criminate among sounds. Before long, infants will begin speaking and learn other aspects of language, a topic of Chapter 8. Blend Images/Superstock With infant-directed speech, adults and siblings tend to use high-pitched voices and sing-song
  • 104. intonation. mos82599_05_c05_135-180.indd 168 2/11/16 8:24 AM © 2016 Bridgepoint Education, Inc. All rights reserved. Not for resale or redistribution. 169 Section 5.6 Sensation and Perception: Hearing Changes in Hearing For most of us, hearing and other senses are taken for granted— until and unless they are impaired. At all ages, ears must be protected from very loud noises. A very loud volume causes the hair-like cells in the ear to begin to split and fray. After a short period of loud noise, the ear returns to normal. If the cells fray severely, as in a bomb blast, or repeatedly, as in the constant use of earbuds at high volume, the person may no longer be able to hear certain tones in the normal range (National Institute of Health, 2015a). Early hearing loss affects many aspects of language and learning, whereas age-related hearing loss often barely receives notice at first. The ability to clearly differentiate sounds begins to decline around age 50, likely because of changes in the way the auditory nerve transmits signals to the brain. This next section will consider these and other types of hearing loss. Early Hearing Loss When hearing of young children is impaired, it can have far-
  • 105. reaching effects. Because of the critical period for language, when children have severe hearing loss before the age of 3, they usually have difficulty producing oral language. But even those who experience hearing loss after the age of 3 often experience speech impairments. Early auditory impairment is also associated with difficulties in abstract thought, including solving math problems and under- standing concepts, which creates academic problems (Marschark, 2003a, 2003b). It is theo- rized that these cognitive deficits are due to the ways in which those with hearing impair- ments process language, but clear evidence about the causal factors behind differences in cognition has remained elusive. Without hearing aids or cochlear implants, children with hearing loss risk psychosocial problems, such as low self- esteem, because of poor communi- cation skills. However, upon receiving hearing aids or cochlear implants, self-esteem sharply rises, even surpassing that of non-hearing impaired peers (Theunissen et al., 2014; Warner- Czyz, Loy, Evans, Wetsel, & Tobey, 2015). Activity Cochlear implants can help provide a sense of sound for those who have severe hearing loss or are deaf. Visit the National Institute on Deafness and Other Communication Disorders to learn more about these implants (http://www.nidcd.nih.gov/health/hearing/pages/coch.aspx). Some parents of deaf children are in favor of cochlear implants but others are not. Why might some parents decide to reject this technology?
  • 106. Noise-Induced Hearing Loss During adolescence, contemporary teens may be particularly vulnerable to hearing problems. Music players, concerts, home theaters, and outdoor power tools have a cumulative effect that can cause sensorineural hearing loss by damaging auditory receptors in the ear, or the neural pathways that lead from the ear to the brain. At present, this type of hearing loss cannot be repaired. How long does it take for loud music or other noise to cause permanent damage to the auditory system? A simple blast of a firearm or exposure to loud music over just several months can cause permanent hearing damage called noise- induced hearing loss (Harrison, mos82599_05_c05_135-180.indd 169 2/11/16 8:24 AM © 2016 Bridgepoint Education, Inc. All rights reserved. Not for resale or redistribution. http://www.nidcd.nih.gov/health/hearing/pages/coch.aspx 170 Section 5.7 Sensation and Perception: Vision 2008; Segal, Eviatar, Lapinsky, Shlamkovitch, & Kessler, 2003). By the time North American teenagers graduate from high school, up to one out of five will have noise-related preventable hearing loss (Sekhar, Clark, Davis, Singer, & Paul, 2014). Evidence from both industrialized and developing countries show similar results elsewhere as well (Beach, Williams, & Gilliver,
  • 107. 2013; Biassoni et al., 2014; Zia et al., 2014). Age-Related Hearing Loss In contrast to noise-induced hearing loss, age-related hearing loss (AHL), or presbycusis, is a natural occurrence. AHL causes people to have more difficulty differentiating sounds, such as listening to one voice in a room full of people talking. In addition, the ability to hear soft sounds, such as a whisper, or higher frequency sounds, such as a certain letter in words, can be a struggle. As a result, older adults may sometimes think that young people are mum- bling. These experiences in social settings can lead the hearing impaired to withdraw from activities and affect quality of life (Ciorba, Bianchini, Pelucchi, & Pastore, 2012). Though AHL will minimally afflict about half of the population by age 65, a significant proportion of adults do not self-report a hearing loss (Gopinath et al., 2009). This finding highlights the subtle nature of AHL; the majority of people with moderate hearing loss avoid hearing aids (Firman, 2014). Studies consistently find that men on average experience earlier hearing loss and a greater degree of it than women, though they each suffer deficits of slightly different frequen- cies (e.g., Kim et al., 2010). While hearing aids have improved considerably in recent years, they are still far from perfect in recreating unassisted hearing. That is, AHL typically affects perception differently, yet hearing aids amplify all sounds equally, creating discomfort. With a rapidly aging population, these are important concerns. Section Review
  • 108. Describe the various types of hearing loss and how such changes may influence the individual affected. 5.7 Sensation and Perception: Vision Surprisingly, neither the World Health Organization nor the United States has systematically collected prevalence data on typical vision. Smaller studies exist, but they are likely to be biased and unreliable. One survey of 14,213 adults in the United States indicated a bit more than half of adults have correctable refractive errors, meaning that it is “normal” for many people that the lens of the eye does not correctly bend, or refract, light after it enters the eye (Vitale, Ellwein, Cotch, Ferris, & Sperduto, 2008). Refractive errors result in conditions like nearsightedness (myopia) and farsightedness (hyperopia). For them, glasses or contact lenses prevent otherwise serious impairment. In poorer countries, it is estimated that limited access to prescriptive eyewear causes inadequate vision for over 165 million people (Resn- ikoff, Pascolini, Mariotti, & Pokharel, 2008). Early visual impairments, in particular, pose aca- demic problems, contributing to lifelong consequences. mos82599_05_c05_135-180.indd 170 2/11/16 8:24 AM © 2016 Bridgepoint Education, Inc. All rights reserved. Not for resale or redistribution. 171
  • 109. most preferred least preferred Section 5.7 Sensation and Perception: Vision Vision in Infancy and Childhood Even though sight is highly developed in humans, it is the least developed of the senses at birth. The overall structure of the eye is mostly complete when the fetus is 4 months old, but the retinas (where the visual receptors are located) are not fully developed. Neonates can see at least 12 inches (30 cm), which is about the distance from the breast to a mother’s face. By 12 weeks postnatal, color perception may be so well developed that infants begin to show preferences for certain colors over others; by 30 weeks, they can discriminate between the slight variations of one hue (Yang, Kanazawa, & Yamaguchi, 2013; Zemach & Teller, 2007). Though some controversy exists, infant vision is thought to become similar to that of an adult as early as 6 months (Cavallini et al., 2002). Though newborn vision is not sharp, infants can perceive shapes and patterns. Robert Fantz (1961) famously demonstrated that even 2-week-old babies prefer to look at patterns rather than plain stimuli. Infants are initially interested in simple contrasts like a bull’s eye, and by their third month, they begin to prefer more complex patterns (Brennan, Ames, & Moore, 1966). When given a choice among a number of objects, infants will stare longest at a human face (see Figure 5.17). Evolutionary psychology suggests that a built-in preference for faces allows infants to read the environment, increasing their chances
  • 110. for survival. Figure 5.17: Infant visual perception Robert Fantz famously demonstrated that infants prefer to look at more complex patterns, with human faces being most preferred. most preferred least preferred In a famous experiment, Eleanor Gibson and Richard Walk (1960) constructed a “visual cliff ” to investigate whether or not infants had depth perception, or the ability to perceive dis- tance and see in three dimensions. They built an elevated glass table, with one side consisting of a checkerboard pattern and the other a sheet of clear glass that gave the illusion of a cliff. Infants aged 6–12 months were placed on the edge of the “cliff ” between the checkerboard and the perceived drop. Then their mothers tried to coax them over the cliff. If the infants refused to crawl over the clear glass, it was hypothesized that they could see that the “drop” was dangerous because they perceived depth. With few exceptions, the infants would not crawl over to their mothers, indicating that infants do indeed have depth perception. Devel- opmentalists do not know the precise age at which infants acquire this skill, but the visual cliff demonstrated that humans attain the ability before they are able to crawl. mos82599_05_c05_135-180.indd 171 2/11/16 8:24 AM © 2016 Bridgepoint Education, Inc. All rights reserved. Not for
  • 111. resale or redistribution. 172 Section 5.7 Sensation and Perception: Vision Other kinds of visual perception are difficult to define. Typically, the operational definition of normal distance vision is described as 20/20. This ratio refers to the ability to discriminate objects (usually letters or symbols) at 20 feet compared to the average person at 20 feet. A ratio of 20/40 means that you can see clearly at 20 feet what others see at 40 feet; if you have 20/15 vision, it means you perceive objects better than most people. Before children can accu- rately identify objects, large scale testing is complicated. When we know clearly that vision is compromised, it is difficult to know how many children suffer because there are so many ways to define visual impairment. There are legal definitions for blindness (vision of less than 20/200 after using corrective lenses) and partial sightedness (visual acuity between 20/70 and 20/200 after correction), but those definitions refer only to distance vision. Other children have difficulty with near vision that severely affects reading, writing, and learning. This contrast of the legal and practical applications of the term visual impairment is therefore problematic. Vision in Adulthood Vision typically remains somewhat consistent from middle
  • 112. childhood until about 40, when age-related changes become noticeable (Weale, 2003). A variety of gradual changes in vision take place as we age. The lenses of the eyes—the tissue responsible for focusing images— change shape and become less elastic. Muscle flexibility needed for focusing diminishes. Lenses become less transparent, so less light enters the eyes, resulting in more difficulty see- ing print material in low light conditions. Adults in their early 40s may not notice these age- related changes when in bright light conditions, but eventually everyone needs corrective lenses when reading smaller print like food labels (Strenk, Strenk, & Koretz, 2005). This age- related loss of near vision is called presbyopia. Older adults will find it easier to see when lights are brighter, so menus in dimly lit restaurants can be especially challenging when vision is less acute. In addition to the normal changes of presbyopia, more than half of adults in the United States over the age of 60 will develop a cataract, or a gradual clouding of the lens of the eye (Gohdes, Balamurugan, Larsen, & Maylahn, 2005). People with cataracts may have more difficulty viewing screen media, reading, or driving. Lights may appear to have a halo around them or produce excessive glare. This makes driving at night, for example, more challenging. World- wide, cataracts are the leading cause of blindness because they are not often treated in the developing world (Bourne et al., 2013). In countries with available health care, surgery to remove the cloudy part of the lens has become somewhat