More Related Content
Similar to 120931 morningstar quicktake
Similar to 120931 morningstar quicktake (20)
120931 morningstar quicktake
- 1. Morningstar DirectSM
| Print Date: 3. 9. 2012 Page 1 of 3
WIOF Global Listed Utilities I LU0439555946
Portfolio
Morningstar RatingsTM
Morningstar CategoryTM
Fund Size Currency
QQQQQ Europe OE Sector Equity
Utilities
2 404 584(USD ) ( 31. 8.
2012 ) USD
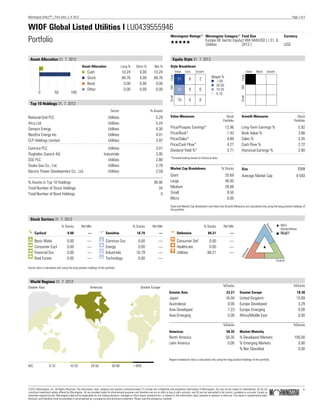
Asset Allocation 31. 7. 2012
0 50 100
Asset Allocation Long % Short % Net %
Cash 10.24 0.00 10.24
Stock 89.76 0.00 89.76
Bond 0.00 0.00 0.00
Other 0.00 0.00 0.00
Top 10 Holdings 31. 7. 2012
Sector % Assets
National Grid PLC Utilities 5.29
Atco Ltd. Utilities 5.24
Sempra Energy Utilities 4.30
NextEra Energy Inc Utilities 4.01
CLP Holdings Limited Utilities 3.97
Centrica PLC Utilities 3.01
Flughafen Zuerich AG Industrials 2.95
SSE PLC Utilities 2.80
Osaka Gas Co., Ltd. Utilities 2.79
Electric Power Development Co., Ltd. Utilities 2.59
% Assets in Top 10 Holdings 36.95
Total Number of Stock Holdings 34
Total Number of Bond Holdings 0
Equity Style 31. 7. 2012
Style Breakdown
Value Core Growth
SmallMidLarge
51 8 2
20 9 0
10 0 0
Weight %
>50
25-50
10-25
0-10
Value Blend Growth
SmallMidLarge
Value Measures Stock
Portfolio
Price/Prospec Earnings* 12.96
Price/Book* 1.43
Price/Sales* 0.89
Price/Cash Flow* 4.27
Dividend Yield %* 3.71
Growth Measures Stock
Portfolio
Long-Term Earnings % 5.92
Book Value % 3.88
Sales % 3.35
Cash Flow % 2.72
Historical Earnings % 2.80
*Forward-looking based on historical data
Market Cap Breakdown % Stocks
Giant 20.69
Large 40.93
Medium 28.88
Small 9.50
Micro 0.00
Size €Mil
Average Market Cap 9 593
Style and Market Cap Breakdown and Value and Growth Measures are calculated only using the long position holdings of
the portfolio.
Stock Sectors 31. 7. 2012
% Stocks Rel Mkt
h Cyclical 0.00 —
r Basic Matls 0.00 —
t Consumer Cycl 0.00 —
y Financial Svs 0.00 —
u Real Estate 0.00 —
% Stocks Rel Mkt
j Sensitive 10.79 —
i Commun Svs 0.00 —
o Energy 0.00 —
p Industrials 10.79 —
a Technology 0.00 —
% Stocks Rel Mkt
k Defensive 89.21 —
s Consumer Def 0.00 —
d Healthcare 0.00 —
f Utilities 89.21 —
Cyclical
Defensive
Sensitive
MSCI
World/Utilities
NR USDFund
Sector data is calculated only using the long position holdings of the portfolio.
World Regions 31. 7. 2012
Greater Asia Americas Greater Europe
N/C 0-10 10-20 20-50 50-90 >90%
%Stocks
Greater Asia 23.27
Japan 16.04
Australasia 0.00
Asia Developed 7.23
Asia Emerging 0.00
%Stocks
Americas 58.35
North America 58.35
Latin America 0.00
%Stocks
Greater Europe 18.38
United Kingdom 15.09
Europe Developed 3.29
Europe Emerging 0.00
Africa/Middle East 0.00
%Stocks
Market Maturity
% Developed Markets 100.00
% Emerging Markets 0.00
% Not Classified 0.00
Region breakdown data is calculated only using the long position holdings of the portfolio.
©2012 Morningstar, Inc. All Rights Reserved. The information, data, analyses and opinions contained herein (1) include the confidential and proprietary information of Morningstar, (2) may not be copied or redistributed, (3) do not
constitute investment advice offered by Morningstar, (4) are provided solely for informational purposes and therefore are not an offer to buy or sell a security, and (5) are not warranted to be correct, complete or accurate. Except as
otherwise required by law, Morningstar shall not be responsible for any trading decisions, damages or other losses resulting from, or related to, this information, data, analyses or opinions or their use. This report is supplemental sales
literature, and therefore must be preceded or accompanied by a prospectus and disclosure statement. Please read the prospectus carefully.
ß
®
- 2. Morningstar DirectSM
| Print Date: 3. 9. 2012 Page 2 of 3
WIOF Global Listed Utilities I LU0439555946
Performance
Morningstar RatingsTM
Morningstar CategoryTM
Fund Size Currency
QQQQQ Europe OE Sector Equity
Utilities
2 404 584(USD ) ( 31. 8.
2012 ) USD
13K
12K
11K
10K
9K
Growth of 10K (USD)
Fund
Index
Category
— — — — — — — — * & * Performance Quartile
(within category)
2002 2003 2004 2005 2006 2007 2008 2009 2010 2011 8. 2012 History
— — — — — — — — -0.53 3.65 1.57 Total Return %
— — — — — — — — 0.46 6.93 1.21 +/-Index*
— — — — — — — — 1.81 10.96 1.19 +/- Category
*MSCI World/Utilities NR USD
-8.0
-4.0
0.0
4.0
8.0
12.0
Relative Fund Quarterly
vs. Fund Category
Quarterly Fund
Relative Return
Category Baseline
Best Qtr Performance
Worst Qtr Performance
2002 2003 2004 2005 2006 2007 2008 2009 2010 2011 2012 Qtrly Total Returns
— — — — — — — — -1.87 1.31 -0.31 1st Quarter
— — — — — — — — -7.32 -0.35 2.40 2nd Quarter
— — — — — — — — 7.06 0.02 — 3rd Quarter
— — — — — — — 7.49 2.16 2.64 — 4th Quarter
Trailing Total Returns 31. 8. 2012
Trailing Ret % +/-Index* +/-Cat % Rnk Cat
YTD 1.57 1.21 1.19 42
1 Mo -1.30 -1.24 -2.90 86
3 Mo 3.37 -1.15 -3.64 86
12 Mo 6.21 6.64 10.05 4
3 Yr Annualized 4.40 4.10 6.46 3
5 Yr Annualized — — — —
10 Yr AnnualizedTD — — — —
*MSCI World/Utilities NR USD
Ratings and Risk
Overall
Morningstar RatingTM
QQQQQ
Number of Funds Rated 48
Volatility Measurements 3 Yr 5 Yr
Standard Deviation 8.86 —
Mean 4.40 —
Sharpe Ratio — —
Modern Portfolio Theory Statistics Standard Index
MSCI World/Utilities NR USD
R-Squared —
Beta —
Alpha —
Trailing 3-Yr through —
©2012 Morningstar, Inc. All Rights Reserved. The information, data, analyses and opinions contained herein (1) include the confidential and proprietary information of Morningstar, (2) may not be copied or redistributed, (3) do not
constitute investment advice offered by Morningstar, (4) are provided solely for informational purposes and therefore are not an offer to buy or sell a security, and (5) are not warranted to be correct, complete or accurate. Except as
otherwise required by law, Morningstar shall not be responsible for any trading decisions, damages or other losses resulting from, or related to, this information, data, analyses or opinions or their use. This report is supplemental sales
literature, and therefore must be preceded or accompanied by a prospectus and disclosure statement. Please read the prospectus carefully.
ß
®
- 3. Morningstar DirectSM
| Print Date: 3. 9. 2012 Page 3 of 3
WIOF Global Listed Utilities I LU0439555946
Operations
Morningstar RatingsTM
Morningstar CategoryTM
Fund Size Currency
QQQQQ Europe OE Sector Equity
Utilities
2 404 584(USD ) ( 31. 8.
2012 ) USD
Purchase,Fee & Expenses
Country Available for Sale
Czech Republic, Luxembourg, Poland, Slovakia
Purchase Information (USD ) Fees
Minimum Initial Purchase 40 000 Front-End Load 2.45%
Minimum Subsequent
Purchase
1 Deferred Load 0.00%
Management Fee Actual:1.50%
Management Fee Max:1.50%
Redemption Fee 0.00%
Advisor Information
General Information
Fund Inception 3. 8. 2009
Fund Advisor(s) Cornhill Management S.A.
Management
Family Cornhill Management S.A.
Phone +421 2 32 22 26 00
Management Team
©2012 Morningstar, Inc. All Rights Reserved. The information, data, analyses and opinions contained herein (1) include the confidential and proprietary information of Morningstar, (2) may not be copied or redistributed, (3) do not
constitute investment advice offered by Morningstar, (4) are provided solely for informational purposes and therefore are not an offer to buy or sell a security, and (5) are not warranted to be correct, complete or accurate. Except as
otherwise required by law, Morningstar shall not be responsible for any trading decisions, damages or other losses resulting from, or related to, this information, data, analyses or opinions or their use. This report is supplemental sales
literature, and therefore must be preceded or accompanied by a prospectus and disclosure statement. Please read the prospectus carefully.
ß
®