Dec 2009 Quarterly Report - WIOF Global Utilities Fund
Performance and outlook of the WIOF Global Listed Utilities Fund
1. 1
Performance is calculated on I class shares, pre management fees of between 1.50% and 2.25% per annum
2
Performance inception date is 31 July 2009
3
The UBS Developed Infrastructure & Utilities Index is a USD hedged, total return index
IMPORTANT NOTES
This report has been prepared for information only, and it does not represent an offer to purchase or subscribe for shares. While Nucleus Global Investors Pty Ltd ( Nucleus ) believes that the information is correct at the date of
production, no warranty or representation is given to this effect and no liability can be assumed for the correctness or accuracy of the given information, which may be subject to change at any time, without notice. Returns can be
volatile, reflecting increases and decreases in the value of underlying investments. Changes in market conditions and exchange rates can cause a decrease or an increase in the share value. Past performance does not guarantee the same
results in the future.
The WIOF Global Listed Utilities Fund (the Fund ) is a sub fund of World Investment Opportunities Funds (the SICAV ), an open-ended investment company registered on the official list of collective investment undertakings pursuant to
part I of the Luxembourg law of 20th December 2002 on collective investment undertakings (the 2002 Law ). Julius Baer (Luxembourg) S.A is the designated management company of the SICAV, authorised under the provisions of
Chapter 13 of the 2002 Law. Applications can only be made on the form in the current WIOF Prospectus dated April 2010. Prospectus can be obtained by contacting the Nucleus investment team on
+61 2 9356 2866, by fax +61 2 9357 6640, or by emailing kteale@nucleusglobal.com.au or at http://www.wiof.eu/institutional/download/prospectus/. Before investing in the Fund, investors should contact their financial adviser and refer
to all relevant documents relating to the Fund, such as the latest annual report and prospectus, which specify the particular risks associated with the Fund, together with any specific restrictions applying, and the basis of dealing. In the
event an investor chooses not to seek advice from a financial adviser, he should consider whether the Fund is a suitable investment for him.
WIOF Global Listed Utilities Fund June 2011
Performance Summary (total return before fees) Performance 1
1 Month 3 Months 12 Months Inception 2
WIOF Global Listed Utilities Fund (0.9%) 0.6% 14.1% 18.7%
Benchmark (UBS Developed Infrastructure & Utilities Index 3
) (0.2%) 1.6% 13.9% 18.1%
Overview
The fund s share price decreased by 0.9% over the quarter, compared to a 0.2%
decrease in our benchmark index. Whilst markets were generally relatively flat
over the quarter, sovereign debt concerns weighed on markets in southern
Europe. Whilst the S&P 500 was down by 0.4% over the quarter and the FTSE
350, was up by 0.9%, the Spanish equity market fell by 2.7% and the Italian
market by 6.9%. Bank stocks were particularly hard hit in both Italy and Spain as
markets became concerned about their exposure to sovereign debt in Italy and
Spain respectively. The spreads on Spanish and Italian bonds over German bunds
are now at their highest level since Spain and Italy entered the Eurozone - markets
clearly doubt the debt crisis will be limited to Greece, Ireland and Portugal.
The underperformance of the fund was primarily due to stock selection. Fortum (a
nuclear and hydro electric power generator in Finland) fell by 13.1% as the Finnish
government announced an excess profits tax on the profits Fortum makes from
selling surplus CO2 emissions permits. Electric Power Development Co (a Japanese
power generator operating hydro, gas and coal fired plants) fell by 15.1% as the
Fukushima related negative sentiment surrounding Japanese nuclear power
generators continued to drag down the whole power generation sector, including
companies with no nuclear power exposure. The fund continued to benefit from
the fact that it has no exposure to nuclear power in Japan. It also benefited from
its holding in Drax (a UK based coal fired power generator), which rose by 32.7%.
Because Europe s power markets are highly interconnected, a shortage of power in
France caused by the shut down of nuclear plants in Germany, is in turn causing
power shortages and higher power prices in the UK which are benefiting Drax.
The best performing stocks in the fund over the quarter were Drax +32.7%, First
Energy (a US electricity utility) +20.5% and Power Assets Holdings (a Hong Kong
electricity utility) +16.3%. The worst performing were Flughafen Wien (Vienna
Airport) -17.7%, Electric Power Development Co -15.1% and Fortum -13.1%.
Portfolio Changes
During the quarter, we established positions in First Energy, Avista Corp, DPL Inc,
Exelon, Atmos Energy Corp and Westshore Terminals. We exited positions in
Electric Power Development Co, Flughafen Wien, Northumbrian Water, Enagas,
Iberdrola and Xcel Energy.
Outlook
We have become increasingly concerned in recent months about the sovereign debt crisis unfolding in Europe. With the sovereign debt of
Greece and Portugal now downgraded to junk debt status, the question has to be asked, which other economies in Europe are vulnerable?
Judging by the sharp rise in bond yields in Spain and Italy, markets are clearly worried about their credit worthiness also. Eurozone politicians
are in denial about the scale of the problem and their proposed solutions are merely deferring the hard decisions to another day, rather than
addressing the problem that these countries cannot repay their debts and bondholders will have to take a haircut. At some point bond
markets will make the hard decisions for them and force debt restructurings by simply refusing to extend credit. Sovereign indebtedness is
not only a European problem however. Most western governments have too much debt and bond markets are demanding higher interest
rates to lend to them and in some cases are becoming unwilling to buy their bonds. The result is that governments are being forced to cut
spending and raise taxes, which will significantly cut incomes of both the corporate and household sector which is itself already reducing
spending as consumers begin to reduce the large debt burdens racked up in the credit boom. Periods of deleveraging that follow the bursting
of a credit bubble are almost invariably characterized by low economic growth for exactly these reasons and we expect the next few years
will be no different. Sectors of the economy that depend on consumer discretionary spending tend to fare particularly badly. In contrast,
utilities tend to outperform in such an environment as they provide society s essential services people simply can t live without power, gas
or water - resulting in much more stable earnings in a weak economic environment.
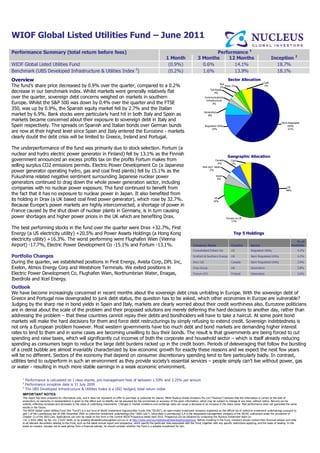
Semi Regulated
Utility
61%
Regulated Utility
14%
Generation
8%
Communications
Infrastructure
3%
Toll Roads
3%
Rail
2%
Ports 2%
Cash
7%
Sector Allocation
US
48%
Europe ex UK
17%
UK
14%
Japan
6%
Asia excl. Japan
2%
Canada
6%
Cash
7%
Geographic Allocation
Company Name Country Sector
% of
Portfolio
Consolidated Edison Inc US Regulated Utility 4.3%
Scottish & Southern Energy UK Semi Regulated Utility 4.2%
Atco Ltd Canada Semi Regulated Utility 3.9%
Drax Group UK Generation 3.8%
Fortum OYJ Finland Generation 3.6%
Top 5 Holdings