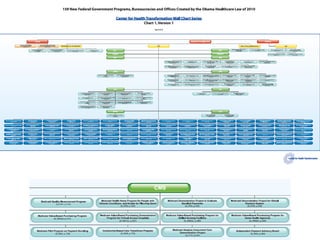
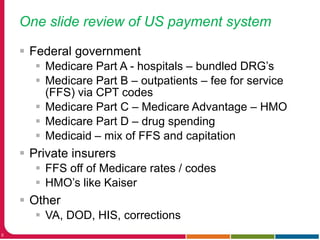
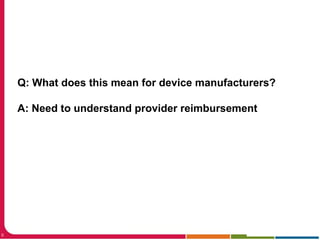
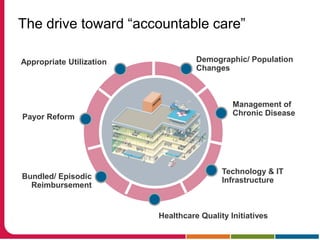
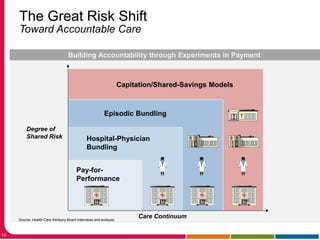
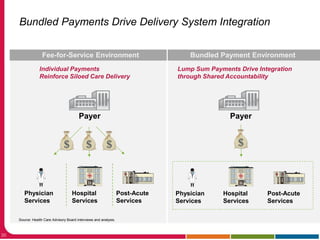
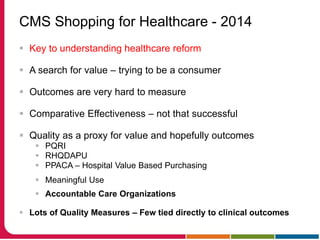
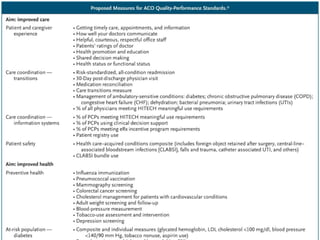
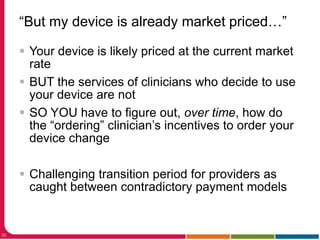
Impact of Healthcare
Reform on Device
Development and
Funding
Donald Rucker, MD, MBA
COO, OSU IDEA Studio
Associate Dean for Innovation
2
US Healthcare Expenditures
Source: Kaiser Family Foundation. Data from Centers for Medicare and Medicaid Services, Office of the Actuary, National Health Statistics
Group, at http://www.cms.hhs.gov/NationalHealthExpendData/ (Historical data from NHE summary including share of GDP, CY 1960-2008,
file nhegdp08.zip; Projected data from NHE Projections 2009-2019, Forecast summary and selected tables, file proj2009.pdf).
$8,047
(2009)
$2,814
(1990)
Historical Projected
In 2012, the U.S. spent $2.8 trillion on health care,
or $8,915 per capita
$13,387
(2019)
“Healthcare Reform”
ARRA HITECH Act 2009
Patient Protection and Affordable Care Act
(PPACA)
Health Care and Education Reconciliation Act
of 2010
4
5
Affordable Care Act
 ACA is driving major
changes in how people
purchase health insurance
though much of the dynamic
still to play out
 Federal government already
controls ~50% of healthcare
spending
 Medical equipment
manufacturer environment
rarely a specific
consideration
7
Hope: Achieve “Triple Aim” for US Healthcare
with payment reform
a) Better care for individuals
b) Better health for populations
c) Lower growth in Medicare
Parts A and B expenditures
One slide review of US payment system
8
 Federal government
 Medicare Part A - hospitals – bundled DRG’s
 Medicare Part B – outpatients – fee for service
(FFS) via CPT codes
 Medicare Part C – Medicare Advantage – HMO
 Medicare Part D – drug spending
 Medicaid – mix of FFS and capitation
 Private insurers
 FFS off of Medicare rates / codes
 HMO’s like Kaiser
 Other
 VA, DOD, HIS, corrections
9
Q: What does this mean for device manufacturers?
A: Need to understand provider reimbursement
The drive toward “accountable care”
Demographic/ Population
Changes
Management of
Chronic Disease
Technology & IT
Infrastructure
Healthcare Quality Initiatives
Bundled/ Episodic
Reimbursement
Payor Reform
Appropriate Utilization
Origin of the Accountable Care Organization
 Term came from a discussion
between Elliot Fisher of
Dartmouth and Glenn Hackbarth
of MedPAC at a 2006 meeting
 Extended hospital medical staff
that could act as a virtual
organization
 Fisher ES, Staiger DO, Bynum
JPW, et al. “Creating Accountable
Care Organizations: The
Extended Hospital Medical Staff”.
Health Affairs, 26(1) w44-w57,
2007.
12
Two Models for ACO Risk Sharing
Same eligibility requirements and quality performance standards
for both
 Regular fee-for-service payment
for physicians and hospitals
 ACO shares in savings with Medicare
 No penalty for losses in Years 1,2, 3
Track 1: One-sided Model
 Regular fee-for-service payment
for physicians and hospital
 ACO shares in savings and losses
with Medicare in all 3 years
 Greater opportunity for rewards
Track 2: Two-sided Model
Provider Participation
 Eligible providers who can form an ACO under
this program:
 ACO professionals in group practice arrangements.
 Networks of individual practices of ACO professionals.
 Partnerships or joint venture arrangements between hospitals and ACO
professionals.
 Hospitals employing ACO professionals.
 Such other groups of providers of services and suppliers as the
Secretary determines appropriate.
 Primary care physicians may choose to
participate (limited to 1 ACO annually)
 Specialists and hospitals could participate in more than 1 ACO
14
Medicare Beneficiary Participation
 A preliminary prospective beneficiary assignment to ACOs
• Beneficiaries identified quarterly
• Two Step Assignment process
• Beneficiaries who have received at least one primary care from a primary care
physician
• Beneficiaries who have not rec’d any primary care services from a primary care
physician but have rec’d primary care services rendered by any other ACO professional
 ACO providers must notify patients they are in an ACO
 Medicare fee-for-service beneficiaries may continue to receive care
from any Medicare provider they choose. However, if their primary
care physician is in an ACO, they will be included in the ACO or will
have to find another non-ACO primary care doctor.
 ACO must notify the beneficiary that the beneficiary’s claims data may
be shared with other providers in the ACO to coordinate care.
Providers must give beneficiaries the opportunity to opt-out of the data
sharing arrangements.
Moral hazard: Quality Measures as counterbalance
 How well your doctors communicate
 Readmissions (risk-adjusted)
 % Physicians meeting Stage 1 HITECH Meaningful Use
Requirements
 % Primary Care Physicians using Clinical Decision
Support
 Health Care Acquired Conditions Composite
 Mammography screening
 Colorectal cancer screening
 Diabetes: Hemoglobin A1c
 Cardiac function testing
18
Early results of this model
• 360 Medicare ACO’s as of 12.23.2013
• Cover 5.3 million Medicare Beneficiaries (roughly 10%)
• Most are physician led and have under 10,000 beneficiaries
• Pioneer ACO’s - as of July 2013
• 18 of 32 achieved some savings
• 13 of these saved enough to get a payment
• 14 of 32 spent more than expected
• 2 of these spent enough to get a penalty
• 7 shifted to regular ACO program
• 2 dropped out totally
• Private ACO’s – too early to tell
• Mass BCBS Alternative Quality Contract >> 2-3% savings
• Kaiser consistent savings for 60 years
19
The Great Risk Shift
Toward Accountable Care
Source: Health Care Advisory Board interviews and analysis.
Building Accountability through Experiments in Payment
Pay-for-
Performance
Hospital-Physician
Bundling
Episodic Bundling
Capitation/Shared-Savings Models
Degree of
Shared Risk
Care Continuum
20
Bundled Payments Drive Delivery System Integration
Fee-for-Service Environment Bundled Payment Environment
Individual Payments
Reinforce Siloed Care Delivery
Lump Sum Payments Drive Integration
through Shared Accountability
Hospital
Services
Post-Acute
Services
Physician
Services
Payer
Hospital
Services
Post-Acute
Services
Physician
Services
Source: Health Care Advisory Board interviews and analysis.
Payer
How to make sense of the word soup?
22
MGH's Inpatient Adjusted Cost per Patient
N Engl J Med 2012; 366:2147-2149
What happened in 1965?
 We know from the first day of Economics 101 that in the
entire history of mankind there have been only two ways
to allocate scarce resources
 PRICE
 QUEUES (lines, rationing, access controls, subsidies)
EVERYTHING in reform has to boil down to some mix of
buying healthcare through competitive market prices or
government rationing / subsidies.
Government is the buyer
 Today, most of US healthcare is bought by the federal
government
 Since 1965 Medicare has been the de facto healthcare
policy for both the federal government and private payers
 Historically what to buy not an issue
 Medicare Law – Title XVIII - All services must be certified
as medically necessary or must be a defined benefit
preventative service
 Medicare set “fixed” prices
 Numbers of hospitals, doctors constrained
How could CMS shop?
 You know how consumers shop!
 Price
 Quality
 Value (function of price and quality)
 How could CMS shop?
 Price - all fixed at the same level
 Quality
 Value - tough to calculate without price information
CMS Shopping for Healthcare - 2014
 Key to understanding healthcare reform
 A search for value – trying to be a consumer
 Outcomes are very hard to measure
 Comparative Effectiveness – not that successful
 Quality as a proxy for value and hopefully outcomes
 PQRI
 RHQDAPU
 PPACA – Hospital Value Based Purchasing
 Meaningful Use
 Accountable Care Organizations
 Lots of Quality Measures – Few tied directly to clinical outcomes
Where do Quality Measures Come From?
 Ideally, from medical science
 Evidence Based Medicine
 AHRQ – Effective Healthcare Program
 Comparative Effectiveness in ARRA Law
 Patient Centered Outcomes Research
Institute – PPACA
 Reality = the process is part clinical
evidence and part politics
 Increasing role with “SGR” fix just
reported out of Congressional
committee
If quality measures aren’t enough,
can we go back to price?
Today’s Medicare prices (DRG‘s, CPT codes)
 PRICE is the fundamental economic language for informing
rational decisions for BOTH consumers and producers
 How does Medicare “speak” PRICE
 Medicare sets prices – some too high, some too low
 Medicare tries to work around mis-pricing by cross-subsidization
 Many provisions in PPACA are attempts to redress cost errors
 “Medical home”, “utilization rate”, physician owned hospitals
Can price / efficiency information sneak back in?
 A form of market-based prices of
healthcare services can occur
privately
 HMO’s, capitation and Accountable
Care Organizations are ways to
purchase and provide an efficient mix
of healthcare services, at least, within
an organization
 PBM’s force price in with “tiered
payments”
 Employers force price in by
increasing co-pays
 Price transparency – laws, Castlight
“But my device is already market priced…”
32
 Your device is likely priced at the current market
rate
 BUT the services of clinicians who decide to use
your device are not
 SO YOU have to figure out, over time, how do
the “ordering” clinician’s incentives to order your
device change
 Challenging transition period for providers as
caught between contradictory payment models
Side note: Sunshine Law
33
 Sen. Grassley’s effort to provide transparency
 Drug & device manufacturers and suppliers have
to report all “transfers of value” to physicians and
hospitals over $10 ($100 per year)
 Track: since August 1, 2013
 Report: March 41, 2014
 Public Website: September 30, 2104
Upcoming?
 SGR (Sustainable Growth Rate) Fix
 >> Value-Based Purchasing reporting consolidated
 Challenges for device manufacturer’s
 Federal perceptions on use and value
 Co-pays
 Cuts until access clearly imperiled
 Wonderful opportunities
 New focus on value and automation and business
practices
 Many inefficiencies to arbitrage
 More spending on devices, less on labor
Conclusions
1. 2010 Healthcare reform legislation includes thousands
of provisions and we don’t know how they will ultimately
play out
2. Healthcare payment based on individual quality
measures is limited
3. Most likely next step to reduce expenditures will be
bundled payments which force delivery systems, not
Medicare, to make the hard choices of how to deliver
care and what care to deliver
4. Device manufacturers, more than ever, need to sell the
efficiency and outcomes-based value of their products.
Providers will be much more likely to listen.
Impact on Health Reform on Device Development and Funding

Impact on Health Reform on Device Development and Funding

  • 1.
    Impact of Healthcare Reformon Device Development and Funding Donald Rucker, MD, MBA COO, OSU IDEA Studio Associate Dean for Innovation
  • 2.
    2 US Healthcare Expenditures Source:Kaiser Family Foundation. Data from Centers for Medicare and Medicaid Services, Office of the Actuary, National Health Statistics Group, at http://www.cms.hhs.gov/NationalHealthExpendData/ (Historical data from NHE summary including share of GDP, CY 1960-2008, file nhegdp08.zip; Projected data from NHE Projections 2009-2019, Forecast summary and selected tables, file proj2009.pdf). $8,047 (2009) $2,814 (1990) Historical Projected In 2012, the U.S. spent $2.8 trillion on health care, or $8,915 per capita $13,387 (2019)
  • 3.
    “Healthcare Reform” ARRA HITECHAct 2009 Patient Protection and Affordable Care Act (PPACA) Health Care and Education Reconciliation Act of 2010
  • 4.
  • 5.
  • 6.
    Affordable Care Act ACA is driving major changes in how people purchase health insurance though much of the dynamic still to play out  Federal government already controls ~50% of healthcare spending  Medical equipment manufacturer environment rarely a specific consideration
  • 7.
    7 Hope: Achieve “TripleAim” for US Healthcare with payment reform a) Better care for individuals b) Better health for populations c) Lower growth in Medicare Parts A and B expenditures
  • 8.
    One slide reviewof US payment system 8  Federal government  Medicare Part A - hospitals – bundled DRG’s  Medicare Part B – outpatients – fee for service (FFS) via CPT codes  Medicare Part C – Medicare Advantage – HMO  Medicare Part D – drug spending  Medicaid – mix of FFS and capitation  Private insurers  FFS off of Medicare rates / codes  HMO’s like Kaiser  Other  VA, DOD, HIS, corrections
  • 9.
    9 Q: What doesthis mean for device manufacturers? A: Need to understand provider reimbursement
  • 10.
    The drive toward“accountable care” Demographic/ Population Changes Management of Chronic Disease Technology & IT Infrastructure Healthcare Quality Initiatives Bundled/ Episodic Reimbursement Payor Reform Appropriate Utilization
  • 11.
    Origin of theAccountable Care Organization  Term came from a discussion between Elliot Fisher of Dartmouth and Glenn Hackbarth of MedPAC at a 2006 meeting  Extended hospital medical staff that could act as a virtual organization  Fisher ES, Staiger DO, Bynum JPW, et al. “Creating Accountable Care Organizations: The Extended Hospital Medical Staff”. Health Affairs, 26(1) w44-w57, 2007.
  • 12.
    12 Two Models forACO Risk Sharing Same eligibility requirements and quality performance standards for both  Regular fee-for-service payment for physicians and hospitals  ACO shares in savings with Medicare  No penalty for losses in Years 1,2, 3 Track 1: One-sided Model  Regular fee-for-service payment for physicians and hospital  ACO shares in savings and losses with Medicare in all 3 years  Greater opportunity for rewards Track 2: Two-sided Model
  • 13.
    Provider Participation  Eligibleproviders who can form an ACO under this program:  ACO professionals in group practice arrangements.  Networks of individual practices of ACO professionals.  Partnerships or joint venture arrangements between hospitals and ACO professionals.  Hospitals employing ACO professionals.  Such other groups of providers of services and suppliers as the Secretary determines appropriate.  Primary care physicians may choose to participate (limited to 1 ACO annually)  Specialists and hospitals could participate in more than 1 ACO
  • 14.
    14 Medicare Beneficiary Participation A preliminary prospective beneficiary assignment to ACOs • Beneficiaries identified quarterly • Two Step Assignment process • Beneficiaries who have received at least one primary care from a primary care physician • Beneficiaries who have not rec’d any primary care services from a primary care physician but have rec’d primary care services rendered by any other ACO professional  ACO providers must notify patients they are in an ACO  Medicare fee-for-service beneficiaries may continue to receive care from any Medicare provider they choose. However, if their primary care physician is in an ACO, they will be included in the ACO or will have to find another non-ACO primary care doctor.  ACO must notify the beneficiary that the beneficiary’s claims data may be shared with other providers in the ACO to coordinate care. Providers must give beneficiaries the opportunity to opt-out of the data sharing arrangements.
  • 16.
    Moral hazard: QualityMeasures as counterbalance  How well your doctors communicate  Readmissions (risk-adjusted)  % Physicians meeting Stage 1 HITECH Meaningful Use Requirements  % Primary Care Physicians using Clinical Decision Support  Health Care Acquired Conditions Composite  Mammography screening  Colorectal cancer screening  Diabetes: Hemoglobin A1c  Cardiac function testing
  • 17.
    18 Early results ofthis model • 360 Medicare ACO’s as of 12.23.2013 • Cover 5.3 million Medicare Beneficiaries (roughly 10%) • Most are physician led and have under 10,000 beneficiaries • Pioneer ACO’s - as of July 2013 • 18 of 32 achieved some savings • 13 of these saved enough to get a payment • 14 of 32 spent more than expected • 2 of these spent enough to get a penalty • 7 shifted to regular ACO program • 2 dropped out totally • Private ACO’s – too early to tell • Mass BCBS Alternative Quality Contract >> 2-3% savings • Kaiser consistent savings for 60 years
  • 18.
    19 The Great RiskShift Toward Accountable Care Source: Health Care Advisory Board interviews and analysis. Building Accountability through Experiments in Payment Pay-for- Performance Hospital-Physician Bundling Episodic Bundling Capitation/Shared-Savings Models Degree of Shared Risk Care Continuum
  • 19.
    20 Bundled Payments DriveDelivery System Integration Fee-for-Service Environment Bundled Payment Environment Individual Payments Reinforce Siloed Care Delivery Lump Sum Payments Drive Integration through Shared Accountability Hospital Services Post-Acute Services Physician Services Payer Hospital Services Post-Acute Services Physician Services Source: Health Care Advisory Board interviews and analysis. Payer
  • 20.
    How to makesense of the word soup?
  • 21.
    22 MGH's Inpatient AdjustedCost per Patient N Engl J Med 2012; 366:2147-2149
  • 22.
    What happened in1965?  We know from the first day of Economics 101 that in the entire history of mankind there have been only two ways to allocate scarce resources  PRICE  QUEUES (lines, rationing, access controls, subsidies) EVERYTHING in reform has to boil down to some mix of buying healthcare through competitive market prices or government rationing / subsidies.
  • 23.
    Government is thebuyer  Today, most of US healthcare is bought by the federal government  Since 1965 Medicare has been the de facto healthcare policy for both the federal government and private payers  Historically what to buy not an issue  Medicare Law – Title XVIII - All services must be certified as medically necessary or must be a defined benefit preventative service  Medicare set “fixed” prices  Numbers of hospitals, doctors constrained
  • 24.
    How could CMSshop?  You know how consumers shop!  Price  Quality  Value (function of price and quality)  How could CMS shop?  Price - all fixed at the same level  Quality  Value - tough to calculate without price information
  • 25.
    CMS Shopping forHealthcare - 2014  Key to understanding healthcare reform  A search for value – trying to be a consumer  Outcomes are very hard to measure  Comparative Effectiveness – not that successful  Quality as a proxy for value and hopefully outcomes  PQRI  RHQDAPU  PPACA – Hospital Value Based Purchasing  Meaningful Use  Accountable Care Organizations  Lots of Quality Measures – Few tied directly to clinical outcomes
  • 27.
    Where do QualityMeasures Come From?  Ideally, from medical science  Evidence Based Medicine  AHRQ – Effective Healthcare Program  Comparative Effectiveness in ARRA Law  Patient Centered Outcomes Research Institute – PPACA  Reality = the process is part clinical evidence and part politics  Increasing role with “SGR” fix just reported out of Congressional committee
  • 28.
    If quality measuresaren’t enough, can we go back to price?
  • 29.
    Today’s Medicare prices(DRG‘s, CPT codes)  PRICE is the fundamental economic language for informing rational decisions for BOTH consumers and producers  How does Medicare “speak” PRICE  Medicare sets prices – some too high, some too low  Medicare tries to work around mis-pricing by cross-subsidization  Many provisions in PPACA are attempts to redress cost errors  “Medical home”, “utilization rate”, physician owned hospitals
  • 30.
    Can price /efficiency information sneak back in?  A form of market-based prices of healthcare services can occur privately  HMO’s, capitation and Accountable Care Organizations are ways to purchase and provide an efficient mix of healthcare services, at least, within an organization  PBM’s force price in with “tiered payments”  Employers force price in by increasing co-pays  Price transparency – laws, Castlight
  • 31.
    “But my deviceis already market priced…” 32  Your device is likely priced at the current market rate  BUT the services of clinicians who decide to use your device are not  SO YOU have to figure out, over time, how do the “ordering” clinician’s incentives to order your device change  Challenging transition period for providers as caught between contradictory payment models
  • 32.
    Side note: SunshineLaw 33  Sen. Grassley’s effort to provide transparency  Drug & device manufacturers and suppliers have to report all “transfers of value” to physicians and hospitals over $10 ($100 per year)  Track: since August 1, 2013  Report: March 41, 2014  Public Website: September 30, 2104
  • 33.
    Upcoming?  SGR (SustainableGrowth Rate) Fix  >> Value-Based Purchasing reporting consolidated  Challenges for device manufacturer’s  Federal perceptions on use and value  Co-pays  Cuts until access clearly imperiled  Wonderful opportunities  New focus on value and automation and business practices  Many inefficiencies to arbitrage  More spending on devices, less on labor
  • 34.
    Conclusions 1. 2010 Healthcarereform legislation includes thousands of provisions and we don’t know how they will ultimately play out 2. Healthcare payment based on individual quality measures is limited 3. Most likely next step to reduce expenditures will be bundled payments which force delivery systems, not Medicare, to make the hard choices of how to deliver care and what care to deliver 4. Device manufacturers, more than ever, need to sell the efficiency and outcomes-based value of their products. Providers will be much more likely to listen.