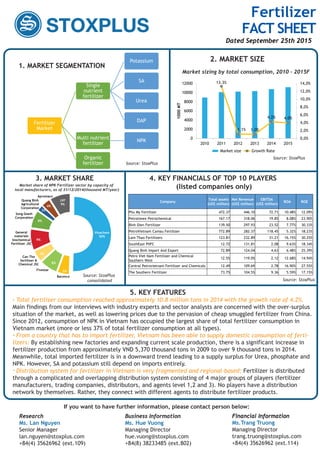
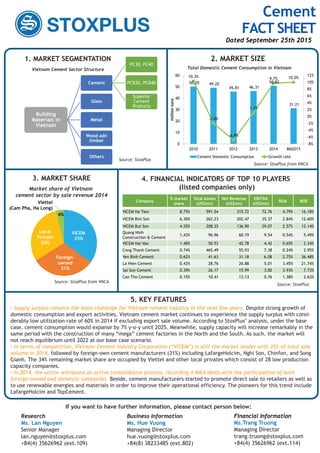
4. KEY FEATURES
4.9 4.8
7.2
8.2
6.3
7.4
8.9
10.4
7%
5%
8%
8%
5.2% 5.2%
6.0%
6.6%
8%
7%
7%
6%
4.7%
5.3% 5.4% 5.3%
0%
1%
2%
3%
4%
5%
6%
7%
8%
9%
-
2
4
6
8
10
12
Dec-07 Sep-08 Dec-09 Dec-10 Dec-11 Dec-12 Dec-13 Aug-14
Consumer Loans Balance in USDbn % Consumer Loans/GDP % Consumer Loans/Loan Book
Source: StoxPlus from SBV and StoxPlus
3. MARKET SIZE
Consumer Loan Balance (USDbn) and %GDP, %Total Loans
2. KEY FINANCIALS OF
TOP 6 NON-BANK PLAYERS
Source: StoxPlus from NFSC and SBV
38%
13%2%
30%
6%
7%
4%
49%
3%
10%
1%
37%
1. MARKET SEGMENTATION
Breakdown of Vietnam Consumer Loans,
as of 30/08/2014
SOCBs
JSCBs
Foreign Banks
Finance
Companies
Others
Source: StoxPlus from NFSC and SBV
Breakdown of Vietnam Consumer Loans by players,
as of 30/08/2014
Housing loans /
Home improvement loans
(without collaterals)
Vehicle loans (two-wheelers
and automobiles)
Education and medical loans
Home appliances and
furniture loans
Personal overdraft account
Loans for other purposes
- cultural sports,
and travelling
Credit card outstandingSource: StoxPlus from NFSC
Consumer Finance
FACT SHEET
Dated September 25th 2015
Vietnam consumer loan has reached US$10.4bn as of August
2014 and is expected to continue its fast-growing trajectory
in 2015: Finance companies have the fastest growth in
consumer loans compared to other types of players. This
result is due to the easy credit (quick loan processing)
business model, so finance companies can charge the highest
interest rate in the market (ranging from 30-80% APR depend-
ing on products).
Finance companies have the fastest growth in consumer
loans compared to other types of player, accounting for 10%
of total consumer loans. According to data of loan outstanding
of finance companies, PPF is still the market leader with the
highest growth rate of 23.1% in 2014 compared to 2013. VP
Finance Company (i.e. FE Credit) ranked second among
finance companies in terms of loan outstanding as reported
to the SBV. However, according to our own analysis, the
actual loan outstanding of FE Credit is much larger, and that
they should be ranked as CF market leader.
CF customers tend to be Mass – Upper Mass individuals.
Their monthly income mostly ranges from VND3-7mn
(US$150-350): In our sample size of 500 CF users, more than
70% of participants have monthly income ranging from
VND3-7mn (or US$150-350) with the mean of the population
at VND6.44 million.
Cash loan and e-wallet are expected to continue as
emerging product trends and gain momentum reshape the
industry: as the rise of ecommerce, e-wallet would be an
essential infrastructure for the online/mobile consumer
finance. The appearance of MobiVi and MoMo could serve as a
loan distribution as well as payment channel.
If you want to have further information, please contact person below:
Research
Ms. Lan Nguyen
Senior Manager
lan.nguyen@stoxplus.com
+84(4) 35626962 (ext.109)
Business Information
Ms. Hue Vuong
Managing Director
hue.vuong@stoxplus.com
+84(8) 38233485 (ext.802)
Financial Information
Ms.Trang Truong
Managing Director
trang.truong@stoxplus.com
+84(4) 35626962 (ext.114)
% Market
Share
Total
Assets
(US$
million)
Net
Revenue
(US$
million)
ROA ROE
Home Credit 33% 7,883.60 2,196.4 0.28% 1.40%
Prudential Finance 20% 3,507.90 482.3 0.14% 0.67%
Toyota Finance 8% 1,685.10 68.7 0.04% 0.12%
HD Saison 14% 1,713.10 315.5 0.18% 0.60%
Jaccs 3% 573.6 90.4 0.16% 0.19%
FE Credit 21% 5.867 189.945 32% 156%
Research Business Information Financial InformationResearch Business Information Financial Information
5. KEY FEATURES
2. MARKET SIZE
4. KEY FINANCIALS OF TOP 10 PLAYERS
(listed companies only)
1. MARKET SEGMENTATION
Source: StoxPlus
Food
Processing
Frozen
Processed Food
Dried
Processed Food
Chilled
Processed Food
866.28 944.78
1,116.17
1,245.12
1,380.88
12.69%
9.06%
18.14%
11.55%
10.90%
0%
2%
4%
6%
8%
10%
12%
14%
16%
18%
20%
0
200
400
600
800
1000
1200
1400
1600
2010 2011 2012 2013 2014
US$million
Total sales value Growth Rate
Market sizing by total sales volume
Vietnam food processing industry sized at US$1.38bn, posting good performance with the CAGR of 12.4% yoy during the
period 2010 – 2014. Of which, dried processed food accounted for a major part of the whole sector (over 85%).
The sector witnesses fierce competition with the participation of many giants in each segment. Masan Group, Masan
Consumer, Minh Phu Seafood and Hung Vuong Corporation are giants in their own sectors. However, as the sector is foreseen
to expand aggressively in following years, the appearance of new comers is manifest.
Food processing market is forecasted to grow by over 12% y-o-y in the next few years, especially with the sign of many FTA
including Korean, Japan …. The new generation of FTAs that Vietnam has signed with key food exporting countries will remain
the country’s position as one of the most attractive investment opportunities in the region during following years. Especially,
frozen processed food will be invested remarkably as Japan, U.S, E.U, Eurasian are all major seafood import countries,
representing over 60% of Vietnam total seafood export volume.
Source: StoxPlus from Euromonitor
Company
Total assets
(US$
million)
Net Sales
(US$
million)
EBITDA
(US$
million)
ROA ROE
Masan Group 2,469.24 750.05 248.26 2.17% 7.34%
Minh Phu Seafood Corp. 432.89 703.72 63.84 8.92% 44.79%
Hung Vuong Corporation 420.75 694.72 39.45 3.06% 12.36%
Masan Consumer 1,116.86 610.65 233.12 13.03% 23.58%
Vinh Hoan Corp. 209.42 293.35 34.79 12.47% 26.31%
STAPIMEX 61.62 251.27 3.67 2.64% 12.59%
Dabaco 196.75 238.64 23.21 5.00% 11.58%
Kinh Do Corporation 367.17 230.89 42.51 7.53% 9.69%
Viet Thang Feed 75.57 206.17 11.14 9.58% 16.14%
Nha Trang Seafoods F17 113.09 178.82 17.44 9.94% 38.73%
10%
4%
86%
3. MARKET SHARE
Market share by sub-sectors
Frozen Processed Food
Chilled Processed Food
Dried Processed Food Source: StoxPlus
Source: StoxPlus from Euromonitor
If you want to have further information, please contact person below:
Research
Ms. Lan Nguyen
Senior Manager
lan.nguyen@stoxplus.com
+84(4) 35626962 (ext.109)
Business Information
Ms. Hue Vuong
Managing Director
hue.vuong@stoxplus.com
+84(8) 38233485 (ext.802)
Financial Information
Ms.Trang Truong
Managing Director
trang.truong@stoxplus.com
+84(4) 35626962 (ext.114)
Research Business Information Financial InformationResearch Business Information Financial Information
Food Processing
FACT SHEET
Dated September 25th 2015
5. KEY FEATURES
2. MARKET SIZE1. MARKET SEGMENTATION
Source: StoxPlus
IndustrialTransportation
Delivery Services Forwarding
Marine Transportation Ocean Shipping
Railroads
Transportation Services
Distribution Center
Port Operation
Air Cargo Terminal
Project Cargo Transport
Trucking Inland Transport
100%
102%
104%
106%
108%
110%
112%
114%
0
200000
400000
600000
800000
1000000
1200000
2009 2010 2011 2012 2013 2014
Thousandtons
Total volume of freight traffic Growth rate
Vietnam’s logistics market is currently worth US$60 billion. In total, there are around 1,000 logistics firms – 25 of
which are foreign firms. Foreign firms of note are Maersk Logistics, APL Logistics, NYK Logistics and MOL Logistics.
Most foreign firms can offer third or fourth party logistics (3PL or 4PL) services while Vietnam domestic firms can
only handle 2PL services. Foreign firms currently hold 80 percent of the market share, worth US$48 billion.
For ocean shipping, foreign players are totally dominating the market. Almost all global giant shipping lines have
their own logistics companies in Vietnam i.e. APL has APL logistics, NYK has NYK logistics, OOCL has OOCL logistics.
Many seaports and airports also lack supporting distribution centers, which can result in increased inventory and idle
time for trucks, ships and planes.
The average growth of Vietnam’s logistics sector is estimated at 20% yoy. There is an increasing number of multi-
national corporations( e.g. Nike, Intel, Nokia, Samsung) investing in Vietnam showing large opportunity for local
forwarding and warehousing development. The sector’s annual growth rate is expected to remain around 20-25%
in the next 5 years.
Market sizing by volume of freight traffic, 2009 - 2014
4. KEY FINANCIALS OF TOP 10 PLAYERS
(listed companies only)
3. MARKET SHARE
Company
Total assets
(US$ million)
Net Revenue
(US$ million)
EBITDA
(US$ million)
ROA ROE
PVTrans 113.54 175.77 40.24 14.06% 25.55%
Vietnam Sun 381.34 140.45 50.41 6.72% 11.34%
Gemadept 262.59 127.77 20.20 0.56% 7.48%
Mai Linh Group 14.40 105.46 1.03 4.10% 6.57%
Vinalines Logistics Viet Nam 237.36 94.97 26.62 1.36% 5.63%
Vietnam Ocean Shipping 23.38 79.36 2.67 9.35% 22.91%
VINAFREIGHT 20.57 75.72 7.49 22.46% 69.92%
Saigon Beer Transportation 98.31 71.15 18.05 2.41% 5.00%
Vitaco - Vietnam Tanker 17.72 61.44 2.95 11.96% 32.27%
Viettel Post 113.54 175.77 40.24 14.06% 25.55%
60
43
37
24 23 23
20 20 20
9
6 5 4
0
10
20
30
40
50
60
70
Thousands
Capacity of key players in Cold Storage Sector
Source: StoxPlus
If you want to have further information, please contact person below:
Research
Ms. Lan Nguyen
Senior Manager
lan.nguyen@stoxplus.com
+84(4) 35626962 (ext.109)
Business Information
Ms. Hue Vuong
Managing Director
hue.vuong@stoxplus.com
+84(8) 38233485 (ext.802)
Financial Information
Ms.Trang Truong
Managing Director
trang.truong@stoxplus.com
+84(4) 35626962 (ext.114)
Research Business Information Financial InformationResearch Business Information Financial Information
Logistics
FACT SHEET
Dated September 25th 2015
5. KEY FEATURES
2. MARKET SIZE
1. MARKET SEGMENTATION
Source: StoxPlus
13.3%
1.1% 1.0%
4.2% 4.0%
0,0%
2,0%
4,0%
6,0%
8,0%
10,0%
12,0%
14,0%
0
2000
4000
6000
8000
10000
12000
2010 2011 2012 2013 2014 2015
1000MT
Market size Growth Rate
Fertilizer
Market
Single
nutrient
fertilizer
Potassium
SA
Urea
DAP
Multi nutrient
fertilizer
NPK
Organic
fertilizer
Total fertilizer consumption reached approximately 10.8 million tons in 2014 with the growth rate of 4.2%.
Main findings from our interviews with industry experts and sector analysts are concerned with the over-surplus
situation of the market, as well as lowering prices due to the pervasion of cheap smuggled fertilizer from China.
Since 2012, consumption of NPK in Vietnam has occupied the largest share of total fertilizer consumption in
Vietnam market (more or less 37% of total fertilizer consumption at all types).
From a country that has to import fertilizer, Vietnam has been able to supply domestic consumption of ferti-
lizers: By establishing new factories and expanding current scale production, there is a significant increase in
fertilizer production from approximately VND 5,370 thousand tons in 2009 to over 9 thousand tons in 2014.
Meanwhile, total imported fertilizer is in a downward trend leading to a supply surplus for Urea, phosphate and
NPK. However, SA and potassium still depend on imports entirely.
Distribution system for fertilizer in Vietnam is very fragmented and regional-based: Fertilizer is distributed
through a complicated and overlapping distribution system consisting of 4 major groups of players (fertilizer
manufacturers, trading companies, distributors, and agents level 1,2 and 3). No players have a distribution
network by themselves. Rather, they connect with different agents to distribute fertilizer products.
Source: StoxPlus
Market sizing by total consumption, 2010 – 2015F
4. KEY FINANCIALS OF TOP 10 PLAYERS
(listed companies only)
Vinachem
50%
Baconco
5%Fivestar
8%
Can Tho
fertilizer &
Chemical JSC
5%
General
materials
biochemical
Fertilizer JSC
9%
Song Gianh
Corporation
8%
Quang Binh
Agricultural
Corporation
2%
Apromaco
4%
JVF
9%
3. MARKET SHARE
Source: StoxPlus
consolidated
Market share of NPK Fertilizer sector by capacity of
local manufacturers, as of 31/12/2014(thousand MT/year)
Company
Total assets
(US$ million)
Net Revenue
(US$ million)
EBITDA
(US$ million)
ROA ROE
Phu My Fertilizer 472.37 446.10 72.71 10.48% 12.09%
Petrolimex Petrochemical 167.17 318.06 19.85 8.08% 23.90%
Binh Dien Fertilizer 139.50 297.93 23.52 7.77% 30.33%
PetroVietnam Camau Fertilizer 772.89 282.37 118.45 5.32% 18.23%
Lam Thao Fertilizers 123.81 232.89 31.21 16.15% 30.25%
SouthEast PVFC 12.72 131.81 2.08 9.63% 18.34%
Quang Binh Import And Export 72.89 124.04 4.63 6.48% 25.39%
Petro Viet Nam Fertilizer and Chemical
Southern West
12.55 119.05 2.12 12.68% 14.94%
Central Petrovietnam Fertilizer and Chemicals 12.49 109.69 2.78 16.90% 27.55%
The Southern Fertilizer 73.75 104.55 9.36 5.59% 17.15%
Source: StoxPlus
If you want to have further information, please contact person below:
Research
Ms. Lan Nguyen
Senior Manager
lan.nguyen@stoxplus.com
+84(4) 35626962 (ext.109)
Business Information
Ms. Hue Vuong
Managing Director
hue.vuong@stoxplus.com
+84(8) 38233485 (ext.802)
Financial Information
Ms.Trang Truong
Managing Director
trang.truong@stoxplus.com
+84(4) 35626962 (ext.114)
Research Business Information Financial InformationResearch Business Information Financial Information
Fertilizer
FACT SHEET
Dated September 25th 2015
5. KEY FEATURES
2. MARKET SIZE
4. FINANCIAL INDICATORS OF TOP 10 PLAYERS
(listed companies only)
1. MARKET SEGMENTATION
Source: StoxPlus from VNCA
Building
Materials in
Vietnam
Cement
PC30, PC40
PCB30, PCB40
Superior
Cement
Products
Glass
Metal
Wood adn
timber
Others
Total Domestic Cement Consumption in VietnamVietnam Cement Sector Structure
Source: StoxPlus
Supply surplus remains the main challenge for Vietnam cement industry in the next few years. Despite strong growth of
domestic consumption and export activities, Vietnam cement market continues to experience the supply surplus with consi-
derably low utilization rate of 60% in 2014 if excluding export sale volume. According to StoxPlus’ analysis, under the base
case, cement consumption would expanse by 7% y-o-y until 2025. Meanwhile, supply capacity will increase remarkably in the
same period with the construction of many “mega” cement factories in the North and the South. As such, the market will
not reach equilibrium until 2022 at our base case scenario.
In terms of competition, Vietnam Cement Industry Corporation (“VICEM”) is still the market leader with 35% of total sale
volume in 2014, followed by foreign-own cement manufacturers (31%) including LafargeHolcim, Nghi Son, Chinfon, and Song
Gianh. The 34% remaining market share are occupied by Viettel and other local privates which consist of 28 low production
capacity companies.
In 2014, the sector witnessed an active consolidation process, recording 4 M&A deals with the participation of both
foreign-owned and domestic companies. Beside, cement manufacturers started to promote direct sale to retailers as well as
to use renewable energies and materials in order to improve their operational efficiency. The pioneers for this trend include
LafargeHolcim and TopCement.
Source: StoxPlus
VICEM
35%
Foreign-
owned
31%
Local
Private
30%
Viettel
(Cam Pha, Ha Long)
4%
Market share of Vietnam
cement sector by sale revenue 2014
Source: StoxPlus from VNCA
3. MARKET SHARE
50.20 49.20
45.81 46.31
50.82
31.21
10.3%
-2.0%
-6.9%
1.1%
9.7% 10.0%
-8%
-6%
-4%
-2%
0%
2%
4%
6%
8%
10%
12%
0
10
20
30
40
50
60
2010 2011 2012 2013 2014 8M2015
milliontons
Cement Domestic Consumption Growth rate
Company
% market
share
Total Assets
(US$mn)
Net Revenue
(US$mn)
EBITDA
(US$mn)
ROA ROE
VICEM Ha Tien 8.75% 591.54 315.72 72.76 4.79% 16.18%
VICEM Bim Son 6.30% 262.23 202.47 35.37 2.84% 12.60%
VICEM But Son 4.55% 208.25 136.90 29.07 2.57% 12.14%
Quang Ninh
Construction & Cement
1.43% 96.96 60.19 9.54 0.54% 5.49%
VICEM Hai Van 1.40% 50.53 42.78 4.42 0.65% 2.34%
Cong Thanh Cement 0.74% 465.49 55.93 7.38 0.24% 2.95%
Yen Binh Cement 0.62% 41.63 31.18 6.08 2.75% 36.48%
La Hien Cement 0.43% 28.76 26.88 5.01 3.45% 21.74%
Sai Son Cement 0.39% 26.17 15.99 3.00 3.93% 7.73%
Can Tho Cement 0.15% 10.41 13.13 0.76 1.38% 2.63%
If you want to have further information, please contact person below:
Research
Ms. Lan Nguyen
Senior Manager
lan.nguyen@stoxplus.com
+84(4) 35626962 (ext.109)
Business Information
Ms. Hue Vuong
Managing Director
hue.vuong@stoxplus.com
+84(8) 38233485 (ext.802)
Financial Information
Ms.Trang Truong
Managing Director
trang.truong@stoxplus.com
+84(4) 35626962 (ext.114)
Research Business Information Financial InformationResearch Business Information Financial Information
Cement
FACT SHEET
Dated September 25th 2015
5. KEY FEATURES
2. MARKET SIZE
1. MARKET SEGMENTATION
Source: StoxPlus
Source: StoxPlus
PlasticPackaging
(US$3.9bn)
Flexible Packaging
(US834mn)
Flexible packaging
for Beverage
Flexible packaging
for Packaged food
Flexible packaging
for Pharmaceuticals
Flexible packaging
for Seafood
Flexible packaging
for Others
Rigid Packaging
PET containers
(US$652mn)
Caps & Closure
Vietnam Flexible Packaging Structure
445.8
532.2
612.0
718.4
834.7
-10%
0%
10%
20%
30%
40%
50%
60%
70%
80%
90%
-100
0
100
200
300
400
500
600
700
800
900
2010 2011 2012 2013 2014
US$mn
Flexible packaging Flexible growth
Market Sizing and Growth of Vietnam Flexible Packaging
According to StoxPlus’ estimation, Vietnam flexible packaging sized at US$834mn by 2014 end, posting an impressive CAGR
of 16.3% in the period 2010 – 2014. The market size valued at US$718mn and US$612mn in 2013 and 2012, respectively.
In term of competitive landscaping, Tan Tien packaging is the market leader in Vietnam flexible packaging with around 9%
of total market share in 2014. The market is quite fragments with large firms mainly located in the South as end-users of
flexible packaging also situate here (including beverage, food and pharmaceuticals companies). The competition becomes
fiercer between two main groups of players: (i) domestic players including Tan Tien, Thanh Phu, Liksin, and Rang Dong; and
(ii) foreign-owned players including Tin Thanh (SCG Thailand), Huhtamaki, Ngai Mee, Tong Yuan, and J.S Packaging.
Vietnam flexible packaging is forecasted to expanse by 15 – 20% y-o-y until 2020 thanks to increasing domestic demand
from beverage and packaged foods. In 2014, total soft drink market valued at US$3.59bn, posting an increase by 20% com-
pared to 2013 while packaged food market sized at US$8.88bn. With the recovery in economics and increased westernization
in lifestyle, beverages and packaged food in Vietnam would perform well in the next few year, creating potentials for
plastic packaging manufacturers.
Source: StoxPlus
Tan Tien
Plastic
Packaging
8,48%
Liksin6,25%
RangDong
Plastic
6,20%TinThanh
5,44%
Huhta-
maki 4,49%
Saigon Plastic
Packaging
4,17%
Saigon
Trapaco
2,85%
Source: StoxPlus
3. MARKET SHARE 4. KEY FINANCIALS OF TOP 6 PLAYERS
(listed companies only)Market share of top 7 players by total sale
in the South of Vietnam, 2014
Company
Total Assets
(US$ million)
Net Revenue
(US$ million)
EBITDA
(US$ million)
ROA ROE
An Phat Plastic 66.42 72.91 6.47 3.65% 7.11%
Tan Tien Plastic Packaging 55.06 70.75 6.63 2.96% 6.32%
Rang Dong Plastic 34.85 50.44 3.82 3.40% 10.06%
Saigon Plastic Packaging 34.55 34.83 3.75 1.16% 3.71%
Tan Dai Hung Plastic 30.37 34.66 1.57 1.79% 3.77%
Tan Phu Plastic 14.81 31.28 2.44 3.93% 15.60%
If you want to have further information, please contact person below:
Research
Ms. Lan Nguyen
Senior Manager
lan.nguyen@stoxplus.com
+84(4) 35626962 (ext.109)
Business Information
Ms. Hue Vuong
Managing Director
hue.vuong@stoxplus.com
+84(8) 38233485 (ext.802)
Financial Information
Ms.Trang Truong
Managing Director
trang.truong@stoxplus.com
+84(4) 35626962 (ext.114)
Research Business Information Financial InformationResearch Business Information Financial Information
Flexible Packaging
FACT SHEET
Dated September 25th 2015
5. KEY FEATURES
2. MARKET SIZE
3. MARKET SHARE
Source: StoxPlus from BMI
1. MARKET SEGMENTATION
Vietnam's pharmaceutical market was valued at VND80,679bn (USS3.90bn) at YE2014, an increasing of 16.0% compared to
the previous year. Up to 2018, pharmaceutical consumption is expected to reach VND139,832bn (USS7.06bn), equivalent to
a compound annual growth rate (CAGR) of 15.1%. In the period of 2019- 2023, the CAGR may be slightly lower, but will
remain in double-digit figures.
Vietnamese pharmaceuticals firms face with a high competitions from foreign competitors. Currently, because of outdated
technology infrastructure and the domestic population have strong preference for foreign drugs, medicine imports account
for more than 50% of the domestic demand. Domestic production meets 50% of total domestic demand, however the of
which was 38% of total demand only. For domestic production, 90% raw materials are imported. Vietnam has to import at
least 300 APIs each year from the international market.
Pharmaceuticals landscape is teeming with potentials for future growth. Vietnam’s expanding population in combination
with consumers become better educated and heightened health awareness.
47%53%
Domestic Foreign
Source: StoxPlus
39316
50082
59214
69298
80680
93549
25%
27%
18%
17% 16% 16%
0%
5%
10%
15%
20%
25%
30%
0
10000
20000
30000
40000
50000
60000
70000
80000
90000
100000
2010 2011 2012 2013 2014 2015f
Value (VND bn) Growth rate
Market sizing by total sales, 2010 – 2015F
Source: StoxPlus
4. KEY FINANCIALS OF TOP 10 PLAYERS
(listed companies only)
Company
Total assets
(VNDbn)
Net Revenue
(VND bn)
EBITDA
(VND bn)
ROA ROE
Market
share
Vimedimex Medi - Pharma 5815 11746 120 0.55% 16.57% 14.60%
PHYTOPHARMA 9120 6098 37 0.32% 19.61% 7.60%
DHG Pharmaceutical JSC 3483 3959 806 16.25% 25.05% 4.90%
Danang Pharmaceutical
Medical Equipment
880 1984 35 1.84% 18.36% 2.50%
Traphaco 1132 1660 241 13.14% 19.80% 2.10%
DOMESCO Medical 932 1658 209 13.56% 19.60% 2.10%
Binh Dinh Pharmaceutical 796 1242 73 5.73% 15.72% 1.50%
Pymepharco 1160 1172 226 13.22% 18.47% 1.50%
Mekophar Pharmaceutical 764 1146 233 22.89% 30.75% 1.40%
Imexpharm Pharmaceutical 1030 907 148 9.03% 11.27% 1.10%
Ha Tay Pharmaceutical 368 823 62 7.59% 18.67% 1.00%
If you want to have further information, please contact person below:
Research
Ms. Lan Nguyen
Senior Manager
lan.nguyen@stoxplus.com
+84(4) 35626962 (ext.109)
Business Information
Ms. Hue Vuong
Managing Director
hue.vuong@stoxplus.com
+84(8) 38233485 (ext.802)
Financial Information
Ms.Trang Truong
Managing Director
trang.truong@stoxplus.com
+84(4) 35626962 (ext.114)
Research Business Information Financial InformationResearch Business Information Financial Information
Pharmaceutical
FACT SHEET
Dated September 25th 2015
5. KEY FEATURES
2. MARKET SIZE
1. MARKET SEGMENTATION
Source: StoxPlusSource: StoxPlus
Vietnam Plastic Packaging Market Size and Growth
Source: StoxPlus
Plastic
Packaging
(US$3.9bn)
Flexible
Packaging
(US$834mn)
Rigid Packaging
PET containers
(US$652mn)
Caps & Closure
2,331.3
2,939.9 2,947.9
3,534.8
3,924.1
33.4%
26.1%
0.3%
19.9%
11.0%
0%
10%
20%
30%
40%
50%
0
1,000
2,000
3,000
4,000
5,000
2010 2011 2012 2013 2014
US$million
Market size Growth rate (%)
According to StoxPlus’ estimation, Vietnam plastic packaging sized at US$3.9bn by 2014 end, posting an impressive CAGR of
13.9% in the period 2010 – 2014. Of which, flexible packaging and PET bottles are the highest value segments, accounting for
21% (US$834mn) and 17% (US$652mn), respectively. In addition, the export value of plastic packaging products reached US$
2.1 billion.
In term of competitive landscaping, Vietnam plastic packaging is very fragmented with more than 700 firms in 2014 which
are mainly located in the South. PET bottles segment is dominated by local players namely Ngoc Nghia and Bao Van. Mean-
while, flexible packaging witnesses the fierce competition between two main groups of players: (i) domestic players including
Tan Tien, Thanh Phu, Liksin, and Rang Dong; and (ii) foreign-owned players including Tin Thanh (SCG Thailand), Huhtamaki,
Ngai Mee, Tong Yuan, and J.S Packaging.
Vietnam plastic packaging is forecasted to expanse by 15 – 20% y-o-y until 2020 thanks to increasing domestic demand from
beverage and packaged foods. In 2014, total soft drink market valued at US$3.59bn, posting an increase by 20% compared to
2013 while packaged food market sized at US$8.88bn. With the recovery in economics and increased westernization in life-
style, beverages and packaged food in Vietnam would perform well in the next few year, creating potentials for plastic
packaging manufacturers.
Vietnam Plastic Packaging Structure
Flexible
packaging
21%
PET
bottles
17%
Other
62%
Market Share of Plastic Packaging Sector
by Segment, 2014
3. MARKET SHARE 4. KEY FINANCIALS OF TOP 10 PLAYERS
(listed companies only)
Source: StoxPlus
Company
% Market
Share
Total Assets
(US$ Million)
Net Revenue
(US$ Million)
EBITDA
(US$ Million)
ROA ROE
Ngoc Nghia Industry - Service -
Trading
2.28% 87.56 89.32 12.35 1.12% 3.45%
An Phat Plastic 1.86% 66.42 72.91 6.47 3.65% 7.11%
Tan Tien Plastic Packaging 1.80% 55.06 70.75 6.63 2.96% 6.32%
Dong A Plastic 1.32% 37.12 51.76 3.80 3.97% 16.10%
Rang Dong Plastic 1.29% 34.85 50.44 3.82 3.40% 10.06%
Saigon Plastic Packaging 0.89% 34.55 34.83 3.75 1.16% 3.71%
Tan Dai Hung Plastic 0.88% 30.37 34.66 1.57 1.79% 3.77%
Tan Phu Plastic 0.80% 14.81 31.28 2.44 3.93% 15.60%
Vegetable Oil Packing 0.36% 11.01 13.94 1.83 10.39% 14.09%
Do Thanh Technology Corp. 0.13% 6.91 5.02 0.59 2.30% 2.88%
If you want to have further information, please contact person below:
Research
Ms. Lan Nguyen
Senior Manager
lan.nguyen@stoxplus.com
+84(4) 35626962 (ext.109)
Business Information
Ms. Hue Vuong
Managing Director
hue.vuong@stoxplus.com
+84(8) 38233485 (ext.802)
Financial Information
Ms.Trang Truong
Managing Director
trang.truong@stoxplus.com
+84(4) 35626962 (ext.114)
Research Business Information Financial InformationResearch Business Information Financial Information
Plastic Packaging
FACT SHEET
Dated September 25th 2015
4. KEY FEATURES
2. MARKET SIZE
3. KEY FINANCIALS OF TOP 10 PLAYERS (listed companies only)
1. MARKET SEGMENTATION
Source: StoxPlus from GSO
Source: StoxPlus
Source: StoxPlus
They aresubcontractorsto companies
in the three groups above
Large State-
Owned
Construction
Corporations
Large
private
construction
companies
Foreign
contractors
Small local
construction
companies
They may be private
companies or privatized
companies where the State
is no longer big shareholders
Foreign contractor
companies usually act as
lead contractor and
subcontract easier work to
local companies
Civil works
They are civil and industrial
construction groups belonging to
the Ministry of Construction.
These companies have diversified
resources toengage in big &
complicated construction projects
209,441.80
261,577.00
288,133.80
312,542.20
325,981.51
163,900.00
43.39%
24.89%
10.15%
8.47%
4.30% 4.33%
0%
5%
10%
15%
20%
25%
30%
35%
40%
45%
50%
-
50,000
100,000
150,000
200,000
250,000
300,000
350,000
2010 2011 2012 2013 2014 6M2015
Value (VND bn) Growth ratio
Industry growth slowed from 43.9% in 2010 to 4.3% in 2014 and 4.33% in 1H2015, due to a slump in the property market, a
banking system characterized by non-performing loans (NPLs) and a sluggish real estate sector. Overall, the Vietnamese
housing builder industry recorded a compound annual growth rate (CAGR) of only 12% during the period 2010–2014. Never-
theless, the industry prospect is positive given the government’s focus on industrial and residential construction.
House building in Vietnam is a very fragmented business. Majority of houses in Vietnam are developed by individual families.
In most of cases, Vietnamese families contract only a small team of builders to build their houses. Larger and established
construction companies do not tap this market. They focus on high-rise apartment building or residential projects of real-
estate development companies.
High potential to grow in urban areas. Vietnam’s population exceeds 90 millions and 80% of the total population in working
age and is projected to reach 100 millions by 2030. Big population will require a high supply for accommodation, especially
in urban areas as many young labors will try to become residents of big cities. Along with increasing income per capita of
Vietnamese, the demand for upgrading or renewing their accommodation will go in parallel.
Company
Total assets
(VNDbn)
Net Revenue EBITDA
(VND bn)
ROA ROE
(VND bn)
Vinaconex Group 22,822 8,348 1,029 1% 5%
COTEC construction 4,863 7,634 499 7% 14%
Hoa Binh Real Estates 5,803 3,568 264 1% 7%
Hancorp 6,670 3,566 58 0.05% 0.33%
Idico Urban & House Development 397 1,701 54 7% 15%
Construction No. 5 2,190 1,392 84 2% 10%
HUD1.,JSC 742 727 19 1% 5%
Hong Ha Vietnam 846 576 27 0 0
Phuc Hung Holdings 686 529 31 1% 3%
Viet Nam Construction No.1 629 457 27 2% 5%
Total amount of housing investment disbursed
2010 – 1H2015
If you want to have further information, please contact person below:
Research
Ms. Lan Nguyen
Senior Manager
lan.nguyen@stoxplus.com
+84(4) 35626962 (ext.109)
Business Information
Ms. Hue Vuong
Managing Director
hue.vuong@stoxplus.com
+84(8) 38233485 (ext.802)
Financial Information
Ms.Trang Truong
Managing Director
trang.truong@stoxplus.com
+84(4) 35626962 (ext.114)
Research Business Information Financial InformationResearch Business Information Financial Information
Housing Builder
FACT SHEET
Dated September 25th 2015
4. KEY FEATURES
2. MARKET SHARE
3. MARKET SIZE
1. MARKET SEGMENTATION
Source: StoxPlus from Euromonitor
Source: StoxPlus from
General Statistics Office
of Vietnam
Total retail sales of goods and services increased 11.12%, earning VND2,145,470bn in the first nine months of 2014. Accord-
ing to Ministry of Industry and Trade and the Association of Vietnam Retailers, by the end of 2013, retailing contributed 15%
to Vietnam GDP.
Vietnam’s retail sales continued the high growth trajectory in recent years, and is characterized as one of the most
dynamic markets in the region. Vietnam’s Consumer Confidence Index has improved steadily after the recession and
remained above the average global level. Furthermore, despite the economy is still in trouble, consumers are experienced a
better living standard with the presence of global movements. CF companies can help Vietnamese consumers to purchase
qualified products rather than cheap ones with lower lending rate.
In 2014, there are many large retailers such as Lotte (South Korea) and Aeon (Japan) making strong presence in Vietnamese
market. Following the trend, a number of retail groups are researching and seeking investment opportunities like Walmart,
Auchan, Robinson starting their retail operations in Vietnam.
Vietnam is a potential retail market in terms of distribution service market, which is the particularly attractive sectors,
and retailing service, which is considered to be one of most tempting parts with remarkable growth rate. Admittedly, this
has been regarded as the characteristic throughout almost all of Vietnam’s commitment to open distribution and retailing
channels in Vietnam so far.
Wholesale
6% RetailPodium
3%
Department
Store
14%
Supermarket
46%
Shopping
Centre
31%
Vietnam Total Retail Sales (Value in VNDbn)
18%
15%
14%
13%
12%
7%
6%
3%
3%
3% 2%
4%
FoocoMart- Vissan
Shop&Go
B's mart
Co.op
Circle K
Family mart
Satrafoods
Guardian
Hapro
Co.op Food
G7 Mart Ministop
Others
Source: StoxPlus from Euromonitor
Market share of players by # of outlets
465,381580,710
726,113
968,067
1,197,480
1,561,480
2,004,360
2,324,443
2,617,963
2,945,277
3,987,680
0
500,000
1,000,000
1,500,000
2,000,000
2,500,000
3,000,000
3.500,000
4,000,000
4,500,000
Vietnam Total Retail Sales (Value in VNDbn)
If you want to have further information, please contact person below:
Research
Ms. Lan Nguyen
Senior Manager
lan.nguyen@stoxplus.com
+84(4) 35626962 (ext.109)
Business Information
Ms. Hue Vuong
Managing Director
hue.vuong@stoxplus.com
+84(8) 38233485 (ext.802)
Financial Information
Ms.Trang Truong
Managing Director
trang.truong@stoxplus.com
+84(4) 35626962 (ext.114)
Research Business Information Financial InformationResearch Business Information Financial Information
Retails
FACT SHEET
Dated September 25th 2015

10 Sectors Factsheet

  • 1.
    4. KEY FEATURES 4.94.8 7.2 8.2 6.3 7.4 8.9 10.4 7% 5% 8% 8% 5.2% 5.2% 6.0% 6.6% 8% 7% 7% 6% 4.7% 5.3% 5.4% 5.3% 0% 1% 2% 3% 4% 5% 6% 7% 8% 9% - 2 4 6 8 10 12 Dec-07 Sep-08 Dec-09 Dec-10 Dec-11 Dec-12 Dec-13 Aug-14 Consumer Loans Balance in USDbn % Consumer Loans/GDP % Consumer Loans/Loan Book Source: StoxPlus from SBV and StoxPlus 3. MARKET SIZE Consumer Loan Balance (USDbn) and %GDP, %Total Loans 2. KEY FINANCIALS OF TOP 6 NON-BANK PLAYERS Source: StoxPlus from NFSC and SBV 38% 13%2% 30% 6% 7% 4% 49% 3% 10% 1% 37% 1. MARKET SEGMENTATION Breakdown of Vietnam Consumer Loans, as of 30/08/2014 SOCBs JSCBs Foreign Banks Finance Companies Others Source: StoxPlus from NFSC and SBV Breakdown of Vietnam Consumer Loans by players, as of 30/08/2014 Housing loans / Home improvement loans (without collaterals) Vehicle loans (two-wheelers and automobiles) Education and medical loans Home appliances and furniture loans Personal overdraft account Loans for other purposes - cultural sports, and travelling Credit card outstandingSource: StoxPlus from NFSC Consumer Finance FACT SHEET Dated September 25th 2015 Vietnam consumer loan has reached US$10.4bn as of August 2014 and is expected to continue its fast-growing trajectory in 2015: Finance companies have the fastest growth in consumer loans compared to other types of players. This result is due to the easy credit (quick loan processing) business model, so finance companies can charge the highest interest rate in the market (ranging from 30-80% APR depend- ing on products). Finance companies have the fastest growth in consumer loans compared to other types of player, accounting for 10% of total consumer loans. According to data of loan outstanding of finance companies, PPF is still the market leader with the highest growth rate of 23.1% in 2014 compared to 2013. VP Finance Company (i.e. FE Credit) ranked second among finance companies in terms of loan outstanding as reported to the SBV. However, according to our own analysis, the actual loan outstanding of FE Credit is much larger, and that they should be ranked as CF market leader. CF customers tend to be Mass – Upper Mass individuals. Their monthly income mostly ranges from VND3-7mn (US$150-350): In our sample size of 500 CF users, more than 70% of participants have monthly income ranging from VND3-7mn (or US$150-350) with the mean of the population at VND6.44 million. Cash loan and e-wallet are expected to continue as emerging product trends and gain momentum reshape the industry: as the rise of ecommerce, e-wallet would be an essential infrastructure for the online/mobile consumer finance. The appearance of MobiVi and MoMo could serve as a loan distribution as well as payment channel. If you want to have further information, please contact person below: Research Ms. Lan Nguyen Senior Manager lan.nguyen@stoxplus.com +84(4) 35626962 (ext.109) Business Information Ms. Hue Vuong Managing Director hue.vuong@stoxplus.com +84(8) 38233485 (ext.802) Financial Information Ms.Trang Truong Managing Director trang.truong@stoxplus.com +84(4) 35626962 (ext.114) % Market Share Total Assets (US$ million) Net Revenue (US$ million) ROA ROE Home Credit 33% 7,883.60 2,196.4 0.28% 1.40% Prudential Finance 20% 3,507.90 482.3 0.14% 0.67% Toyota Finance 8% 1,685.10 68.7 0.04% 0.12% HD Saison 14% 1,713.10 315.5 0.18% 0.60% Jaccs 3% 573.6 90.4 0.16% 0.19% FE Credit 21% 5.867 189.945 32% 156% Research Business Information Financial InformationResearch Business Information Financial Information
  • 2.
    5. KEY FEATURES 2.MARKET SIZE 4. KEY FINANCIALS OF TOP 10 PLAYERS (listed companies only) 1. MARKET SEGMENTATION Source: StoxPlus Food Processing Frozen Processed Food Dried Processed Food Chilled Processed Food 866.28 944.78 1,116.17 1,245.12 1,380.88 12.69% 9.06% 18.14% 11.55% 10.90% 0% 2% 4% 6% 8% 10% 12% 14% 16% 18% 20% 0 200 400 600 800 1000 1200 1400 1600 2010 2011 2012 2013 2014 US$million Total sales value Growth Rate Market sizing by total sales volume Vietnam food processing industry sized at US$1.38bn, posting good performance with the CAGR of 12.4% yoy during the period 2010 – 2014. Of which, dried processed food accounted for a major part of the whole sector (over 85%). The sector witnesses fierce competition with the participation of many giants in each segment. Masan Group, Masan Consumer, Minh Phu Seafood and Hung Vuong Corporation are giants in their own sectors. However, as the sector is foreseen to expand aggressively in following years, the appearance of new comers is manifest. Food processing market is forecasted to grow by over 12% y-o-y in the next few years, especially with the sign of many FTA including Korean, Japan …. The new generation of FTAs that Vietnam has signed with key food exporting countries will remain the country’s position as one of the most attractive investment opportunities in the region during following years. Especially, frozen processed food will be invested remarkably as Japan, U.S, E.U, Eurasian are all major seafood import countries, representing over 60% of Vietnam total seafood export volume. Source: StoxPlus from Euromonitor Company Total assets (US$ million) Net Sales (US$ million) EBITDA (US$ million) ROA ROE Masan Group 2,469.24 750.05 248.26 2.17% 7.34% Minh Phu Seafood Corp. 432.89 703.72 63.84 8.92% 44.79% Hung Vuong Corporation 420.75 694.72 39.45 3.06% 12.36% Masan Consumer 1,116.86 610.65 233.12 13.03% 23.58% Vinh Hoan Corp. 209.42 293.35 34.79 12.47% 26.31% STAPIMEX 61.62 251.27 3.67 2.64% 12.59% Dabaco 196.75 238.64 23.21 5.00% 11.58% Kinh Do Corporation 367.17 230.89 42.51 7.53% 9.69% Viet Thang Feed 75.57 206.17 11.14 9.58% 16.14% Nha Trang Seafoods F17 113.09 178.82 17.44 9.94% 38.73% 10% 4% 86% 3. MARKET SHARE Market share by sub-sectors Frozen Processed Food Chilled Processed Food Dried Processed Food Source: StoxPlus Source: StoxPlus from Euromonitor If you want to have further information, please contact person below: Research Ms. Lan Nguyen Senior Manager lan.nguyen@stoxplus.com +84(4) 35626962 (ext.109) Business Information Ms. Hue Vuong Managing Director hue.vuong@stoxplus.com +84(8) 38233485 (ext.802) Financial Information Ms.Trang Truong Managing Director trang.truong@stoxplus.com +84(4) 35626962 (ext.114) Research Business Information Financial InformationResearch Business Information Financial Information Food Processing FACT SHEET Dated September 25th 2015
  • 3.
    5. KEY FEATURES 2.MARKET SIZE1. MARKET SEGMENTATION Source: StoxPlus IndustrialTransportation Delivery Services Forwarding Marine Transportation Ocean Shipping Railroads Transportation Services Distribution Center Port Operation Air Cargo Terminal Project Cargo Transport Trucking Inland Transport 100% 102% 104% 106% 108% 110% 112% 114% 0 200000 400000 600000 800000 1000000 1200000 2009 2010 2011 2012 2013 2014 Thousandtons Total volume of freight traffic Growth rate Vietnam’s logistics market is currently worth US$60 billion. In total, there are around 1,000 logistics firms – 25 of which are foreign firms. Foreign firms of note are Maersk Logistics, APL Logistics, NYK Logistics and MOL Logistics. Most foreign firms can offer third or fourth party logistics (3PL or 4PL) services while Vietnam domestic firms can only handle 2PL services. Foreign firms currently hold 80 percent of the market share, worth US$48 billion. For ocean shipping, foreign players are totally dominating the market. Almost all global giant shipping lines have their own logistics companies in Vietnam i.e. APL has APL logistics, NYK has NYK logistics, OOCL has OOCL logistics. Many seaports and airports also lack supporting distribution centers, which can result in increased inventory and idle time for trucks, ships and planes. The average growth of Vietnam’s logistics sector is estimated at 20% yoy. There is an increasing number of multi- national corporations( e.g. Nike, Intel, Nokia, Samsung) investing in Vietnam showing large opportunity for local forwarding and warehousing development. The sector’s annual growth rate is expected to remain around 20-25% in the next 5 years. Market sizing by volume of freight traffic, 2009 - 2014 4. KEY FINANCIALS OF TOP 10 PLAYERS (listed companies only) 3. MARKET SHARE Company Total assets (US$ million) Net Revenue (US$ million) EBITDA (US$ million) ROA ROE PVTrans 113.54 175.77 40.24 14.06% 25.55% Vietnam Sun 381.34 140.45 50.41 6.72% 11.34% Gemadept 262.59 127.77 20.20 0.56% 7.48% Mai Linh Group 14.40 105.46 1.03 4.10% 6.57% Vinalines Logistics Viet Nam 237.36 94.97 26.62 1.36% 5.63% Vietnam Ocean Shipping 23.38 79.36 2.67 9.35% 22.91% VINAFREIGHT 20.57 75.72 7.49 22.46% 69.92% Saigon Beer Transportation 98.31 71.15 18.05 2.41% 5.00% Vitaco - Vietnam Tanker 17.72 61.44 2.95 11.96% 32.27% Viettel Post 113.54 175.77 40.24 14.06% 25.55% 60 43 37 24 23 23 20 20 20 9 6 5 4 0 10 20 30 40 50 60 70 Thousands Capacity of key players in Cold Storage Sector Source: StoxPlus If you want to have further information, please contact person below: Research Ms. Lan Nguyen Senior Manager lan.nguyen@stoxplus.com +84(4) 35626962 (ext.109) Business Information Ms. Hue Vuong Managing Director hue.vuong@stoxplus.com +84(8) 38233485 (ext.802) Financial Information Ms.Trang Truong Managing Director trang.truong@stoxplus.com +84(4) 35626962 (ext.114) Research Business Information Financial InformationResearch Business Information Financial Information Logistics FACT SHEET Dated September 25th 2015
  • 4.
    5. KEY FEATURES 2.MARKET SIZE 1. MARKET SEGMENTATION Source: StoxPlus 13.3% 1.1% 1.0% 4.2% 4.0% 0,0% 2,0% 4,0% 6,0% 8,0% 10,0% 12,0% 14,0% 0 2000 4000 6000 8000 10000 12000 2010 2011 2012 2013 2014 2015 1000MT Market size Growth Rate Fertilizer Market Single nutrient fertilizer Potassium SA Urea DAP Multi nutrient fertilizer NPK Organic fertilizer Total fertilizer consumption reached approximately 10.8 million tons in 2014 with the growth rate of 4.2%. Main findings from our interviews with industry experts and sector analysts are concerned with the over-surplus situation of the market, as well as lowering prices due to the pervasion of cheap smuggled fertilizer from China. Since 2012, consumption of NPK in Vietnam has occupied the largest share of total fertilizer consumption in Vietnam market (more or less 37% of total fertilizer consumption at all types). From a country that has to import fertilizer, Vietnam has been able to supply domestic consumption of ferti- lizers: By establishing new factories and expanding current scale production, there is a significant increase in fertilizer production from approximately VND 5,370 thousand tons in 2009 to over 9 thousand tons in 2014. Meanwhile, total imported fertilizer is in a downward trend leading to a supply surplus for Urea, phosphate and NPK. However, SA and potassium still depend on imports entirely. Distribution system for fertilizer in Vietnam is very fragmented and regional-based: Fertilizer is distributed through a complicated and overlapping distribution system consisting of 4 major groups of players (fertilizer manufacturers, trading companies, distributors, and agents level 1,2 and 3). No players have a distribution network by themselves. Rather, they connect with different agents to distribute fertilizer products. Source: StoxPlus Market sizing by total consumption, 2010 – 2015F 4. KEY FINANCIALS OF TOP 10 PLAYERS (listed companies only) Vinachem 50% Baconco 5%Fivestar 8% Can Tho fertilizer & Chemical JSC 5% General materials biochemical Fertilizer JSC 9% Song Gianh Corporation 8% Quang Binh Agricultural Corporation 2% Apromaco 4% JVF 9% 3. MARKET SHARE Source: StoxPlus consolidated Market share of NPK Fertilizer sector by capacity of local manufacturers, as of 31/12/2014(thousand MT/year) Company Total assets (US$ million) Net Revenue (US$ million) EBITDA (US$ million) ROA ROE Phu My Fertilizer 472.37 446.10 72.71 10.48% 12.09% Petrolimex Petrochemical 167.17 318.06 19.85 8.08% 23.90% Binh Dien Fertilizer 139.50 297.93 23.52 7.77% 30.33% PetroVietnam Camau Fertilizer 772.89 282.37 118.45 5.32% 18.23% Lam Thao Fertilizers 123.81 232.89 31.21 16.15% 30.25% SouthEast PVFC 12.72 131.81 2.08 9.63% 18.34% Quang Binh Import And Export 72.89 124.04 4.63 6.48% 25.39% Petro Viet Nam Fertilizer and Chemical Southern West 12.55 119.05 2.12 12.68% 14.94% Central Petrovietnam Fertilizer and Chemicals 12.49 109.69 2.78 16.90% 27.55% The Southern Fertilizer 73.75 104.55 9.36 5.59% 17.15% Source: StoxPlus If you want to have further information, please contact person below: Research Ms. Lan Nguyen Senior Manager lan.nguyen@stoxplus.com +84(4) 35626962 (ext.109) Business Information Ms. Hue Vuong Managing Director hue.vuong@stoxplus.com +84(8) 38233485 (ext.802) Financial Information Ms.Trang Truong Managing Director trang.truong@stoxplus.com +84(4) 35626962 (ext.114) Research Business Information Financial InformationResearch Business Information Financial Information Fertilizer FACT SHEET Dated September 25th 2015
  • 5.
    5. KEY FEATURES 2.MARKET SIZE 4. FINANCIAL INDICATORS OF TOP 10 PLAYERS (listed companies only) 1. MARKET SEGMENTATION Source: StoxPlus from VNCA Building Materials in Vietnam Cement PC30, PC40 PCB30, PCB40 Superior Cement Products Glass Metal Wood adn timber Others Total Domestic Cement Consumption in VietnamVietnam Cement Sector Structure Source: StoxPlus Supply surplus remains the main challenge for Vietnam cement industry in the next few years. Despite strong growth of domestic consumption and export activities, Vietnam cement market continues to experience the supply surplus with consi- derably low utilization rate of 60% in 2014 if excluding export sale volume. According to StoxPlus’ analysis, under the base case, cement consumption would expanse by 7% y-o-y until 2025. Meanwhile, supply capacity will increase remarkably in the same period with the construction of many “mega” cement factories in the North and the South. As such, the market will not reach equilibrium until 2022 at our base case scenario. In terms of competition, Vietnam Cement Industry Corporation (“VICEM”) is still the market leader with 35% of total sale volume in 2014, followed by foreign-own cement manufacturers (31%) including LafargeHolcim, Nghi Son, Chinfon, and Song Gianh. The 34% remaining market share are occupied by Viettel and other local privates which consist of 28 low production capacity companies. In 2014, the sector witnessed an active consolidation process, recording 4 M&A deals with the participation of both foreign-owned and domestic companies. Beside, cement manufacturers started to promote direct sale to retailers as well as to use renewable energies and materials in order to improve their operational efficiency. The pioneers for this trend include LafargeHolcim and TopCement. Source: StoxPlus VICEM 35% Foreign- owned 31% Local Private 30% Viettel (Cam Pha, Ha Long) 4% Market share of Vietnam cement sector by sale revenue 2014 Source: StoxPlus from VNCA 3. MARKET SHARE 50.20 49.20 45.81 46.31 50.82 31.21 10.3% -2.0% -6.9% 1.1% 9.7% 10.0% -8% -6% -4% -2% 0% 2% 4% 6% 8% 10% 12% 0 10 20 30 40 50 60 2010 2011 2012 2013 2014 8M2015 milliontons Cement Domestic Consumption Growth rate Company % market share Total Assets (US$mn) Net Revenue (US$mn) EBITDA (US$mn) ROA ROE VICEM Ha Tien 8.75% 591.54 315.72 72.76 4.79% 16.18% VICEM Bim Son 6.30% 262.23 202.47 35.37 2.84% 12.60% VICEM But Son 4.55% 208.25 136.90 29.07 2.57% 12.14% Quang Ninh Construction & Cement 1.43% 96.96 60.19 9.54 0.54% 5.49% VICEM Hai Van 1.40% 50.53 42.78 4.42 0.65% 2.34% Cong Thanh Cement 0.74% 465.49 55.93 7.38 0.24% 2.95% Yen Binh Cement 0.62% 41.63 31.18 6.08 2.75% 36.48% La Hien Cement 0.43% 28.76 26.88 5.01 3.45% 21.74% Sai Son Cement 0.39% 26.17 15.99 3.00 3.93% 7.73% Can Tho Cement 0.15% 10.41 13.13 0.76 1.38% 2.63% If you want to have further information, please contact person below: Research Ms. Lan Nguyen Senior Manager lan.nguyen@stoxplus.com +84(4) 35626962 (ext.109) Business Information Ms. Hue Vuong Managing Director hue.vuong@stoxplus.com +84(8) 38233485 (ext.802) Financial Information Ms.Trang Truong Managing Director trang.truong@stoxplus.com +84(4) 35626962 (ext.114) Research Business Information Financial InformationResearch Business Information Financial Information Cement FACT SHEET Dated September 25th 2015
  • 6.
    5. KEY FEATURES 2.MARKET SIZE 1. MARKET SEGMENTATION Source: StoxPlus Source: StoxPlus PlasticPackaging (US$3.9bn) Flexible Packaging (US834mn) Flexible packaging for Beverage Flexible packaging for Packaged food Flexible packaging for Pharmaceuticals Flexible packaging for Seafood Flexible packaging for Others Rigid Packaging PET containers (US$652mn) Caps & Closure Vietnam Flexible Packaging Structure 445.8 532.2 612.0 718.4 834.7 -10% 0% 10% 20% 30% 40% 50% 60% 70% 80% 90% -100 0 100 200 300 400 500 600 700 800 900 2010 2011 2012 2013 2014 US$mn Flexible packaging Flexible growth Market Sizing and Growth of Vietnam Flexible Packaging According to StoxPlus’ estimation, Vietnam flexible packaging sized at US$834mn by 2014 end, posting an impressive CAGR of 16.3% in the period 2010 – 2014. The market size valued at US$718mn and US$612mn in 2013 and 2012, respectively. In term of competitive landscaping, Tan Tien packaging is the market leader in Vietnam flexible packaging with around 9% of total market share in 2014. The market is quite fragments with large firms mainly located in the South as end-users of flexible packaging also situate here (including beverage, food and pharmaceuticals companies). The competition becomes fiercer between two main groups of players: (i) domestic players including Tan Tien, Thanh Phu, Liksin, and Rang Dong; and (ii) foreign-owned players including Tin Thanh (SCG Thailand), Huhtamaki, Ngai Mee, Tong Yuan, and J.S Packaging. Vietnam flexible packaging is forecasted to expanse by 15 – 20% y-o-y until 2020 thanks to increasing domestic demand from beverage and packaged foods. In 2014, total soft drink market valued at US$3.59bn, posting an increase by 20% com- pared to 2013 while packaged food market sized at US$8.88bn. With the recovery in economics and increased westernization in lifestyle, beverages and packaged food in Vietnam would perform well in the next few year, creating potentials for plastic packaging manufacturers. Source: StoxPlus Tan Tien Plastic Packaging 8,48% Liksin6,25% RangDong Plastic 6,20%TinThanh 5,44% Huhta- maki 4,49% Saigon Plastic Packaging 4,17% Saigon Trapaco 2,85% Source: StoxPlus 3. MARKET SHARE 4. KEY FINANCIALS OF TOP 6 PLAYERS (listed companies only)Market share of top 7 players by total sale in the South of Vietnam, 2014 Company Total Assets (US$ million) Net Revenue (US$ million) EBITDA (US$ million) ROA ROE An Phat Plastic 66.42 72.91 6.47 3.65% 7.11% Tan Tien Plastic Packaging 55.06 70.75 6.63 2.96% 6.32% Rang Dong Plastic 34.85 50.44 3.82 3.40% 10.06% Saigon Plastic Packaging 34.55 34.83 3.75 1.16% 3.71% Tan Dai Hung Plastic 30.37 34.66 1.57 1.79% 3.77% Tan Phu Plastic 14.81 31.28 2.44 3.93% 15.60% If you want to have further information, please contact person below: Research Ms. Lan Nguyen Senior Manager lan.nguyen@stoxplus.com +84(4) 35626962 (ext.109) Business Information Ms. Hue Vuong Managing Director hue.vuong@stoxplus.com +84(8) 38233485 (ext.802) Financial Information Ms.Trang Truong Managing Director trang.truong@stoxplus.com +84(4) 35626962 (ext.114) Research Business Information Financial InformationResearch Business Information Financial Information Flexible Packaging FACT SHEET Dated September 25th 2015
  • 7.
    5. KEY FEATURES 2.MARKET SIZE 3. MARKET SHARE Source: StoxPlus from BMI 1. MARKET SEGMENTATION Vietnam's pharmaceutical market was valued at VND80,679bn (USS3.90bn) at YE2014, an increasing of 16.0% compared to the previous year. Up to 2018, pharmaceutical consumption is expected to reach VND139,832bn (USS7.06bn), equivalent to a compound annual growth rate (CAGR) of 15.1%. In the period of 2019- 2023, the CAGR may be slightly lower, but will remain in double-digit figures. Vietnamese pharmaceuticals firms face with a high competitions from foreign competitors. Currently, because of outdated technology infrastructure and the domestic population have strong preference for foreign drugs, medicine imports account for more than 50% of the domestic demand. Domestic production meets 50% of total domestic demand, however the of which was 38% of total demand only. For domestic production, 90% raw materials are imported. Vietnam has to import at least 300 APIs each year from the international market. Pharmaceuticals landscape is teeming with potentials for future growth. Vietnam’s expanding population in combination with consumers become better educated and heightened health awareness. 47%53% Domestic Foreign Source: StoxPlus 39316 50082 59214 69298 80680 93549 25% 27% 18% 17% 16% 16% 0% 5% 10% 15% 20% 25% 30% 0 10000 20000 30000 40000 50000 60000 70000 80000 90000 100000 2010 2011 2012 2013 2014 2015f Value (VND bn) Growth rate Market sizing by total sales, 2010 – 2015F Source: StoxPlus 4. KEY FINANCIALS OF TOP 10 PLAYERS (listed companies only) Company Total assets (VNDbn) Net Revenue (VND bn) EBITDA (VND bn) ROA ROE Market share Vimedimex Medi - Pharma 5815 11746 120 0.55% 16.57% 14.60% PHYTOPHARMA 9120 6098 37 0.32% 19.61% 7.60% DHG Pharmaceutical JSC 3483 3959 806 16.25% 25.05% 4.90% Danang Pharmaceutical Medical Equipment 880 1984 35 1.84% 18.36% 2.50% Traphaco 1132 1660 241 13.14% 19.80% 2.10% DOMESCO Medical 932 1658 209 13.56% 19.60% 2.10% Binh Dinh Pharmaceutical 796 1242 73 5.73% 15.72% 1.50% Pymepharco 1160 1172 226 13.22% 18.47% 1.50% Mekophar Pharmaceutical 764 1146 233 22.89% 30.75% 1.40% Imexpharm Pharmaceutical 1030 907 148 9.03% 11.27% 1.10% Ha Tay Pharmaceutical 368 823 62 7.59% 18.67% 1.00% If you want to have further information, please contact person below: Research Ms. Lan Nguyen Senior Manager lan.nguyen@stoxplus.com +84(4) 35626962 (ext.109) Business Information Ms. Hue Vuong Managing Director hue.vuong@stoxplus.com +84(8) 38233485 (ext.802) Financial Information Ms.Trang Truong Managing Director trang.truong@stoxplus.com +84(4) 35626962 (ext.114) Research Business Information Financial InformationResearch Business Information Financial Information Pharmaceutical FACT SHEET Dated September 25th 2015
  • 8.
    5. KEY FEATURES 2.MARKET SIZE 1. MARKET SEGMENTATION Source: StoxPlusSource: StoxPlus Vietnam Plastic Packaging Market Size and Growth Source: StoxPlus Plastic Packaging (US$3.9bn) Flexible Packaging (US$834mn) Rigid Packaging PET containers (US$652mn) Caps & Closure 2,331.3 2,939.9 2,947.9 3,534.8 3,924.1 33.4% 26.1% 0.3% 19.9% 11.0% 0% 10% 20% 30% 40% 50% 0 1,000 2,000 3,000 4,000 5,000 2010 2011 2012 2013 2014 US$million Market size Growth rate (%) According to StoxPlus’ estimation, Vietnam plastic packaging sized at US$3.9bn by 2014 end, posting an impressive CAGR of 13.9% in the period 2010 – 2014. Of which, flexible packaging and PET bottles are the highest value segments, accounting for 21% (US$834mn) and 17% (US$652mn), respectively. In addition, the export value of plastic packaging products reached US$ 2.1 billion. In term of competitive landscaping, Vietnam plastic packaging is very fragmented with more than 700 firms in 2014 which are mainly located in the South. PET bottles segment is dominated by local players namely Ngoc Nghia and Bao Van. Mean- while, flexible packaging witnesses the fierce competition between two main groups of players: (i) domestic players including Tan Tien, Thanh Phu, Liksin, and Rang Dong; and (ii) foreign-owned players including Tin Thanh (SCG Thailand), Huhtamaki, Ngai Mee, Tong Yuan, and J.S Packaging. Vietnam plastic packaging is forecasted to expanse by 15 – 20% y-o-y until 2020 thanks to increasing domestic demand from beverage and packaged foods. In 2014, total soft drink market valued at US$3.59bn, posting an increase by 20% compared to 2013 while packaged food market sized at US$8.88bn. With the recovery in economics and increased westernization in life- style, beverages and packaged food in Vietnam would perform well in the next few year, creating potentials for plastic packaging manufacturers. Vietnam Plastic Packaging Structure Flexible packaging 21% PET bottles 17% Other 62% Market Share of Plastic Packaging Sector by Segment, 2014 3. MARKET SHARE 4. KEY FINANCIALS OF TOP 10 PLAYERS (listed companies only) Source: StoxPlus Company % Market Share Total Assets (US$ Million) Net Revenue (US$ Million) EBITDA (US$ Million) ROA ROE Ngoc Nghia Industry - Service - Trading 2.28% 87.56 89.32 12.35 1.12% 3.45% An Phat Plastic 1.86% 66.42 72.91 6.47 3.65% 7.11% Tan Tien Plastic Packaging 1.80% 55.06 70.75 6.63 2.96% 6.32% Dong A Plastic 1.32% 37.12 51.76 3.80 3.97% 16.10% Rang Dong Plastic 1.29% 34.85 50.44 3.82 3.40% 10.06% Saigon Plastic Packaging 0.89% 34.55 34.83 3.75 1.16% 3.71% Tan Dai Hung Plastic 0.88% 30.37 34.66 1.57 1.79% 3.77% Tan Phu Plastic 0.80% 14.81 31.28 2.44 3.93% 15.60% Vegetable Oil Packing 0.36% 11.01 13.94 1.83 10.39% 14.09% Do Thanh Technology Corp. 0.13% 6.91 5.02 0.59 2.30% 2.88% If you want to have further information, please contact person below: Research Ms. Lan Nguyen Senior Manager lan.nguyen@stoxplus.com +84(4) 35626962 (ext.109) Business Information Ms. Hue Vuong Managing Director hue.vuong@stoxplus.com +84(8) 38233485 (ext.802) Financial Information Ms.Trang Truong Managing Director trang.truong@stoxplus.com +84(4) 35626962 (ext.114) Research Business Information Financial InformationResearch Business Information Financial Information Plastic Packaging FACT SHEET Dated September 25th 2015
  • 9.
    4. KEY FEATURES 2.MARKET SIZE 3. KEY FINANCIALS OF TOP 10 PLAYERS (listed companies only) 1. MARKET SEGMENTATION Source: StoxPlus from GSO Source: StoxPlus Source: StoxPlus They aresubcontractorsto companies in the three groups above Large State- Owned Construction Corporations Large private construction companies Foreign contractors Small local construction companies They may be private companies or privatized companies where the State is no longer big shareholders Foreign contractor companies usually act as lead contractor and subcontract easier work to local companies Civil works They are civil and industrial construction groups belonging to the Ministry of Construction. These companies have diversified resources toengage in big & complicated construction projects 209,441.80 261,577.00 288,133.80 312,542.20 325,981.51 163,900.00 43.39% 24.89% 10.15% 8.47% 4.30% 4.33% 0% 5% 10% 15% 20% 25% 30% 35% 40% 45% 50% - 50,000 100,000 150,000 200,000 250,000 300,000 350,000 2010 2011 2012 2013 2014 6M2015 Value (VND bn) Growth ratio Industry growth slowed from 43.9% in 2010 to 4.3% in 2014 and 4.33% in 1H2015, due to a slump in the property market, a banking system characterized by non-performing loans (NPLs) and a sluggish real estate sector. Overall, the Vietnamese housing builder industry recorded a compound annual growth rate (CAGR) of only 12% during the period 2010–2014. Never- theless, the industry prospect is positive given the government’s focus on industrial and residential construction. House building in Vietnam is a very fragmented business. Majority of houses in Vietnam are developed by individual families. In most of cases, Vietnamese families contract only a small team of builders to build their houses. Larger and established construction companies do not tap this market. They focus on high-rise apartment building or residential projects of real- estate development companies. High potential to grow in urban areas. Vietnam’s population exceeds 90 millions and 80% of the total population in working age and is projected to reach 100 millions by 2030. Big population will require a high supply for accommodation, especially in urban areas as many young labors will try to become residents of big cities. Along with increasing income per capita of Vietnamese, the demand for upgrading or renewing their accommodation will go in parallel. Company Total assets (VNDbn) Net Revenue EBITDA (VND bn) ROA ROE (VND bn) Vinaconex Group 22,822 8,348 1,029 1% 5% COTEC construction 4,863 7,634 499 7% 14% Hoa Binh Real Estates 5,803 3,568 264 1% 7% Hancorp 6,670 3,566 58 0.05% 0.33% Idico Urban & House Development 397 1,701 54 7% 15% Construction No. 5 2,190 1,392 84 2% 10% HUD1.,JSC 742 727 19 1% 5% Hong Ha Vietnam 846 576 27 0 0 Phuc Hung Holdings 686 529 31 1% 3% Viet Nam Construction No.1 629 457 27 2% 5% Total amount of housing investment disbursed 2010 – 1H2015 If you want to have further information, please contact person below: Research Ms. Lan Nguyen Senior Manager lan.nguyen@stoxplus.com +84(4) 35626962 (ext.109) Business Information Ms. Hue Vuong Managing Director hue.vuong@stoxplus.com +84(8) 38233485 (ext.802) Financial Information Ms.Trang Truong Managing Director trang.truong@stoxplus.com +84(4) 35626962 (ext.114) Research Business Information Financial InformationResearch Business Information Financial Information Housing Builder FACT SHEET Dated September 25th 2015
  • 10.
    4. KEY FEATURES 2.MARKET SHARE 3. MARKET SIZE 1. MARKET SEGMENTATION Source: StoxPlus from Euromonitor Source: StoxPlus from General Statistics Office of Vietnam Total retail sales of goods and services increased 11.12%, earning VND2,145,470bn in the first nine months of 2014. Accord- ing to Ministry of Industry and Trade and the Association of Vietnam Retailers, by the end of 2013, retailing contributed 15% to Vietnam GDP. Vietnam’s retail sales continued the high growth trajectory in recent years, and is characterized as one of the most dynamic markets in the region. Vietnam’s Consumer Confidence Index has improved steadily after the recession and remained above the average global level. Furthermore, despite the economy is still in trouble, consumers are experienced a better living standard with the presence of global movements. CF companies can help Vietnamese consumers to purchase qualified products rather than cheap ones with lower lending rate. In 2014, there are many large retailers such as Lotte (South Korea) and Aeon (Japan) making strong presence in Vietnamese market. Following the trend, a number of retail groups are researching and seeking investment opportunities like Walmart, Auchan, Robinson starting their retail operations in Vietnam. Vietnam is a potential retail market in terms of distribution service market, which is the particularly attractive sectors, and retailing service, which is considered to be one of most tempting parts with remarkable growth rate. Admittedly, this has been regarded as the characteristic throughout almost all of Vietnam’s commitment to open distribution and retailing channels in Vietnam so far. Wholesale 6% RetailPodium 3% Department Store 14% Supermarket 46% Shopping Centre 31% Vietnam Total Retail Sales (Value in VNDbn) 18% 15% 14% 13% 12% 7% 6% 3% 3% 3% 2% 4% FoocoMart- Vissan Shop&Go B's mart Co.op Circle K Family mart Satrafoods Guardian Hapro Co.op Food G7 Mart Ministop Others Source: StoxPlus from Euromonitor Market share of players by # of outlets 465,381580,710 726,113 968,067 1,197,480 1,561,480 2,004,360 2,324,443 2,617,963 2,945,277 3,987,680 0 500,000 1,000,000 1,500,000 2,000,000 2,500,000 3,000,000 3.500,000 4,000,000 4,500,000 Vietnam Total Retail Sales (Value in VNDbn) If you want to have further information, please contact person below: Research Ms. Lan Nguyen Senior Manager lan.nguyen@stoxplus.com +84(4) 35626962 (ext.109) Business Information Ms. Hue Vuong Managing Director hue.vuong@stoxplus.com +84(8) 38233485 (ext.802) Financial Information Ms.Trang Truong Managing Director trang.truong@stoxplus.com +84(4) 35626962 (ext.114) Research Business Information Financial InformationResearch Business Information Financial Information Retails FACT SHEET Dated September 25th 2015