Downloaded 485 times
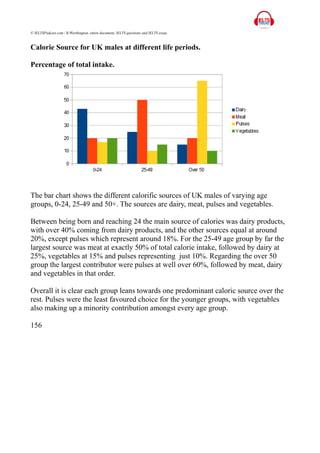
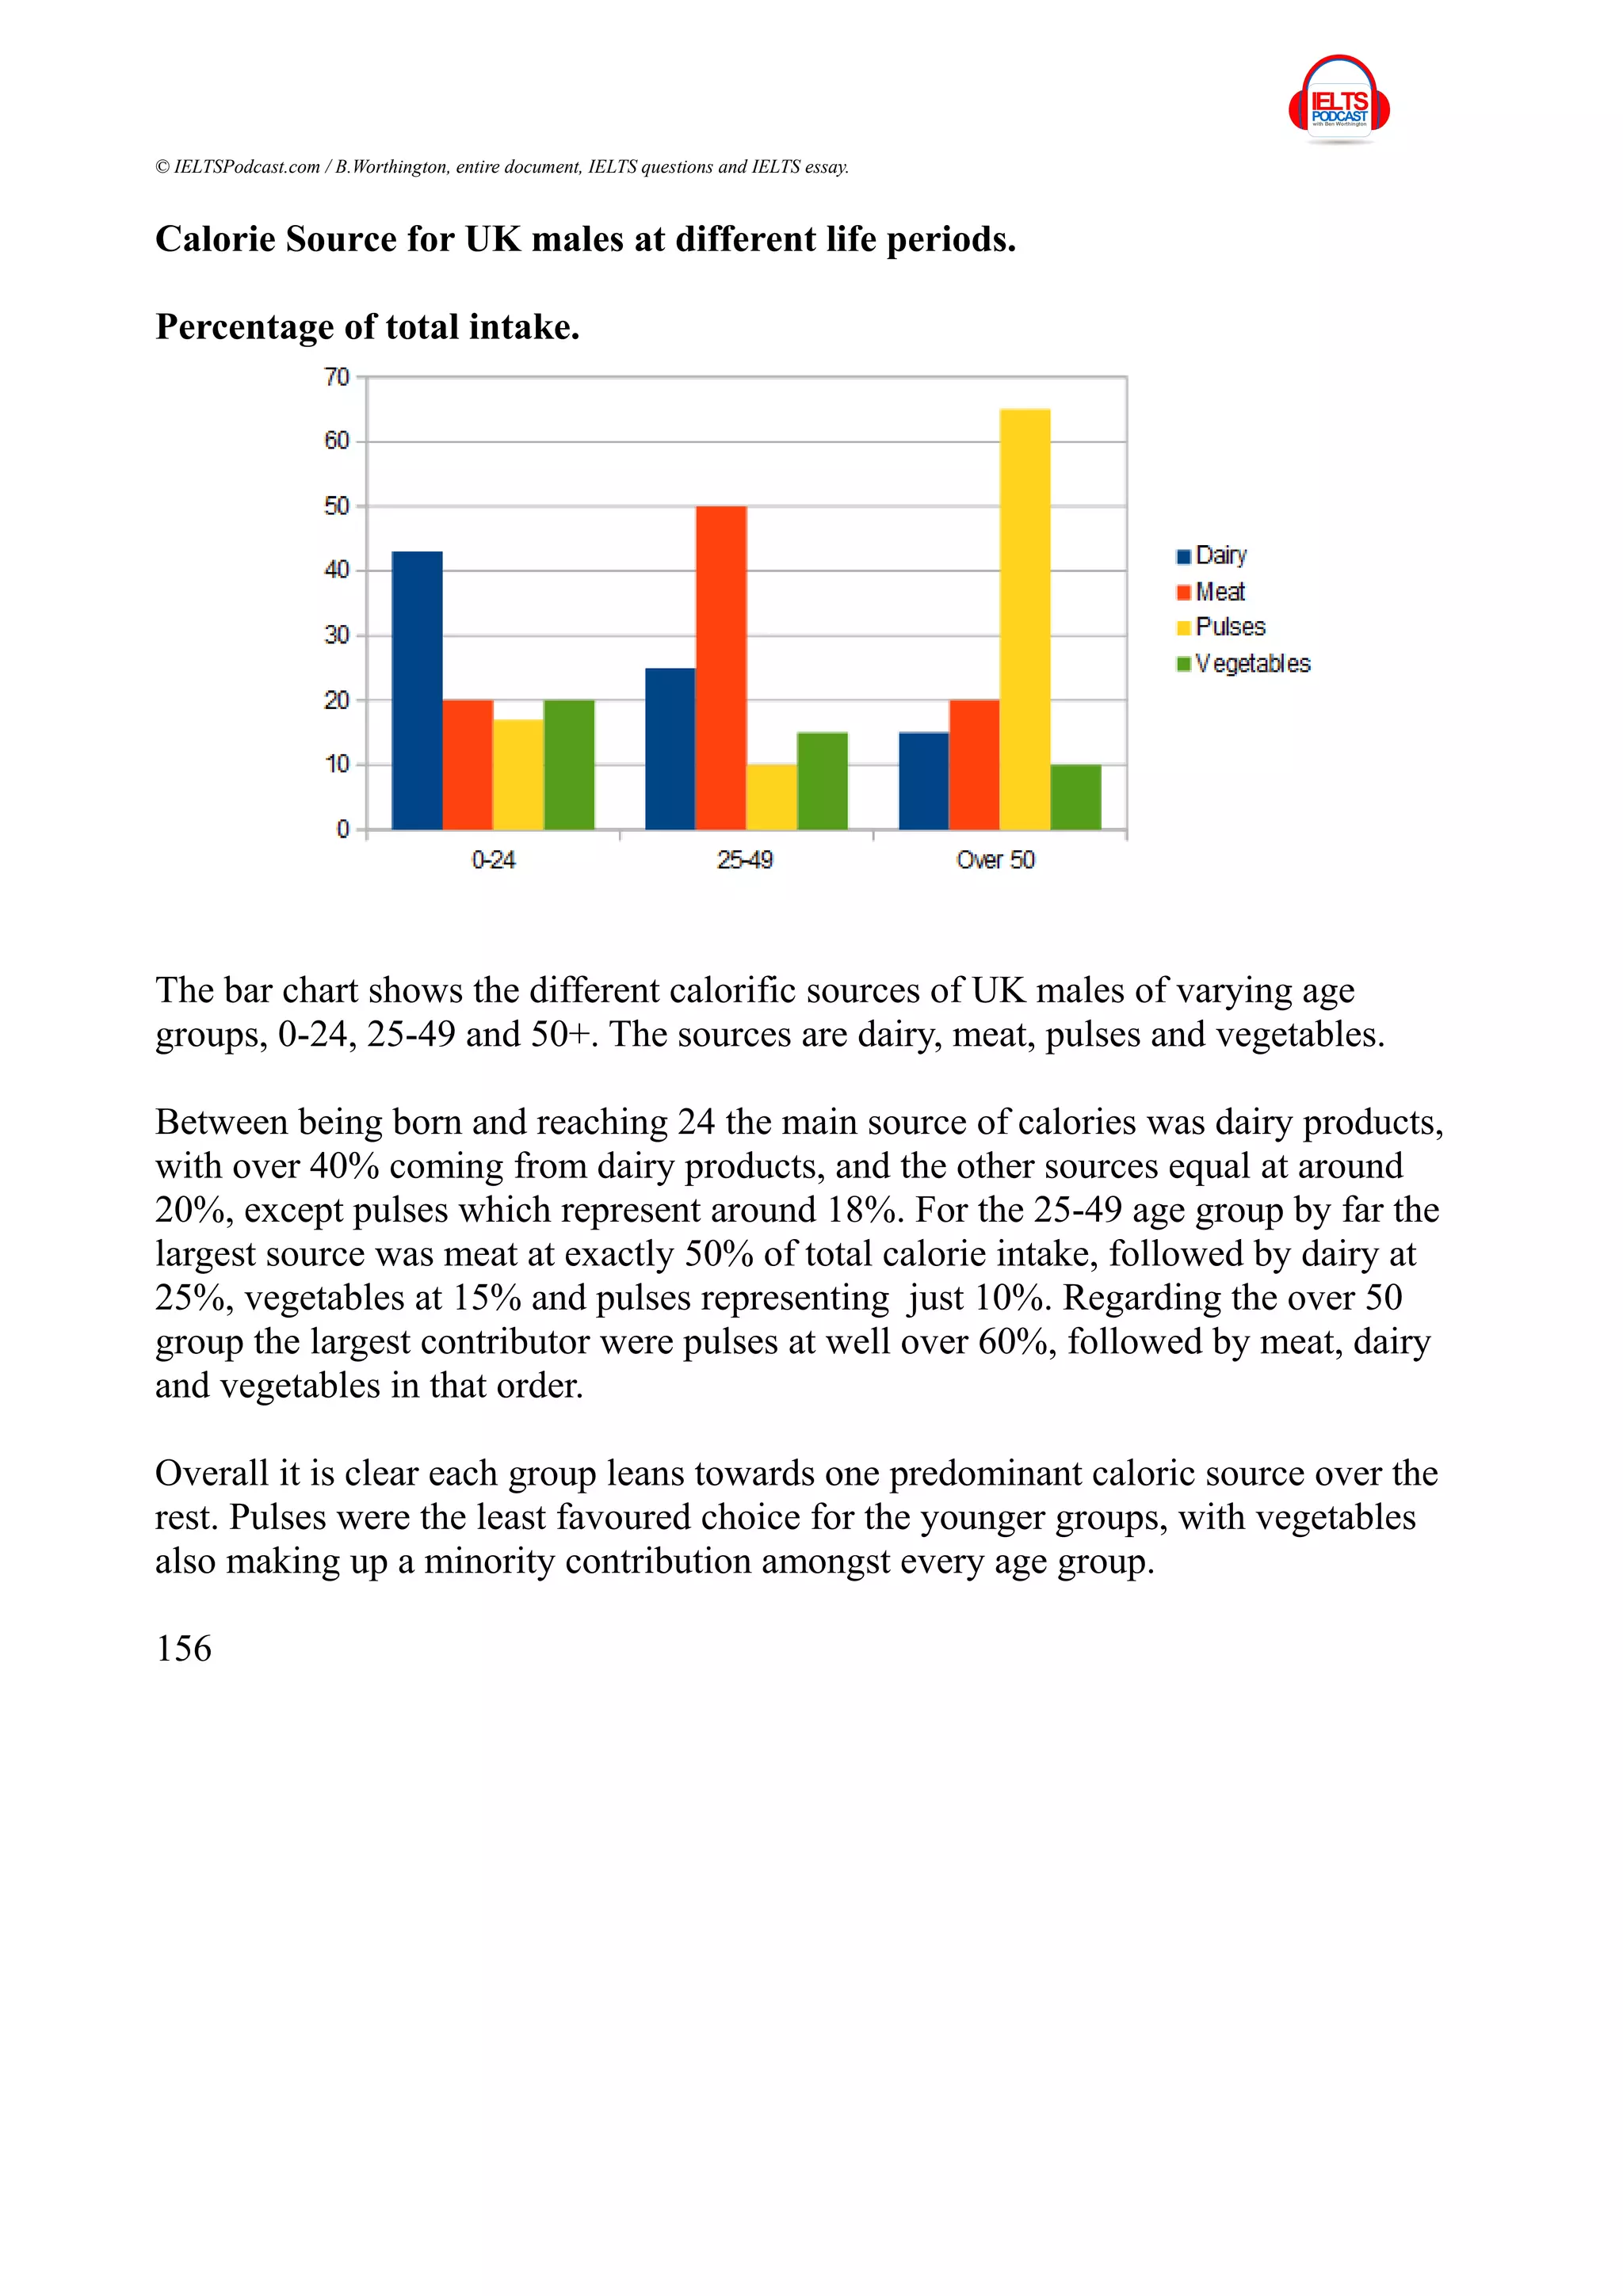
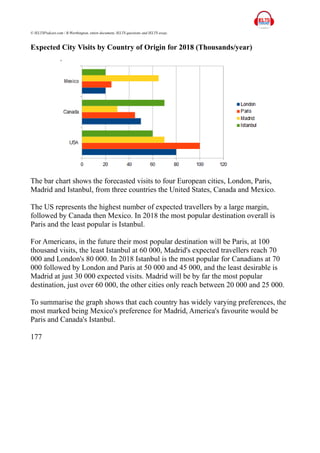
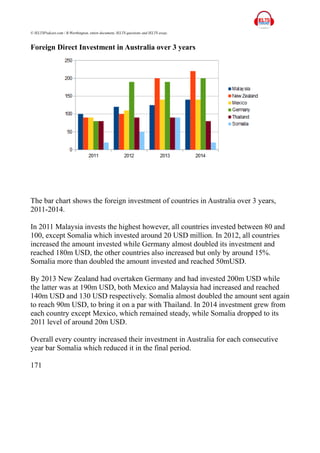
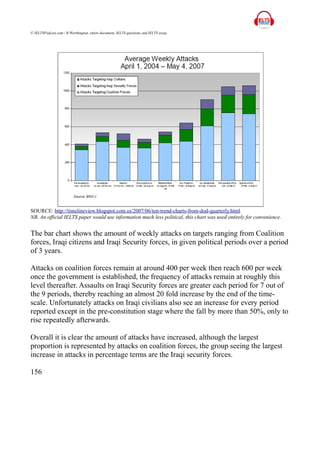
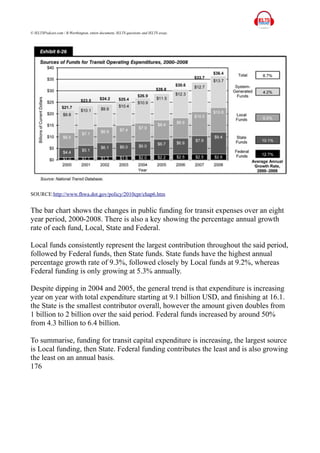
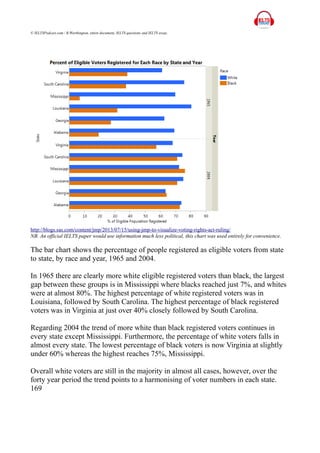

The document provides summaries of various bar charts highlighting key statistics on different topics, including calorific sources for UK males of various age groups, international student enrollment in British universities, and public transit funding in the UK. It illustrates trends in foreign direct investments, life expectancy across different countries, and expected city visits by travelers from the US, Canada, and Mexico. Overall, the data consistently reflects varying preferences and expenditures across demographics and regions, presenting a comparative analysis on multiple themes.


![[Fighter 5] Writing_Lesson 2_Pie & Mixed charts (1).pptx](https://cdn.slidesharecdn.com/ss_thumbnails/fighter5writinglesson2piemixedcharts1-241001121204-c48c68c7-thumbnail.jpg?width=640&height=640&fit=bounds)


