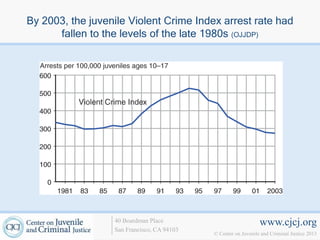
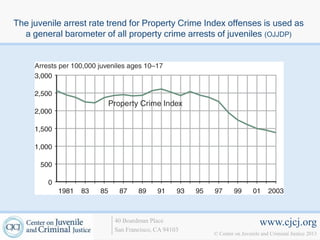
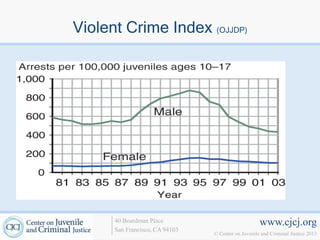
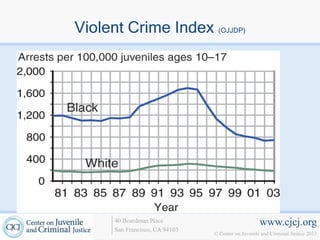
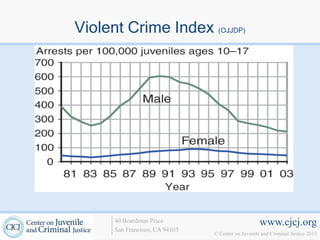
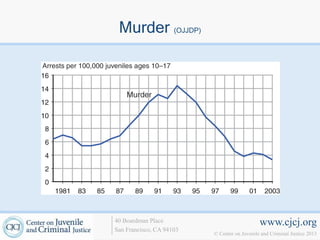
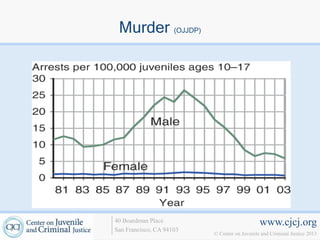
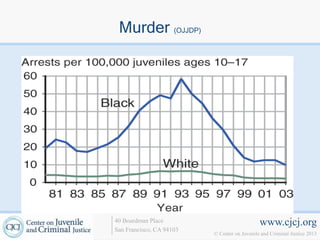
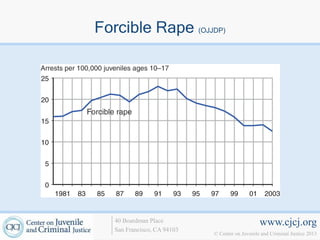
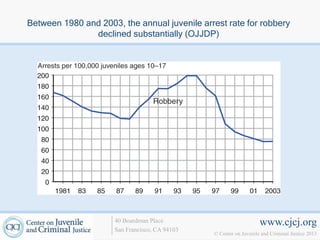
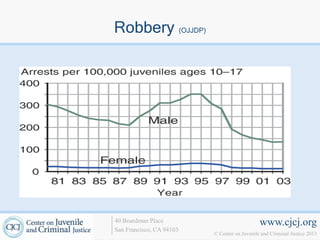
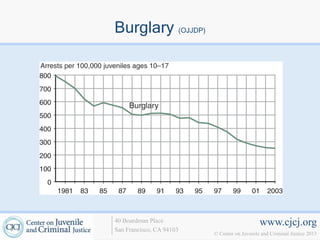
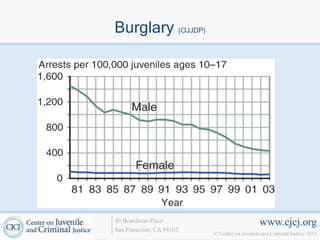
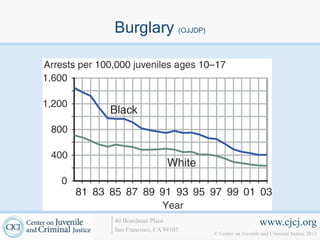
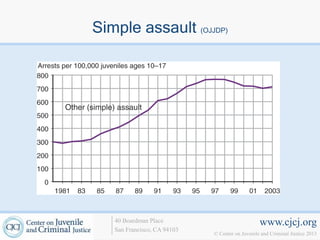
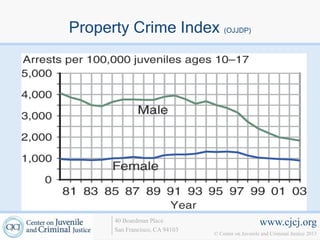
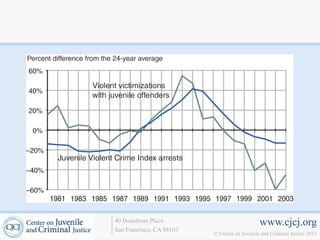
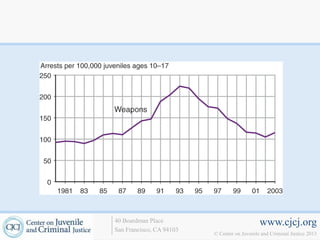
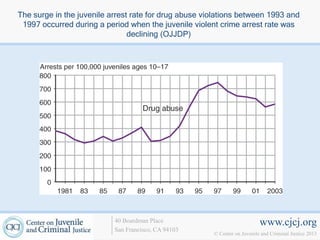
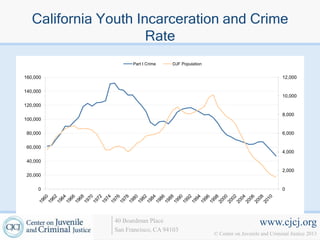
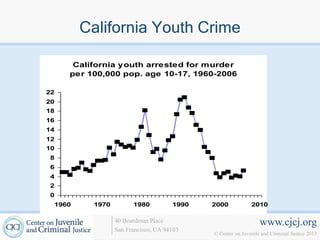
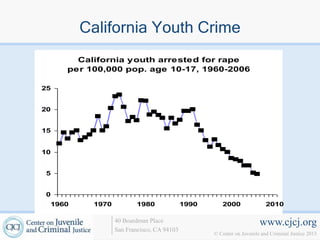
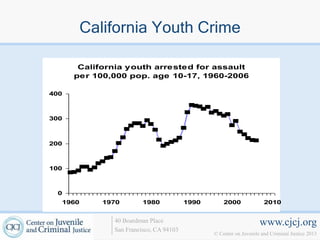
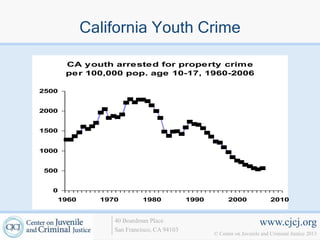
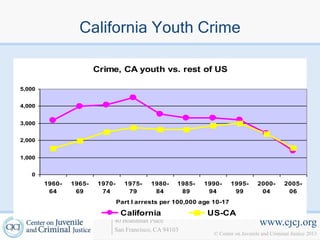
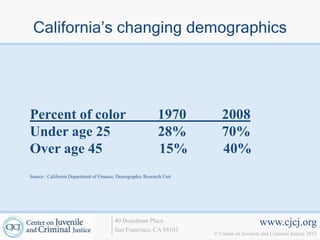
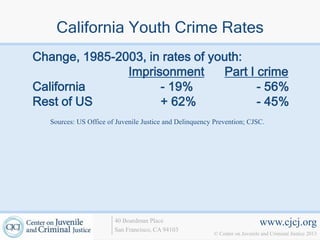
OFFICAL CRIME MEASURE
• UNIFORM CRIME REPORTS

• NATIONAL CRIME VICTIMIZATION SURVEYS

• JUVENILE COURT STATISTICS
  (http://ojjdp.ncjrs.gov/ojstatbb/jcsdb/)


                     40 Boardman Place                             www.cjcj.org
                     San Francisco, CA 94103
                                               © Center on Juvenile and Criminal Justice 2013
Primary Measures of the UCR

• Reported crime

• Arrests

• Clearances


                   40 Boardman Place                             www.cjcj.org
                   San Francisco, CA 94103
                                             © Center on Juvenile and Criminal Justice 2013
Uniform Crime Reports are comprised of index
           crimes and part II crimes:
Index Crimes
1. Homicide
2. Forcible rape
3. Robbery
4. Aggravated assault
5. Burglary
6. Larceny
7. Motor vehicle theft
8. Arson


                   40 Boardman Place                             www.cjcj.org
                   San Francisco, CA 94103
                                             © Center on Juvenile and Criminal Justice 2013
Uniform Crime Reports are comprised of
    index crimes and Part II crimes:

   Part II Crimes: all crimes not listed as index
                       crimes


               40 Boardman Place                             www.cjcj.org
               San Francisco, CA 94103
                                         © Center on Juvenile and Criminal Justice 2013
Part II Offenses Include:
•   simple assault                     • gambling
•   curfew offenses                    • liquor offenses,
•    loitering                         • Prostitution
•   embezzlement                       • public drunkenness
•   forgery and                        • stolen property
    counterfeiting,                    • vandalism
•   disorderly conduct                 • weapons offenses
•   driving under the
    influence
•   drug offenses
•    fraud
                     40 Boardman Place                              www.cjcj.org
                     San Francisco, CA 94103
                                                © Center on Juvenile and Criminal Justice 2013
Criticism of the UCR
•   Easily manipulated for political reasons
•   Skewed towards street crimes
•   Only counts the most series crime
•   Does not count the overcharge
•   Different jurisdiction arrest practices


                      40 Boardman Place                             www.cjcj.org
                      San Francisco, CA 94103
                                                © Center on Juvenile and Criminal Justice 2013
National Crime Victimization Survey
              NCVS

  Published by the Census bureau and Bureau
              of Justice Statistics


             40 Boardman Place                             www.cjcj.org
             San Francisco, CA 94103
                                       © Center on Juvenile and Criminal Justice 2013
The National Crime Victimization Survey (NCVS)
       designed to achieve three primary objectives:


• to develop detailed information about the victims and
  consequences of crime

•    to estimate the number and types of crimes not reported
    to police

•    and to provide uniform measures of selected types of
    crime


                     40 Boardman Place                             www.cjcj.org
                     San Francisco, CA 94103
                                               © Center on Juvenile and Criminal Justice 2013
NCVS methodology

Survey of households members


     40 Boardman Place                             www.cjcj.org
     San Francisco, CA 94103
                               © Center on Juvenile and Criminal Justice 2013
NCVS Crimes
• assault
•   burglary
•   larceny
•   motor vehicle theft
•   rape
•   robbery.


                     40 Boardman Place                             www.cjcj.org
                     San Francisco, CA 94103
                                               © Center on Juvenile and Criminal Justice 2013
Compiled by the National juvenile justice center & the office of
juvenile justice and delinquency prevention

JUVENILE COURT STATISTICS

                      40 Boardman Place                             www.cjcj.org
                      San Francisco, CA 94103
                                                © Center on Juvenile and Criminal Justice 2013
Juvenile Court Statistics
• National Estimates of Delinquency Cases

• National Estimates of Delinquency Case Processing

• National Estimates of Petitioned Status Offense Cases

http://ojjdp.ncjrs.gov/ojstatbb/njcda/pdf/jcs2005.pdf


                               40 Boardman Place                             www.cjcj.org
                               San Francisco, CA 94103
                                                         © Center on Juvenile and Criminal Justice 2013
By 2003, the juvenile Violent Crime Index arrest rate had
      fallen to the levels of the late 1980s (OJJDP)


                  40 Boardman Place                             www.cjcj.org
                  San Francisco, CA 94103
                                            © Center on Juvenile and Criminal Justice 2013
Blumstein’s Hypothesis on rising teenage
              homicides in early 1990’s

•   Recruitment
•   Guns as means of self protection
•   Diffusion of guns
•   Escalation of violence


                     40 Boardman Place                             www.cjcj.org
                     San Francisco, CA 94103
                                               © Center on Juvenile and Criminal Justice 2013
The juvenile arrest rate trend for Property Crime Index offenses is used as
  a general barometer of all property crime arrests of juveniles (OJJDP)


                          40 Boardman Place                             www.cjcj.org
                          San Francisco, CA 94103
                                                    © Center on Juvenile and Criminal Justice 2013
Violent Crime Index (OJJDP)


      40 Boardman Place                             www.cjcj.org
      San Francisco, CA 94103
                                © Center on Juvenile and Criminal Justice 2013
Violent Crime Index (OJJDP)


      40 Boardman Place                             www.cjcj.org
      San Francisco, CA 94103
                                © Center on Juvenile and Criminal Justice 2013
Violent Crime Index (OJJDP)


      40 Boardman Place                             www.cjcj.org
      San Francisco, CA 94103
                                © Center on Juvenile and Criminal Justice 2013
Murder (OJJDP)


40 Boardman Place                             www.cjcj.org
San Francisco, CA 94103
                          © Center on Juvenile and Criminal Justice 2013
Murder (OJJDP)


40 Boardman Place                             www.cjcj.org
San Francisco, CA 94103
                          © Center on Juvenile and Criminal Justice 2013
Murder (OJJDP)


40 Boardman Place                             www.cjcj.org
San Francisco, CA 94103
                          © Center on Juvenile and Criminal Justice 2013
Forcible Rape (OJJDP)


   40 Boardman Place                             www.cjcj.org
   San Francisco, CA 94103
                             © Center on Juvenile and Criminal Justice 2013
Between 1980 and 2003, the annual juvenile arrest rate for robbery
               declined substantially (OJJDP)


                     40 Boardman Place                             www.cjcj.org
                     San Francisco, CA 94103
                                               © Center on Juvenile and Criminal Justice 2013
Robbery (OJJDP)


40 Boardman Place                             www.cjcj.org
San Francisco, CA 94103
                          © Center on Juvenile and Criminal Justice 2013
Robbery (OJJDP)


40 Boardman Place                             www.cjcj.org
San Francisco, CA 94103
                          © Center on Juvenile and Criminal Justice 2013
Aggravated Assault (OJJDP)


      40 Boardman Place                             www.cjcj.org
      San Francisco, CA 94103
                                © Center on Juvenile and Criminal Justice 2013
Aggravated Assault (OJJDP)


      40 Boardman Place                             www.cjcj.org
      San Francisco, CA 94103
                                © Center on Juvenile and Criminal Justice 2013
Aggravated Assault (OJJDP)


      40 Boardman Place                             www.cjcj.org
      San Francisco, CA 94103
                                © Center on Juvenile and Criminal Justice 2013
Burglary (OJJDP)


40 Boardman Place                             www.cjcj.org
San Francisco, CA 94103
                          © Center on Juvenile and Criminal Justice 2013
Burglary (OJJDP)


40 Boardman Place                             www.cjcj.org
San Francisco, CA 94103
                          © Center on Juvenile and Criminal Justice 2013
Burglary (OJJDP)


40 Boardman Place                             www.cjcj.org
San Francisco, CA 94103
                          © Center on Juvenile and Criminal Justice 2013
Simple assault (OJJDP)


   40 Boardman Place                             www.cjcj.org
   San Francisco, CA 94103
                             © Center on Juvenile and Criminal Justice 2013
Property Crime Index (OJJDP)


       40 Boardman Place                             www.cjcj.org
       San Francisco, CA 94103
                                 © Center on Juvenile and Criminal Justice 2013
40 Boardman Place                             www.cjcj.org
San Francisco, CA 94103
                          © Center on Juvenile and Criminal Justice 2013
40 Boardman Place                             www.cjcj.org
San Francisco, CA 94103
                          © Center on Juvenile and Criminal Justice 2013
The surge in the juvenile arrest rate for drug abuse violations between 1993 and
 1997 occurred during a period when the juvenile violent crime arrest rate was
                                declining (OJJDP)


                           40 Boardman Place                               www.cjcj.org
                           San Francisco, CA 94103
                                                       © Center on Juvenile and Criminal Justice 2013
Drug Abuse arrests (OJJDP)


      40 Boardman Place                             www.cjcj.org
      San Francisco, CA 94103
                                © Center on Juvenile and Criminal Justice 2013
Drug Abuse Arrests (OJJDP)


      40 Boardman Place                             www.cjcj.org
      San Francisco, CA 94103
                                © Center on Juvenile and Criminal Justice 2013
After increasing in the mid-1980s to mid-1990s, the juvenile proportion of violent
crimes cleared by arrest or exceptional means did not return to its earlier levels
                                    (OJJDP)


                            40 Boardman Place                                www.cjcj.org
                            San Francisco, CA 94103
                                                         © Center on Juvenile and Criminal Justice 2013
The juvenile share of property crime has fallen substantially
                   since 1980 (OJJDP)


                    40 Boardman Place                             www.cjcj.org
                    San Francisco, CA 94103
                                              © Center on Juvenile and Criminal Justice 2013
Murders by juveniles in 2002 were less likely to be committed by
  a juvenile acting alone than in any year since at least 1980
                            (OJJDP)


                     40 Boardman Place                             www.cjcj.org
                     San Francisco, CA 94103
                                               © Center on Juvenile and Criminal Justice 2013
Although use levels for cocaine increased between 1992
    and 1999, levels have stabilized recently (OJJDP)


                 40 Boardman Place                             www.cjcj.org
                 San Francisco, CA 94103
                                           © Center on Juvenile and Criminal Justice 2013
For all three grades, past-month alcohol use in 2004 was at
  or near its lowest levels since the mid-1970s (OJJDP)


                   40 Boardman Place                             www.cjcj.org
                   San Francisco, CA 94103
                                             © Center on Juvenile and Criminal Justice 2013
Violent crime by juvenile offenders peaks in the afternoon;
violent crime by adults peaks in the late evening (OJJDP)


                  40 Boardman Place                             www.cjcj.org
                  San Francisco, CA 94103
                                            © Center on Juvenile and Criminal Justice 2013
Unlike violent crime by adult offenders, violent crime by juvenile
    offenders peaks in the afterschool hours on school days
                            (OJJDP)


                      40 Boardman Place                             www.cjcj.org
                      San Francisco, CA 94103
                                                © Center on Juvenile and Criminal Justice 2013
The daily patterns of juvenile violent crimes are similar for
               males and females (OJJDP)


                    40 Boardman Place                             www.cjcj.org
                    San Francisco, CA 94103
                                              © Center on Juvenile and Criminal Justice 2013
Aggravated assaults by juvenile offenders peak at 3 p.m. on
school days, coinciding with the end of the school day (OJJDP)


                    40 Boardman Place                             www.cjcj.org
                    San Francisco, CA 94103
                                              © Center on Juvenile and Criminal Justice 2013
Violent crime that results in injury to the victim is most likely in the
afterschool hours on school days for juvenile offenders, between 9 p.m.
               and midnight for adult offenders (OJJDP)


                         40 Boardman Place                              www.cjcj.org
                         San Francisco, CA 94103
                                                    © Center on Juvenile and Criminal Justice 2013
The time and day patterns of juvenile weapons law violations by males and
 especially by females reflect the major role schools play in bringing these
            matters to the attention of law enforcement (OJJDP)


                         40 Boardman Place                             www.cjcj.org
                         San Francisco, CA 94103
                                                   © Center on Juvenile and Criminal Justice 2013
Among states with at least minimally adequate reporting, those with high juvenile
                    violent crime arrest rates in 2003 were
    Delaware, Florida, Maryland, Pennsylvania, and New Jersey (OJJDP)


                           40 Boardman Place                                www.cjcj.org
                           San Francisco, CA 94103
                                                        © Center on Juvenile and Criminal Justice 2013
Juvenile violent crime arrest rates varied considerably among counties
                     within a state in 2002 (OJJDP)


                       40 Boardman Place                             www.cjcj.org
                       San Francisco, CA 94103
                                                 © Center on Juvenile and Criminal Justice 2013
The states of Wisconsin, Utah, Alaska, Montana, Idaho, Florida, Washington, and
Colorado reported the highest juvenile Property Crime Index arrest rates in 2003
                                    (OJJDP)


                           40 Boardman Place                               www.cjcj.org
                           San Francisco, CA 94103
                                                       © Center on Juvenile and Criminal Justice 2013
In 2002, counties within a state varied considerably in their juvenile
            Property Crime Index arrest rates (OJJDP)


                      40 Boardman Place                              www.cjcj.org
                      San Francisco, CA 94103
                                                 © Center on Juvenile and Criminal Justice 2013
Although the proportion of juveniles living below the poverty level has declined
substantially from its 1993 peak, it is still considerably larger than that of older
                              Americans (OJJDP)


                          40 Boardman Place                                  www.cjcj.org
                          San Francisco, CA 94103
                                                         © Center on Juvenile and Criminal Justice 2013
In 2002, black juveniles and Hispanic juveniles were more than 3 times as
     likely to live in poverty as non-Hispanic white juveniles (OJJDP)


                        40 Boardman Place                             www.cjcj.org
                        San Francisco, CA 94103
                                                  © Center on Juvenile and Criminal Justice 2013
California Youth Crime and
   Incarceration Trends

   What the official statistics say


        40 Boardman Place                             www.cjcj.org
        San Francisco, CA 94103
                                  © Center on Juvenile and Criminal Justice 2013
California Youth Incarceration and Crime
                      Rate
                     Part I Crime   DJF Population


160,000                                                                            12,000

140,000
                                                                                   10,000
120,000
                                                                                   8,000
100,000

 80,000                                                                            6,000

 60,000
                                                                                   4,000
 40,000
                                                                                   2,000
 20,000

     0                                                                             0


               40 Boardman Place                                         www.cjcj.org
               San Francisco, CA 94103
                                                     © Center on Juvenile and Criminal Justice 2013
California Youth Crime

      California youth arrested for murder
     per 100,000 pop. age 10-17, 1960-2006

22
20
18
16
14
12
10
8
6
4
2
0
 1960     1970         1980          1990   2000            2010

                 40 Boardman Place                              www.cjcj.org
                 San Francisco, CA 94103
                                            © Center on Juvenile and Criminal Justice 2013
California Youth Crime
       California youth arrested for rape
     per 100,000 pop. age 10-17, 1960-2006

25


20


15


10


5


0
 1960     1970          1980               1990      2000                2010

                 40 Boardman Place                                    www.cjcj.org
                 San Francisco, CA 94103
                                                  © Center on Juvenile and Criminal Justice 2013
California Youth Crime

       California youth arrested for assault
      per 100,000 pop. age 10-17, 1960-2006

400


300


200


100


 0
  1960      1970        1980            1990       2000              2010


              40 Boardman Place                                    www.cjcj.org
              San Francisco, CA 94103
                                               © Center on Juvenile and Criminal Justice 2013
California Youth Crime

       CA youth arrested for property crime
       per 100,000 pop. age 10-17, 1960-2006

2500


2000


1500


1000


500


  0
   1960      1970         1980            1990         2000               2010


                40 Boardman Place                                    www.cjcj.org
                San Francisco, CA 94103
                                                 © Center on Juvenile and Criminal Justice 2013
California Youth Crime

                        Crime, CA youth vs. rest of US

5,000


4,000


3,000


2,000


1,000


   0
        1960-   1965-   1970-     1975-    1980-   1985-    1990-      1995-      2000-       2005-
         64      69      74        79       84      89       94         99         04          06
                                Part I arrests per 100,000 age 10-17

                                 California                  US-CA
                            40 Boardman Place                                      www.cjcj.org
                            San Francisco, CA 94103
                                                               © Center on Juvenile and Criminal Justice 2013
California’s changing demographics


Percent of color                                            1970         2008
Under age 25                                                28%          70%
Over age 45                                                 15%          40%
Source: California Department of Finance, Demographic Research Unit


                                        40 Boardman Place                                 www.cjcj.org
                                        San Francisco, CA 94103
                                                                      © Center on Juvenile and Criminal Justice 2013
California Youth Crime Rates
Change, 1985-2003, in rates of youth:
               Imprisonment      Part I crime
California           - 19%              - 56%
Rest of US           + 62%              - 45%
   Sources: US Office of Juvenile Justice and Delinquency Prevention; CJSC.


                        40 Boardman Place                                     www.cjcj.org
                        San Francisco, CA 94103
                                                          © Center on Juvenile and Criminal Justice 2013
Reports to Read


•http://www.cjcj.org/files/Crime_Rates_and_Youth_Incarceration_in
_Texas_and_California_Compared.pdf


 •http://www.cjcj.org/files/testing_incapacitation.pdf


                       40 Boardman Place                             www.cjcj.org
                       San Francisco, CA 94103
                                                 © Center on Juvenile and Criminal Justice 2013

1. official crime measures

  • 1.
    OFFICAL CRIME MEASURE •UNIFORM CRIME REPORTS • NATIONAL CRIME VICTIMIZATION SURVEYS • JUVENILE COURT STATISTICS (http://ojjdp.ncjrs.gov/ojstatbb/jcsdb/) 40 Boardman Place www.cjcj.org San Francisco, CA 94103 © Center on Juvenile and Criminal Justice 2013
  • 2.
    Primary Measures ofthe UCR • Reported crime • Arrests • Clearances 40 Boardman Place www.cjcj.org San Francisco, CA 94103 © Center on Juvenile and Criminal Justice 2013
  • 3.
    Uniform Crime Reportsare comprised of index crimes and part II crimes: Index Crimes 1. Homicide 2. Forcible rape 3. Robbery 4. Aggravated assault 5. Burglary 6. Larceny 7. Motor vehicle theft 8. Arson 40 Boardman Place www.cjcj.org San Francisco, CA 94103 © Center on Juvenile and Criminal Justice 2013
  • 4.
    Uniform Crime Reportsare comprised of index crimes and Part II crimes: Part II Crimes: all crimes not listed as index crimes 40 Boardman Place www.cjcj.org San Francisco, CA 94103 © Center on Juvenile and Criminal Justice 2013
  • 5.
    Part II OffensesInclude: • simple assault • gambling • curfew offenses • liquor offenses, • loitering • Prostitution • embezzlement • public drunkenness • forgery and • stolen property counterfeiting, • vandalism • disorderly conduct • weapons offenses • driving under the influence • drug offenses • fraud 40 Boardman Place www.cjcj.org San Francisco, CA 94103 © Center on Juvenile and Criminal Justice 2013
  • 6.
    Criticism of theUCR • Easily manipulated for political reasons • Skewed towards street crimes • Only counts the most series crime • Does not count the overcharge • Different jurisdiction arrest practices 40 Boardman Place www.cjcj.org San Francisco, CA 94103 © Center on Juvenile and Criminal Justice 2013
  • 7.
    National Crime VictimizationSurvey NCVS Published by the Census bureau and Bureau of Justice Statistics 40 Boardman Place www.cjcj.org San Francisco, CA 94103 © Center on Juvenile and Criminal Justice 2013
  • 8.
    The National CrimeVictimization Survey (NCVS) designed to achieve three primary objectives: • to develop detailed information about the victims and consequences of crime • to estimate the number and types of crimes not reported to police • and to provide uniform measures of selected types of crime 40 Boardman Place www.cjcj.org San Francisco, CA 94103 © Center on Juvenile and Criminal Justice 2013
  • 9.
    NCVS methodology Survey ofhouseholds members 40 Boardman Place www.cjcj.org San Francisco, CA 94103 © Center on Juvenile and Criminal Justice 2013
  • 10.
    NCVS Crimes • assault • burglary • larceny • motor vehicle theft • rape • robbery. 40 Boardman Place www.cjcj.org San Francisco, CA 94103 © Center on Juvenile and Criminal Justice 2013
  • 11.
    Compiled by theNational juvenile justice center & the office of juvenile justice and delinquency prevention JUVENILE COURT STATISTICS 40 Boardman Place www.cjcj.org San Francisco, CA 94103 © Center on Juvenile and Criminal Justice 2013
  • 12.
    Juvenile Court Statistics •National Estimates of Delinquency Cases • National Estimates of Delinquency Case Processing • National Estimates of Petitioned Status Offense Cases http://ojjdp.ncjrs.gov/ojstatbb/njcda/pdf/jcs2005.pdf 40 Boardman Place www.cjcj.org San Francisco, CA 94103 © Center on Juvenile and Criminal Justice 2013
  • 13.
    By 2003, thejuvenile Violent Crime Index arrest rate had fallen to the levels of the late 1980s (OJJDP) 40 Boardman Place www.cjcj.org San Francisco, CA 94103 © Center on Juvenile and Criminal Justice 2013
  • 14.
    Blumstein’s Hypothesis onrising teenage homicides in early 1990’s • Recruitment • Guns as means of self protection • Diffusion of guns • Escalation of violence 40 Boardman Place www.cjcj.org San Francisco, CA 94103 © Center on Juvenile and Criminal Justice 2013
  • 15.
    The juvenile arrestrate trend for Property Crime Index offenses is used as a general barometer of all property crime arrests of juveniles (OJJDP) 40 Boardman Place www.cjcj.org San Francisco, CA 94103 © Center on Juvenile and Criminal Justice 2013
  • 16.
    Violent Crime Index(OJJDP) 40 Boardman Place www.cjcj.org San Francisco, CA 94103 © Center on Juvenile and Criminal Justice 2013
  • 17.
    Violent Crime Index(OJJDP) 40 Boardman Place www.cjcj.org San Francisco, CA 94103 © Center on Juvenile and Criminal Justice 2013
  • 18.
    Violent Crime Index(OJJDP) 40 Boardman Place www.cjcj.org San Francisco, CA 94103 © Center on Juvenile and Criminal Justice 2013
  • 19.
    Murder (OJJDP) 40 BoardmanPlace www.cjcj.org San Francisco, CA 94103 © Center on Juvenile and Criminal Justice 2013
  • 20.
    Murder (OJJDP) 40 BoardmanPlace www.cjcj.org San Francisco, CA 94103 © Center on Juvenile and Criminal Justice 2013
  • 21.
    Murder (OJJDP) 40 BoardmanPlace www.cjcj.org San Francisco, CA 94103 © Center on Juvenile and Criminal Justice 2013
  • 22.
    Forcible Rape (OJJDP) 40 Boardman Place www.cjcj.org San Francisco, CA 94103 © Center on Juvenile and Criminal Justice 2013
  • 23.
    Between 1980 and2003, the annual juvenile arrest rate for robbery declined substantially (OJJDP) 40 Boardman Place www.cjcj.org San Francisco, CA 94103 © Center on Juvenile and Criminal Justice 2013
  • 24.
    Robbery (OJJDP) 40 BoardmanPlace www.cjcj.org San Francisco, CA 94103 © Center on Juvenile and Criminal Justice 2013
  • 25.
    Robbery (OJJDP) 40 BoardmanPlace www.cjcj.org San Francisco, CA 94103 © Center on Juvenile and Criminal Justice 2013
  • 26.
    Aggravated Assault (OJJDP) 40 Boardman Place www.cjcj.org San Francisco, CA 94103 © Center on Juvenile and Criminal Justice 2013
  • 27.
    Aggravated Assault (OJJDP) 40 Boardman Place www.cjcj.org San Francisco, CA 94103 © Center on Juvenile and Criminal Justice 2013
  • 28.
    Aggravated Assault (OJJDP) 40 Boardman Place www.cjcj.org San Francisco, CA 94103 © Center on Juvenile and Criminal Justice 2013
  • 29.
    Burglary (OJJDP) 40 BoardmanPlace www.cjcj.org San Francisco, CA 94103 © Center on Juvenile and Criminal Justice 2013
  • 30.
    Burglary (OJJDP) 40 BoardmanPlace www.cjcj.org San Francisco, CA 94103 © Center on Juvenile and Criminal Justice 2013
  • 31.
    Burglary (OJJDP) 40 BoardmanPlace www.cjcj.org San Francisco, CA 94103 © Center on Juvenile and Criminal Justice 2013
  • 32.
    Simple assault (OJJDP) 40 Boardman Place www.cjcj.org San Francisco, CA 94103 © Center on Juvenile and Criminal Justice 2013
  • 33.
    Property Crime Index(OJJDP) 40 Boardman Place www.cjcj.org San Francisco, CA 94103 © Center on Juvenile and Criminal Justice 2013
  • 34.
    40 Boardman Place www.cjcj.org San Francisco, CA 94103 © Center on Juvenile and Criminal Justice 2013
  • 35.
    40 Boardman Place www.cjcj.org San Francisco, CA 94103 © Center on Juvenile and Criminal Justice 2013
  • 36.
    The surge inthe juvenile arrest rate for drug abuse violations between 1993 and 1997 occurred during a period when the juvenile violent crime arrest rate was declining (OJJDP) 40 Boardman Place www.cjcj.org San Francisco, CA 94103 © Center on Juvenile and Criminal Justice 2013
  • 37.
    Drug Abuse arrests(OJJDP) 40 Boardman Place www.cjcj.org San Francisco, CA 94103 © Center on Juvenile and Criminal Justice 2013
  • 38.
    Drug Abuse Arrests(OJJDP) 40 Boardman Place www.cjcj.org San Francisco, CA 94103 © Center on Juvenile and Criminal Justice 2013
  • 39.
    After increasing inthe mid-1980s to mid-1990s, the juvenile proportion of violent crimes cleared by arrest or exceptional means did not return to its earlier levels (OJJDP) 40 Boardman Place www.cjcj.org San Francisco, CA 94103 © Center on Juvenile and Criminal Justice 2013
  • 40.
    The juvenile shareof property crime has fallen substantially since 1980 (OJJDP) 40 Boardman Place www.cjcj.org San Francisco, CA 94103 © Center on Juvenile and Criminal Justice 2013
  • 41.
    Murders by juvenilesin 2002 were less likely to be committed by a juvenile acting alone than in any year since at least 1980 (OJJDP) 40 Boardman Place www.cjcj.org San Francisco, CA 94103 © Center on Juvenile and Criminal Justice 2013
  • 42.
    Murders by juvenilesin 2002 were less likely to be committed by a juvenile acting alone than in any year since at least 1980 (OJJDP) 40 Boardman Place www.cjcj.org San Francisco, CA 94103 © Center on Juvenile and Criminal Justice 2013
  • 43.
    Although use levelsfor cocaine increased between 1992 and 1999, levels have stabilized recently (OJJDP) 40 Boardman Place www.cjcj.org San Francisco, CA 94103 © Center on Juvenile and Criminal Justice 2013
  • 44.
    For all threegrades, past-month alcohol use in 2004 was at or near its lowest levels since the mid-1970s (OJJDP) 40 Boardman Place www.cjcj.org San Francisco, CA 94103 © Center on Juvenile and Criminal Justice 2013
  • 45.
    Violent crime byjuvenile offenders peaks in the afternoon; violent crime by adults peaks in the late evening (OJJDP) 40 Boardman Place www.cjcj.org San Francisco, CA 94103 © Center on Juvenile and Criminal Justice 2013
  • 46.
    Unlike violent crimeby adult offenders, violent crime by juvenile offenders peaks in the afterschool hours on school days (OJJDP) 40 Boardman Place www.cjcj.org San Francisco, CA 94103 © Center on Juvenile and Criminal Justice 2013
  • 47.
    The daily patternsof juvenile violent crimes are similar for males and females (OJJDP) 40 Boardman Place www.cjcj.org San Francisco, CA 94103 © Center on Juvenile and Criminal Justice 2013
  • 48.
    Aggravated assaults byjuvenile offenders peak at 3 p.m. on school days, coinciding with the end of the school day (OJJDP) 40 Boardman Place www.cjcj.org San Francisco, CA 94103 © Center on Juvenile and Criminal Justice 2013
  • 49.
    Violent crime thatresults in injury to the victim is most likely in the afterschool hours on school days for juvenile offenders, between 9 p.m. and midnight for adult offenders (OJJDP) 40 Boardman Place www.cjcj.org San Francisco, CA 94103 © Center on Juvenile and Criminal Justice 2013
  • 50.
    The time andday patterns of juvenile weapons law violations by males and especially by females reflect the major role schools play in bringing these matters to the attention of law enforcement (OJJDP) 40 Boardman Place www.cjcj.org San Francisco, CA 94103 © Center on Juvenile and Criminal Justice 2013
  • 51.
    Among states withat least minimally adequate reporting, those with high juvenile violent crime arrest rates in 2003 were Delaware, Florida, Maryland, Pennsylvania, and New Jersey (OJJDP) 40 Boardman Place www.cjcj.org San Francisco, CA 94103 © Center on Juvenile and Criminal Justice 2013
  • 52.
    Juvenile violent crimearrest rates varied considerably among counties within a state in 2002 (OJJDP) 40 Boardman Place www.cjcj.org San Francisco, CA 94103 © Center on Juvenile and Criminal Justice 2013
  • 53.
    The states ofWisconsin, Utah, Alaska, Montana, Idaho, Florida, Washington, and Colorado reported the highest juvenile Property Crime Index arrest rates in 2003 (OJJDP) 40 Boardman Place www.cjcj.org San Francisco, CA 94103 © Center on Juvenile and Criminal Justice 2013
  • 54.
    In 2002, countieswithin a state varied considerably in their juvenile Property Crime Index arrest rates (OJJDP) 40 Boardman Place www.cjcj.org San Francisco, CA 94103 © Center on Juvenile and Criminal Justice 2013
  • 55.
    Although the proportionof juveniles living below the poverty level has declined substantially from its 1993 peak, it is still considerably larger than that of older Americans (OJJDP) 40 Boardman Place www.cjcj.org San Francisco, CA 94103 © Center on Juvenile and Criminal Justice 2013
  • 56.
    In 2002, blackjuveniles and Hispanic juveniles were more than 3 times as likely to live in poverty as non-Hispanic white juveniles (OJJDP) 40 Boardman Place www.cjcj.org San Francisco, CA 94103 © Center on Juvenile and Criminal Justice 2013
  • 57.
    California Youth Crimeand Incarceration Trends What the official statistics say 40 Boardman Place www.cjcj.org San Francisco, CA 94103 © Center on Juvenile and Criminal Justice 2013
  • 58.
    California Youth Incarcerationand Crime Rate Part I Crime DJF Population 160,000 12,000 140,000 10,000 120,000 8,000 100,000 80,000 6,000 60,000 4,000 40,000 2,000 20,000 0 0 40 Boardman Place www.cjcj.org San Francisco, CA 94103 © Center on Juvenile and Criminal Justice 2013
  • 59.
    California Youth Crime California youth arrested for murder per 100,000 pop. age 10-17, 1960-2006 22 20 18 16 14 12 10 8 6 4 2 0 1960 1970 1980 1990 2000 2010 40 Boardman Place www.cjcj.org San Francisco, CA 94103 © Center on Juvenile and Criminal Justice 2013
  • 60.
    California Youth Crime California youth arrested for rape per 100,000 pop. age 10-17, 1960-2006 25 20 15 10 5 0 1960 1970 1980 1990 2000 2010 40 Boardman Place www.cjcj.org San Francisco, CA 94103 © Center on Juvenile and Criminal Justice 2013
  • 61.
    California Youth Crime California youth arrested for assault per 100,000 pop. age 10-17, 1960-2006 400 300 200 100 0 1960 1970 1980 1990 2000 2010 40 Boardman Place www.cjcj.org San Francisco, CA 94103 © Center on Juvenile and Criminal Justice 2013
  • 62.
    California Youth Crime CA youth arrested for property crime per 100,000 pop. age 10-17, 1960-2006 2500 2000 1500 1000 500 0 1960 1970 1980 1990 2000 2010 40 Boardman Place www.cjcj.org San Francisco, CA 94103 © Center on Juvenile and Criminal Justice 2013
  • 63.
    California Youth Crime Crime, CA youth vs. rest of US 5,000 4,000 3,000 2,000 1,000 0 1960- 1965- 1970- 1975- 1980- 1985- 1990- 1995- 2000- 2005- 64 69 74 79 84 89 94 99 04 06 Part I arrests per 100,000 age 10-17 California US-CA 40 Boardman Place www.cjcj.org San Francisco, CA 94103 © Center on Juvenile and Criminal Justice 2013
  • 64.
    California’s changing demographics Percentof color 1970 2008 Under age 25 28% 70% Over age 45 15% 40% Source: California Department of Finance, Demographic Research Unit 40 Boardman Place www.cjcj.org San Francisco, CA 94103 © Center on Juvenile and Criminal Justice 2013
  • 65.
    California Youth CrimeRates Change, 1985-2003, in rates of youth: Imprisonment Part I crime California - 19% - 56% Rest of US + 62% - 45% Sources: US Office of Juvenile Justice and Delinquency Prevention; CJSC. 40 Boardman Place www.cjcj.org San Francisco, CA 94103 © Center on Juvenile and Criminal Justice 2013
  • 66.
    Reports to Read •http://www.cjcj.org/files/Crime_Rates_and_Youth_Incarceration_in _Texas_and_California_Compared.pdf •http://www.cjcj.org/files/testing_incapacitation.pdf 40 Boardman Place www.cjcj.org San Francisco, CA 94103 © Center on Juvenile and Criminal Justice 2013