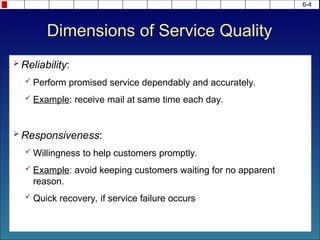
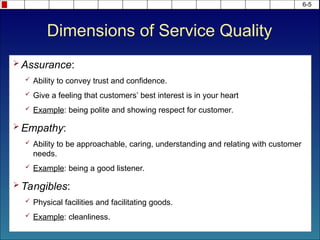
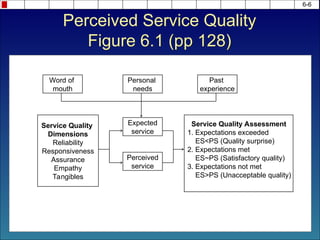
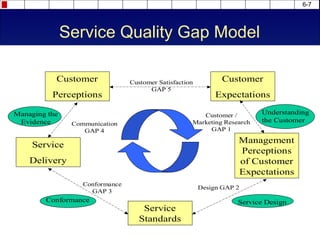
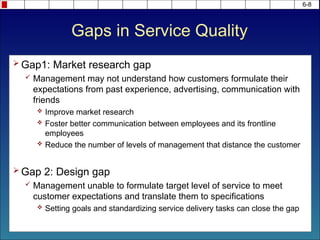
Chapter – 6
Service Quality
6
Service Management (5e)
Operations, Strategy, Information Technology
By
Fitzsimmons and Fitzsimmons
6-2
 Describe the five dimensions of service quality.
 Use the service quality gap model to diagnose quality
problems.
 Illustrate how Taguchi methods and poka-yoke methods are
applied to quality design.
 Perform service quality function deployment.
 Construct a statistical process control chart.
 Develop unconditional service guarantees.
 Plan for service recovery.
 Perform a walk-through audit (WtA)
Learning Objectives
6-3
 Each customer contact is called a moment of truth.
 You have the ability to either satisfy or dissatisfy them when
you contact them.
 A service recovery is satisfying a previously dissatisfied
customer and making them a loyal customer.
Moments of Truth
6-4
 Reliability:
 Perform promised service dependably and accurately.
 Example: receive mail at same time each day.
 Responsiveness:
 Willingness to help customers promptly.
 Example: avoid keeping customers waiting for no apparent
reason.
 Quick recovery, if service failure occurs
Dimensions of Service Quality
6-5
 Assurance:
 Ability to convey trust and confidence.
 Give a feeling that customers’ best interest is in your heart
 Example: being polite and showing respect for customer.
 Empathy:
 Ability to be approachable, caring, understanding and relating with customer
needs.
 Example: being a good listener.
 Tangibles:
 Physical facilities and facilitating goods.
 Example: cleanliness.
Dimensions of Service Quality
6-6
Word of
mouth
Personal
needs
Past
experience
Expected
service
Perceived
service
Service Quality
Dimensions
Reliability
Responsiveness
Assurance
Empathy
Tangibles
Service Quality Assessment
1. Expectations exceeded
ES<PS (Quality surprise)
2. Expectations met
ES~PS (Satisfactory quality)
3. Expectations not met
ES>PS (Unacceptable quality)
Perceived Service Quality
Figure 6.1 (pp 128)
6-7
Service Quality Gap Model
Customer
Perceptions
Customer
Expectations
Service
Delivery
Service
Standards
Management
Perceptions
of Customer
Expectations
Managing the
Evidence
Conformance Service Design
Understanding
the Customer
Customer Satisfaction
GAP 5
Customer /
Marketing Research
GAP 1
Conformance
GAP 3
Communication
GAP 4
Design GAP 2
Gaps in Service Quality
 Gap1: Market research gap
 Management may not understand how customers formulate their
expectations from past experience, advertising, communication with
friends
 Improve market research
 Foster better communication between employees and its frontline
employees
 Reduce the number of levels of management that distance the customer
 Gap 2: Design gap
 Management unable to formulate target level of service to meet
customer expectations and translate them to specifications
 Setting goals and standardizing service delivery tasks can close the gap
6-8
Continued….
 Gap 3: Conformance gap
 Actual delivery of service cannot meet the specifications set by
management
 Lack of teamwork
 Poor employee selection
 Inadequate training
 Inappropriate job design
 Gap 4: Communication gap
 Discrepancy between service delivery and external communication
 Exaggerated promises in advertising
 Lack of information provided to contact personnel to give customers
6-9
Continued…..
 Gap 5: Customer expectations and perceptions gap
 Customer satisfaction depends on minimizing the four gaps that
are associated with service delivery
 Companies try to measure the gap between expected service and
perceived service through the use of surveys (ex. Fig. 6.2)
 SERVQUAL – measures the five dimensions (table 6.1)
6-10
Scope of service quality
 View quality from five perspectives
 Content – are standard procedures being followed?
 Process – is the sequence of events in the service process
appropriate?
 Structure – are the physical facilities and organizational design
adequate for the service?
 Outcome – what change in the status has the service effected? Is the
consumer satisfied?
 Impact – what is the long-range effect of the service on the
consumer?
 See table 6.3 ( pp 137) – measuring service quality for a
health clinic.
6-11
Quality Service by Design
1. Quality service by design
2. Taguchi method
3. Poka-Yoke
4. Quality function deployment
6-12
6-13
Budget Hotel example (table 6.4 (pp. 138)
 Supporting facility
 Design of the building
 Facilitating goods
 Room furnishings like: bedside tables, carpet cleaning
 Explicit services
 Maids are trained to clean and make up roooms
 Implicit services
 Pleasant appearances of individuals at front office
1. Quality in the Service Package
2. Taguchi Method (Robustness)
 Robust designs to serve under adverse conditions
 Robustness concept also applied to the manufacturing
process – for example using online computer to notify the
cleaning staff when the room has been vacated
 Taguchi emphasized that quality was achieved by
consistently meeting the design specifications
 Cost to society of poor quality was measured by the square
of the deviation from the target (see fig. 6.4 pp. 139)
6-14
3. Poka-Yoke (Fail safing)
 Shigeo Shingo observed that errors occurred, not because
employees were incompetent, but because of interruptions
in routines or lapses in attention.
 He advocated adoption of Poka-Yoke methods – foolproof
devices to prevent employee mistakes.
 Example, hotel reservation employee is expected to make eye-
contact with customer. So Poka-Yoke is to ask the employee to
enter the eye-color of the customer.
 Since customers also play an active role in service-delivery
so you need Poka-Yoke for them to prevent them from
making errors.
 Example, frames at airport check-in counters to help customers
determine if their bag can go in overhead bin as hand luggage.
6-15
6-16
Classification of Service Failures with
Poka-Yoke Opportunities (table 6.5)
Server Errors
Task:
Doing work incorrectly
Doing work not required
Doing work in the wrong order
Doing work too slowly
Treatment:
Failure to listen to customer
Failure to acknowledge the customer
Failure to react appropriately
Tangible:
Failure to clean facilities
Failure to wear clean uniform
Failure to control environmental factors
Failure to proofread documents
Customer Errors
Preparation:
Failure to bring necessary materials
Failure to understand role in transaction
Failure to engage in correct service
Encounter:
Failure to remember steps in process
Failure to follow system flow
Failure to specify desires sufficiently
Failure to follow instructions
Resolution:
Failure to signal service failure
Failure to learn from experience
Failure to adjust expectations
Failure to execute post-encounter action
6-17
 Allows to incorporate the voice of the customer into the design of the product/service
– by translating customer satisfaction into identifiable and measurable conformance
specifications for product or service design
 1. Establish the aim of the project – assess Village Volvo’s competitive position
 2. Determine customer expectations (rows) – interviews etc.
 3. Describe the elements of the service (columns)
 4. Roof of the house - note the strength of relationship between the service elements
 5. Body of the matrix – relationship between service elements (columns) and
customer expectations (rows)
 6. Weighting the service elements – rating customer expectations; getting weighted
scores for each column (basement)
 7. Basement – service element improvement difficulty rank
 8. Assessment of competition –
 RHS (comparison on customer satisfaction)
 Comparison on strength of the service elements
4. Quality Function Deployment
6-18
House of Quality
Relat
ive
1 2 3 4 5
Customer Expectations
Reliability
Responsiveness
Assurance
Empathy
Tangibles
Comparison with Volvo Dealer
Weighted score
Improvement difficulty rank
O O
O Weak
Medium
* Strong
9
9
9
Tra
ini
ng
Attitude
Capacity
Informatiion
Equipm
ent
8
7
7
6 6
5 5
5
5
4
4
3 3
3
3
2
2 2
2
+
_
+
Customer Perceptions
o
+
+
+
o
o
o
o
+
o
o
o
o
o
o Village Volvo
+ Volvo Dealer
Service Elements
Relationships
127 82 63 102 65
1
* *
6-19
 Compare your performance with other companies known for
being ‘the best in class’
 For every quality dimension, some firm has earned the
reputation for being the best in class
 Learn how the management has achieved to be the best in
class to correct your process
5. Benchmarking
6-20
 Impressions about service quality are determined by both the
outcome and the process (because customers are a part of service
delivery)
 Walk through audit is a customer-focused survey to find the areas
for improvement
 Entire customer experience is traced from beginning to end, and a flow chart of
customer interaction with service system is made
 Customer is asked for his/her impressions on each of these interactions
 Customers can provide anew perspective to service – they can
notice things easily as they are new in the system
 Service managers and employees can get de-sensitize to their
surroundings and also may not notice marginal decreases in
service levels.
6. Walk-Through-Audit
(Figure 6.7, pp. 145)
6-21
1. Cost of Quality (Juran)
2. Service Process Control
3. Statistical Process Control (Deming)
4. Unconditional Service Guarantee
Achieving Service Quality
1. Cost of Quality
 Products can be returned or exchanged if faulty; but what recourse does
customer have to faulty services?
 Legal recourse – for example in medical may lead to more procedures and tests and more
paperwork leading to higher cost
 Prevention cost
 Costs associated with activities that keep failure from happening and minimize detection cost
 Detection cost
 Costs incurred to ascertain the condition of a service to determine whether it conforms to
safety standards
 Internal failure
 Costs incurred to correct nonconforming work prior to delivery to the customer
 External failure
 Costs incurred to correct nonconforming work after delivery to customer or to correct work
that did not satisfy a customer’s special needs
 $1 in invested in prevention = $100 in detection = $10,000 in failure cost
(Juran)
6-22
6-23
Failure costs Detection costs Prevention costs
External failure:
Loss of future business Process control Quality planning
Negative word-of-mouth Peer review Training program
Liability insurance Supervision Quality audits
Legal judgments Customer comment card Data acquisition and analysis
Interest penalties Inspection Recruitment and selection
Supplier evaluation
Internal failure:
Scrapped forms
Rework
Recovery:
Expedite disruption
Labor and materials
Costs of Service Quality
(Bank Example, table 6.6, pp. 149)
2. Service Process Control
 The control of service quality can be viewed as a feedback control
system – where output is compared with a standard.
 The deviation from the standard is communicated back to the
input, and adjustments are made to the process to keep the
output within the defined range.
 Difficult to implement an effective control cycle for service due to
the intangible nature of service, which makes direct measurement
difficult – so we proxy or surrogate measures.
 Simultaneous nature of production and consumption – prevents
any direct intervention in the service process to observe
conformance to requirements.
 Consequently, we ask customers to express their impression of service quality after the
consumption – by which time we are too late to avoid service failure.
 Instead, we try to focus on delivery process by employing SPC
6-24
6-25
Resources
Identify reason
for
nonconformance
Establish
measure of
performance
Monitor
conformance to
requirements
Take
corrective
action
Service
concept
Customer
input
Customer
output
Service
process
Service Process Control
(Figure 6.9, pp 150)
3. Service Process Control
6-26
6-27
 Unconditional (L.L. Bean) – without exception
 Easy to understand and communicate (Bennigan’s) – to the
customer
 Meaningful (Domino’s Pizza) – it should provide
compensation that is meaningful
 Easy to invoke (Cititravel) – not to fill out cumbersome forms
or go through a lengthy process
 Easy to collect (Manpower) – should be given soon after the
service lapse and after a significant time
4. Unconditional Service Guarantee:
Customer View
6-28
 Focuses on customers (British Airways)
 Sets clear standards (FedEx) – knows when the service has
failed
 Guarantees feedback (Manpower) – gets data on service
failure because dissatisfied customers have an incentive to
complain
 Promotes an understanding of the service delivery system
(Bug Killer) – you will have a better understanding of your
service delivery process
 Builds customer loyalty by making expectations explicit
Unconditional Service Guarantee:
Management View
6-29
 The average business only hears from 4% of their customers who
are dissatisfied with their products or services. Of the 96% who do
not bother to complain, 25% of them have serious problems.
 The 4% complainers are more likely to stay with the supplier than are
the 96% non-complainers.
 About 60% of the complainers would stay as customers if their
problem was resolved and 95% would stay if the problem was
resolved quickly.
 A dissatisfied customer will tell between 10 and 20 other people
about their problem.
 A customer who has had a problem resolved by a company will tell
about 5 people about their situation.
Customer Feedback and
Word-of-Mouth (Table 6.9, pp. 156)
6-30
Service Recovery Framework
(Figure 6.13, pp. 156)
6-31
Service Recovery
 Disasters can be turned into loyal customers by proper and rapid
service recovery
 Frontline workers, therefore, need to be properly trained and
given the discretion to make things right.
 Approaches to service recovery
 Case-by-case addresses each customer’s complaint individually but could
lead to perception of unfairness.
 Systematic response uses a protocol to handle complaints but needs prior
identification of critical failure points and continuous updating.
 Early intervention attempts to fix problem before the customer is affected.
 Substitute service allows rival firm to provide service but could lead to loss of
customer.
INSPECTION
 Opinion surveys - about quality of service
 100 percent inspection - every unit is checked; fatigue
error unless automated
 First article inspection - usually after the process is set up
 Destructive testing
 Acceptance sampling - based on statistical sampling table,
the associate checks a random or stratified sample from a
larger lot. If the sample is within the acceptable quality level,
the lot passes inspection.
Process focus
 Process capability means capable of meeting customer
requirements or specifications.
COMMON CAUSE vs
SPECIAL CAUSE VARIATION
 Assignable-cause variation: these can be assigned to
specific causes
 Common cause variation: random and harder to
trace. This is system wide and requires management
decision.
 Statistical Control: when a process output is free of all
special cause variation, it is said to be in statistical
control or simply in control.
 A process in control may still have common cause
variation. Continuous improvement aims at
constantly working to reduce common cause
variation.
VARIABLES AND ATTRIBUTES
 In order to study process variation, we need process output
data. This comes in two forms: variables and attributes data
 Variables data result from measuring or computing the
amount of or value of a quality characteristic. This data is
continuous.
 Attributes data - measurement is not required, just a
classifying judgment: maybe yes or no for friendly service;
good or bad for a car wash; small, medium, large melons.
TOOLS FOR PROCESS IMPROVEMENT
 Coarse Grained Analysis
 Check Sheet – historical record of observations and represents the
source of data to begin analysis and problem identfication.
 Histograms - display frequency data collected over a period of time.
It is more structured than a check sheet, has equal-interval numeric
categories on the X-axis of an X-Y graph (see figure 6.18)
 Pareto Analysis (figure 6.19): helps differentiate between trivial and
important causes by ordering problems by their relative frequency in
a descending order – focus efforts on the problem that offers the
greatest potential improvement.
 Process flowchart: it may show the steps that are unnecessary, or
that need to be rearranged
 Fishbone chart (cause and effect diagram): here the team works
backwards from the target for improvement on the spin bone,
identifying causes down through the ‘bone structure’. The lowest
level of detail may reveal root causes, which need to be worked
upon. (5 whys) (figure 6.21)
continued
 Fine Grained Tools
 Scatter diagram and correlation: useful for complex processes
where cause-effect relationships are unclear. It visually shows the
relationship between two variables (figure 6.22)
 Run diagram: it is simply a running plot of a certain measured quality
characteristic. It could be number of minutes each successive
airplane departs late. Or number of customers visiting the complaint
desk of a store each day. The company may specify the upper limit
and the lower limit. ( figure 6.17).
Process control charts:
 While the run diagram plots data on every unit, the process control
chart, less precisely referred to as the quality control chart, relies on
sampling. The method requires plotting statistical samples of
measured process output for a quality characteristic. By watching the
plotted points, the observer can detect unusual process variation,
which calls for some kind of corrective action.
 Mean chart and range chart (figure 6.10)
 Central line for the mean and the range charts
 Upper and lower control limits for the mean chart
 Upper and lower control limit for the range chart
 Process capability Analysis
 Cp versus Cpk
QUESTIONS TO PONDER
 1. What is a transformation process? How might process
performance be described in terms of quality characteristics?
 2. How do special-cause variation and common cause variation
relate to process control and process capability?
 3. What are the roles of run diagrams and process control charts
in improvement programs? What are the similarities and
differences?
 4. In control charting for variables why use two charts (e.g. mean
and range)?
 5. Inspection does not necessarily lead to quality. Discuss?
 6. Quality is as good as the data is. Discuss? How do variables
data differ from attributes data?
6-40
Topics for Discussion
 How do the five dimensions of service quality differ from those
of product quality?
 Why is measuring service quality so difficult?
 Compare the philosophies of Deming and Crosby.
 What are the limitations of “benchmarking”.
 Illustrate the four components in the cost of quality for a
service.
 Why do service firms hesitate to offer a service guarantee?
 How can recovery from a service failure be a blessing in
disguise?

08-Service-Qualitypppppppppppppppppp.ppt

  • 1.
    Chapter – 6 ServiceQuality 6 Service Management (5e) Operations, Strategy, Information Technology By Fitzsimmons and Fitzsimmons
  • 2.
    6-2  Describe thefive dimensions of service quality.  Use the service quality gap model to diagnose quality problems.  Illustrate how Taguchi methods and poka-yoke methods are applied to quality design.  Perform service quality function deployment.  Construct a statistical process control chart.  Develop unconditional service guarantees.  Plan for service recovery.  Perform a walk-through audit (WtA) Learning Objectives
  • 3.
    6-3  Each customercontact is called a moment of truth.  You have the ability to either satisfy or dissatisfy them when you contact them.  A service recovery is satisfying a previously dissatisfied customer and making them a loyal customer. Moments of Truth
  • 4.
    6-4  Reliability:  Performpromised service dependably and accurately.  Example: receive mail at same time each day.  Responsiveness:  Willingness to help customers promptly.  Example: avoid keeping customers waiting for no apparent reason.  Quick recovery, if service failure occurs Dimensions of Service Quality
  • 5.
    6-5  Assurance:  Abilityto convey trust and confidence.  Give a feeling that customers’ best interest is in your heart  Example: being polite and showing respect for customer.  Empathy:  Ability to be approachable, caring, understanding and relating with customer needs.  Example: being a good listener.  Tangibles:  Physical facilities and facilitating goods.  Example: cleanliness. Dimensions of Service Quality
  • 6.
    6-6 Word of mouth Personal needs Past experience Expected service Perceived service Service Quality Dimensions Reliability Responsiveness Assurance Empathy Tangibles ServiceQuality Assessment 1. Expectations exceeded ES<PS (Quality surprise) 2. Expectations met ES~PS (Satisfactory quality) 3. Expectations not met ES>PS (Unacceptable quality) Perceived Service Quality Figure 6.1 (pp 128)
  • 7.
    6-7 Service Quality GapModel Customer Perceptions Customer Expectations Service Delivery Service Standards Management Perceptions of Customer Expectations Managing the Evidence Conformance Service Design Understanding the Customer Customer Satisfaction GAP 5 Customer / Marketing Research GAP 1 Conformance GAP 3 Communication GAP 4 Design GAP 2
  • 8.
    Gaps in ServiceQuality  Gap1: Market research gap  Management may not understand how customers formulate their expectations from past experience, advertising, communication with friends  Improve market research  Foster better communication between employees and its frontline employees  Reduce the number of levels of management that distance the customer  Gap 2: Design gap  Management unable to formulate target level of service to meet customer expectations and translate them to specifications  Setting goals and standardizing service delivery tasks can close the gap 6-8
  • 9.
    Continued….  Gap 3:Conformance gap  Actual delivery of service cannot meet the specifications set by management  Lack of teamwork  Poor employee selection  Inadequate training  Inappropriate job design  Gap 4: Communication gap  Discrepancy between service delivery and external communication  Exaggerated promises in advertising  Lack of information provided to contact personnel to give customers 6-9
  • 10.
    Continued…..  Gap 5:Customer expectations and perceptions gap  Customer satisfaction depends on minimizing the four gaps that are associated with service delivery  Companies try to measure the gap between expected service and perceived service through the use of surveys (ex. Fig. 6.2)  SERVQUAL – measures the five dimensions (table 6.1) 6-10
  • 11.
    Scope of servicequality  View quality from five perspectives  Content – are standard procedures being followed?  Process – is the sequence of events in the service process appropriate?  Structure – are the physical facilities and organizational design adequate for the service?  Outcome – what change in the status has the service effected? Is the consumer satisfied?  Impact – what is the long-range effect of the service on the consumer?  See table 6.3 ( pp 137) – measuring service quality for a health clinic. 6-11
  • 12.
    Quality Service byDesign 1. Quality service by design 2. Taguchi method 3. Poka-Yoke 4. Quality function deployment 6-12
  • 13.
    6-13 Budget Hotel example(table 6.4 (pp. 138)  Supporting facility  Design of the building  Facilitating goods  Room furnishings like: bedside tables, carpet cleaning  Explicit services  Maids are trained to clean and make up roooms  Implicit services  Pleasant appearances of individuals at front office 1. Quality in the Service Package
  • 14.
    2. Taguchi Method(Robustness)  Robust designs to serve under adverse conditions  Robustness concept also applied to the manufacturing process – for example using online computer to notify the cleaning staff when the room has been vacated  Taguchi emphasized that quality was achieved by consistently meeting the design specifications  Cost to society of poor quality was measured by the square of the deviation from the target (see fig. 6.4 pp. 139) 6-14
  • 15.
    3. Poka-Yoke (Failsafing)  Shigeo Shingo observed that errors occurred, not because employees were incompetent, but because of interruptions in routines or lapses in attention.  He advocated adoption of Poka-Yoke methods – foolproof devices to prevent employee mistakes.  Example, hotel reservation employee is expected to make eye- contact with customer. So Poka-Yoke is to ask the employee to enter the eye-color of the customer.  Since customers also play an active role in service-delivery so you need Poka-Yoke for them to prevent them from making errors.  Example, frames at airport check-in counters to help customers determine if their bag can go in overhead bin as hand luggage. 6-15
  • 16.
    6-16 Classification of ServiceFailures with Poka-Yoke Opportunities (table 6.5) Server Errors Task: Doing work incorrectly Doing work not required Doing work in the wrong order Doing work too slowly Treatment: Failure to listen to customer Failure to acknowledge the customer Failure to react appropriately Tangible: Failure to clean facilities Failure to wear clean uniform Failure to control environmental factors Failure to proofread documents Customer Errors Preparation: Failure to bring necessary materials Failure to understand role in transaction Failure to engage in correct service Encounter: Failure to remember steps in process Failure to follow system flow Failure to specify desires sufficiently Failure to follow instructions Resolution: Failure to signal service failure Failure to learn from experience Failure to adjust expectations Failure to execute post-encounter action
  • 17.
    6-17  Allows toincorporate the voice of the customer into the design of the product/service – by translating customer satisfaction into identifiable and measurable conformance specifications for product or service design  1. Establish the aim of the project – assess Village Volvo’s competitive position  2. Determine customer expectations (rows) – interviews etc.  3. Describe the elements of the service (columns)  4. Roof of the house - note the strength of relationship between the service elements  5. Body of the matrix – relationship between service elements (columns) and customer expectations (rows)  6. Weighting the service elements – rating customer expectations; getting weighted scores for each column (basement)  7. Basement – service element improvement difficulty rank  8. Assessment of competition –  RHS (comparison on customer satisfaction)  Comparison on strength of the service elements 4. Quality Function Deployment
  • 18.
    6-18 House of Quality Relat ive 12 3 4 5 Customer Expectations Reliability Responsiveness Assurance Empathy Tangibles Comparison with Volvo Dealer Weighted score Improvement difficulty rank O O O Weak Medium * Strong 9 9 9 Tra ini ng Attitude Capacity Informatiion Equipm ent 8 7 7 6 6 5 5 5 5 4 4 3 3 3 3 2 2 2 2 + _ + Customer Perceptions o + + + o o o o + o o o o o o Village Volvo + Volvo Dealer Service Elements Relationships 127 82 63 102 65 1 * *
  • 19.
    6-19  Compare yourperformance with other companies known for being ‘the best in class’  For every quality dimension, some firm has earned the reputation for being the best in class  Learn how the management has achieved to be the best in class to correct your process 5. Benchmarking
  • 20.
    6-20  Impressions aboutservice quality are determined by both the outcome and the process (because customers are a part of service delivery)  Walk through audit is a customer-focused survey to find the areas for improvement  Entire customer experience is traced from beginning to end, and a flow chart of customer interaction with service system is made  Customer is asked for his/her impressions on each of these interactions  Customers can provide anew perspective to service – they can notice things easily as they are new in the system  Service managers and employees can get de-sensitize to their surroundings and also may not notice marginal decreases in service levels. 6. Walk-Through-Audit (Figure 6.7, pp. 145)
  • 21.
    6-21 1. Cost ofQuality (Juran) 2. Service Process Control 3. Statistical Process Control (Deming) 4. Unconditional Service Guarantee Achieving Service Quality
  • 22.
    1. Cost ofQuality  Products can be returned or exchanged if faulty; but what recourse does customer have to faulty services?  Legal recourse – for example in medical may lead to more procedures and tests and more paperwork leading to higher cost  Prevention cost  Costs associated with activities that keep failure from happening and minimize detection cost  Detection cost  Costs incurred to ascertain the condition of a service to determine whether it conforms to safety standards  Internal failure  Costs incurred to correct nonconforming work prior to delivery to the customer  External failure  Costs incurred to correct nonconforming work after delivery to customer or to correct work that did not satisfy a customer’s special needs  $1 in invested in prevention = $100 in detection = $10,000 in failure cost (Juran) 6-22
  • 23.
    6-23 Failure costs Detectioncosts Prevention costs External failure: Loss of future business Process control Quality planning Negative word-of-mouth Peer review Training program Liability insurance Supervision Quality audits Legal judgments Customer comment card Data acquisition and analysis Interest penalties Inspection Recruitment and selection Supplier evaluation Internal failure: Scrapped forms Rework Recovery: Expedite disruption Labor and materials Costs of Service Quality (Bank Example, table 6.6, pp. 149)
  • 24.
    2. Service ProcessControl  The control of service quality can be viewed as a feedback control system – where output is compared with a standard.  The deviation from the standard is communicated back to the input, and adjustments are made to the process to keep the output within the defined range.  Difficult to implement an effective control cycle for service due to the intangible nature of service, which makes direct measurement difficult – so we proxy or surrogate measures.  Simultaneous nature of production and consumption – prevents any direct intervention in the service process to observe conformance to requirements.  Consequently, we ask customers to express their impression of service quality after the consumption – by which time we are too late to avoid service failure.  Instead, we try to focus on delivery process by employing SPC 6-24
  • 25.
    6-25 Resources Identify reason for nonconformance Establish measure of performance Monitor conformanceto requirements Take corrective action Service concept Customer input Customer output Service process Service Process Control (Figure 6.9, pp 150)
  • 26.
    3. Service ProcessControl 6-26
  • 27.
    6-27  Unconditional (L.L.Bean) – without exception  Easy to understand and communicate (Bennigan’s) – to the customer  Meaningful (Domino’s Pizza) – it should provide compensation that is meaningful  Easy to invoke (Cititravel) – not to fill out cumbersome forms or go through a lengthy process  Easy to collect (Manpower) – should be given soon after the service lapse and after a significant time 4. Unconditional Service Guarantee: Customer View
  • 28.
    6-28  Focuses oncustomers (British Airways)  Sets clear standards (FedEx) – knows when the service has failed  Guarantees feedback (Manpower) – gets data on service failure because dissatisfied customers have an incentive to complain  Promotes an understanding of the service delivery system (Bug Killer) – you will have a better understanding of your service delivery process  Builds customer loyalty by making expectations explicit Unconditional Service Guarantee: Management View
  • 29.
    6-29  The averagebusiness only hears from 4% of their customers who are dissatisfied with their products or services. Of the 96% who do not bother to complain, 25% of them have serious problems.  The 4% complainers are more likely to stay with the supplier than are the 96% non-complainers.  About 60% of the complainers would stay as customers if their problem was resolved and 95% would stay if the problem was resolved quickly.  A dissatisfied customer will tell between 10 and 20 other people about their problem.  A customer who has had a problem resolved by a company will tell about 5 people about their situation. Customer Feedback and Word-of-Mouth (Table 6.9, pp. 156)
  • 30.
  • 31.
    6-31 Service Recovery  Disasterscan be turned into loyal customers by proper and rapid service recovery  Frontline workers, therefore, need to be properly trained and given the discretion to make things right.  Approaches to service recovery  Case-by-case addresses each customer’s complaint individually but could lead to perception of unfairness.  Systematic response uses a protocol to handle complaints but needs prior identification of critical failure points and continuous updating.  Early intervention attempts to fix problem before the customer is affected.  Substitute service allows rival firm to provide service but could lead to loss of customer.
  • 32.
    INSPECTION  Opinion surveys- about quality of service  100 percent inspection - every unit is checked; fatigue error unless automated  First article inspection - usually after the process is set up  Destructive testing  Acceptance sampling - based on statistical sampling table, the associate checks a random or stratified sample from a larger lot. If the sample is within the acceptable quality level, the lot passes inspection.
  • 33.
    Process focus  Processcapability means capable of meeting customer requirements or specifications.
  • 34.
    COMMON CAUSE vs SPECIALCAUSE VARIATION  Assignable-cause variation: these can be assigned to specific causes  Common cause variation: random and harder to trace. This is system wide and requires management decision.  Statistical Control: when a process output is free of all special cause variation, it is said to be in statistical control or simply in control.  A process in control may still have common cause variation. Continuous improvement aims at constantly working to reduce common cause variation.
  • 35.
    VARIABLES AND ATTRIBUTES In order to study process variation, we need process output data. This comes in two forms: variables and attributes data  Variables data result from measuring or computing the amount of or value of a quality characteristic. This data is continuous.  Attributes data - measurement is not required, just a classifying judgment: maybe yes or no for friendly service; good or bad for a car wash; small, medium, large melons.
  • 36.
    TOOLS FOR PROCESSIMPROVEMENT  Coarse Grained Analysis  Check Sheet – historical record of observations and represents the source of data to begin analysis and problem identfication.  Histograms - display frequency data collected over a period of time. It is more structured than a check sheet, has equal-interval numeric categories on the X-axis of an X-Y graph (see figure 6.18)  Pareto Analysis (figure 6.19): helps differentiate between trivial and important causes by ordering problems by their relative frequency in a descending order – focus efforts on the problem that offers the greatest potential improvement.  Process flowchart: it may show the steps that are unnecessary, or that need to be rearranged  Fishbone chart (cause and effect diagram): here the team works backwards from the target for improvement on the spin bone, identifying causes down through the ‘bone structure’. The lowest level of detail may reveal root causes, which need to be worked upon. (5 whys) (figure 6.21)
  • 37.
    continued  Fine GrainedTools  Scatter diagram and correlation: useful for complex processes where cause-effect relationships are unclear. It visually shows the relationship between two variables (figure 6.22)  Run diagram: it is simply a running plot of a certain measured quality characteristic. It could be number of minutes each successive airplane departs late. Or number of customers visiting the complaint desk of a store each day. The company may specify the upper limit and the lower limit. ( figure 6.17).
  • 38.
    Process control charts: While the run diagram plots data on every unit, the process control chart, less precisely referred to as the quality control chart, relies on sampling. The method requires plotting statistical samples of measured process output for a quality characteristic. By watching the plotted points, the observer can detect unusual process variation, which calls for some kind of corrective action.  Mean chart and range chart (figure 6.10)  Central line for the mean and the range charts  Upper and lower control limits for the mean chart  Upper and lower control limit for the range chart  Process capability Analysis  Cp versus Cpk
  • 39.
    QUESTIONS TO PONDER 1. What is a transformation process? How might process performance be described in terms of quality characteristics?  2. How do special-cause variation and common cause variation relate to process control and process capability?  3. What are the roles of run diagrams and process control charts in improvement programs? What are the similarities and differences?  4. In control charting for variables why use two charts (e.g. mean and range)?  5. Inspection does not necessarily lead to quality. Discuss?  6. Quality is as good as the data is. Discuss? How do variables data differ from attributes data?
  • 40.
    6-40 Topics for Discussion How do the five dimensions of service quality differ from those of product quality?  Why is measuring service quality so difficult?  Compare the philosophies of Deming and Crosby.  What are the limitations of “benchmarking”.  Illustrate the four components in the cost of quality for a service.  Why do service firms hesitate to offer a service guarantee?  How can recovery from a service failure be a blessing in disguise?