Download to read offline
![TIME 1 hour
INSTRUCTIONS TO CANDIDATES
Write your name, Centre number and candidate number in the spaces at the top of this page.
Answer all questions.
Write your answers in the spaces provided on the question paper.
Use a sharp pencil for your drawings. Coloured pencils or crayons should not be used.
INFORMATION FOR CANDIDATES
The intended number of marks is given in brackets [ ] at the end of each question or part question.
International General Certificate of Secondary Education
CAMBRIDGE INTERNATIONAL EXAMINATIONS
BIOLOGY 0610/6
PAPER 6 Alternative to Practical
OCTOBER/NOVEMBER SESSION 2002
1 hour
Candidates answer on the question paper.
No additional materials are required.
This question paper consists of 11 printed pages and 1 blank page.
SP (AT/JG) S21867/3
© CIE 2002 [Turn over
Candidate
Centre Number Number
Candidate Name
FOR EXAMINER’S USE
1
2
3
4
TOTAL](https://image.slidesharecdn.com/0610w02qp6-140803213714-phpapp02/85/0610-w02-qp_6-1-320.jpg)
![2
0610/6/O/N/02
1 (a) Fig. 1.1 shows a potato plant and one flower and one tuber are shown in detail.
Fig. 1.1
(i) Make large, labelled drawings of the tuber and the flower shown in detail.
[4]
For
Examiner’s
Use](https://image.slidesharecdn.com/0610w02qp6-140803213714-phpapp02/85/0610-w02-qp_6-2-320.jpg)
![3
0610/6/O/N/02 [Turn over
(ii) State the type of reproduction carried out by the tuber and the flower.
tuber ......................................................
flower .................................................... [1]
(b) Humans use the potato tubers as a source of food. The main food component is a
complex carbohydrate, starch.
Fig. 1.2 shows some starch grains found inside the cells of tubers.
Fig. 1.2
(i) Determine the length of one starch grain in mm, given that the cells are magnified
860 times.
Show your working.
length of starch grain .............................................. mm [2]
(ii) Name the metabolic process by which plants make carbohydrate.
...............................................................................................................................[1]
For
Examiner’s
Use](https://image.slidesharecdn.com/0610w02qp6-140803213714-phpapp02/85/0610-w02-qp_6-3-320.jpg)
![4
0610/6/O/N/02
(iii) Describe an experiment you could carry out to show the formation of starch in a
green plant.
...................................................................................................................................
...................................................................................................................................
...................................................................................................................................
...................................................................................................................................
...................................................................................................................................
...............................................................................................................................[4]
[Total : 12]
For
Examiner’s
Use](https://image.slidesharecdn.com/0610w02qp6-140803213714-phpapp02/85/0610-w02-qp_6-4-320.jpg)
![5
0610/6/O/N/02 [Turn over
For
Examiner’s
Use
volume of
test ascorbic
acid (cm3)
1 1.5
2 1.0
3 1.1
4 0.9
5 1.0
average
2 Ascorbic acid (vitamin C) is found in fresh fruits and vegetables. The amount in a known
quantity of fruit juice can be determined by decolourising a blue dye, DCPIP.
(a) Students were provided with 0.1% ascorbic acid solution (0.1 g ascorbic acid in
100 cm3 water) and 0.1% freshly prepared DCPIP solution.
1 cm3 DCPIP was placed in a clean test-tube. The ascorbic acid was added, using a
graduated pipette, until the blue colour disappeared.
The test was carried out five times and the results are shown in Table 2.1.
Table 2.1
(i) Complete Table 2.1 by calculating the average (mean) value of the data. [1]
(ii) Examine the data in Table 2.1.
Suggest a more reliable average value, stating a reason for your answer.
...................................................................................................................................
...............................................................................................................................[2]](https://image.slidesharecdn.com/0610w02qp6-140803213714-phpapp02/85/0610-w02-qp_6-5-320.jpg)
![7
0610/6/O/N/02 [Turn over
For
Examiner’s
Use
Table 2.2
[5]
(iii) On the grid, show your results in an appropriate form to compare the ascorbic acid
content of the five fruit juices.
[4]
(c) The concentration of ascorbic acid (vitamin C) is highest in fresh fruit juices.
Describe a simple investigation you could carry out to show the effect of storage on the
ascorbic acid content of one of the five fruit juices.
..........................................................................................................................................
..........................................................................................................................................
..........................................................................................................................................
..........................................................................................................................................
..........................................................................................................................................
......................................................................................................................................[3]
[Total : 15]
n
p
type of juice lemon apple grapefruit lime grape
volume of juice
used to decolourise
DCPIP = p cm3
= g of
ascorbic acid](https://image.slidesharecdn.com/0610w02qp6-140803213714-phpapp02/85/0610-w02-qp_6-7-320.jpg)
![8
0610/6/O/N/02
For
Examiner’s
Use
3 If your teeth are not cared for and cleaned regularly, plaque may build up.
(a) Fig. 3.1 shows, in outline, some human front teeth.
Carefully shade in the areas where plaque would be found.
Fig. 3.1 [2]
(b) Plaque is acidic and can damage the enamel of the teeth.
A sample of plaque was removed from the teeth and the pH determined using a pH
meter.
Fig. 3.2 shows the dial on the pH meter.
Fig. 3.2
(i) What is the pH reading? ................................... [1]
(ii) Suggest an alternative way by which you could determine the pH of a similar
sample of plaque and the observation you would expect to make.
...................................................................................................................................
...................................................................................................................................
...................................................................................................................................
...............................................................................................................................[2]
pH5
6
8
7
gum](https://image.slidesharecdn.com/0610w02qp6-140803213714-phpapp02/85/0610-w02-qp_6-8-320.jpg)
![9
0610/6/O/N/02 [Turn over
(c) Bacteria play an active part in causing tooth decay and in the formation of plaque.
Suggest one way in which you could show that these bacteria are living organisms.
..........................................................................................................................................
..........................................................................................................................................
..........................................................................................................................................
..........................................................................................................................................
..........................................................................................................................................
..........................................................................................................................................
......................................................................................................................................[3]
[Total : 8]
For
Examiner’s
Use](https://image.slidesharecdn.com/0610w02qp6-140803213714-phpapp02/85/0610-w02-qp_6-9-320.jpg)
![10
0610/6/O/N/02
For
Examiner’s
Use
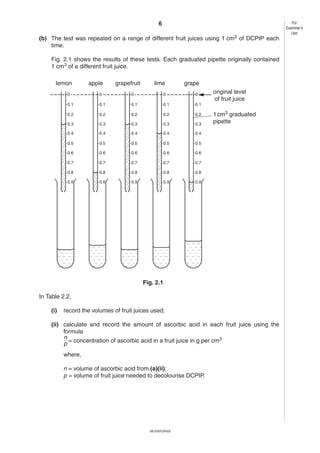
4 Figs. 4.1 and 4.2 show two samples of human blood cells as seen using a light microscope.
Fig. 4.1
Fig. 4.2
(a) State how you would determine the ratio of red blood cells to white blood cells.
..........................................................................................................................................
......................................................................................................................................[1]
(b) (i) Describe three differences between the samples shown in Figs. 4.1 and 4.2.
...................................................................................................................................
...................................................................................................................................
...............................................................................................................................[3]
(ii) Suggest an explanation for these differences.
...................................................................................................................................
...............................................................................................................................[1]
[Total : 5]](https://image.slidesharecdn.com/0610w02qp6-140803213714-phpapp02/85/0610-w02-qp_6-10-320.jpg)


This document contains instructions for a 1-hour biology exam. It details 4 sections containing multiple choice and written response questions that assess students' understanding of topics like plant and animal cell structure and function, enzymes, and human health. Students are to record their answers on the question paper. The exam document provides guidance on marking, materials allowed, and copyright information.