Downloaded 21 times
![w
w
ap
eP
m
e
tr
.X
w
om
.c
s
er
UNIVERSITY OF CAMBRIDGE INTERNATIONAL EXAMINATIONS
International General Certificate of Secondary Education
*0409173684*
0610/31
BIOLOGY
May/June 2010
Paper 3 Extended
1 hour 15 minutes
Candidates answer on the Question Paper.
No Additional Materials are required.
READ THESE INSTRUCTIONS FIRST
Write your Centre number, candidate number and name on all the work you hand in.
Write in dark blue or black pen.
You may use a pencil for any diagrams or graphs.
Do not use staples, paper clips, highlighters, glue or correction fluid.
DO NOT WRITE IN ANY BARCODES.
Answer all questions.
At the end of the examination, fasten all your work securely together.
The number of marks is given in brackets [ ] at the end of each question or part
question.
For Examiner's Use
1
2
3
4
5
6
Total
This document consists of 17 printed pages and 3 blank pages.
IB10 06_0610_31/4RP
© UCLES 2010
[Turn over](https://image.slidesharecdn.com/0610s10qp31-140207024000-phpapp01/85/0610-s10-qp_31-1-320.jpg)
![2
1
(a) Define the term sensitivity.
For
Examiner's
Use
[2]
Fig. 1.1 shows a horizontal section through the eye.
E
X
D
C
B
A
Y
Fig. 1.1
(b) (i) Name structures A to D.
A
B
C
D
[4]
(ii) State the functions of structures B and E.
B
E
© UCLES 2010
[2]
0610/31/M/J10](https://image.slidesharecdn.com/0610s10qp31-140207024000-phpapp01/85/0610-s10-qp_31-2-320.jpg)
![3
The retina contains light-sensitive cells known as rods and cones. The distribution of rods in
the retina from point X to point Y, as shown on Fig. 1.1, was investigated.
For
Examiner's
Use
Fig. 1.2 shows the distribution of rods in the retina from point X to point Y.
number
of lightsensitive
cells
X
G
H
Y
distance along the retina
Fig. 1.2
(c) (i) G and H, as shown on Fig. 1.2, are parts of the retina.
Name G and H.
G
H
[2]
(ii) Describe the function of the rods.
[2]
(iii) Draw a line on Fig. 1.2 to show the distribution of cones in the retina.
[2]
[Total: 14]
© UCLES 2010
0610/31/M/J10
[Turn over](https://image.slidesharecdn.com/0610s10qp31-140207024000-phpapp01/85/0610-s10-qp_31-3-320.jpg)
![4
2
A student measured the uptake and release of carbon dioxide from a plant during 24 hours.
It was a very bright, sunny day between sunrise and sunset.
Fig. 2.1 shows the student’s results.
uptake of
carbon
dioxide
no net
uptake
or release
release of
carbon
dioxide
0000
0600
1200
1800
2400
time / h
Fig. 2.1
(a) (i) Use the information in Fig. 2.1 to state the time that sunrise occurred.
[1]
(ii) Using Fig. 2.1, state the times when there is no uptake or release of carbon
dioxide.
1.
2.
[1]
(iii) State why plants release carbon dioxide at night.
[1]
(iv) Explain why it is important for plants that carbon dioxide uptake during the day is
greater than carbon dioxide released at night.
[2]
© UCLES 2010
0610/31/M/J10
For
Examiner's
Use](https://image.slidesharecdn.com/0610s10qp31-140207024000-phpapp01/85/0610-s10-qp_31-4-320.jpg)

![6
The yields of tomatoes grown in open fields in India are very low compared with yields of
tomatoes grown in glasshouses in Europe.
In a study, scientists in India grew tomato plants in glasshouses and in open fields nearby.
The growth of the plants and the yields of tomatoes were recorded.
The results are shown in Table 2.1.
Table 2.1
tomato plants grown in
glasshouses
mean final height of
tomato plants / cm
mean number of
leaves per tomato
plant
mean fresh mass of
tomato plants / g
mass of tomatoes
per plant / g
mean fresh mass of
tomatoes / g
open fields
84.1
69.0
123.0
82.0
988.3
491.7
2986.0
818.9
95.0
84.4
(b) (i) The mean fresh mass of tomatoes grown in glasshouses was greater than the
mean fresh mass of tomatoes grown in open fields.
Calculate the difference in mean fresh mass as a percentage of the mean fresh
mass of tomatoes grown in open fields.
Show your working.
Answer =
© UCLES 2010
0610/31/M/J10
%
[2]
For
Examiner's
Use](https://image.slidesharecdn.com/0610s10qp31-140207024000-phpapp01/85/0610-s10-qp_31-6-320.jpg)
![7
(ii) Suggest how an increase in the height of the plants and the number of leaves on
each plant affects the yield of tomatoes.
For
Examiner's
Use
[3]
(c) The scientists made sure that the only differences between the two groups of plants
were the result of the protection provided by the glasshouses.
Suggest the factors that the scientists should have kept the same for the two groups of
plants in this investigation.
[3]
(d) The growth and final yields of crops grown in open fields are often limited by
environmental factors.
Describe how these factors are controlled in commercial glasshouses to give high
yields of crops such as tomatoes.
[4]
[Total: 17]
© UCLES 2010
0610/31/M/J10
[Turn over](https://image.slidesharecdn.com/0610s10qp31-140207024000-phpapp01/85/0610-s10-qp_31-7-320.jpg)
![8
3
Fig. 3.1 shows a human egg cell and a human sperm cell.
100 µm
For
Examiner's
Use
10 µm
human egg cell
human sperm cell
Fig. 3.1
(a) (i) What is the name given to the release of eggs from the ovary?
[1]
(ii) Sperm cells and egg cells are haploid. State the meaning of the term haploid.
[1]
© UCLES 2010
0610/31/M/J10](https://image.slidesharecdn.com/0610s10qp31-140207024000-phpapp01/85/0610-s10-qp_31-8-320.jpg)
![9
(b) Complete the table to compare egg cells with sperm cells.
feature
egg cells
For
Examiner's
Use
sperm cells
site of production
relative size
numbers produced
mobility
[4]
(c) Three hormones that control the menstrual cycle are:
•
•
•
follicle stimulating hormone (FSH)
luteinising hormone (LH)
oestrogen.
(i) Name the site of production and release of oestrogen.
[1]
(ii) Describe the role of oestrogen in controlling the menstrual cycle.
[2]
(d) Artificial insemination is sometimes used as a treatment for female infertility.
Outline how artificial insemination is carried out in humans.
[2]
[Total: 11]
© UCLES 2010
0610/31/M/J10
[Turn over](https://image.slidesharecdn.com/0610s10qp31-140207024000-phpapp01/85/0610-s10-qp_31-9-320.jpg)
![10
4
Acid rain is a serious environmental problem in some areas of the world. Lakes in Canada,
Norway and Scotland are highly acidic as a result of acid rain.
Fig. 4.1 shows a cause of acid rain.
wind-blown chemicals
combine with water
vapour in the air
power stations and
factories release
sulfur dioxide
rain becomes acidic
harming vegetation
and organisms that
live in water
lake
Fig. 4.1
(a) (i) State one cause of acid rain other than that shown in Fig. 4.1.
[1]
(ii) Describe two effects of acid rain on forest ecosystems.
1.
2.
[2]
(b) Describe two different ways to reduce pollution so that there is less acid rain.
1.
2.
[2]
© UCLES 2010
0610/31/M/J10
For
Examiner's
Use](https://image.slidesharecdn.com/0610s10qp31-140207024000-phpapp01/85/0610-s10-qp_31-10-320.jpg)
![11
Fig. 4.2 shows the pH ranges that some animals that live in lakes can tolerate.
animals
group
examples
For
Examiner's
Use
pH
7.0
6.5
6.0
5.5
5.0
4.5
4.0
3.5
trout
fish
bass
perch
frogs
amphibians
salamanders
clams
molluscs
snails
crustacean
crayfish
mayfly larvae
insects
blackfly larvae
Fig. 4.2
(c) State one feature of molluscs that is not a feature of crustaceans.
[1]
(d) Using the information in Fig. 4.2,
(i) name an animal that could be found in a lake with a pH of 4.0;
[1]
(ii) name the animals that are most sensitive to a decrease in pH;
[1]
(iii) suggest why some animals cannot tolerate living in water of pH as low as 4.0.
[2]
[Total: 10]
© UCLES 2010
0610/31/M/J10
[Turn over](https://image.slidesharecdn.com/0610s10qp31-140207024000-phpapp01/85/0610-s10-qp_31-11-320.jpg)
![12
5
Fig. 5.1 shows the processes involved in the manufacture of yoghurt.
For
Examiner's
Use
milk
sugar may be added
milk heat treated at 85–95 °C for 15 to 30 minutes
milk homogenised to give an even consistency
milk cooled
starter culture of bacteria added
mixture incubated at 37– 44 °C
oxygen used up
pH decreases
mixture cooled
food additives and fruit added
yoghurt is packed and sent at 4 °C to shops
Fig. 5.1
(a) (i) Explain why the milk must be cooled before the bacteria are added.
[2]
(ii) Explain why the pH decreases only after the oxygen in the milk has been used up.
[2]
(iii) Suggest one type of food additive that could be added to yoghurt.
[1]
© UCLES 2010
0610/31/M/J10](https://image.slidesharecdn.com/0610s10qp31-140207024000-phpapp01/85/0610-s10-qp_31-12-320.jpg)
![13
The starter culture contains two species of bacteria, Streptococcus thermophilus and
Lactobacillus bulgaricus.
For
Examiner's
Use
Fig. 5.2 shows the growth of these bacteria during the production of yoghurt.
S. thermophilus
numbers of
bacteria
L. bulgaricus
0
1
2
3
4
5
6
time since start of incubation / h
Fig. 5.2
(b) Using your knowledge of population growth and the factors that affect it, describe
and explain the growth of S. thermophilus, as shown in Fig. 5.2.
[5]
© UCLES 2010
0610/31/M/J10
[Turn over](https://image.slidesharecdn.com/0610s10qp31-140207024000-phpapp01/85/0610-s10-qp_31-13-320.jpg)
![14
(c) Suggest why the numbers of L. bulgaricus do not start to increase until after the
increase in the numbers of S. thermophilus.
[2]
[Total: 12]
© UCLES 2010
0610/31/M/J10
For
Examiner's
Use](https://image.slidesharecdn.com/0610s10qp31-140207024000-phpapp01/85/0610-s10-qp_31-14-320.jpg)

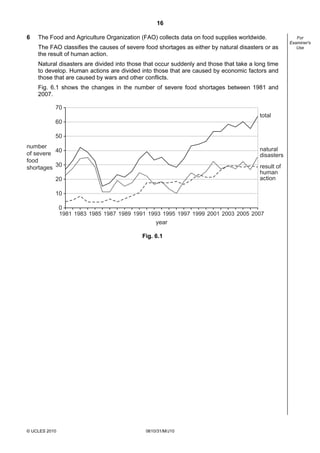
![17
Fig. 6.2 shows the causes of severe food shortages in the 1980s, 1990s and 2000s.
1980s
1990s
14 %
86 %
2000s
20 %
natural
disasters
80 %
For
Examiner's
Use
27 %
73 %
2%
11 %
27 %
result of
human
action
98 %
key
89 %
sudden onset
slow onset
economic factors
73 %
war and conflict
Fig. 6.2
(a) (i) State two types of natural disaster that occur suddenly and may lead to severe
food shortages.
1.
2.
[2]
(ii) State one type of natural disaster that may take several years to develop.
[1]
© UCLES 2010
0610/31/M/J10
[Turn over](https://image.slidesharecdn.com/0610s10qp31-140207024000-phpapp01/85/0610-s10-qp_31-17-320.jpg)
![18
(b) Use the information in Fig. 6.1 and Fig. 6.2 to describe the changes in food shortages
between 1981 and 2007.
[5]
(c) Explain how the increase in the human population may contribute to severe food
shortages.
[3]
© UCLES 2010
0610/31/M/J10
For
Examiner's
Use](https://image.slidesharecdn.com/0610s10qp31-140207024000-phpapp01/85/0610-s10-qp_31-18-320.jpg)
![19
The quality and quantity of food available worldwide has been improved by artificial
selection (selective breeding) and genetic engineering.
(d) Use a named example to outline how artificial selection is used to improve the quantity
or quality of food.
[4]
(e) Define the term genetic engineering.
[1]
[Total: 16]
© UCLES 2010
0610/31/M/J10
For
Examiner's
Use](https://image.slidesharecdn.com/0610s10qp31-140207024000-phpapp01/85/0610-s10-qp_31-19-320.jpg)


This document is an exam paper for the International General Certificate of Secondary Education (IGCSE) Biology exam. It consists of several multiple choice and written response questions covering topics in biology like the structure and function of the eye, plant respiration, tomato plant growth in glasshouses vs open fields, human reproduction, acid rain, yoghurt production, food shortages, and selective breeding. Students are asked to define terms, describe processes, interpret graphs and diagrams, calculate percentages, and suggest explanations.