SlideShare a Scribd company logo
1. Results tables: 
CM to add Tables as an appendix once ILR has been closed. The Quality Team will provide the information. 
(LR 16-18, LR 19+, LR all learners, ER, Functional Skills, Ethnicity, Gender, ALS) 
02B - Engineering +6 or more from Nat av +2 to +5 from Nat av +1 to -2 from Nat av -3 or more from Nat av 
The 12/13 national ave rages for Suc cess Rates by Age, Length & Level are de rived fro m Pro-ac hieve an d are wei ghted av erages f or the mix of provis ion in /the 
school/sub-school. All LR Statistics are taken from LIVE LR SAR ProAchieve summary. (date created: 17-10-2014). The 12/13 National Average percentages have 
been rounded to the nearest whole number. 
Table 1 Learner Respon sive 16-18 
Starts Retention (completers) Achievement Success Rate 
Year ending 
11/12 12/13 13/14 
11/12 
% 
12/13 
% 
13/14 
% 
12/13 
Nat 
Av 
11/12 
% 
12/13 
% 
13/14 
% 
12/13 
Nat 
Av 
11/12 
% 
12/13 
% 
13/14 
% 
12/13 
Nat 
Av 
E/L1 Long 54 47 27 83% 100% 96% 89% 98% 100% 96% 99% 81% 100% 93% 88% 
L2 Long 35 14 47 89% 93% 89% 97% 94% 100% 93% 91% 83% 93% 83% 88% 
L3 Long 83 60 67 77% 97% 91% 86% 81% 98% 98% 88% 63% 95% 90% 75% 
LH Long 0 0 0 0% 0% 0% 0% 0% 0% 0% 0% 0% 0% 0% 0% 
LX Long 0 0 0 0% 0% 0% 0% 0% 0% 0% 0% 0% 0% 0% 0% 
All Long 172 121 141 81% 98% 91% 90% 89% 99% 96% 90% 73% 97% 88% 81% 
Short < 5 wks 12 1 0 100% 100% 0% 0% 100% 100% 0% 0% 100% 100% 0% 0% 
Short 5-24 wks 11 53 1 82% 94% 0% 0% 100% 98% 0% 0% 82% 92% 0% 0% 
All Quals 195 175 142 83% 97% 91% 90% 91% 99% 96% 90% 75% 95% 87% 81% 
Table 2 Learner Responsive 19+ 
Starts Retention (completers) Achievement Success Rate 
Year ending 
11/12 12/13 13/14 
11/12 
% 
12/13 
% 
13/14 
% 
12/13 
Nat 
Av 
11/12 
% 
12/13 
% 
13/14 
% 
12/13 
Nat 
Av 
11/12 
% 
12/13 
% 
13/14 
% 
12/13 
Nat 
Av 
E/L1 Long 87 18 8 87% 78% 100% 100% 95% 86% 100% 100% 83% 67% 100% 100% 
L2 Long 42 19 23 90% 84% 96% 90% 95% 100% 100% 89% 86% 84% 96% 80% 
L3 Long 37 27 21 89% 89% 90% 88% 73% 100% 100% 94% 65% 89% 90% 83% 
LH Long 0 0 0 0% 0% 0% 0% 0% 0% 0% 0% 0% 0% 0% 0% 
LX Long 0 0 0 0% 0% 0% 0% 0% 0% 0% 0% 0% 0% 0% 0%
All Long 166 64 52 89% 84% 94% 90% 90% 96% 100% 93% 80% 81% 94% 84% 
Short < 5 wks 1 10 0 100% 100% 0% 0% 100% 100% 0% 0% 100% 100% 0% 0% 
Short 5-24 wks 13 41 2 69% 90% 0% 100% 100% 97% 0% 40% 69% 88% 0% 40% 
All Quals 180 115 54 87% 88% 91% 90% 90% 97% 100% 92% 79% 85% 91% 83% 
Table 3 Learner Responsive (All ages) 
Starts Retention (completers) Achievement Success Rate 
Year ending 
11/12 12/13 13/14 
11/12 
% 
12/13 
% 
13/14 
% 
12/13 
Nat 
Av 
11/12 
% 
12/13 
% 
13/14 
% 
12/13 
Nat 
Av 
11/12 
% 
12/13 
% 
13/14 
% 
12/13 
Nat 
Av 
E/L1 Long 141 65 35 86% 94% 97% 90% 96% 97% 97% 99% 82% 91% 94% 89% 
L2 Long 77 33 70 90% 88% 91% 93% 94% 100% 95% 90% 84% 88% 87% 84% 
L3 Long 120 87 88 81% 94% 91% 86% 78% 99% 99% 90% 63% 93% 90% 77% 
LH Long 0 0 0 0% 0% 0% 0% 0% 0% 0% 0% 0% 0% 0% 0% 
LX Long 0 0 0 0% 0% 0% 0% 0% 0% 0% 0% 0% 0% 0% 0% 
All Long 338 185 193 85% 93% 92% 89% 90% 98% 97% 91% 76% 91% 90% 81% 
Short < 5 wks 13 11 0 100% 100% 0% 0% 100% 100% 0% 0% 100% 100% 0% 0% 
Short 5-24 wks 24 94 3 75% 93% 0% 93% 100% 98% 0% 75% 75% 90% 0% 68% 
All Quals 375 290 196 85% 93% 91% 89% 91% 98% 97% 91% 77% 91% 88% 81% 
Headline success rate trends (all ages and levels) 
The National Averages for headline Success Rates were obtained from the NSRT Overall 
Success Rates Report 2012/13- Headline Success Rate table. 
Table 4 
11/12% 12/13% 
13/14 
% 
12/13 
Nat Av 
All Long SSR 76% 91% 90% 83% 
All Short < 5 wks SSR 100% 100% 0% 94% 
All Short 5-24 wks 
75% 90% 0% 87% 
SSR 
All Quals SSR 77% 91% 88% 87% 
Table 5 Functional Skills - Learner Responsive (All ages) 
Starts Retention (completers) Achievement Success Rate 
Year ending 
11/12 12/13 13/14 
11/12 
% 
12/13 
% 
13/14 
% 
12/13 
Nat 
Av 
11/12 
% 
12/13 
% 
13/14 
% 
12/13 
Nat 
Av 
11/12 
% 
12/13 
% 
13/14 
% 
12/13 
Nat 
av 
Level 1 10 18 55 70% 89% 93% 71% 81% 78% 50% 72% 73% 72% 
Level 2 0 0 21 0% 0% 95% 0% 0% 75% 0% 0% 71% 61%
All levels 10 18 76 70% 89% 93% 71% 81% 77% 50% 72% 72% 70% 
The 12/13Functional Skills national averages are generic national benchmarks provided by The Data Service and were obtained from the QSR report success 
rate summaries produced 12/01/2014. 
The Data Tables for Ethnicity, Gender, Disability and Functional Skills were obtained from the ProAchieve pivot report: ProAchieve SAR with 1314 data 20141017 
and can be accessed via SharePoint. 
Table 6 Ethnicity - Learner Responsive (All ages lengths and levels) 
Starts Retention (completers) Achievement Success Rate 
Year ending 11/12 12/13 13/14 
11/12 
% 
12/13 
% 
13/14 
% 
12/13 
Nat 
Av 
11/12 
% 
12/13 
% 
13/14 
% 
12/13 
Nat 
Av 
11/12 
% 
12/13 
% 
13/14 
% 
12/13 
Nat 
Av 
African 32 21 27 91% 100% 93% 93% 83% 100% 100% 92% 75% 100% 93% 86% 
Bangladeshi 1 0 0 0% 0% 0% 94% 0% 0% 0% 92% 0% 0% 0% 86% 
Caribbean 7 0 0 57% 0% 0% 92% 100% 0% 0% 92% 57% 0% 0% 85% 
Chinese 4 1 0 100% 100% 0% 95% 100% 100% 0% 94% 100% 100% 0% 89% 
Indian 3 4 2 100% 75% 100% 95% 100% 100% 100% 93% 100% 75% 100% 88% 
Other Asian 20 21 7 100% 71% 100% 94% 85% 80% 100% 92% 85% 57% 100% 86% 
Other Black 0 0 0 0% 0% 0% 93% 0% 0% 0% 91% 0% 0% 0% 85% 
Other Mixed 2 0 0 50% 0% 0% 91% 100% 0% 0% 92% 50% 0% 0% 84% 
Other White 9 1 3 89% 100% 100% 93% 100% 100% 100% 93% 89% 100% 100% 87% 
Pakistani 19 2 7 84% 100% 86% 93% 81% 100% 100% 93% 68% 100% 86% 86% 
White British 270 220 138 85% 95% 92% 92% 92% 99% 96% 94% 79% 93% 88% 87% 
White/ Black African 0 2 0 0% 100% 0% 92% 0% 100% 0% 92% 0% 100% 0% 84% 
White/Asian 1 2 2 100% 100% 50% 92% 100% 100% 100% 93% 100% 100% 50% 86% 
White/Black 
1 10 10 0% 90% 70% 90% 0% 100% 100% 92% 0% 90% 70% 83% 
Caribbean 
Other 1 0 0 100% 0% 0% 92% 0% 0% 0% 92% 0% 0% 0% 85% 
Not Provided 0 0 0 0% 0% 0% 91% 0% 0% 0% 92% 0% 0% 0% 84% 
Arab 0 6 0 0% 100% 0% 93% 0% 100% 0% 91% 0% 100% 0% 85% 
Gypsy/Irish Traveller 0 0 0 0% 0% 0% 90% 0% 0% 0% 93% 0% 0% 0% 84% 
Irish 5 0 0 20% 0% 0% 91% 100% 0% 0% 93% 20% 0% 0% 85% 
The 12/13 EDI national averages are generic national benchmarks provided by The Data Service and were obtained from the NSRT Overall Success Rates Report 
2012/13 Tables - Ethnicity, Gender & Learning Difficulties Success Rate tables.
Table 7 Gender - Learner Responsive (All ages lengths and levels) 
Starts Retention (completers) Achievement Success Rate 
Year ending 
11/12 12/13 13/14 
11/12 
% 
12/13 
% 
13/14 
% 
12/13 
Nat 
Av 
11/12 
% 
12/13 
% 
13/14 
% 
12/13 
Nat 
Av 
11/12 
% 
12/13 
% 
13/14 
% 
12/13 
Nat 
Av 
Female 21 14 5 71% 93% 100% 92% 93% 100% 100% 94% 67% 93% 100% 87% 
Male 354 276 191 86% 93% 91% 93% 90% 98% 97% 93% 77% 91% 88% 86% 
Table 8 Learning difficulty/disability - Learner Responsive (All ages lengths and levels) 
Starts Retention (completers) Achievement Success Rate 
Year ending 11/12 12/13 13/14 
11/12 
% 
12/13 
% 
13/14 
% 
12/13 
Nat 
Av 
11/12 
% 
12/13 
% 
13/14 
% 
12/13 
Nat 
Av 
11/12 
% 
12/13 
% 
13/14 
% 
12/13 
Nat 
Av 
Lrg diff/dis 59 53 48 88% 98% 96% 93% 96% 100% 100% 94% 85% 98% 96% 87% 
No lrg diff/dis 315 235 147 84% 92% 90% 92% 89% 97% 96% 94% 76% 89% 86% 86% 
Not known 1 2 1 0% 100% 0% 92% 0% 100% 0% 93% 0% 100% 0% 86% 
The Data Tables for Apprenti ceships and WPL we re obtaine d from th e ProAch ieve Piv ot Repor t: LR pivo ts with 13 14 studen t data 2 0141017 a nd can b e access ed 
via SharePoint. 
Table 9 Employ er Resp onsive 
Apprenticeships level 2 
2 Timely Leavers* Timely Success Rate Overall Leavers** Overall Success Rate 
Year ending 11/12 12/13 13/14 
11/12 
% 
12/13 
% 
13/14 
% 
12/13 
Nat 
av 11/12 12/13 13/14 
11/12 
% 
12/13 
% 
13/14 
% 
12/13 
Nat av 
Total 32 49 25 16% 92% 84% 56% 27 48 30 33% 92% 90% 72% 
The 12/13 national averages for ER Apprenticeships level 2, 3 overall and Workplace Learning were obtained from the Skills Funding agency QSR Report R14 
Table 10 Employer Responsive 
Advanced Apprenticeships level 3 
3 Timely Leavers* Timely Success Rate Overall Leavers** Overall Success Rate 
Year ending 11/12 12/13 13/14 
11/12 
% 
12/13 
% 
13/14 
% 
12/13 
Nat 
av 11/12 12/13 13/14 
11/12 
% 
12/13 
% 
13/14 
% 
12/13 
Nat av
Total 75 25 6 64% 72% 67% 56% 74 34 5 76% 94% 80% 73% 
* In timely measures SSR is calculated within 90 days of intended end date 
** In overall measures SSR is calculated at the appropriate year end 
Table 11 Employer Responsive 
Apprenticeships OVERALL (L2 & L3) 
A Timely Leavers* Timely Success Rate Overall Leavers** Overall Success Rate 
Year ending 11/12 12/13 13/14 
11/12 
% 
12/13 
% 
13/14 
% 
12/13 
Nat 
av 11/12 12/13 13/14 
11/12 
% 
12/13 
% 
13/14 
% 
12/13 
Nat av 
Total 109 76 31 50% 86% 81% 56% 103 84 35 65% 93% 89% 72% 
Table 12 Employer Responsive 
Non Apprenticeship (WPL & Train to Gain) 
Timely Leavers* Timely Success Rate Overall Leavers** Overall Success Rate 
Year ending 11/12 12/13 13/14 
11/12 
% 
12/13 
% 
13/14 
% 
12/13 
Nat 
av 11/12 12/13 13/14 
11/12 
% 
12/13 
% 
13/14 
% 
12/13 
Nat av 
Total 33 4 1 61% 25% 100% 79% 25 12 1 92% 83% 100% 89%

More Related Content

Similar to 02B Engineering Subschool SAR Data Tables 2013.14

161011SEND Reporting Metrics (wip)
161011SEND Reporting Metrics (wip)161011SEND Reporting Metrics (wip)
161011SEND Reporting Metrics (wip)Max Akister
 
Analisis b.tamil ar2 (recovered)
Analisis b.tamil ar2 (recovered)Analisis b.tamil ar2 (recovered)
Analisis b.tamil ar2 (recovered)Kriyash Yash
 
NAG - Butler SD General Data
NAG - Butler SD General DataNAG - Butler SD General Data
NAG - Butler SD General DataCarole Rafferty
 
NAG - Jefferson Township SD General Data
NAG - Jefferson Township SD General DataNAG - Jefferson Township SD General Data
NAG - Jefferson Township SD General DataCarole Rafferty
 
Rentabilidade acumulada fundos imobiliários julho 2015
Rentabilidade acumulada fundos imobiliários julho 2015Rentabilidade acumulada fundos imobiliários julho 2015
Rentabilidade acumulada fundos imobiliários julho 2015claudiusinhos
 
Rentabilidade acumulada fundos imobiliários junho 2015
Rentabilidade acumulada fundos imobiliários junho 2015Rentabilidade acumulada fundos imobiliários junho 2015
Rentabilidade acumulada fundos imobiliários junho 2015claudiusinhos
 
PNHS Q3-2022-DASHBOARDS finAAAL -table only.pptx
PNHS Q3-2022-DASHBOARDS finAAAL -table only.pptxPNHS Q3-2022-DASHBOARDS finAAAL -table only.pptx
PNHS Q3-2022-DASHBOARDS finAAAL -table only.pptxMa. Loiel Salome Nabelon
 
Rentabilidade acumulada fundos imobiliários agosto 2013
Rentabilidade acumulada fundos imobiliários agosto 2013Rentabilidade acumulada fundos imobiliários agosto 2013
Rentabilidade acumulada fundos imobiliários agosto 2013claudiusinhos
 
TEA Summary Report STAAR Spring 2014
TEA Summary Report STAAR Spring 2014TEA Summary Report STAAR Spring 2014
TEA Summary Report STAAR Spring 2014Paul Baez
 
1609 VS Dashboard LAC over 1 Year (Sep-16) revised attainment
1609 VS Dashboard LAC over 1 Year (Sep-16) revised attainment1609 VS Dashboard LAC over 1 Year (Sep-16) revised attainment
1609 VS Dashboard LAC over 1 Year (Sep-16) revised attainmentMax Akister
 
Rentabilidade acumulada fundos imobiliários abril 2014
Rentabilidade acumulada fundos imobiliários abril 2014Rentabilidade acumulada fundos imobiliários abril 2014
Rentabilidade acumulada fundos imobiliários abril 2014claudiusinhos
 
Supply Department Training Review Board
Supply Department Training Review BoardSupply Department Training Review Board
Supply Department Training Review BoardLacey Hocutt
 
Math final project (fnbe0814)
Math final project (fnbe0814)Math final project (fnbe0814)
Math final project (fnbe0814)Jy Chong
 
Math final
Math finalMath final
Math finalJy Chong
 
NAG - Jefferson Township SD JTMS
NAG - Jefferson Township SD JTMSNAG - Jefferson Township SD JTMS
NAG - Jefferson Township SD JTMSCarole Rafferty
 
4. one big aiesec cr
4. one big aiesec cr4. one big aiesec cr
4. one big aiesec crLibor Uhlík
 
Lake Bluff PARCC Report, with Benchmarks
Lake Bluff PARCC Report, with BenchmarksLake Bluff PARCC Report, with Benchmarks
Lake Bluff PARCC Report, with Benchmarksjustthefactswinnetka
 

Similar to 02B Engineering Subschool SAR Data Tables 2013.14 (20)

NPS
NPS NPS
NPS
 
161011SEND Reporting Metrics (wip)
161011SEND Reporting Metrics (wip)161011SEND Reporting Metrics (wip)
161011SEND Reporting Metrics (wip)
 
Analisis b.tamil ar2 (recovered)
Analisis b.tamil ar2 (recovered)Analisis b.tamil ar2 (recovered)
Analisis b.tamil ar2 (recovered)
 
NAG - Butler SD General Data
NAG - Butler SD General DataNAG - Butler SD General Data
NAG - Butler SD General Data
 
NAG - Jefferson Township SD General Data
NAG - Jefferson Township SD General DataNAG - Jefferson Township SD General Data
NAG - Jefferson Township SD General Data
 
CHART SAMPLE
CHART SAMPLECHART SAMPLE
CHART SAMPLE
 
Rentabilidade acumulada fundos imobiliários julho 2015
Rentabilidade acumulada fundos imobiliários julho 2015Rentabilidade acumulada fundos imobiliários julho 2015
Rentabilidade acumulada fundos imobiliários julho 2015
 
Rentabilidade acumulada fundos imobiliários junho 2015
Rentabilidade acumulada fundos imobiliários junho 2015Rentabilidade acumulada fundos imobiliários junho 2015
Rentabilidade acumulada fundos imobiliários junho 2015
 
PNHS Q3-2022-DASHBOARDS finAAAL -table only.pptx
PNHS Q3-2022-DASHBOARDS finAAAL -table only.pptxPNHS Q3-2022-DASHBOARDS finAAAL -table only.pptx
PNHS Q3-2022-DASHBOARDS finAAAL -table only.pptx
 
Rentabilidade acumulada fundos imobiliários agosto 2013
Rentabilidade acumulada fundos imobiliários agosto 2013Rentabilidade acumulada fundos imobiliários agosto 2013
Rentabilidade acumulada fundos imobiliários agosto 2013
 
TEA Summary Report STAAR Spring 2014
TEA Summary Report STAAR Spring 2014TEA Summary Report STAAR Spring 2014
TEA Summary Report STAAR Spring 2014
 
1609 VS Dashboard LAC over 1 Year (Sep-16) revised attainment
1609 VS Dashboard LAC over 1 Year (Sep-16) revised attainment1609 VS Dashboard LAC over 1 Year (Sep-16) revised attainment
1609 VS Dashboard LAC over 1 Year (Sep-16) revised attainment
 
Rentabilidade acumulada fundos imobiliários abril 2014
Rentabilidade acumulada fundos imobiliários abril 2014Rentabilidade acumulada fundos imobiliários abril 2014
Rentabilidade acumulada fundos imobiliários abril 2014
 
Supply Department Training Review Board
Supply Department Training Review BoardSupply Department Training Review Board
Supply Department Training Review Board
 
HR analytics report
HR analytics reportHR analytics report
HR analytics report
 
Math final project (fnbe0814)
Math final project (fnbe0814)Math final project (fnbe0814)
Math final project (fnbe0814)
 
Math final
Math finalMath final
Math final
 
NAG - Jefferson Township SD JTMS
NAG - Jefferson Township SD JTMSNAG - Jefferson Township SD JTMS
NAG - Jefferson Township SD JTMS
 
4. one big aiesec cr
4. one big aiesec cr4. one big aiesec cr
4. one big aiesec cr
 
Lake Bluff PARCC Report, with Benchmarks
Lake Bluff PARCC Report, with BenchmarksLake Bluff PARCC Report, with Benchmarks
Lake Bluff PARCC Report, with Benchmarks
 

02B Engineering Subschool SAR Data Tables 2013.14

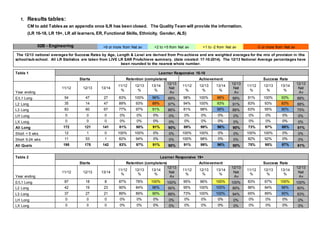
  • 1. 1. Results tables: CM to add Tables as an appendix once ILR has been closed. The Quality Team will provide the information. (LR 16-18, LR 19+, LR all learners, ER, Functional Skills, Ethnicity, Gender, ALS) 02B - Engineering +6 or more from Nat av +2 to +5 from Nat av +1 to -2 from Nat av -3 or more from Nat av The 12/13 national ave rages for Suc cess Rates by Age, Length & Level are de rived fro m Pro-ac hieve an d are wei ghted av erages f or the mix of provis ion in /the school/sub-school. All LR Statistics are taken from LIVE LR SAR ProAchieve summary. (date created: 17-10-2014). The 12/13 National Average percentages have been rounded to the nearest whole number. Table 1 Learner Respon sive 16-18 Starts Retention (completers) Achievement Success Rate Year ending 11/12 12/13 13/14 11/12 % 12/13 % 13/14 % 12/13 Nat Av 11/12 % 12/13 % 13/14 % 12/13 Nat Av 11/12 % 12/13 % 13/14 % 12/13 Nat Av E/L1 Long 54 47 27 83% 100% 96% 89% 98% 100% 96% 99% 81% 100% 93% 88% L2 Long 35 14 47 89% 93% 89% 97% 94% 100% 93% 91% 83% 93% 83% 88% L3 Long 83 60 67 77% 97% 91% 86% 81% 98% 98% 88% 63% 95% 90% 75% LH Long 0 0 0 0% 0% 0% 0% 0% 0% 0% 0% 0% 0% 0% 0% LX Long 0 0 0 0% 0% 0% 0% 0% 0% 0% 0% 0% 0% 0% 0% All Long 172 121 141 81% 98% 91% 90% 89% 99% 96% 90% 73% 97% 88% 81% Short < 5 wks 12 1 0 100% 100% 0% 0% 100% 100% 0% 0% 100% 100% 0% 0% Short 5-24 wks 11 53 1 82% 94% 0% 0% 100% 98% 0% 0% 82% 92% 0% 0% All Quals 195 175 142 83% 97% 91% 90% 91% 99% 96% 90% 75% 95% 87% 81% Table 2 Learner Responsive 19+ Starts Retention (completers) Achievement Success Rate Year ending 11/12 12/13 13/14 11/12 % 12/13 % 13/14 % 12/13 Nat Av 11/12 % 12/13 % 13/14 % 12/13 Nat Av 11/12 % 12/13 % 13/14 % 12/13 Nat Av E/L1 Long 87 18 8 87% 78% 100% 100% 95% 86% 100% 100% 83% 67% 100% 100% L2 Long 42 19 23 90% 84% 96% 90% 95% 100% 100% 89% 86% 84% 96% 80% L3 Long 37 27 21 89% 89% 90% 88% 73% 100% 100% 94% 65% 89% 90% 83% LH Long 0 0 0 0% 0% 0% 0% 0% 0% 0% 0% 0% 0% 0% 0% LX Long 0 0 0 0% 0% 0% 0% 0% 0% 0% 0% 0% 0% 0% 0%
  • 2. All Long 166 64 52 89% 84% 94% 90% 90% 96% 100% 93% 80% 81% 94% 84% Short < 5 wks 1 10 0 100% 100% 0% 0% 100% 100% 0% 0% 100% 100% 0% 0% Short 5-24 wks 13 41 2 69% 90% 0% 100% 100% 97% 0% 40% 69% 88% 0% 40% All Quals 180 115 54 87% 88% 91% 90% 90% 97% 100% 92% 79% 85% 91% 83% Table 3 Learner Responsive (All ages) Starts Retention (completers) Achievement Success Rate Year ending 11/12 12/13 13/14 11/12 % 12/13 % 13/14 % 12/13 Nat Av 11/12 % 12/13 % 13/14 % 12/13 Nat Av 11/12 % 12/13 % 13/14 % 12/13 Nat Av E/L1 Long 141 65 35 86% 94% 97% 90% 96% 97% 97% 99% 82% 91% 94% 89% L2 Long 77 33 70 90% 88% 91% 93% 94% 100% 95% 90% 84% 88% 87% 84% L3 Long 120 87 88 81% 94% 91% 86% 78% 99% 99% 90% 63% 93% 90% 77% LH Long 0 0 0 0% 0% 0% 0% 0% 0% 0% 0% 0% 0% 0% 0% LX Long 0 0 0 0% 0% 0% 0% 0% 0% 0% 0% 0% 0% 0% 0% All Long 338 185 193 85% 93% 92% 89% 90% 98% 97% 91% 76% 91% 90% 81% Short < 5 wks 13 11 0 100% 100% 0% 0% 100% 100% 0% 0% 100% 100% 0% 0% Short 5-24 wks 24 94 3 75% 93% 0% 93% 100% 98% 0% 75% 75% 90% 0% 68% All Quals 375 290 196 85% 93% 91% 89% 91% 98% 97% 91% 77% 91% 88% 81% Headline success rate trends (all ages and levels) The National Averages for headline Success Rates were obtained from the NSRT Overall Success Rates Report 2012/13- Headline Success Rate table. Table 4 11/12% 12/13% 13/14 % 12/13 Nat Av All Long SSR 76% 91% 90% 83% All Short < 5 wks SSR 100% 100% 0% 94% All Short 5-24 wks 75% 90% 0% 87% SSR All Quals SSR 77% 91% 88% 87% Table 5 Functional Skills - Learner Responsive (All ages) Starts Retention (completers) Achievement Success Rate Year ending 11/12 12/13 13/14 11/12 % 12/13 % 13/14 % 12/13 Nat Av 11/12 % 12/13 % 13/14 % 12/13 Nat Av 11/12 % 12/13 % 13/14 % 12/13 Nat av Level 1 10 18 55 70% 89% 93% 71% 81% 78% 50% 72% 73% 72% Level 2 0 0 21 0% 0% 95% 0% 0% 75% 0% 0% 71% 61%
  • 3. All levels 10 18 76 70% 89% 93% 71% 81% 77% 50% 72% 72% 70% The 12/13Functional Skills national averages are generic national benchmarks provided by The Data Service and were obtained from the QSR report success rate summaries produced 12/01/2014. The Data Tables for Ethnicity, Gender, Disability and Functional Skills were obtained from the ProAchieve pivot report: ProAchieve SAR with 1314 data 20141017 and can be accessed via SharePoint. Table 6 Ethnicity - Learner Responsive (All ages lengths and levels) Starts Retention (completers) Achievement Success Rate Year ending 11/12 12/13 13/14 11/12 % 12/13 % 13/14 % 12/13 Nat Av 11/12 % 12/13 % 13/14 % 12/13 Nat Av 11/12 % 12/13 % 13/14 % 12/13 Nat Av African 32 21 27 91% 100% 93% 93% 83% 100% 100% 92% 75% 100% 93% 86% Bangladeshi 1 0 0 0% 0% 0% 94% 0% 0% 0% 92% 0% 0% 0% 86% Caribbean 7 0 0 57% 0% 0% 92% 100% 0% 0% 92% 57% 0% 0% 85% Chinese 4 1 0 100% 100% 0% 95% 100% 100% 0% 94% 100% 100% 0% 89% Indian 3 4 2 100% 75% 100% 95% 100% 100% 100% 93% 100% 75% 100% 88% Other Asian 20 21 7 100% 71% 100% 94% 85% 80% 100% 92% 85% 57% 100% 86% Other Black 0 0 0 0% 0% 0% 93% 0% 0% 0% 91% 0% 0% 0% 85% Other Mixed 2 0 0 50% 0% 0% 91% 100% 0% 0% 92% 50% 0% 0% 84% Other White 9 1 3 89% 100% 100% 93% 100% 100% 100% 93% 89% 100% 100% 87% Pakistani 19 2 7 84% 100% 86% 93% 81% 100% 100% 93% 68% 100% 86% 86% White British 270 220 138 85% 95% 92% 92% 92% 99% 96% 94% 79% 93% 88% 87% White/ Black African 0 2 0 0% 100% 0% 92% 0% 100% 0% 92% 0% 100% 0% 84% White/Asian 1 2 2 100% 100% 50% 92% 100% 100% 100% 93% 100% 100% 50% 86% White/Black 1 10 10 0% 90% 70% 90% 0% 100% 100% 92% 0% 90% 70% 83% Caribbean Other 1 0 0 100% 0% 0% 92% 0% 0% 0% 92% 0% 0% 0% 85% Not Provided 0 0 0 0% 0% 0% 91% 0% 0% 0% 92% 0% 0% 0% 84% Arab 0 6 0 0% 100% 0% 93% 0% 100% 0% 91% 0% 100% 0% 85% Gypsy/Irish Traveller 0 0 0 0% 0% 0% 90% 0% 0% 0% 93% 0% 0% 0% 84% Irish 5 0 0 20% 0% 0% 91% 100% 0% 0% 93% 20% 0% 0% 85% The 12/13 EDI national averages are generic national benchmarks provided by The Data Service and were obtained from the NSRT Overall Success Rates Report 2012/13 Tables - Ethnicity, Gender & Learning Difficulties Success Rate tables.
  • 4. Table 7 Gender - Learner Responsive (All ages lengths and levels) Starts Retention (completers) Achievement Success Rate Year ending 11/12 12/13 13/14 11/12 % 12/13 % 13/14 % 12/13 Nat Av 11/12 % 12/13 % 13/14 % 12/13 Nat Av 11/12 % 12/13 % 13/14 % 12/13 Nat Av Female 21 14 5 71% 93% 100% 92% 93% 100% 100% 94% 67% 93% 100% 87% Male 354 276 191 86% 93% 91% 93% 90% 98% 97% 93% 77% 91% 88% 86% Table 8 Learning difficulty/disability - Learner Responsive (All ages lengths and levels) Starts Retention (completers) Achievement Success Rate Year ending 11/12 12/13 13/14 11/12 % 12/13 % 13/14 % 12/13 Nat Av 11/12 % 12/13 % 13/14 % 12/13 Nat Av 11/12 % 12/13 % 13/14 % 12/13 Nat Av Lrg diff/dis 59 53 48 88% 98% 96% 93% 96% 100% 100% 94% 85% 98% 96% 87% No lrg diff/dis 315 235 147 84% 92% 90% 92% 89% 97% 96% 94% 76% 89% 86% 86% Not known 1 2 1 0% 100% 0% 92% 0% 100% 0% 93% 0% 100% 0% 86% The Data Tables for Apprenti ceships and WPL we re obtaine d from th e ProAch ieve Piv ot Repor t: LR pivo ts with 13 14 studen t data 2 0141017 a nd can b e access ed via SharePoint. Table 9 Employ er Resp onsive Apprenticeships level 2 2 Timely Leavers* Timely Success Rate Overall Leavers** Overall Success Rate Year ending 11/12 12/13 13/14 11/12 % 12/13 % 13/14 % 12/13 Nat av 11/12 12/13 13/14 11/12 % 12/13 % 13/14 % 12/13 Nat av Total 32 49 25 16% 92% 84% 56% 27 48 30 33% 92% 90% 72% The 12/13 national averages for ER Apprenticeships level 2, 3 overall and Workplace Learning were obtained from the Skills Funding agency QSR Report R14 Table 10 Employer Responsive Advanced Apprenticeships level 3 3 Timely Leavers* Timely Success Rate Overall Leavers** Overall Success Rate Year ending 11/12 12/13 13/14 11/12 % 12/13 % 13/14 % 12/13 Nat av 11/12 12/13 13/14 11/12 % 12/13 % 13/14 % 12/13 Nat av
  • 5. Total 75 25 6 64% 72% 67% 56% 74 34 5 76% 94% 80% 73% * In timely measures SSR is calculated within 90 days of intended end date ** In overall measures SSR is calculated at the appropriate year end Table 11 Employer Responsive Apprenticeships OVERALL (L2 & L3) A Timely Leavers* Timely Success Rate Overall Leavers** Overall Success Rate Year ending 11/12 12/13 13/14 11/12 % 12/13 % 13/14 % 12/13 Nat av 11/12 12/13 13/14 11/12 % 12/13 % 13/14 % 12/13 Nat av Total 109 76 31 50% 86% 81% 56% 103 84 35 65% 93% 89% 72% Table 12 Employer Responsive Non Apprenticeship (WPL & Train to Gain) Timely Leavers* Timely Success Rate Overall Leavers** Overall Success Rate Year ending 11/12 12/13 13/14 11/12 % 12/13 % 13/14 % 12/13 Nat av 11/12 12/13 13/14 11/12 % 12/13 % 13/14 % 12/13 Nat av Total 33 4 1 61% 25% 100% 79% 25 12 1 92% 83% 100% 89%