Downloaded 133 times


![74 designing the system
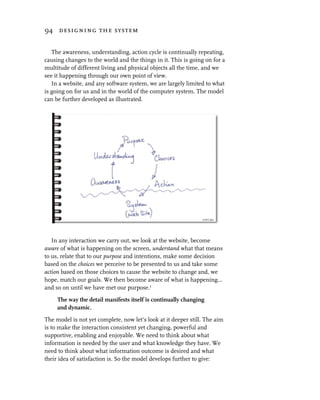
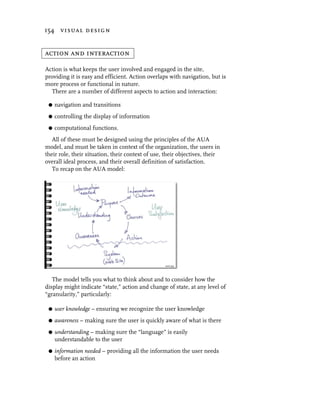
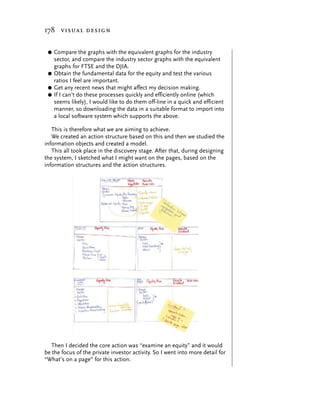
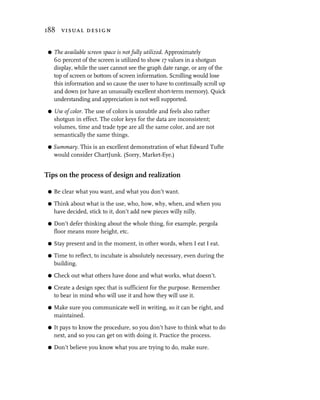
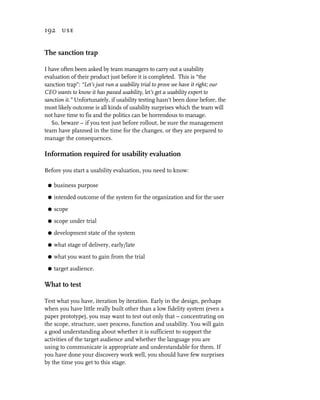
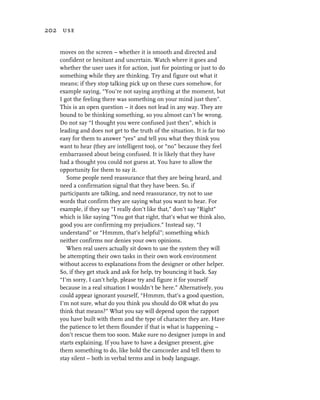
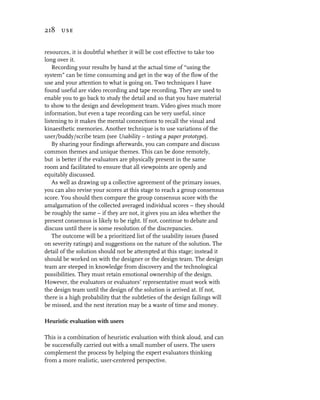
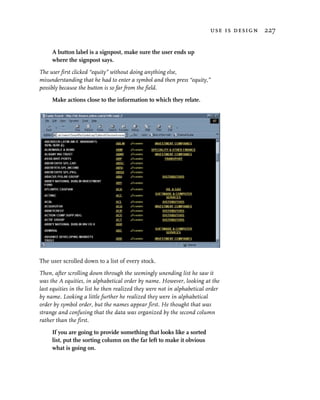
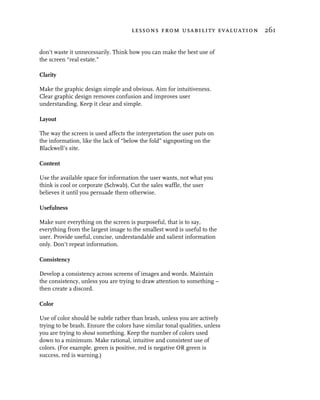
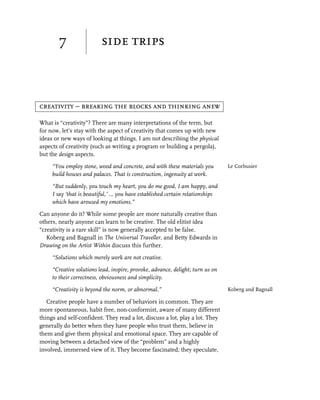
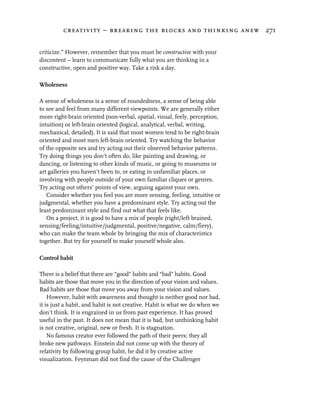
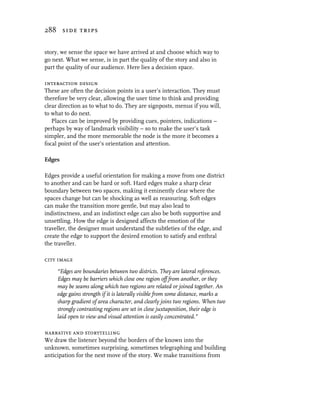
During discovery, we made a list and spatially organized them.
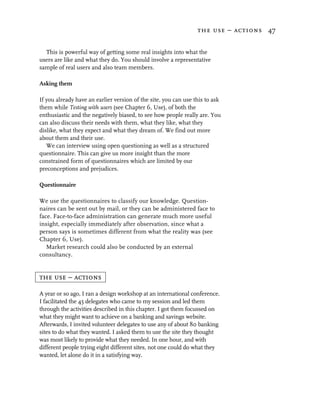
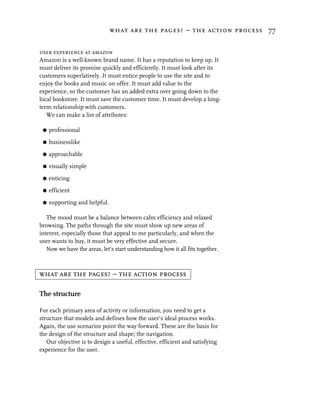
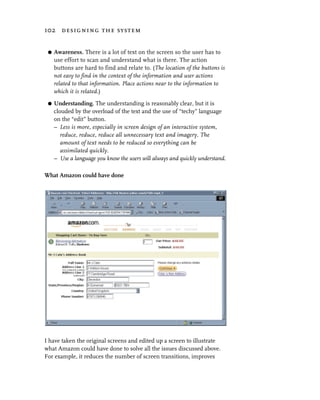
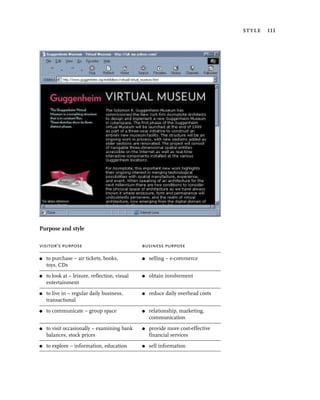
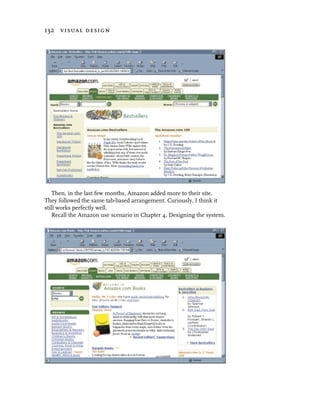
Amazon use scenario
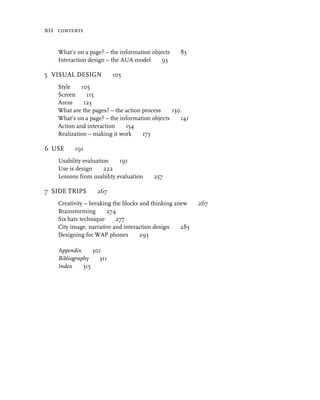
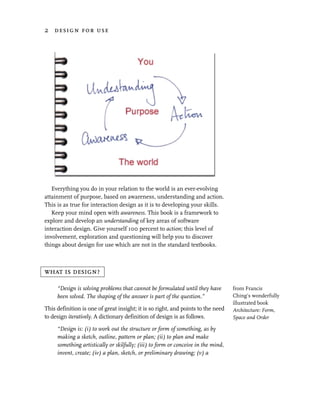
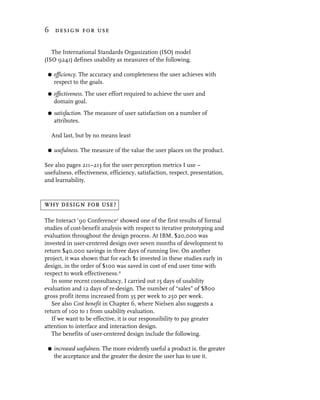
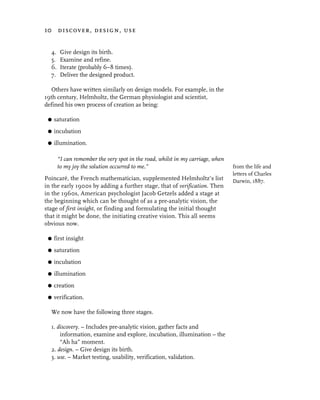
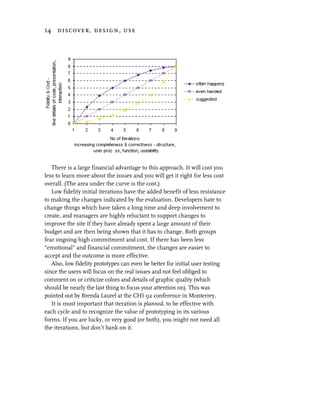
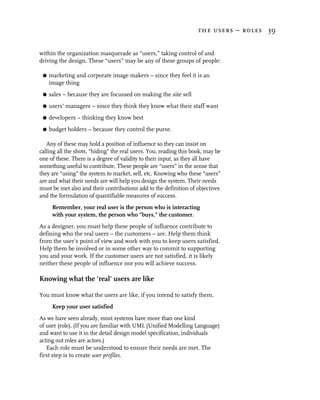
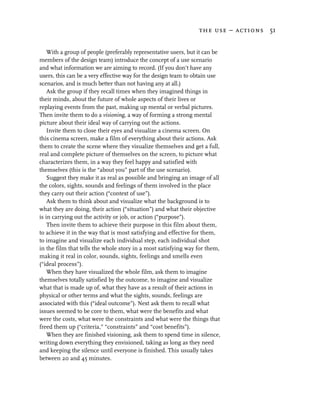
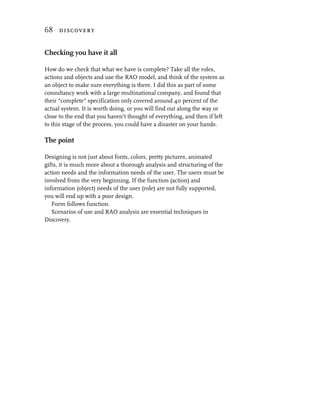
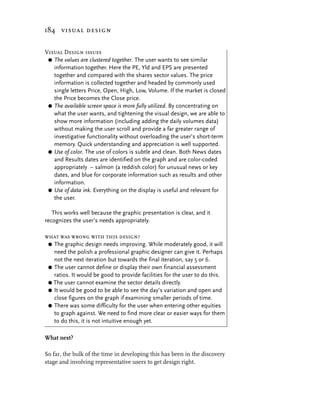
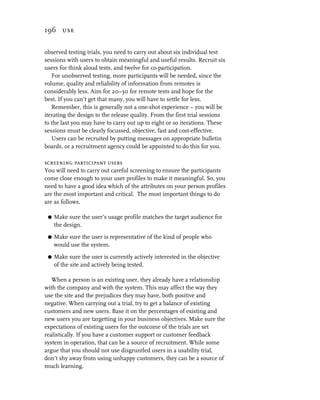
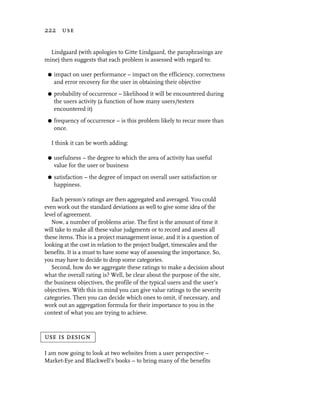
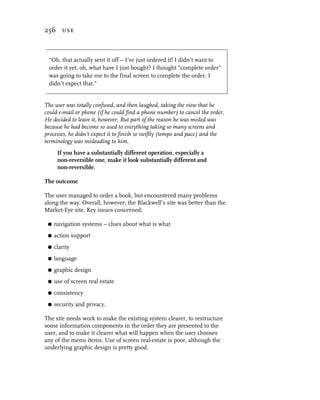
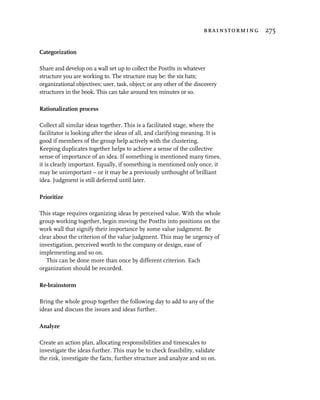
The following is a use scenario developed at a design workshop I
ran at a recent conference recently, as written by the person.
about you
I am female, 24, single, in full-time professional work, degree
educated, financial awareness is medium. I regularly use the web
and am fascinated by design and graphic design.
your context of use
I use the web mainly from work [I use] Windows 98, Internet
Explorer 5.0.
your situation
I heard from a friend that Tufte’s book Envisioning Information is a
“must have.” I want to add it to my library.
your purpose
I want to find out if I can get hold of the book, and I want it
sometime during the next week or two.
your ideal process
Enter Tufte’s name and get a list of his books. While I want
Envisioning Information, I would be interested in whatever else he
has written.
I want to buy it whatever, and then check out his other works.
Since I will be doing this as part of my work, I don’t mind being
online for a while, so long as I am getting useful information.
However, I don’t want to waste my time.
your ideal outcome – satisfaction
Satisfied I have the book ordered, and a clear idea when it will arrive.
your criteria, constraints, cost benefits
I want to buy it online if I feel it will be quicker than buying it in a
bookshop. I want to be sure that I am satisfied with the feel of it.](https://image.slidesharecdn.com/0201398605-user-centered-web-design-9780201398601-33994-090729141451-phpapp02/85/0201398605-User-Centered-Web-Design-9780201398601-33994-89-320.jpg)


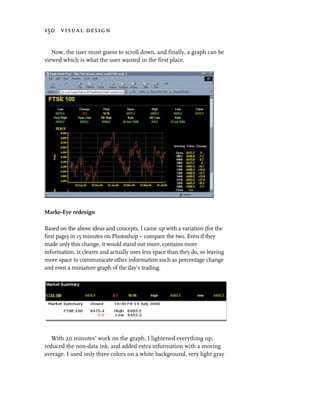
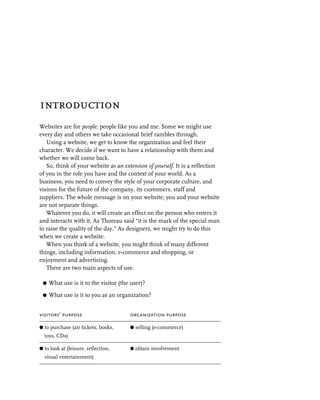
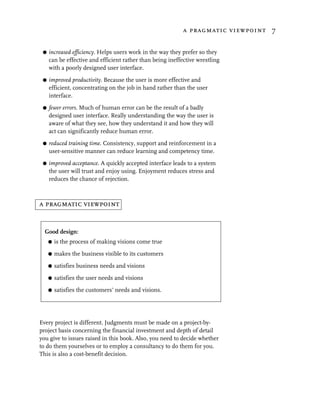
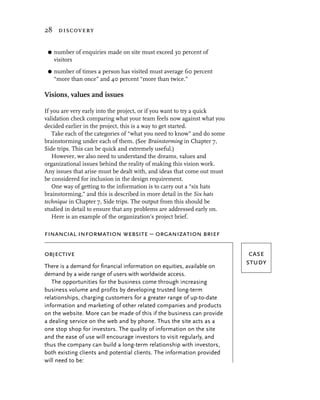
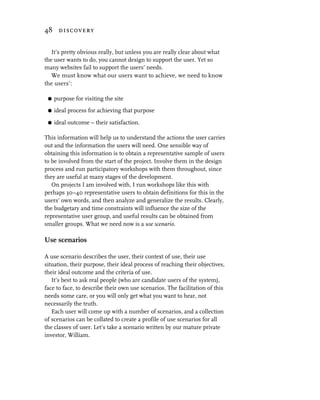
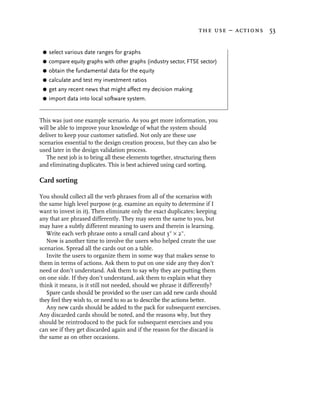
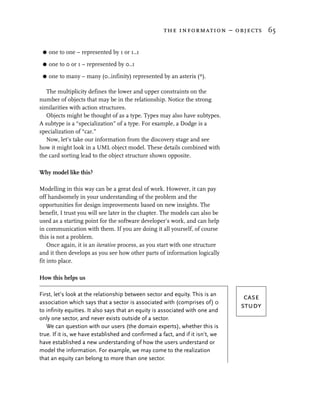
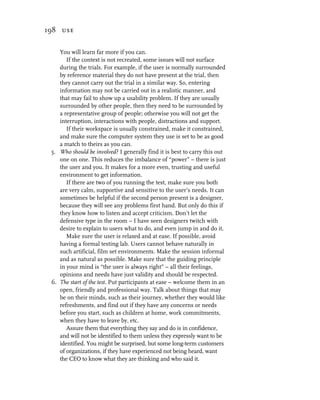
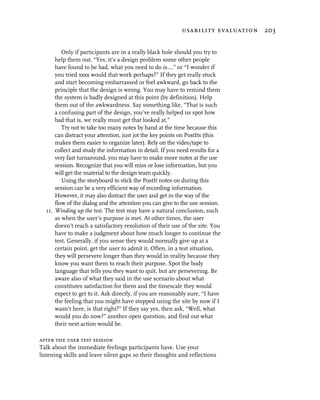
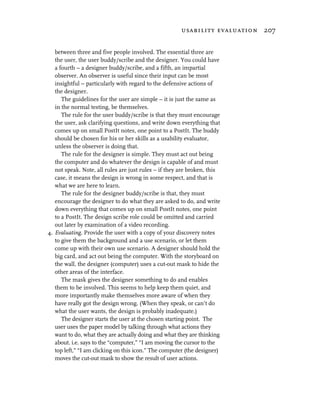
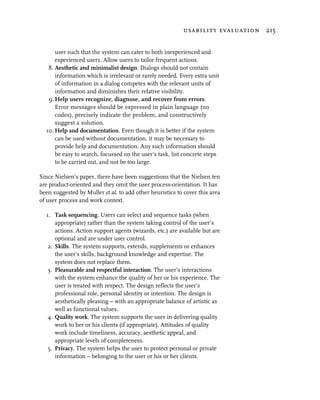
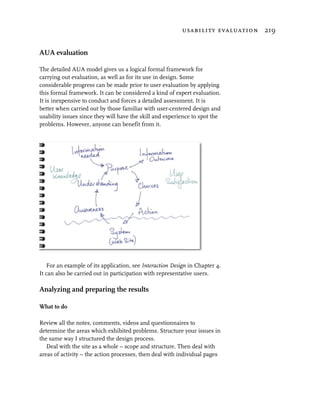
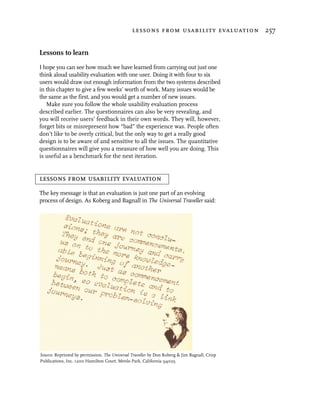
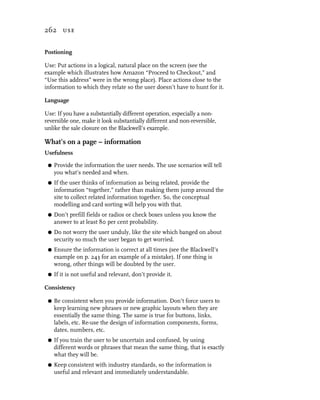
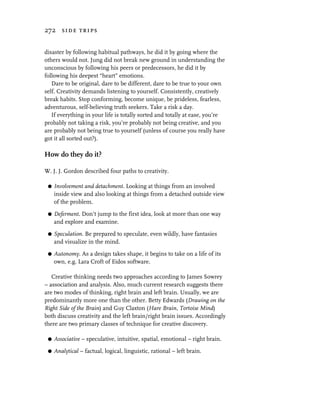
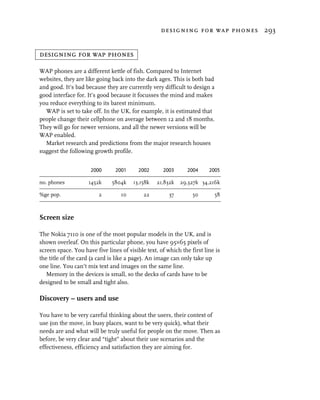
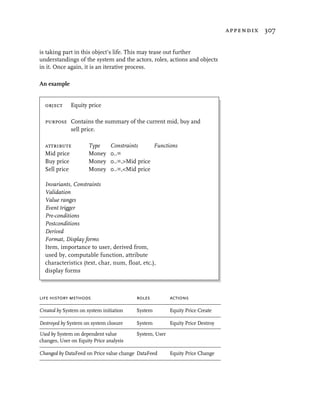
![160 visual design
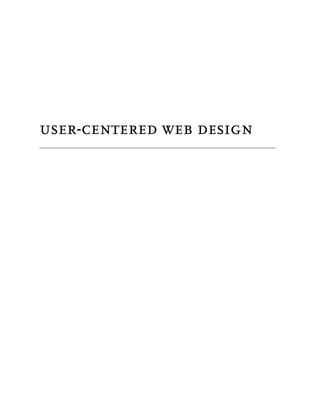
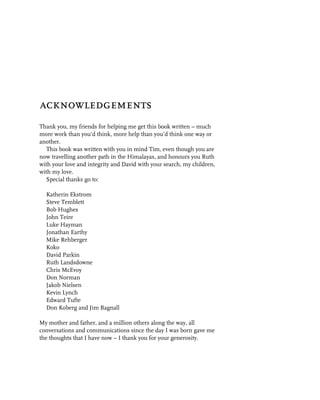
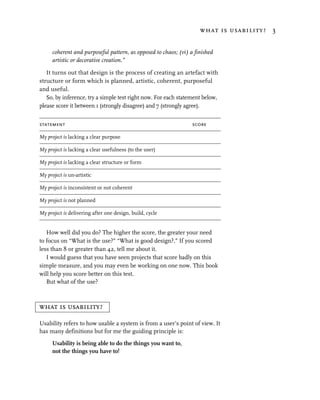
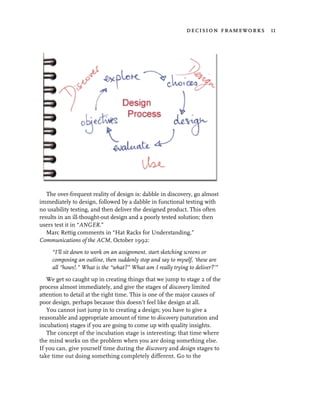
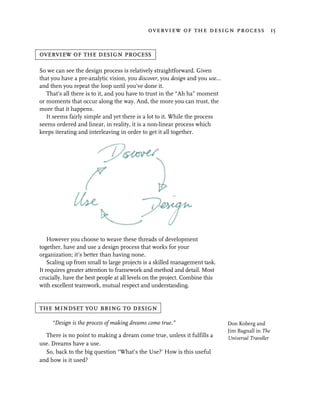
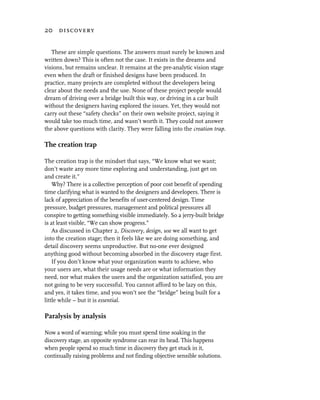
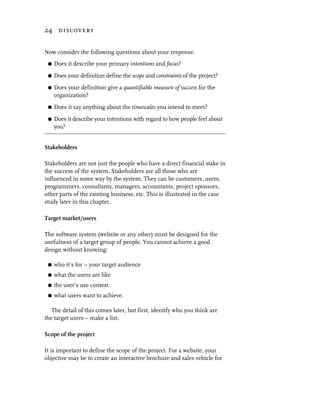
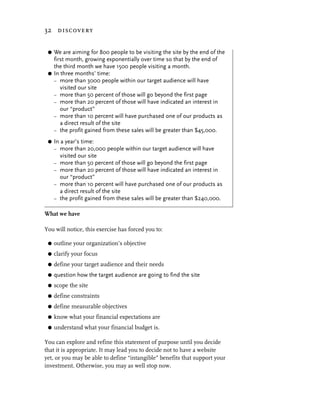
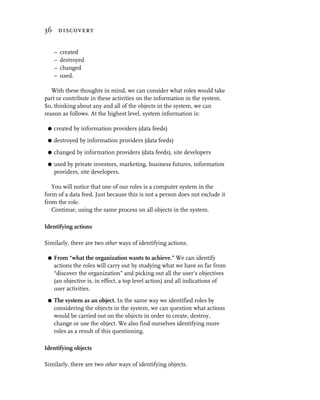
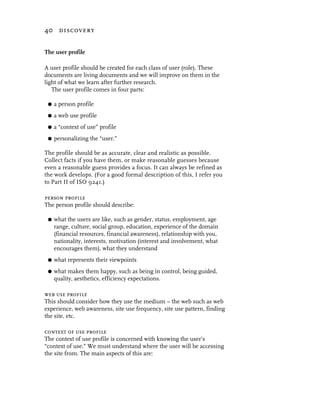
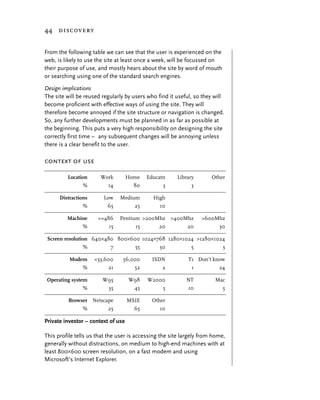
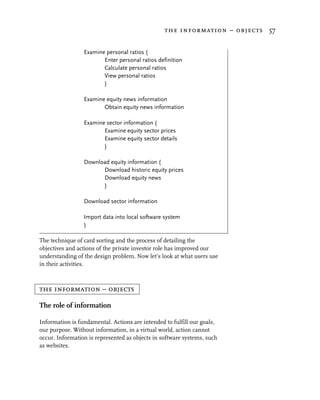
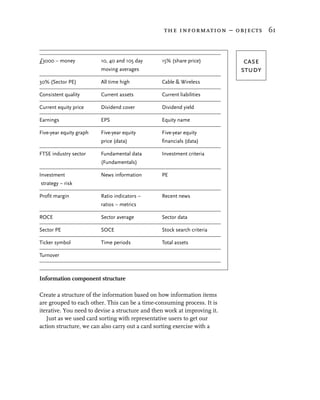
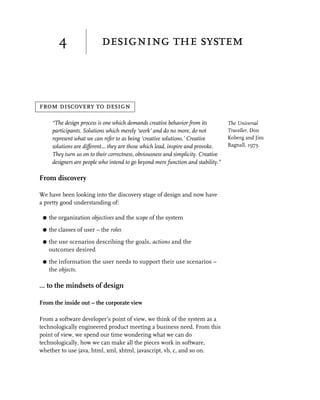
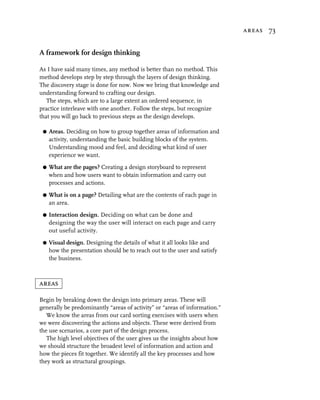
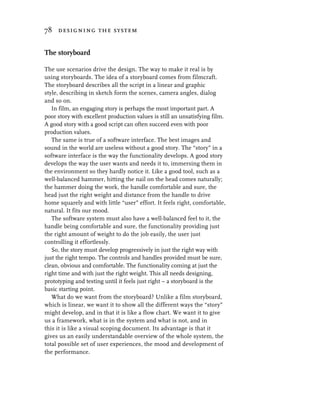
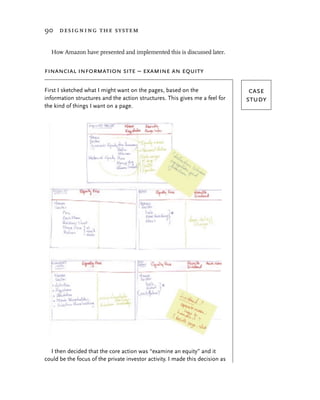
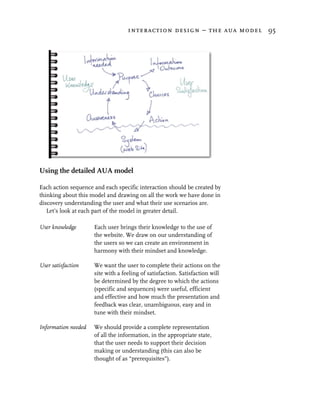
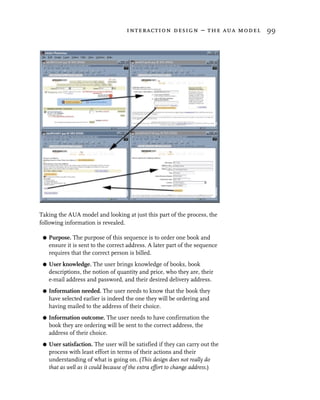
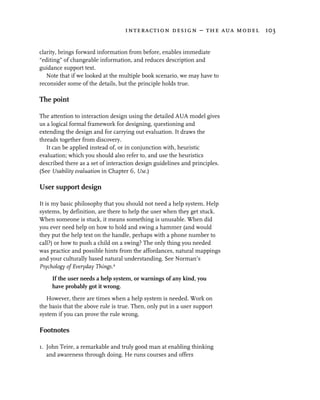
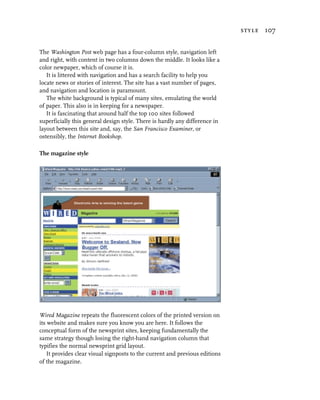
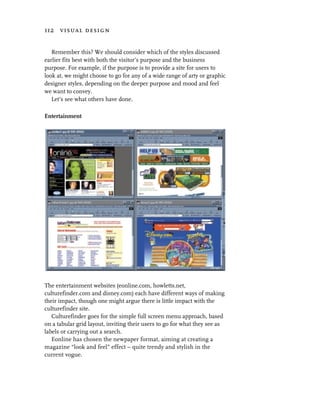
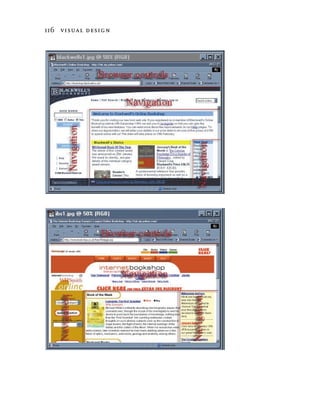
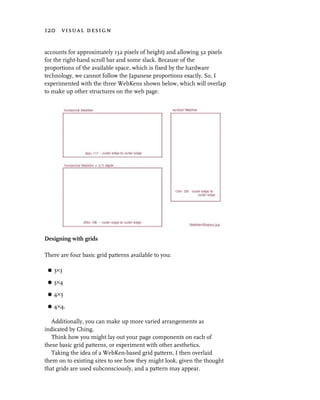
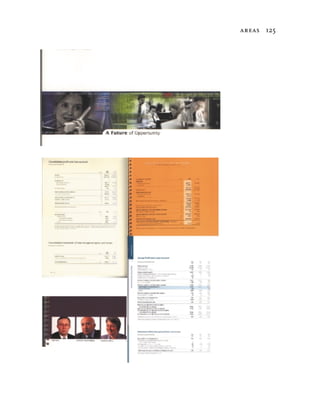
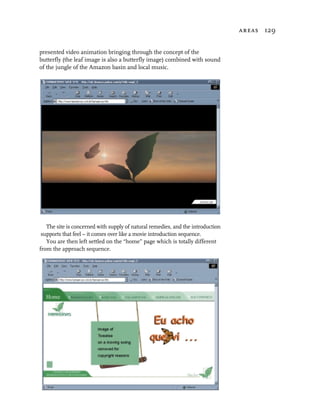
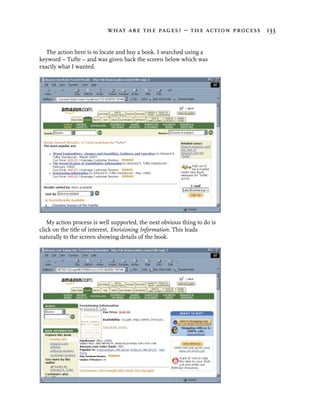
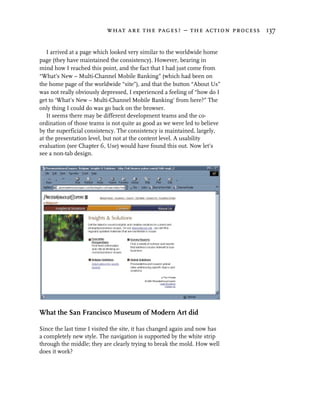
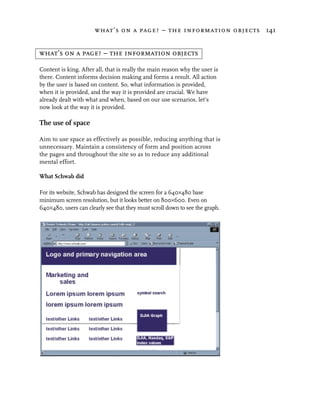
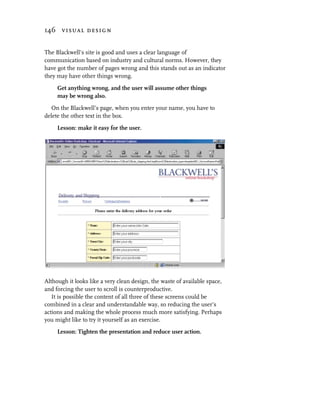
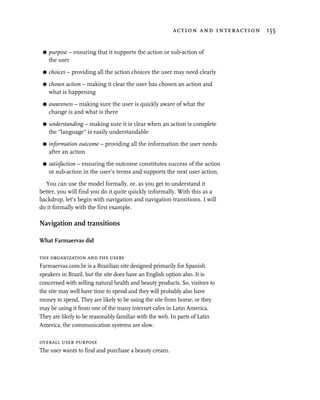
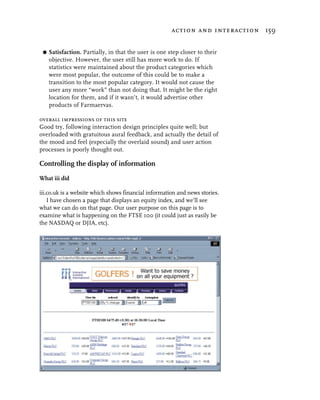
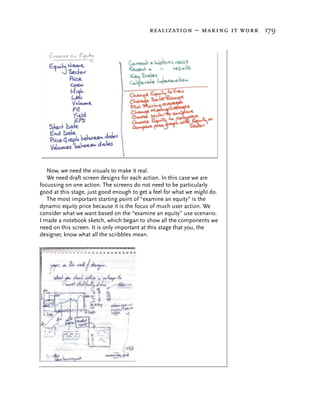
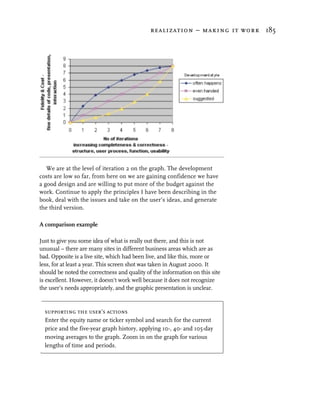
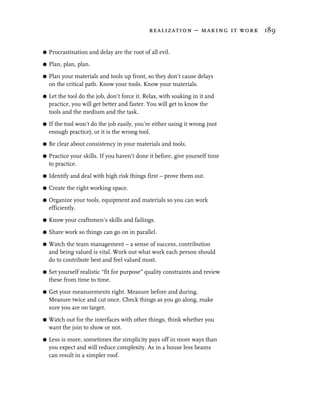
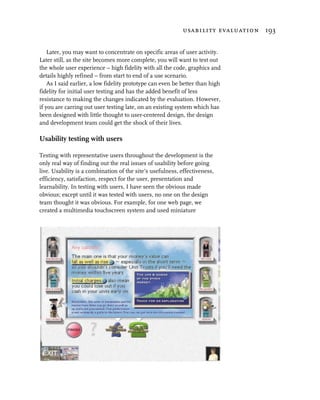
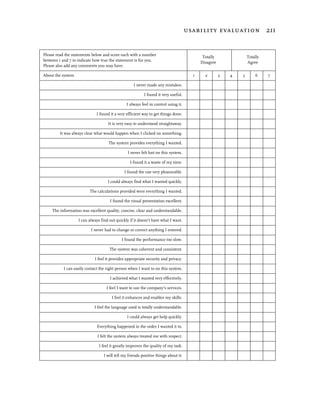
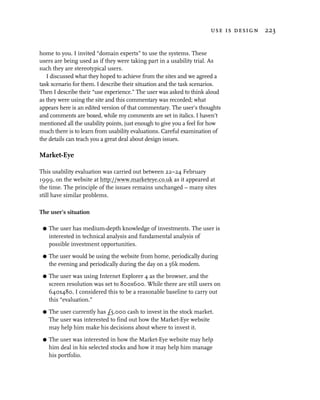
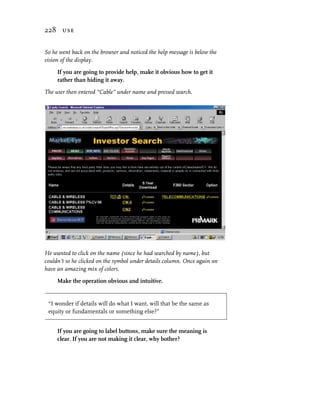
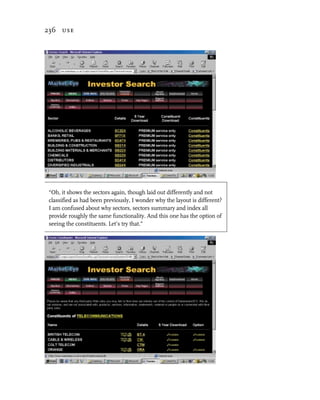
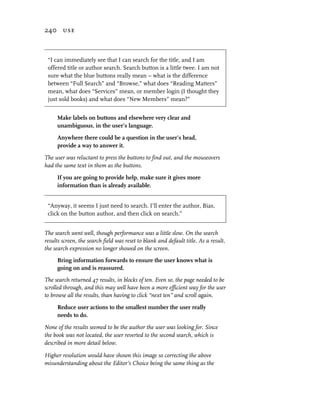
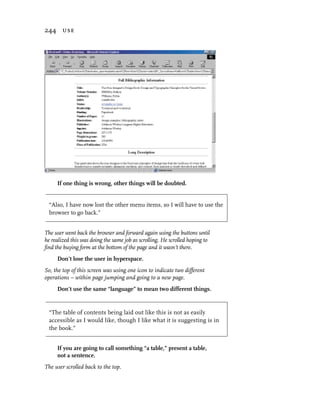
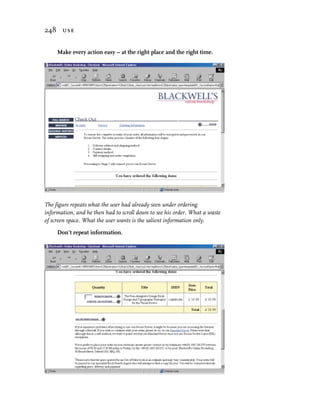
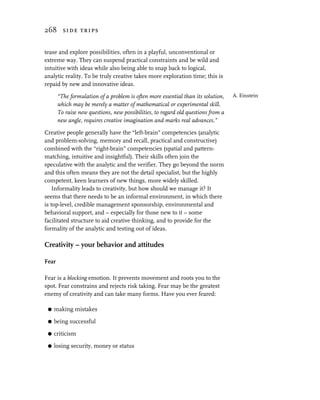
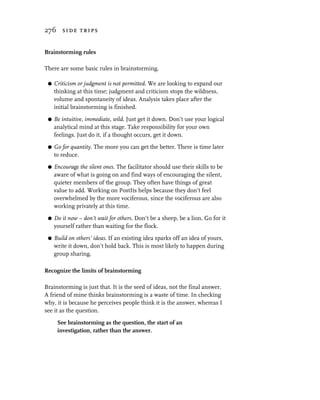
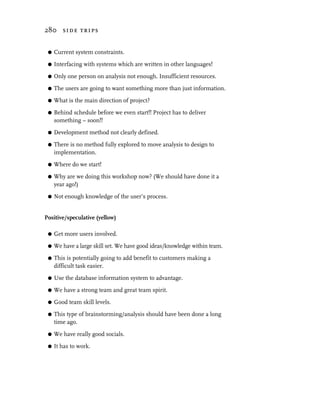
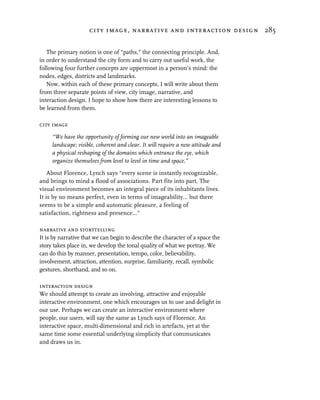
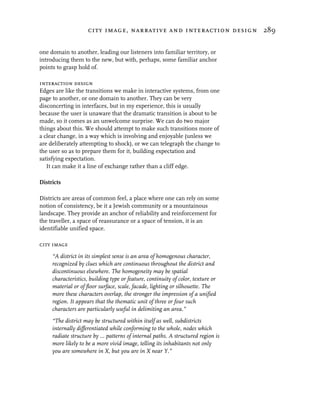
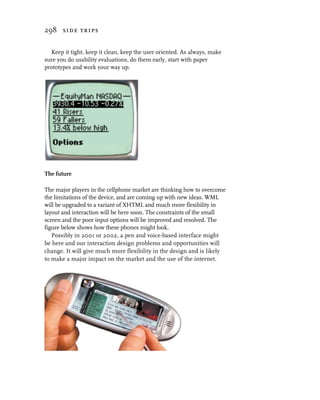
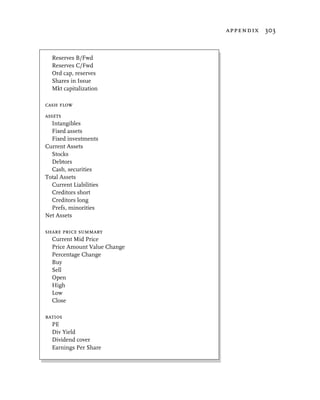
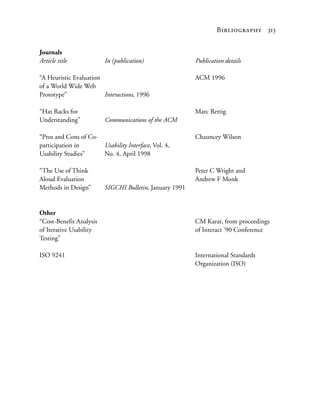
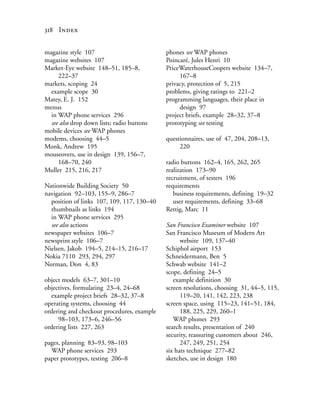
We are presented with this screen view. In essence, it is a good design.
However, even on a good design there are many lessons to be learned.
We examine the page to become aware of what we can see on it.
From our awareness, we understand that we have a number of areas of
the screen.
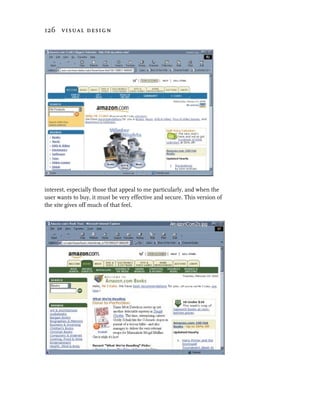
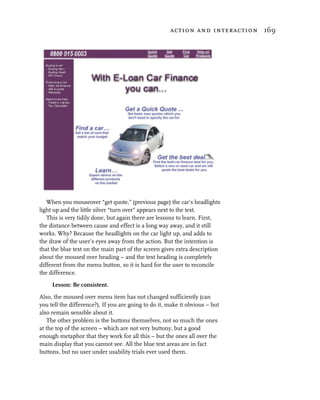
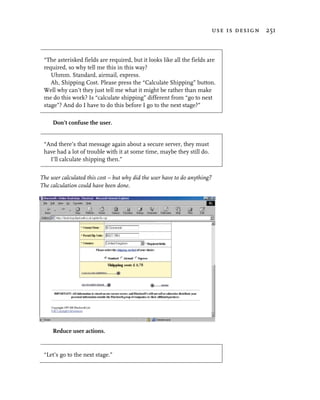
Nearly everything is easy to understand. This is a very clear
presentation, with a couple of exceptions.
G The “Sign – where we are” which rather hides until we study the
page in detail. On the other hand, it is appropriately close to the
navigation bar and is actually irrelevant since we know this already
by the light-blue tab button.
G The display layout of the index components and prices is not as
clear as it could be because of the proximity of the columns.
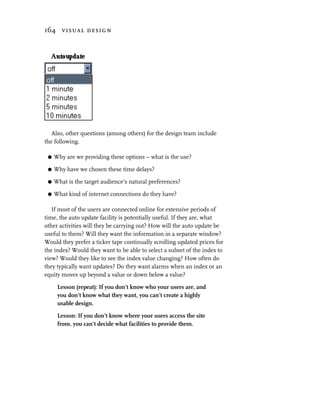
We have a number of choices of how we control the display of
information, indicated by “drop down” boxes.
G View the [FTSE 100]
G ordered [By % change]](https://image.slidesharecdn.com/0201398605-user-centered-web-design-9780201398601-33994-090729141451-phpapp02/85/0201398605-User-Centered-Web-Design-9780201398601-33994-175-320.jpg)
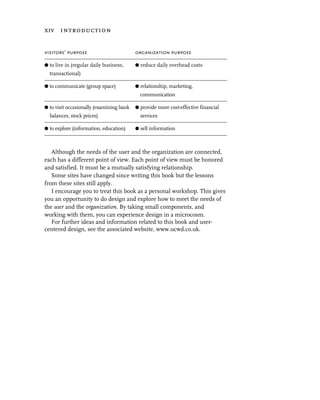
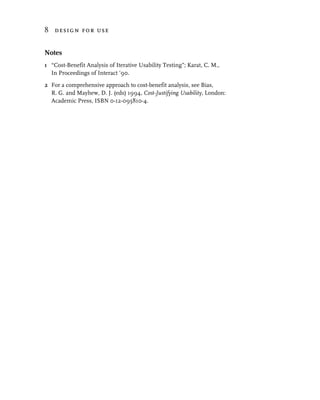
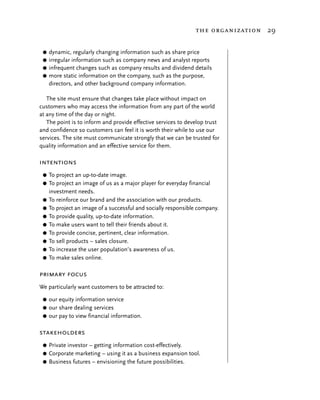
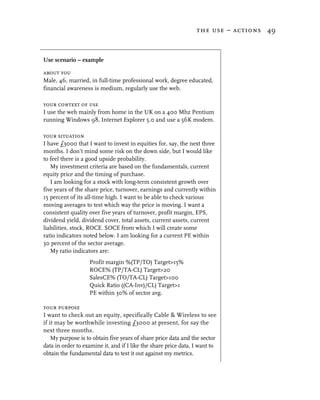
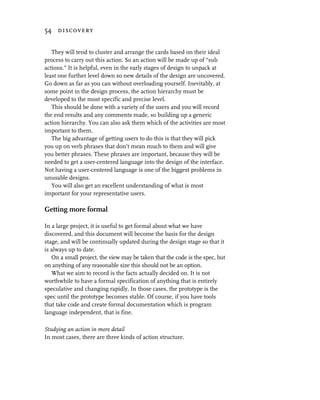
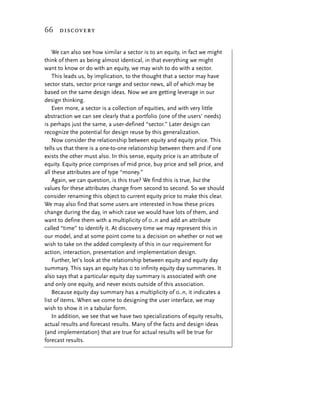
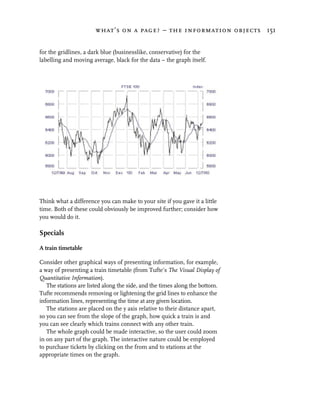
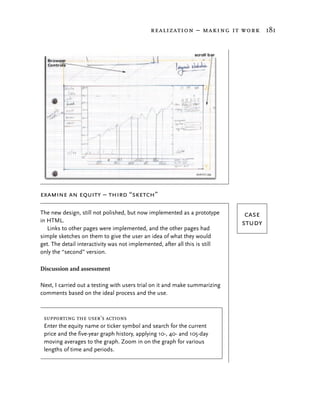
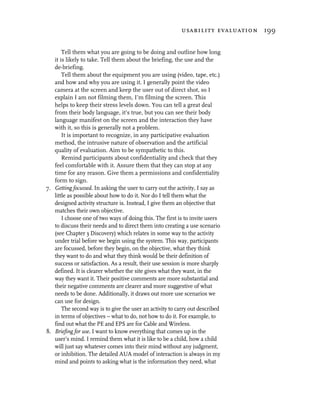
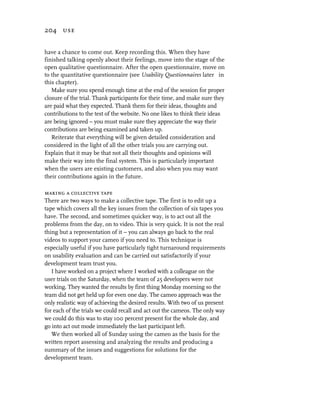
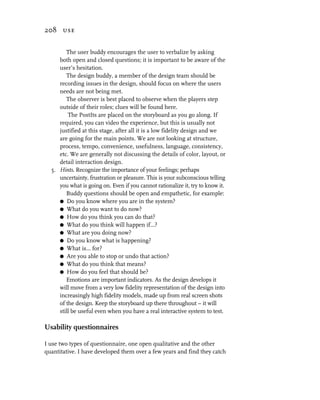
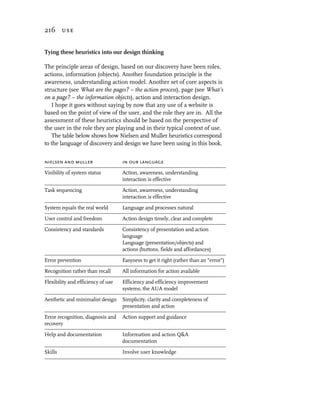
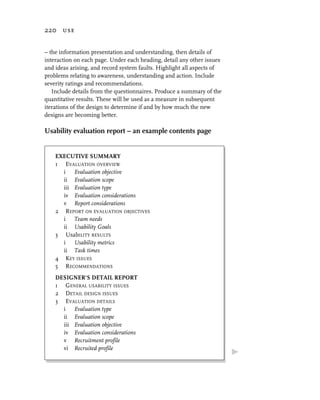
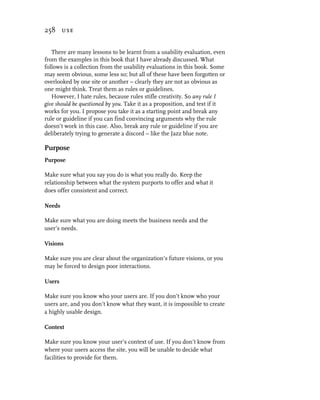
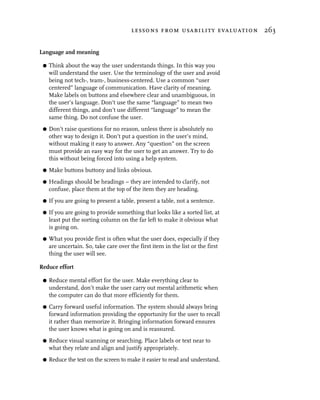
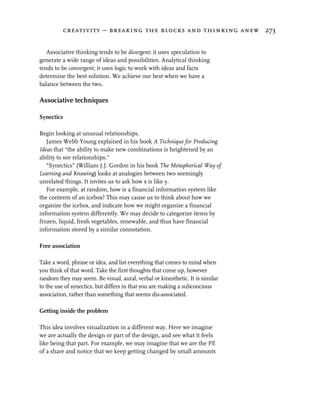
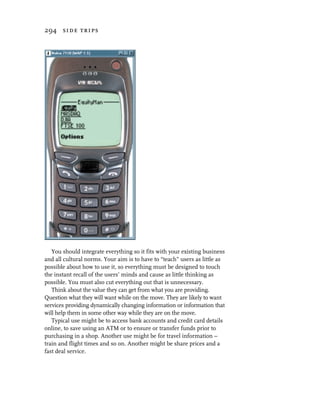
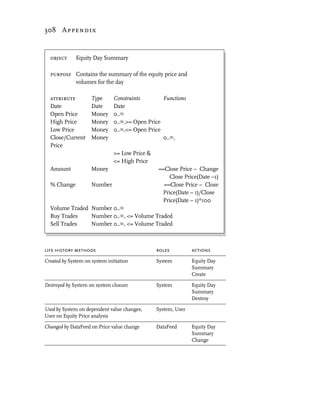
![action and interaction 161
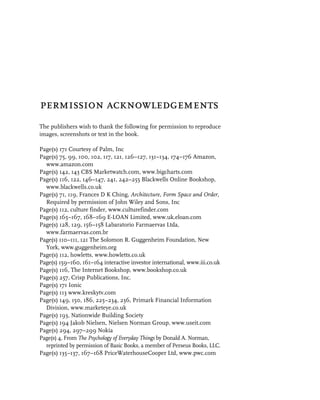
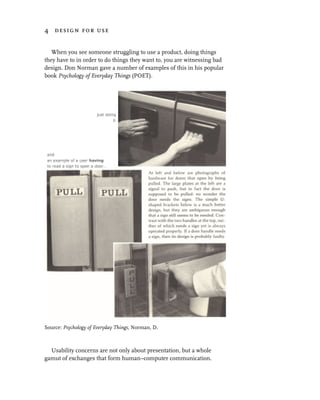
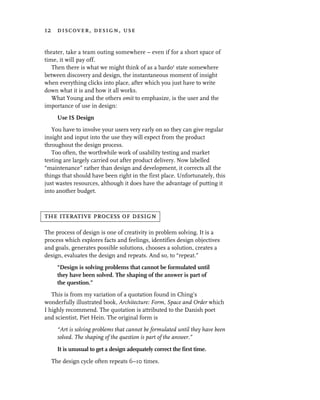
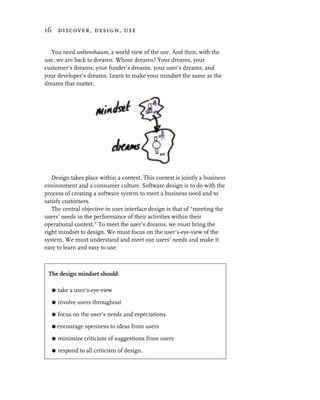
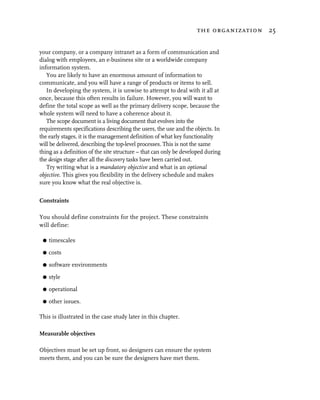
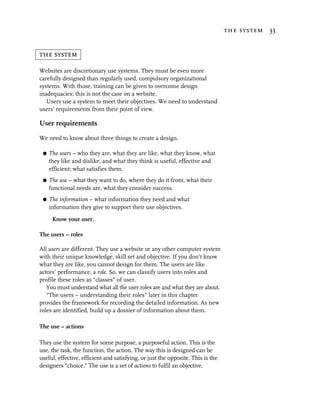
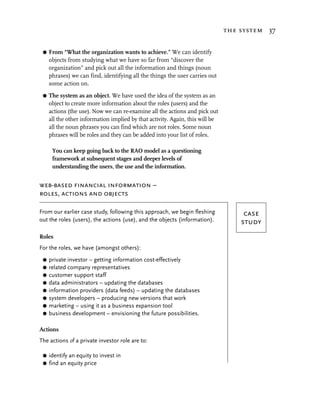
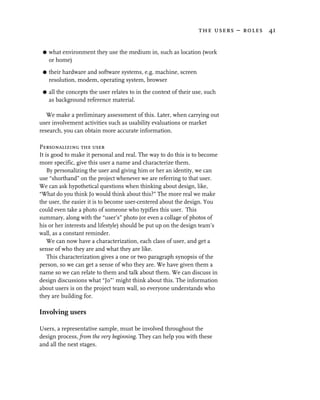
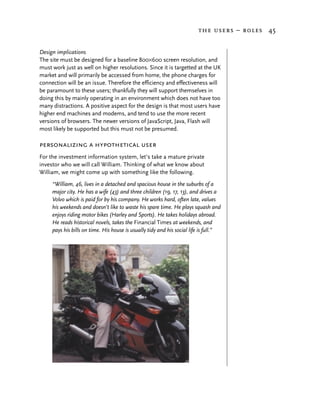
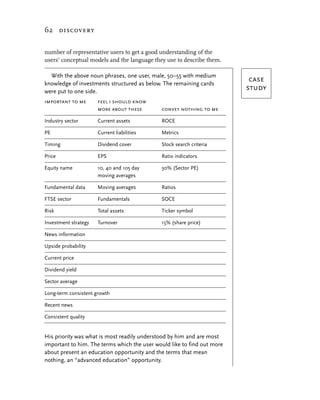
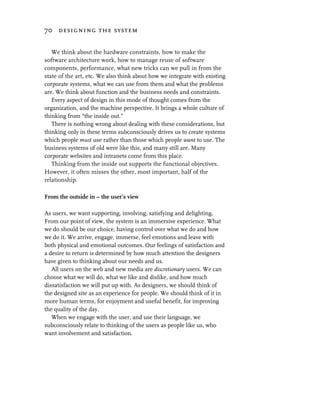
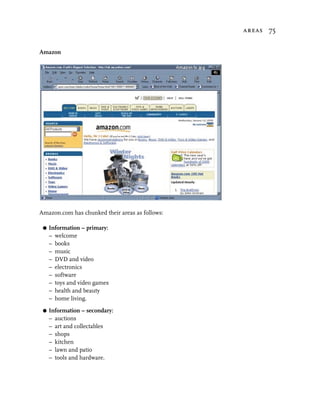
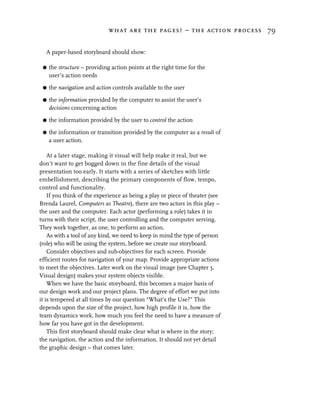
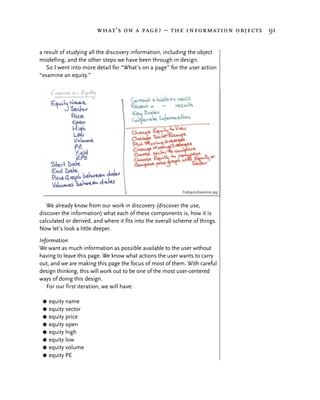
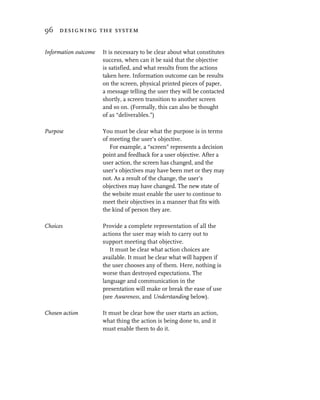
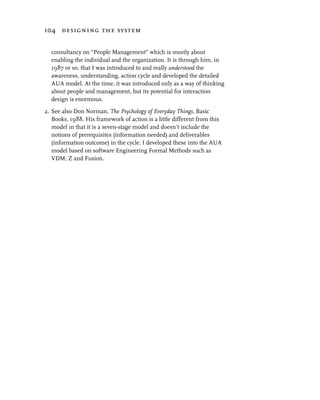
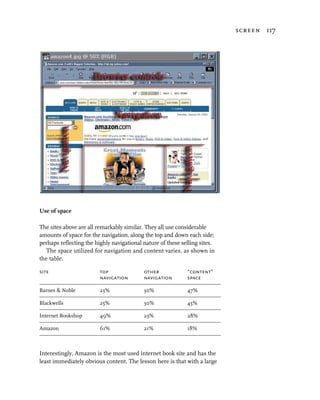
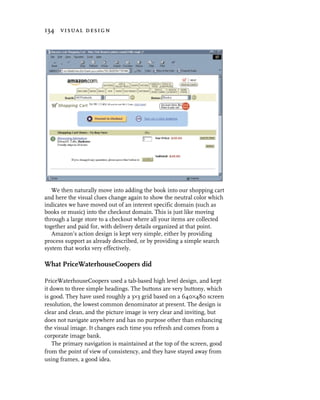
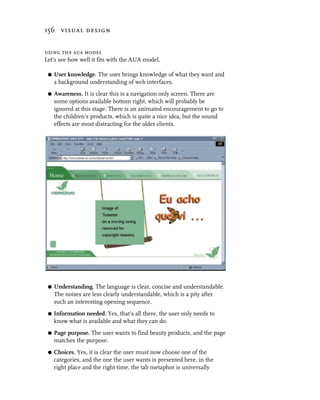
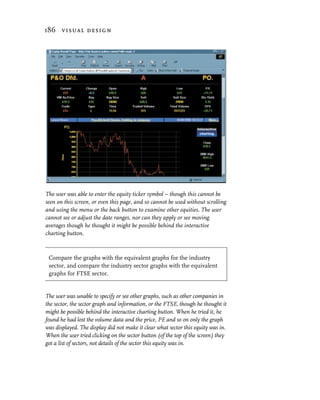
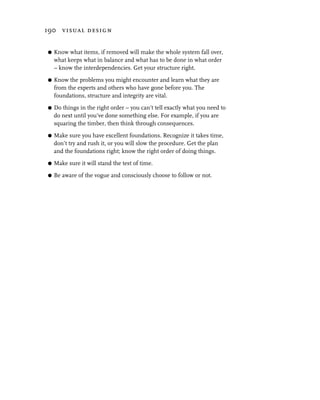
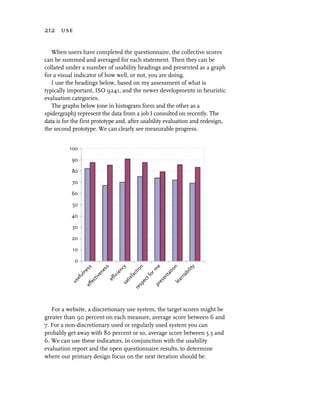
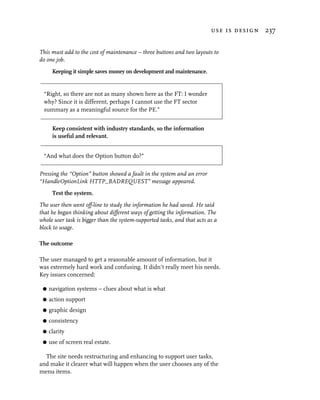
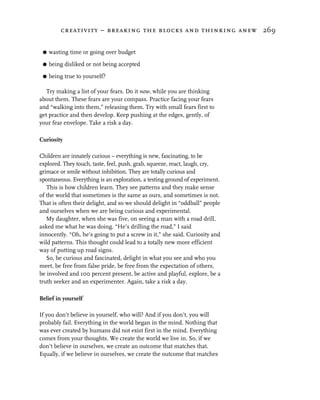
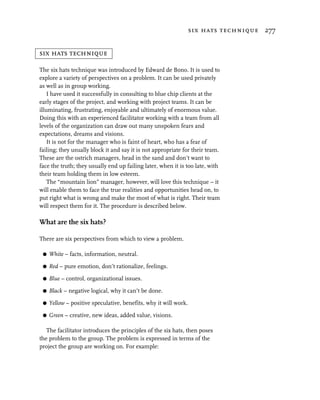
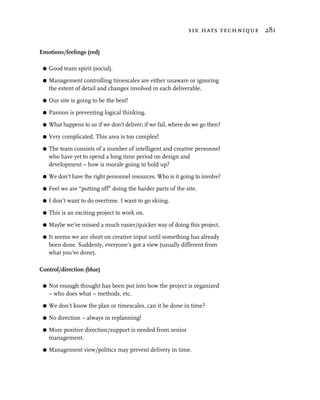
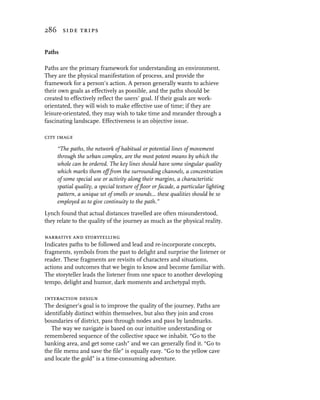
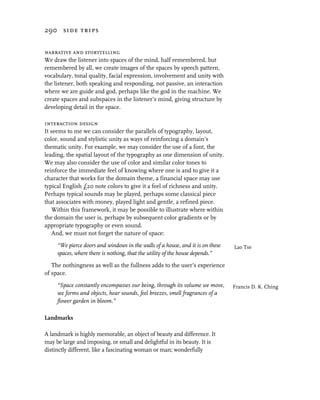
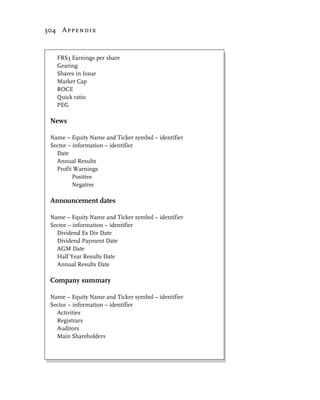
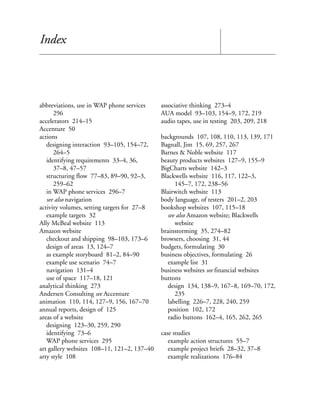
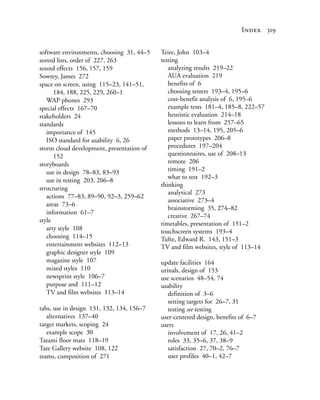
G identify by [name]
G Auto update [off].
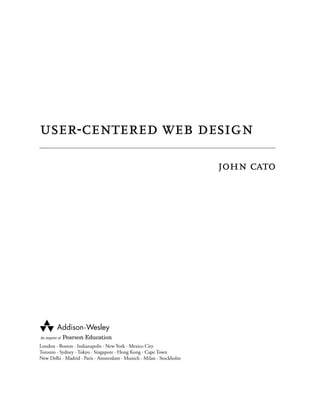
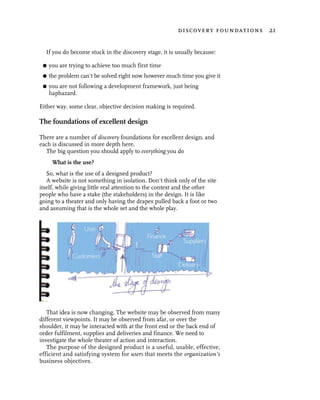
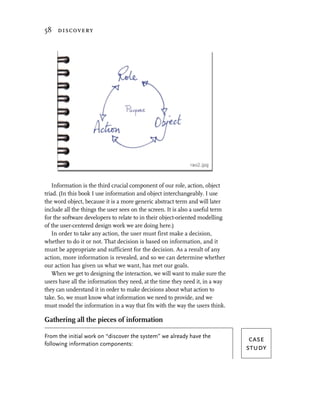
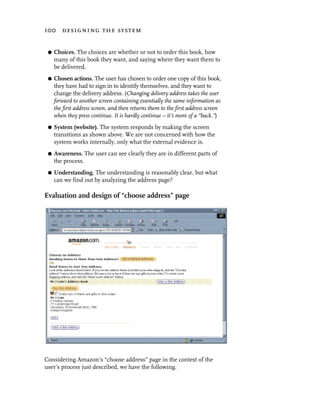
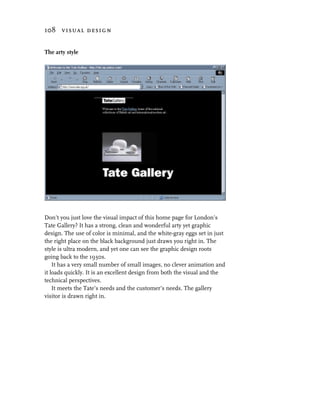
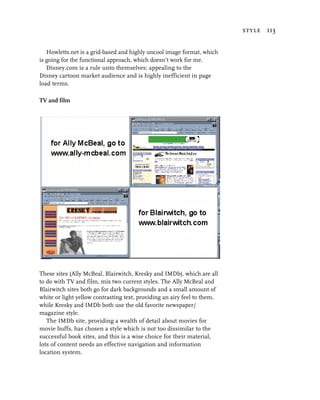
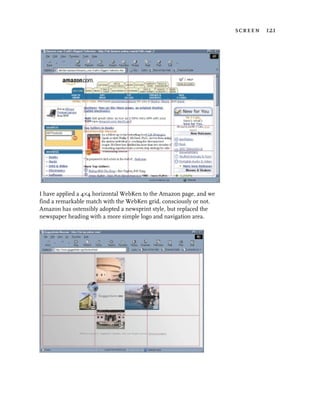
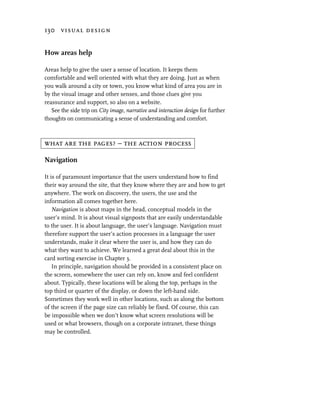
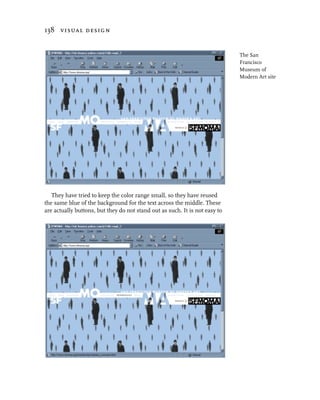
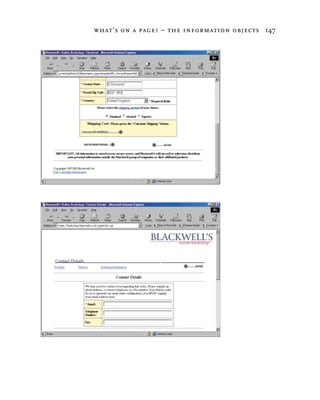
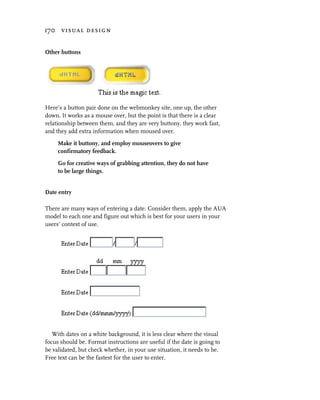
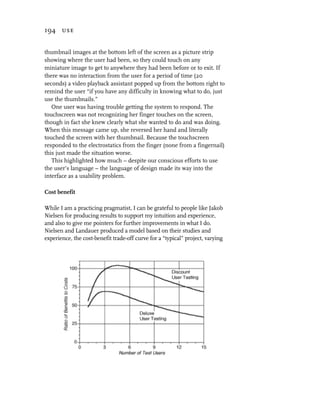
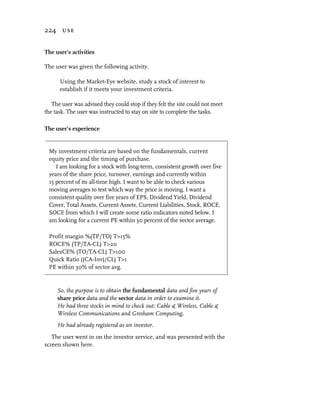
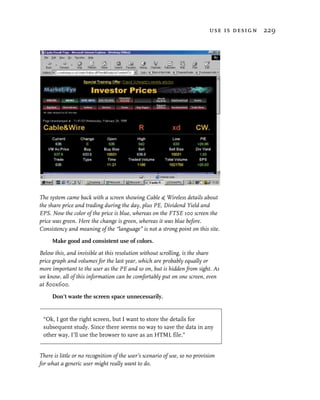
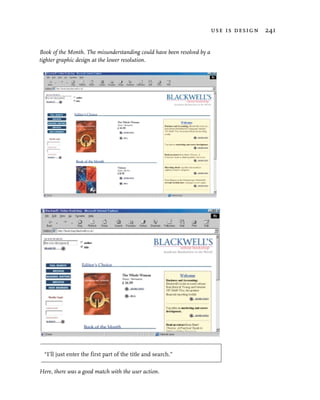
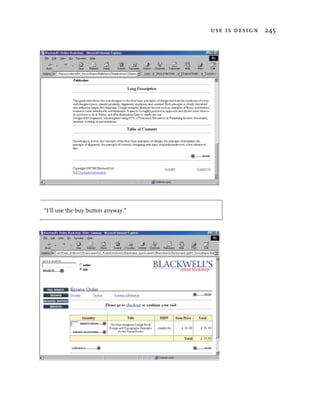
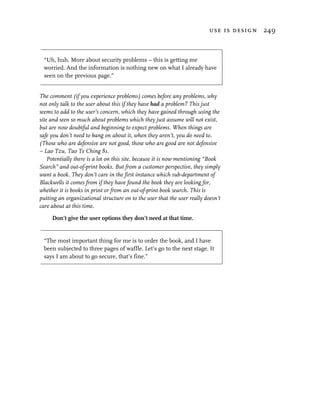
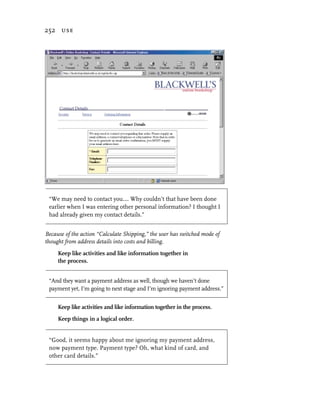
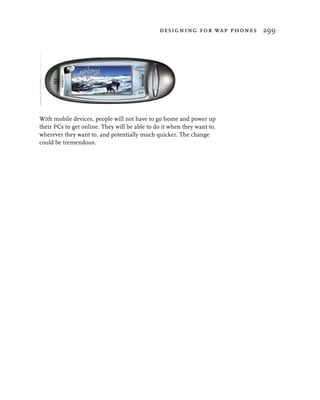
As we can see, the headings of the choices are mixed leading letter
upper case or lower case.
Lesson: be consistent, unless you are trying to draw attention
to something – then create a discord.
Some questions raised in interaction design
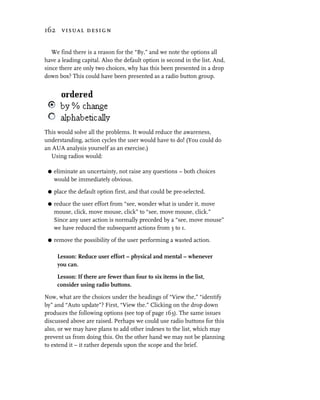
Let’s take the choices the user has of:
G ordered [By % change]
G identify by [name]
The first has the “By” in the box and it has a leading capital letter,
the second has the “by” as the heading and is all lower case. This is
another inconsistency perhaps?
We might question why this is; perhaps the “ordered” box has some
option in it which is not “By” something? However, the user cannot tell
without clicking on the drop down, so to find out they must use an
extra mouse click. It might not sound like much, but it is when taken
in conjunction with other things.
Lesson: Don’t raise questions for no reason, unless there is
absolutely no way to design it any other way.
Lesson: Don’t put a question in the user’s mind, without
making it easy to answer. Any “question” on the screen must
provide an easy way for the user to find an answer.
Lesson: Aim to reduce user effort to the minimum.
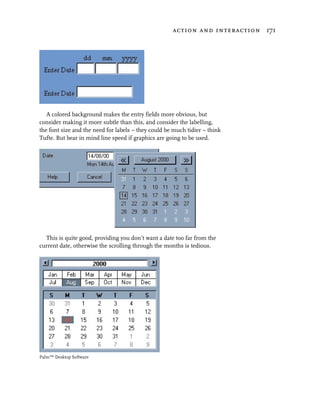
Clicking on the “ordered” drop down produces the following figure:](https://image.slidesharecdn.com/0201398605-user-centered-web-design-9780201398601-33994-090729141451-phpapp02/85/0201398605-User-Centered-Web-Design-9780201398601-33994-176-320.jpg)
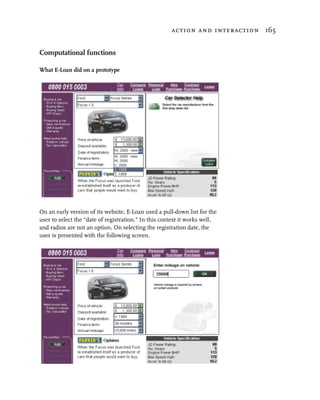


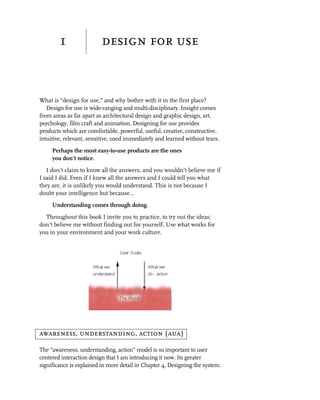
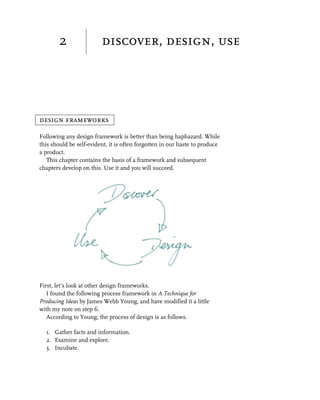
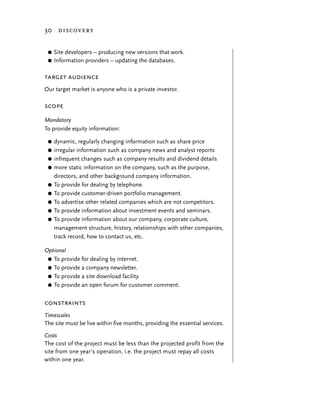
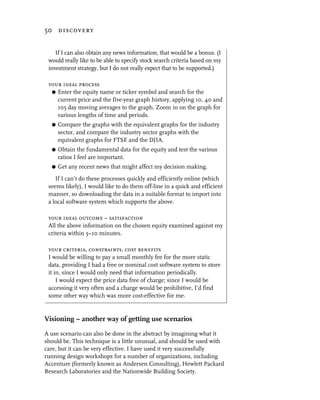
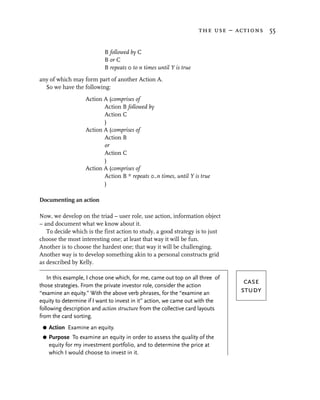
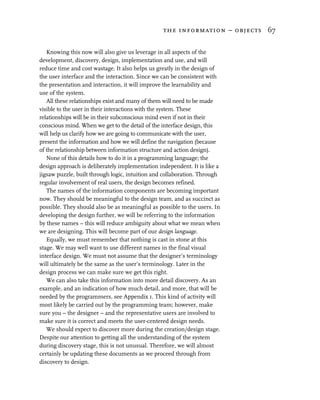
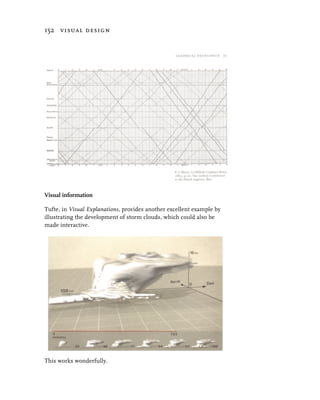
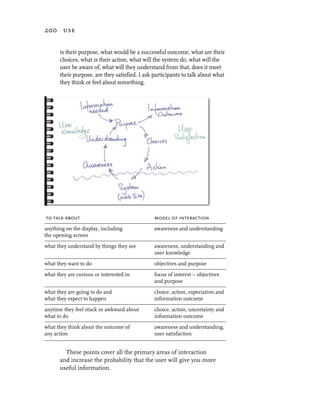
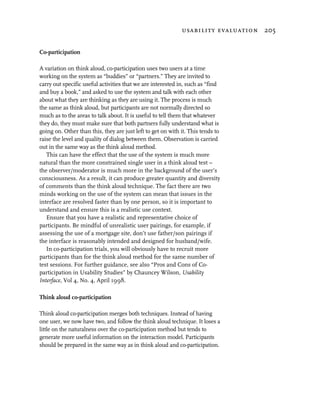
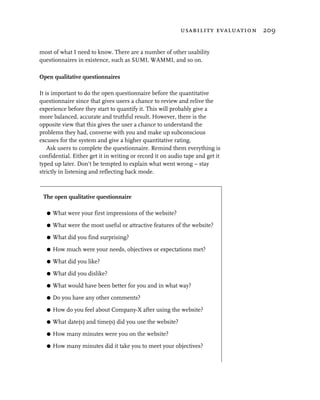
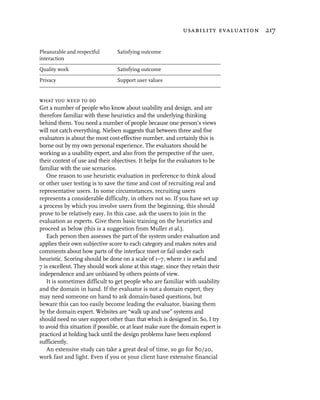
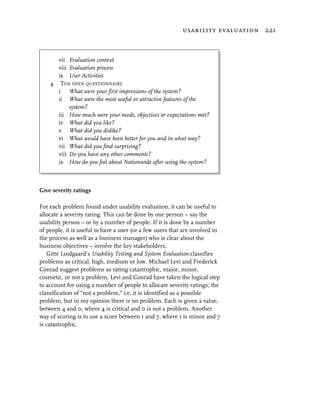
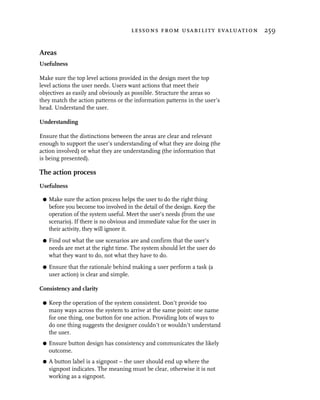
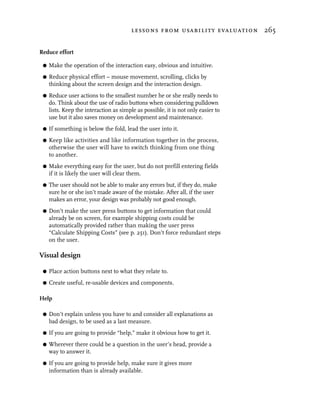
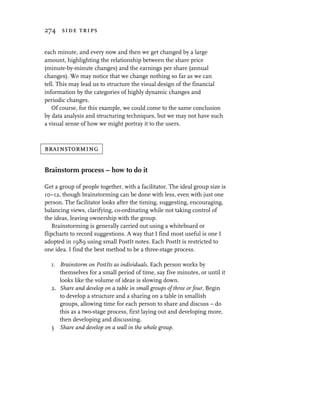
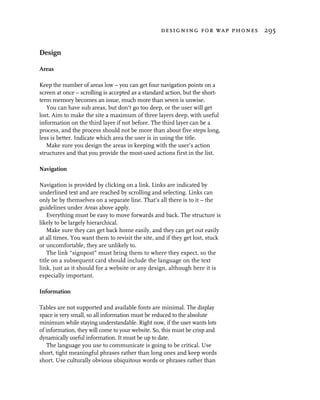
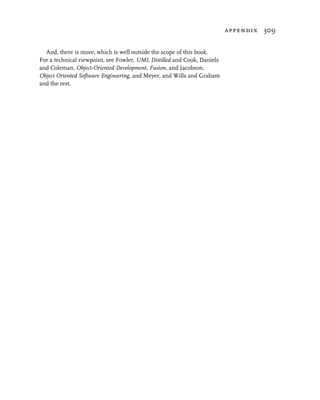
![realization – making it work 183
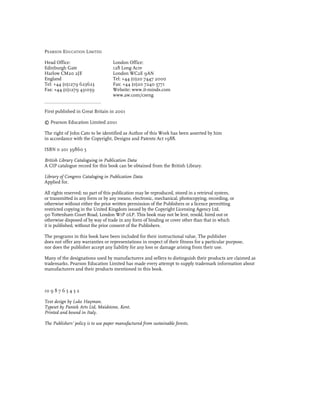
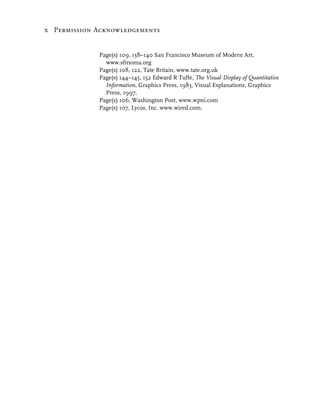
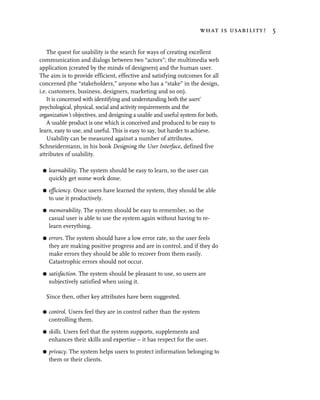
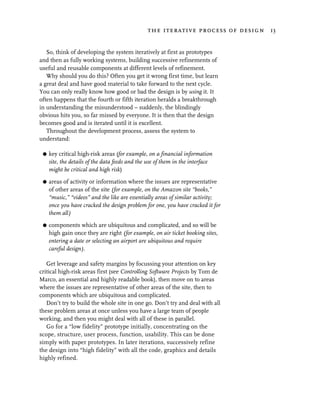
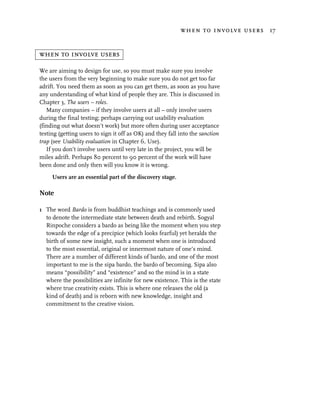
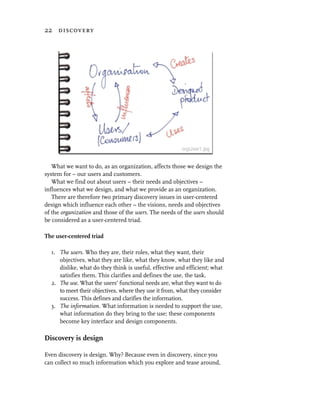
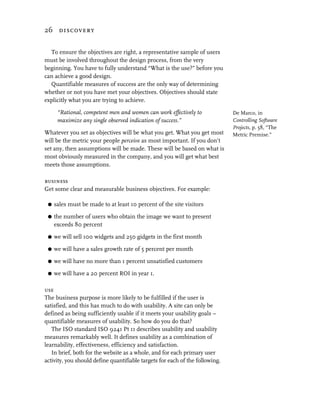
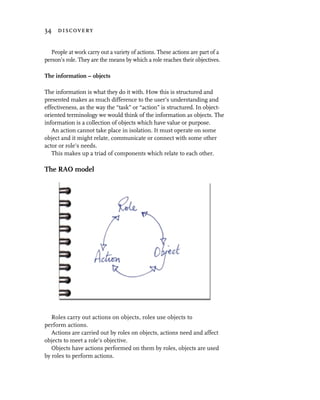
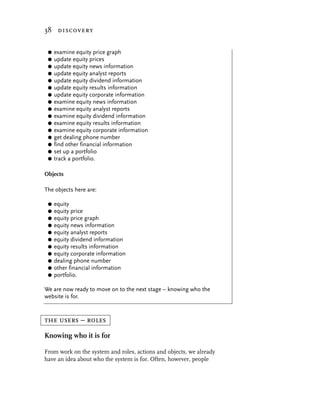
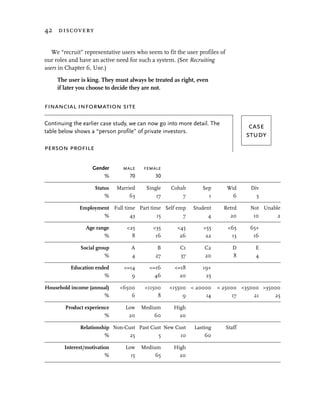
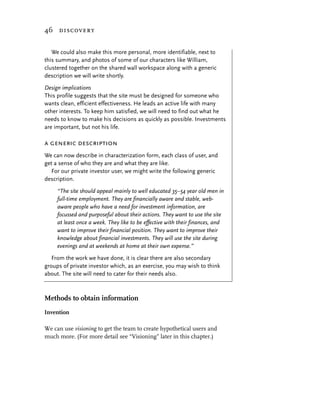
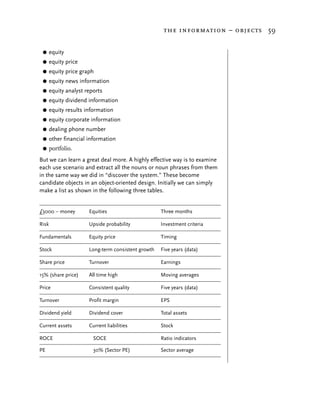
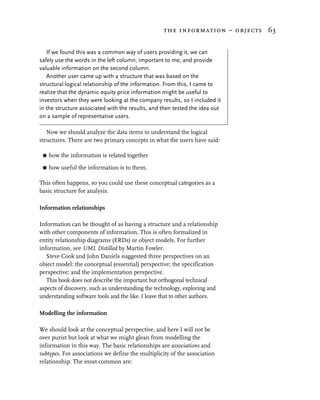
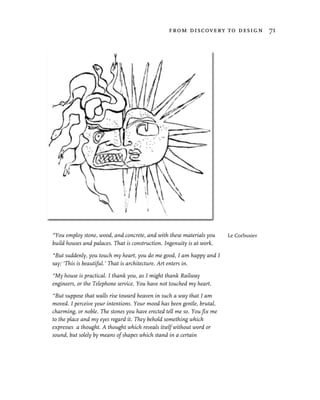
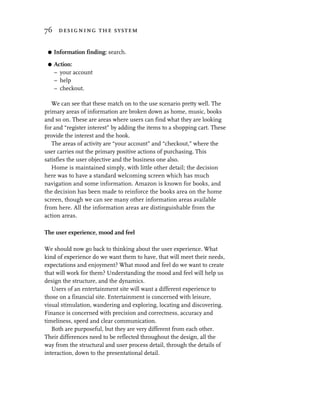
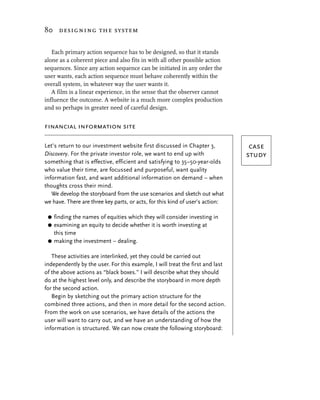
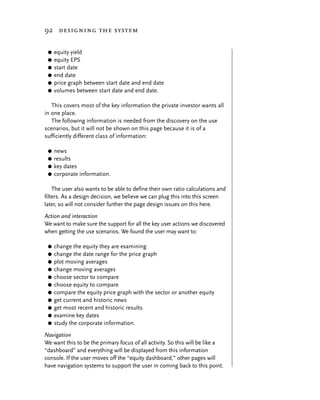
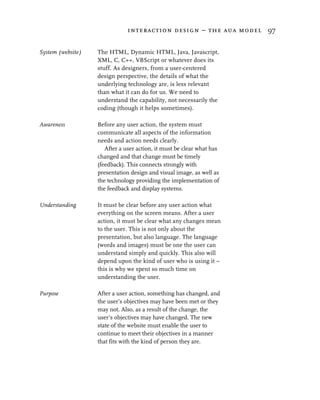
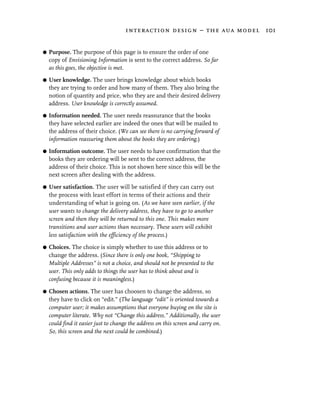
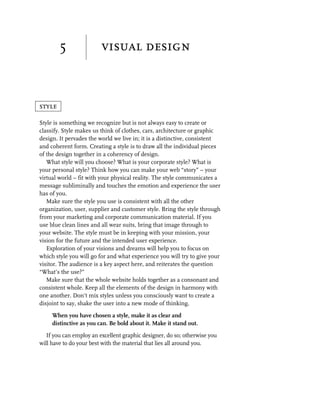
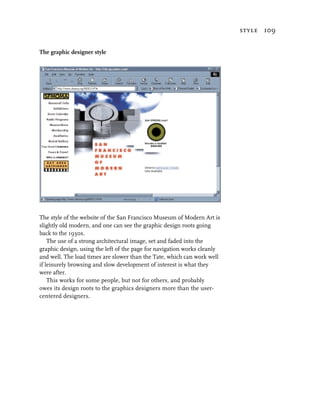
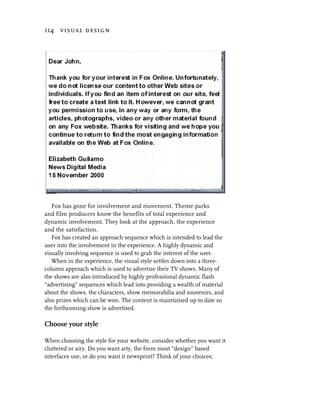
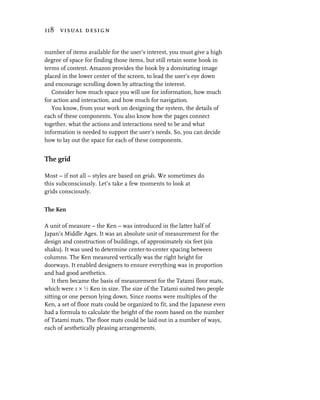
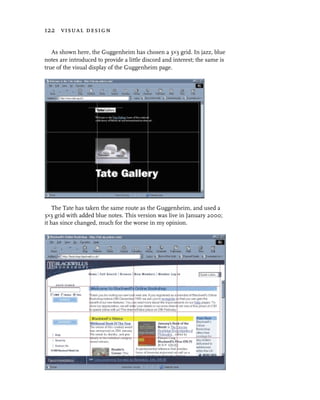
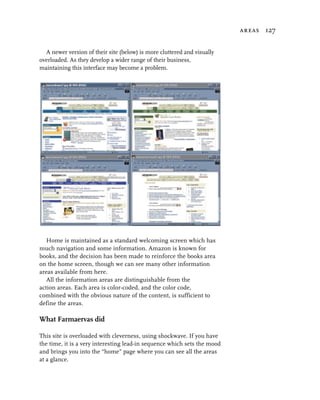
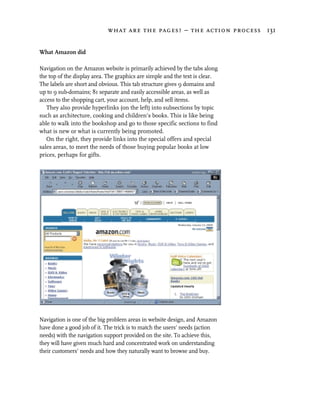
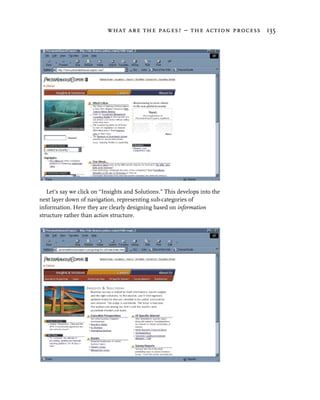
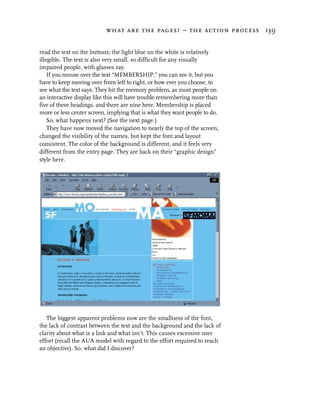
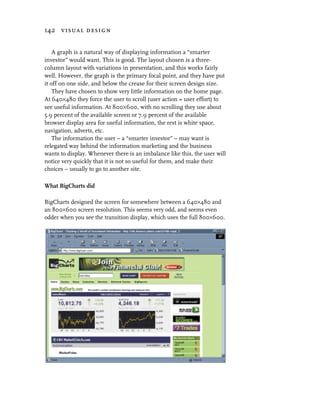
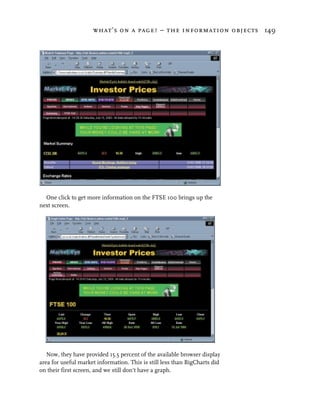
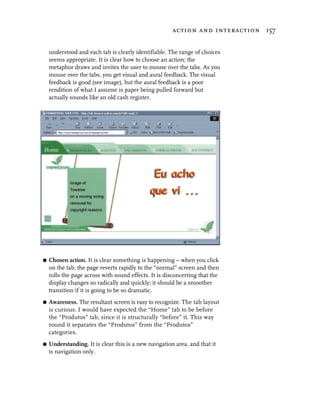
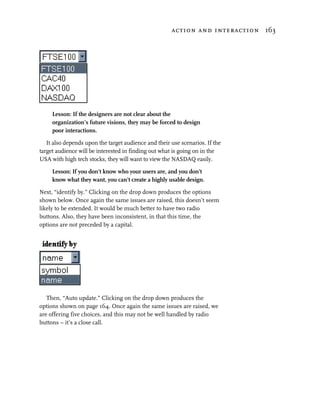
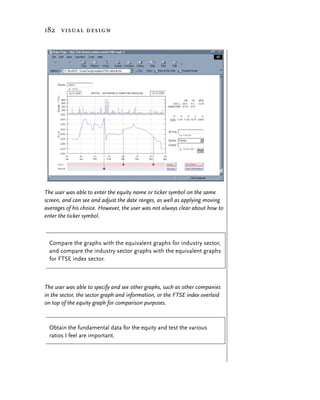
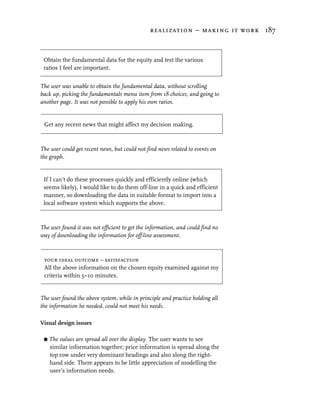
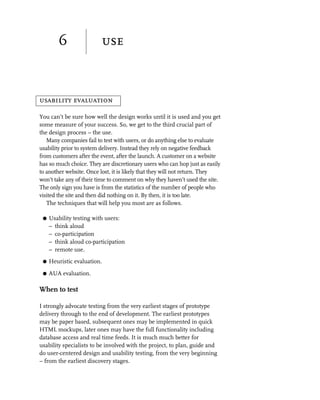
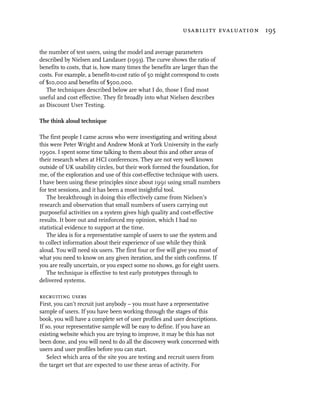
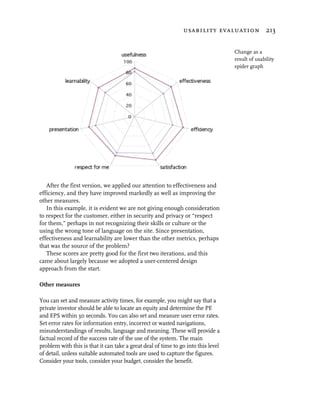
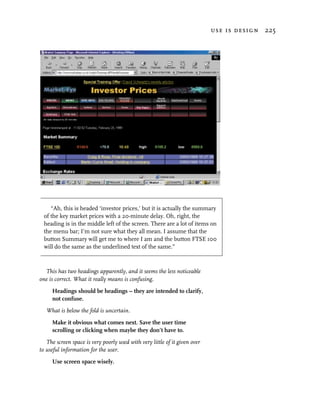
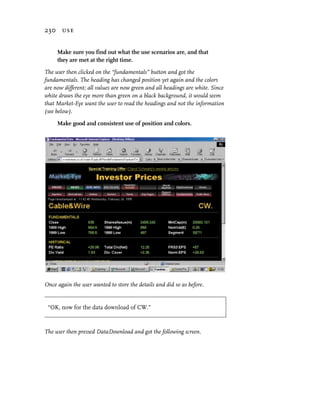
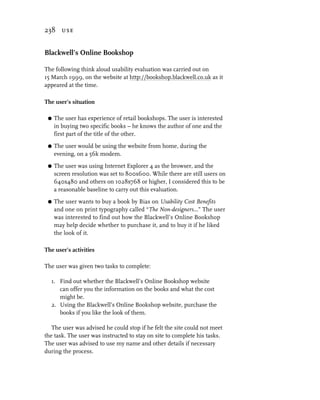
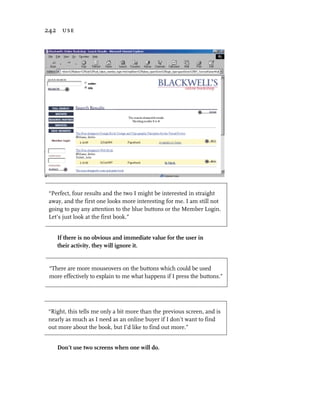
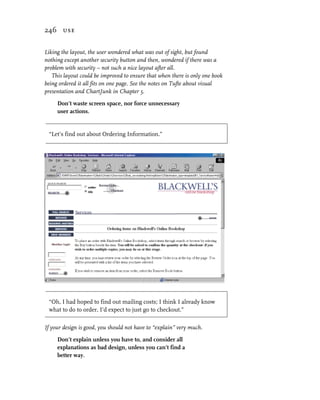
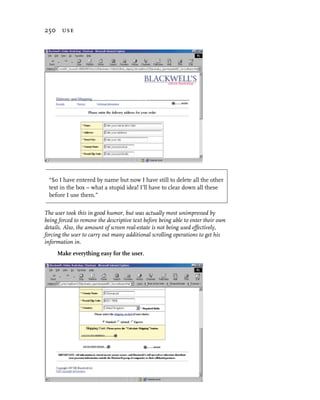
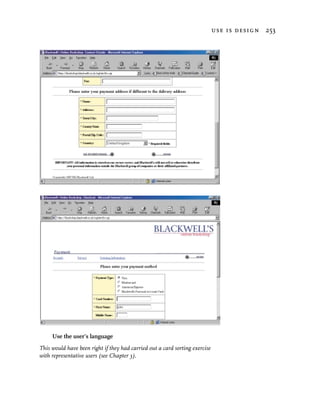
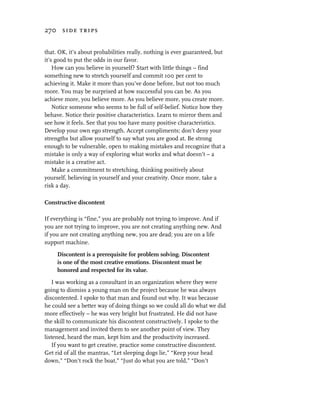
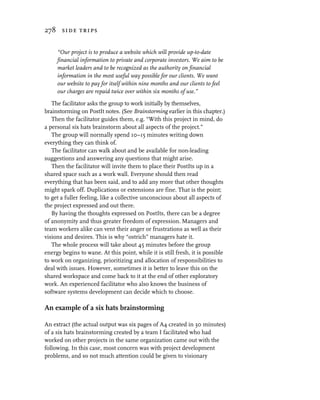
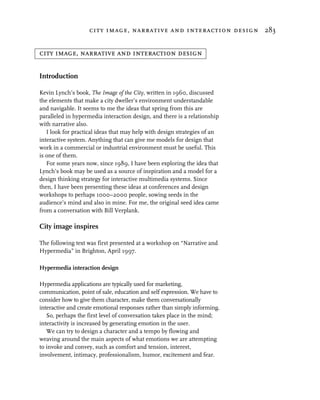
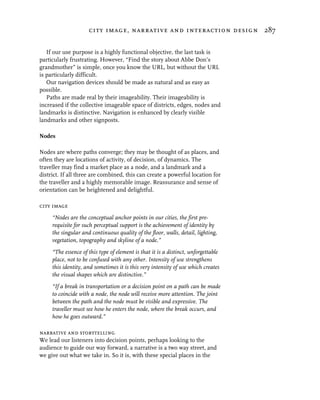
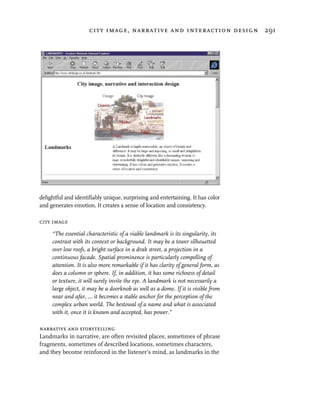
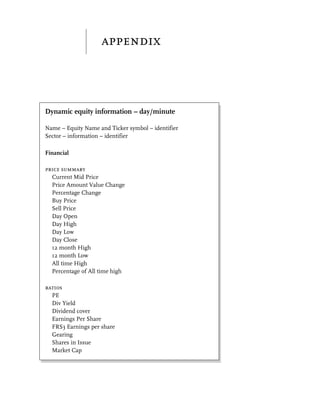
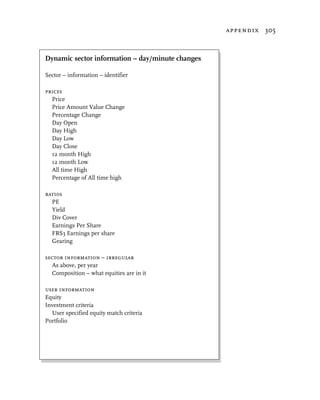
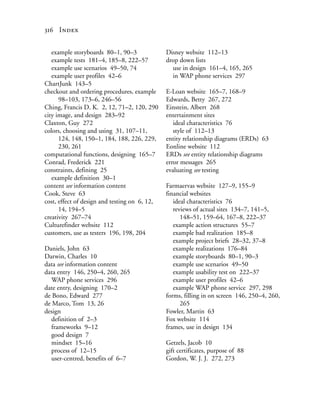
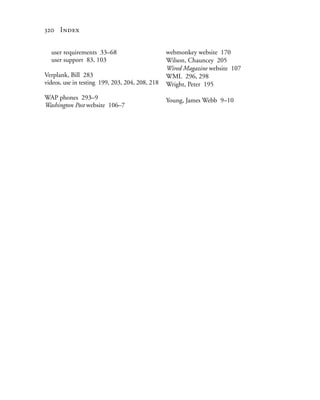
The user was able to obtain the fundamental data (Results), and apply or
examine any financial ratios. He could do this by clicking on the button
[Results] or the pointer to get a specific date’s information.
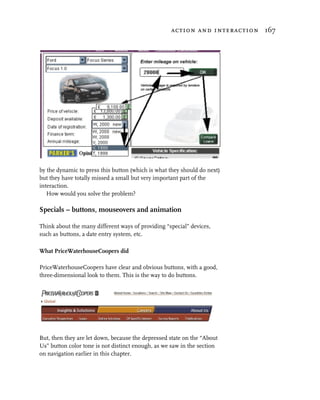
Get any recent news that might affect my decision making.
The user was able to obtain any recent news, and additionally see graphically
when those events took place. As with the results, he could also do this by
clicking on the pointer to the news event. He liked this a lot. He also liked
being able to get the key dates quickly.
If I can’t do these processes quickly and efficiently online (which
seems likely), I would like to do them off-line in a quick and efficient
manner, so downloading the data in a suitable format to import into
a local software system which supports the above.
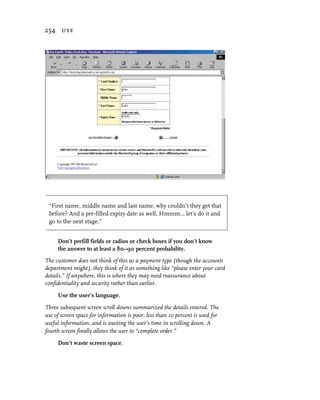
The user found it was efficient to get the information, and did not need a
way of downloading the information for off-line assessment, since it was easy
to just print the screen.
your ideal outcome – satisfaction
All the above information on the chosen equity examined against my
criteria within 5–10 minutes.
The user found the above system, easy and quick to use and met his needs.
ideas arising
Since the user could now see the information more fully, he asked if it
might be possible to provide functionality for visualizing trends and
applying stop-loss criteria.
There is still plenty of screen space to do this and the functionality could
easily be added.](https://image.slidesharecdn.com/0201398605-user-centered-web-design-9780201398601-33994-090729141451-phpapp02/85/0201398605-User-Centered-Web-Design-9780201398601-33994-198-320.jpg)


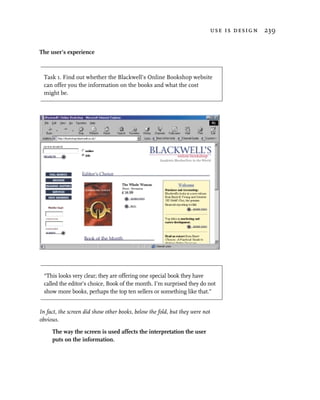


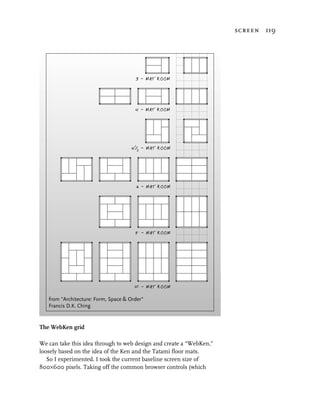
This document provides an introduction to a book about user-centered web design. It discusses how websites are for people and are a reflection of the organization that created them. The website and organization are not separate - the website conveys the style and culture of the company. Whatever design is used will have an effect on the user interacting with the website. The goal is to create a website that users will want to return to and build a relationship with the organization.


