
![[예정 매입 금액] 임의 작성
알기컨 >
tacac.co.kr
공지사항
-11% -5% -4%
8%
-8%
-42%
37%
21%
-127%
57%
-21%
14%
-108%
42%
24%
-150%
-100%
-50%
0%
50%
100%
2019.11.29 2019.12.30 2020.01.31 2020.02.28 2020.03.27
주가 상승 확률 증가율
A 섹터
B 섹터
최종평균
53점
47점 45점 44점
47점
44점
31점
22점
35점
44점
19점
44점42점
35점
40점
19점
33점
44점
0점
10점
20점
30점
40점
50점
60점
2019.11.01 2019.11.29 2019.12.30 2020.01.31 2020.02.28 2020.03.27
주가 상승 확률 점수
A 섹터
B 섹터
최종평균
종근당바이오
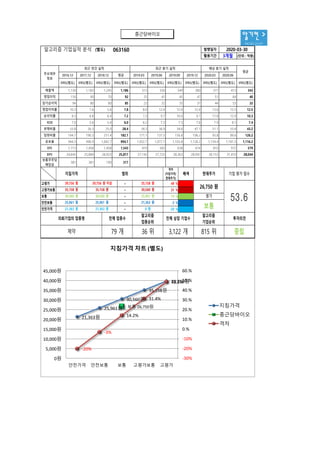
알고리즘 주식매매 전략서 (별도) 063160 발행일자
활용기간
격차
(지침가격/
현재주가)
배색
2020-03-30
3개월
63.5 중립 5,000,000 원
추천 매입 금액 2,368,969 원 추천 매입 주식수 89 주
지침가격 범위 매수 / 매도 매수 / 매도 주식수
고평가 39,756 원 39,756 원 이상 ~
현재주가 평가 주가 상승 확률 점수 투자의견 예정 매입 금액
26,750 원 보통
35,158 원 49 % -1,151,832 원 -29 주
고평가보통 35,158 원 35,158 원 ~ 30,560 원 31 % -744,609 원 -21 주
보통 30,560 원 30,560 원 ~ 25,961 원 14 % -337,386 원 -11 주
안전보통 25,961 원 25,961 원 ~ 21,363 원 -3 % 69,837 원 3 주
477,061 원 22 주안전가격 21,363 원 21,363 원 ~ 0 원 -20 %
41.7 점 34.5 점 39.9 점 19.2 점 33.3 점 44.1 점
44.0 점
63.5
최종 평균
B 섹터 30.8 점 21.7 점 43.6 점 43.6 점 19.2 점 44.2 점
2019.11.01 2019.11.29 2019.12.30 2020.01.31 2020.02.28 2020.03.27 주가 상승 확률 점수
A 섹터 52.6 점 47.4 점 45.3 점 43.6 점 47.5 점
-42 %B 섹터
47.3-10 %
-8 %8 %-4 %-5 %-11 %A 섹터
최종 평균 -21 % 14 % -108 % 42 % 24 %
37 % 21 % -127 % 57 %
최종 점수최종 증가율2020.03.272020.02.282020.01.312019.12.302019.11.29](data:image/gif;base64,R0lGODlhAQABAIAAAAAAAP///yH5BAEAAAAALAAAAAABAAEAAAIBRAA7)
More Related Content
What's hot
What's hot (20)
Similar to 종근당바이오 063160 알고리즘 기업분석 보고서
Similar to 종근당바이오 063160 알고리즘 기업분석 보고서 (20)
More from 알고리즘 기업분석 컨설팅-알기컨,algikeon
More from 알고리즘 기업분석 컨설팅-알기컨,algikeon (20)
종근당바이오 063160 알고리즘 기업분석 보고서
- 1. 알기컨 > tacac.co.kr 종근당바이오 (별도) 063160 발행일자 활용기간 3개월 (단위 : 억원) 2016.12 2017.12 2018.12 평균 2019.03 2019.06 2019.09 2019.12 2020.03 2020.06 IFRS(별도) IFRS(별도) IFRS(별도) IFRS(별도) IFRS(별도) IFRS(별도) IFRS(별도) IFRS(별도) IFRS(별도) IFRS(별도) IFRS(별도) 매출액 1,130 1,182 1,245 1,186 313 330 349 380 377 413 343 영업이익 116 90 70 92 25 41 45 47 51 64 40 당기순이익 94 80 80 85 23 32 35 37 44 53 32 영업이익률 10.3 7.6 5.6 7.8 8.0 12.4 12.9 12.4 13.6 15.5 12.5 순이익률 8.3 6.8 6.4 7.2 7.3 9.7 10.0 9.7 11.8 12.9 10.3 ROE 7.0 5.6 5.4 6.0 6.2 7.3 7.5 7.6 7.9 8.1 7.4 부채비율 33.8 26.3 25.0 28.4 34.3 36.9 34.6 47.1 51.1 55.4 43.2 당좌비율 144.7 190.3 211.4 182.1 171.1 137.5 156.8 106.2 95.8 89.6 126.2 유보율 944.3 996.9 1,042.7 994.7 1,052.7 1,077.1 1,103.8 1,128.2 1,154.4 1,181.3 1,116.2 EPS 1,713 1,458 1,458 1,543 419 583 638 674 810 972 579 BPS 24,645 25,884 26,923 25,817 27,142 27,725 28,363 28,947 30,153 31,410 28,044 보통주주당 배당금 381 381 190 317 주요재무 정보 알고리즘 기업실적 분석 2020-03-30 최근 분기 실적 예상 분기 실적최근 연간 실적 평균 21,363원 25,961원 30,560원 35,158원 39,756원 보통 26,750원 -20% -3% 14.2% 31.4% 48.6% -30% -20% -10% 0.% 10.% 20.% 30.% 40.% 50.% 60.% 0원 5,000원 10,000원 15,000원 20,000원 25,000원 30,000원 35,000원 40,000원 45,000원 안전가격 안전보통 보통 고평가보통 고평가 지침가격 차트 (별도) 지침가격 종근당바이오 격차 격차 (지침가격/ 현재주가) 배색 고평가 ~ 49 % 고평가보통 ~ 31 % 보통 ~ 14 % 안전보통 ~ -3 % 안전가격 ~ -20 % 중립제약 79 개 36 위 3,122 개 815 위 의뢰기업의 업종명 전체 업종수 알고리즘 업종순위 전체 상장 기업수 알고리즘 기업순위 투자의견 기업 평가 점수 53.6 21,363 원 21,363 원 0 원 30,560 원 25,961 원 30,560 원 25,961 원 보통 25,961 원 21,363 원 평가 30,560 원 지침가격 39,756 원 35,158 원 범위 39,756 원 이상 35,158 원 35,158 원 현재주가 26,750 원
- 2. [예정 매입 금액] 임의 작성 알기컨 > tacac.co.kr 공지사항 -11% -5% -4% 8% -8% -42% 37% 21% -127% 57% -21% 14% -108% 42% 24% -150% -100% -50% 0% 50% 100% 2019.11.29 2019.12.30 2020.01.31 2020.02.28 2020.03.27 주가 상승 확률 증가율 A 섹터 B 섹터 최종평균 53점 47점 45점 44점 47점 44점 31점 22점 35점 44점 19점 44점42점 35점 40점 19점 33점 44점 0점 10점 20점 30점 40점 50점 60점 2019.11.01 2019.11.29 2019.12.30 2020.01.31 2020.02.28 2020.03.27 주가 상승 확률 점수 A 섹터 B 섹터 최종평균 종근당바이오 알고리즘 주식매매 전략서 (별도) 063160 발행일자 활용기간 격차 (지침가격/ 현재주가) 배색 2020-03-30 3개월 63.5 중립 5,000,000 원 추천 매입 금액 2,368,969 원 추천 매입 주식수 89 주 지침가격 범위 매수 / 매도 매수 / 매도 주식수 고평가 39,756 원 39,756 원 이상 ~ 현재주가 평가 주가 상승 확률 점수 투자의견 예정 매입 금액 26,750 원 보통 35,158 원 49 % -1,151,832 원 -29 주 고평가보통 35,158 원 35,158 원 ~ 30,560 원 31 % -744,609 원 -21 주 보통 30,560 원 30,560 원 ~ 25,961 원 14 % -337,386 원 -11 주 안전보통 25,961 원 25,961 원 ~ 21,363 원 -3 % 69,837 원 3 주 477,061 원 22 주안전가격 21,363 원 21,363 원 ~ 0 원 -20 % 41.7 점 34.5 점 39.9 점 19.2 점 33.3 점 44.1 점 44.0 점 63.5 최종 평균 B 섹터 30.8 점 21.7 점 43.6 점 43.6 점 19.2 점 44.2 점 2019.11.01 2019.11.29 2019.12.30 2020.01.31 2020.02.28 2020.03.27 주가 상승 확률 점수 A 섹터 52.6 점 47.4 점 45.3 점 43.6 점 47.5 점 -42 %B 섹터 47.3-10 % -8 %8 %-4 %-5 %-11 %A 섹터 최종 평균 -21 % 14 % -108 % 42 % 24 % 37 % 21 % -127 % 57 % 최종 점수최종 증가율2020.03.272020.02.282020.01.312019.12.302019.11.29
- 3. 알기컨 > tacac.co.kr 정보와 완전 정보 결 투자판단 있습니 위배 무단으 숙지하 공지사항 (compliance notice) ① 알고리즘 기업분석 컨설팅에서 제공하는 정보는 신뢰할 만한 자료 및 정보와 알고리즘 기업분석 프로그램(TACAP)을 통해 얻어진 것이나 그 정확성이나 완전 성을 보장 할 수 없으며, 시간이 경과함에 따라 변경될 수 있습니다. 따라서 정보 의 오류,누락에 대하여 알고리즘 기업분석 컨설팅에서 제공하는 자료의 대한 결 과에 대해 법적인 책임을 지지 않습니다. ② 알고리즘 기업분석 컨설팅 및 본 사이트에서 제공하는 모든 정보는 투자판단 의 참고자료이며, 투자의 최종 책임은 본 정보를 이용하시는 이용자에게 있습니 다. ③ 알고리즘 기업분석 컨설팅 및 본 사이트에서는 일임매매 등 관련법규에 위배 되는 행위는 일체 하지 않습니다. ④ 이용자는 알고리즘 기업분석 컨설팅 및 본 사이트에서 제공한 정보를 무단으 로 재배포 및 재활용 할 수 없습니다. ⑤ 알고리즘 기업분석 보고서의 정확성을 높이기 위해 활용기간을 필히 숙지하 시길 바랍니다. ① Consulting is o The Algorithm accuracy or com change over tim results of the d Consulting bec ② information pr investment dec up ③ do anything th transaction. ④ The Algorithm information pr ⑤ analysis report Tel : 070 - 4667 - 5009 Email : tacac@tacac.co.kr Homepage : tacac.co.kr Blog : tacac.blog.me SERVICES M&A,IPO,리커버,구조조정,기술경영,경영전략,가족기업 컨설팅신청 : http://tacac.co.kr/?page_id=1374