
Recommended
Recommended
More Related Content
Similar to Challenges to Balance of Payments Data Collection and its effect.docx
Similar to Challenges to Balance of Payments Data Collection and its effect.docx (20)
More from sleeperharwell
More from sleeperharwell (20)
Recently uploaded
Recently uploaded (20)
Challenges to Balance of Payments Data Collection and its effect.docx
- 1. Challenges to Balance of Payments Data Collection and its effect on International Business By Student’s Name Institution Date Overview Introduction Literature Review Data Presentation The Theory Data Analysis Conclusion Hello everyone, Today I am going to make a presentation on my topic which was Challenges to Balance of Payments Data Collection and its effect on International Business. After making a brief introduction, I will guide you through my literature review. Data presentation, theory used, analysis based on this theory and finally provide my conclusions and recommendations. Enjoy. 2 Introduction Increase in trade between countries due to globalization Economic and political differences in these countries mean
- 2. differences in ability to do business cc Bop used to indicate all transactions (monetary and economic) between two or more countries Globalization has resulted to an increase in trade between countries irrespective of geographical location. However, given the economic and political differences in these countries, then the monetary and economic transactions made between the countries during the entire process becomes different. The BoP is a statement of all transactions (monetary and economic) between two or more countries during a specific period of time (Stern, 2017). All transactions have to be recorded for purposes of monitoring the financial activities between countries. 3 Introduction Cont. The bop is used to account for all transactions made by a country over a specific period of time, recorded in three separate accounts; Current account The capital account The financial account Challenges addressed include Errors And Omissions (Statistical Discrepancies), Fluctuating Exchange Rates Change In The Value Of Money And Other Accounting Conventions According to the Federal Reserve Bank of New York, the BoP is used to account for all transactions made by a country over a specific period of time, recorded in three separate accounts. These are the current account, the capital account, and the financial account (Scitovsky, 2016). Understanding how the balance of payments works in a country is critical to keeping
- 3. the right kind of records. However, challenges to the collection of data on balance of payments oftentimes result from the problems of BoP. For instance, a country will be unwilling to release data that indicates how badly the economy is in a BoP disequilibrium. Others include errors, and omissions (statistical discrepancies), fluctuating exchange rates, change in the value of money and other accounting conventions (Kyle, 2015). 4 Literature review Razmi (2015) Fávaro, Da Silva & Pirtouscheg (2016) Bouchet, Fishkin & Goguel (2018) Des Roches & Betancourt (2016) Ko & Ha (2018) Edmond, Midrigan & Xu, (2015) A number of studies have been used to illustrate how BOP affects the ability of countries to do business. This sudy analyzed just but a few including the following; Razmi (2015) Fávaro, Da Silva & Pirtouscheg (2016) Bouchet, Fishkin & Goguel (2018) Des Roches & Betancourt (2016) Ko & Ha (2018) Edmond, Midrigan & Xu, (2015) 5 Data Presentation BoP = CuA+CA+FA-NeO Where BoP=Balance of Payment CuA=Current Account
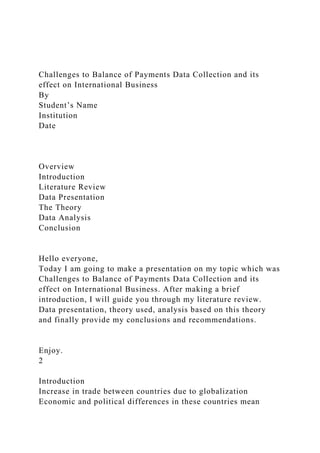
- 4. CA=Capital Account NeO=Net Error Omissions In order to illustrate the challenges in Balance of Payments Data Collection and its effect on International Business, this study collected the available data on the current account, capital account, financial account and the net errors omissions from trade between USA and China. Their balance of payment was then calculated using the following formula; 6 Data Presentation Cont. YearQuarterCurrent account (excludes reserves and related items)Capital account (excludes reserves and related items)Financial account (excludes reserves and related items)Net errors and omissions2017Q1-84840-1- 5416330437.06Q2-1339160-11532818738.66Q3-11419024787- 101682-12340.65Q4-116191-40-5900155686.679392018Q1- 93794-2-144647-50857.66Q2-118290-5-148497-27121.10Q3- 138602562-24450113411.76 Available fata data on the current account, capital account, financial account and the net errors omissions from trade between USA and China as recorded in the IMF is as indicated in the slide above. 7 Data Presentation Cont. A visual presentation of this data is included in the bar graphs below; The first figure presents the balance of payments data calculated
- 5. from the available CuA, CA, FA and NeO. A negative value indicates that there was a deficit. The second figure provides the data for the CA, CuA, FA and NeO in graphic. 8 BOP BOP 2017Q1 2017Q2 2017Q3 2017Q4 2018Q1 2018Q2 2018Q3 -169441.06476675376 -267982.66425245028 -178744.34818779078 -230918.67938600294 - 187585.33703370698 -239670.89715554664 - 275901.76326971489 Current account (excludes reserves and related items) 2017Q1 2017Q2 2017Q3 2017Q4 2018Q1 2018Q2 2018Q3 -84840 -133916 -114190 -116191 -93794 - 118290 -138602 Capital account (excludes reserves and related items) 2017Q1 2017Q2 2017Q3 2017Q4 2018Q1 2018Q2 2018Q3 -1 0 24787 -40 -2 -5 562 Financial account (excludes reserves and related items) 2017Q1 2017Q2 2017Q3 2017Q4 2018Q1 2018Q2 2018Q3 -54163 -115328 -101682 - 59001.000000000007 -144647 -148497 -24450 Net errors and omissions 2017Q1 2017Q2 2017Q3 2017Q4 2018Q1 2018Q2 2018Q3 30437.064766753752 18738.6642524503 -12340.651812209237 55686.679386002928 -50857.662966293028 - 27121.102844453355 113411.76326971492 The Balance of Payment Theory
- 6. Exchange rate of a particular country affects the position of the balance of payments. Unfavorable balance of payments causes a depreciation of the external value Favorable balance of payments leads to an appreciation in the external value of the currency of the country This theory asserts that the exchange rate of a particular country affects the position of the balance of payments. Indeed, a favorable balance of payments leads to an appreciation in the external value of the currency of the country while an unfavorable balance of payments causes a depreciation of the external value. Challenges in the collection of this data arise when these exchange rates are fluctuating so much, or when there are irregularities when coming up with the exchange rates themselves, which are determined by the current account and financial account. 9 Data AnalysisRegression StatisticsMultiple R1R Square1Adjusted R Square1Standard Error6.76652E- 12Observations7dfSSMSFSignificance FRegression41122745650428068641266.13043E+311.63121E- 32Residual29.15715E-234.57857E- 23Total611227456504CoefficientsStandard Errort StatP- valueIntercept6.54836E-112.03361E- 113.2200731910.084410704Current account 12.67639E- 153.73638E+147.16305E-30Capital account12.69809E- 153.70633E+147.27968E-30Financial account 12.58184E- 153.8732E+146.66591E-30Net errors and omissions-12.63246E- 15-3.79872E+146.92987E-30 To illustrate how a slight change might affect the balance of payment, a regression analysis was fitted to the data collected
- 7. from IMF. It is important to note that this data has no irregularities as it is assumed that IMF did not have any challenges. Therefore, the data depicts a perfect relationship between CuA, CA, FA and NeO as indicated by the regression results included in the 10 Data Analysis Cont. BoP = 6.54836E-11+CuA+CA+FA-NeO Where 6.54836E-11= coefficient which is basically 0.00. BoP=Balance of Payment CuA=Current Account CA=Capital Account NeO=Net Error Omissions From the regression table results above, with BoP as the dependent variable and Current account, Capital account, Financial account and Net errors and omissions, then the formula derived is as follows; BoP = 6.54836E-11+CuA+CA+FA-NeO Where 6.54836E-11= coefficient which is basically 0.00. BoP=Balance of Payment CuA=Current Account CA=Capital Account NeO=Net Error Omissions All the independent variables have a coefficient of 1 (with p values of 0.00), implying that when the data is collected without any issues/challenges, then the formula tallies with the formula asserted by the balance of payment theory. 11 Conclusion Having the perfect data collected over a given period of time
- 8. will always result to accurate BoP It is clear that having the perfect data collected over a given period of time will always result to accurate BoP that reflects the ability of a country to engage in international business. Data from IMF was used to affirm this claim, and a regression analysis revealed that the formula for calculating BoP as provided for by the balance of payments theory is accurate when the data has been collected in the best possible manner, given that net error omissions were considered. Challenges to the collection of balance of payments identified by this study included errors, and omissions (statistical discrepancies), fluctuating exchange rates, change in the value of money and other accounting conventions (Kyle, 2015). 12 References Des Roches, J. D. B., & Betancourt, R. G. (2016). Balance of payments and exchange rates. Chapters, 5-21. Fávaro, F. F. F., Da Silva, G. J. C., & Pirtouscheg, L. A. S. (2016). Bureaucracy, External Trade and Long-Term Growth in a Balance-of-Payments Constrained Growth Model. In Anais do XLIII Encontro Nacional de Economia [Proceedings of the 43rd Brazilian Economics Meeting] (No. 113). ANPEC-Associaà § ã o Nacional dos Centros de Pós-Graduaà § ã o em Economia [Brazilian Association of Graduate Programs in Economics]. Ko, J. H., & Ha, J. W. (2018). A Trade War between China and the United States and Its Likely Economic Impacts. Journal of Global and Area Studies (JGA), 2(2), 47-64. Kyle, J. F. (2015). The balance of payments in a monetary economy. Princeton University Press. Razmi, A. (2015). Correctly analysing the balance-of-payments constraint on growth. Cambridge Journal of Economics, 40(6),
- 9. 1581-1608. Scitovsky, T. (2016). Money and the Balance of Payments. Routledge. Stern, R. (2017). Balance of Payments: Theory and Economic Policy. Routledge. 13 THE END Any Questions? Title: Challenges to Balance of Payments Collection and the Effect on Investment Business RUBRIC 1. ASSESSMENT of PRESENTATION and DRAFT PAPER: In addition to making detailed comments on the paper itself, students should fill out the column on the Draft Paper. I will also make comments on the paper and fill out the column on the Presentation. Indicate N/A where the issue is not applicable. Issue Score (1 to 5) Comments Presentation Draft Paper Description of the topic 5
- 10. Literature review/Previous studies 5 Theory 3 Comments are provided in separate page Analysis 3 Comments are provided in separate page Economic content 3 Comments are provided in separate page Charts and Tables 3 Comments are provided in separate page Asking and answering questions 4 Comments are provided in separate page References 5 Overall assessment 3.625 Suggested rating system: 5 – Exceptional: Paper is comprehensive and structure follows
- 11. logically; theory is presented and interpreted accurately; thoroughly evaluates previous research and all references are in paper; demonstrates understanding of economic analysis, charts are clear and informative, no typos or grammatical errors, references are complete and in required format, exceptional preparation. 4 – Above average – Paper presents most of the material and follows the structure; theory presented and interpreted with satisfactory understanding; previous research evaluated but some references are missing from paper; good understanding of economic analysis, charts are clear but missing some explanation; a few typos and grammatical errors; references are nearly complete and most are in standard format, good preparation and presentation. 3 – Average – Paper presents material and follows some of the structure; theory is presented with basic interpretation; adequate literature review, some errors in economic analysis, charts are good; some typos and grammatical errors; some references and not all are in standard format, well prepared. 2 – Below average – Paper shows basic economic analysis and follows structure; theory presented but without interpretation, literature review is minimal; many errors in economic analysis; charts are adequate; many typos and grammatical errors; few references and not in standard format, some preparation is lacking 1 – Insufficient – Paper does not present an economic argument and doesn’t follow the assigned structure, theory is not presented, there is no review of literature, flawed economic analysis, charts are not clear and/or missing, numerous typos, few or no references and not in standard format, clear neglect in conducting the project. 1 Comments
- 12. Your topic is very relevant and you explored relevant bibliography. However, you have work to do on your empirical analysis. My comments are as follows: · You provide sufficient explanations on why the issue you address is important. However, you should be clearer on the questions you would like to address. The title of your paper refers to effects on international business, but your empirical analysis does not show any work in this area. · You should be more specific on how your paper extends the body of knowledge. · My major concern is on your empirical analysis. Your regression is not meaningful because you are estimating an identity. A possibility is for you to focus on identifying, quantifying, and explaining the statistical discrepancies in the BOP of China and the US. You could look at the following sources for guidance: · https://www.imf.org/external/pubs/ft/bop/2016/pdf/16-12.pdf · https://www.federalreserve.gov/pubs/ifdp/2000/678/ifdp678.pdf · https://economic-research.bnpparibas.com/html/en-US/China- external-accounts- transition-7/23/2015,25853 · https://rhg.com/research/foreign-investment-in-china-a-tale- of-two-statistics/ Another possibility is for you to focus on discrepancies in bilateral transactions between China and the US. To my knowledge, given limitations in available data, you would need to focus on discrepancies in trade data, using data from the IMF Direction of Trade Statistics. You could compare, for instance, exports from China to the USA with imports from China by the USA and identify and quantify discrepancies. The following sources could be useful: o http://data.imf.org/?sk=9D6028D4-F14A-464C-A2F2- 59B2CD424B85
- 13. · http://datahelp.imf.org/knowledgebase/articles/484353-why- do-the-exports-of- country-a-to-country-b-not-e · https://www.gfintegrity.org/are-bilateral-trade-statistics- unreliable/ · In presenting your empirical results, you should describe your variables and the significance of your results. In the text, you should provide an intuitive explanation of your results and provide technical details in an annex (or refer to bibliography that provide such technical details on the empirical techniques). · You should identify in your concluding section possible areas for future research. The comments from the professor when you upload the literature review and present to class please provide more specifics on the issues you plan to assess (for instance, would you focus on explaining statistical discrepancies in the balance of payments of specific countries? which ones? would you look into the global discrepancy?). Also, provide more specifics on how you will structure your analysis and the sources of data you plan to use. Paper requiment: Your applied international economics paper should have the following sections: 1. An introduction that presents your issue and why this issue is important. Your introduction should be explicit and be clear about the issue you are addressing/question you are answering. 2. A brief analysis of previous work on the topic and a discussion of how your paper extends this body of knowledge.
- 14. Note that this section will be a summary of the full literature review and analysis you conducted. 3. At least three charts/tables/diagrams that provide a good visual picture of your data. 4. A description of the theory that applies to your question. This section should include a few mathematical equations that illustrate your theory and/or model. 5. A discussion of the data that you would use in an empirical analysis and an econometric specification, including a description of variables, why they belong in your model and the impact you expect the dependent variables to have on your independent variable. 6. A brief conclusion that summarizes what you learned and possible areas for future research. The two rubrics is attached below.