The document provides instructions for an experiment to generate 4 graphs by toggling the values of m and c in the linear equation y=mx+c. For each graph, the student is asked to record the equation, sketch the graph, press F9 to generate 2 ordered pairs, calculate the gradient using those pairs, and complete a table with the equation parameters and gradient calculation. Finally, the student is asked to state what m and c represent in the linear equation.
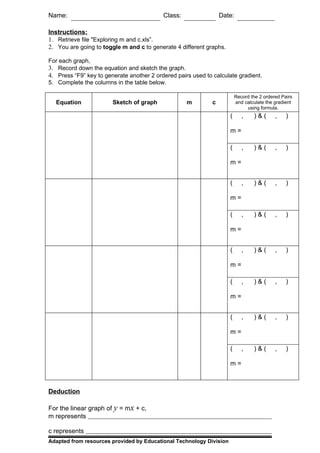
1. Name: Class: Date:
Instructions:
1. Retrieve file "Exploring m and c.xls”.
2. You are going to toggle m and c to generate 4 different graphs.
For each graph,
3. Record down the equation and sketch the graph.
4. Press “F9” key to generate another 2 ordered pairs used to calculate gradient.
5. Complete the columns in the table below.
Record the 2 ordered Pairs
Equation Sketch of graph m c and calculate the gradient
using formula.
( , )&( , )
m=
( , )&( , )
m=
( , )&( , )
m=
( , )&( , )
m=
( , )&( , )
m=
( , )&( , )
m=
( , )&( , )
m=
( , )&( , )
m=
Deduction
For the linear graph of y = mx + c,
m represents
c represents
Adapted from resources provided by Educational Technology Division