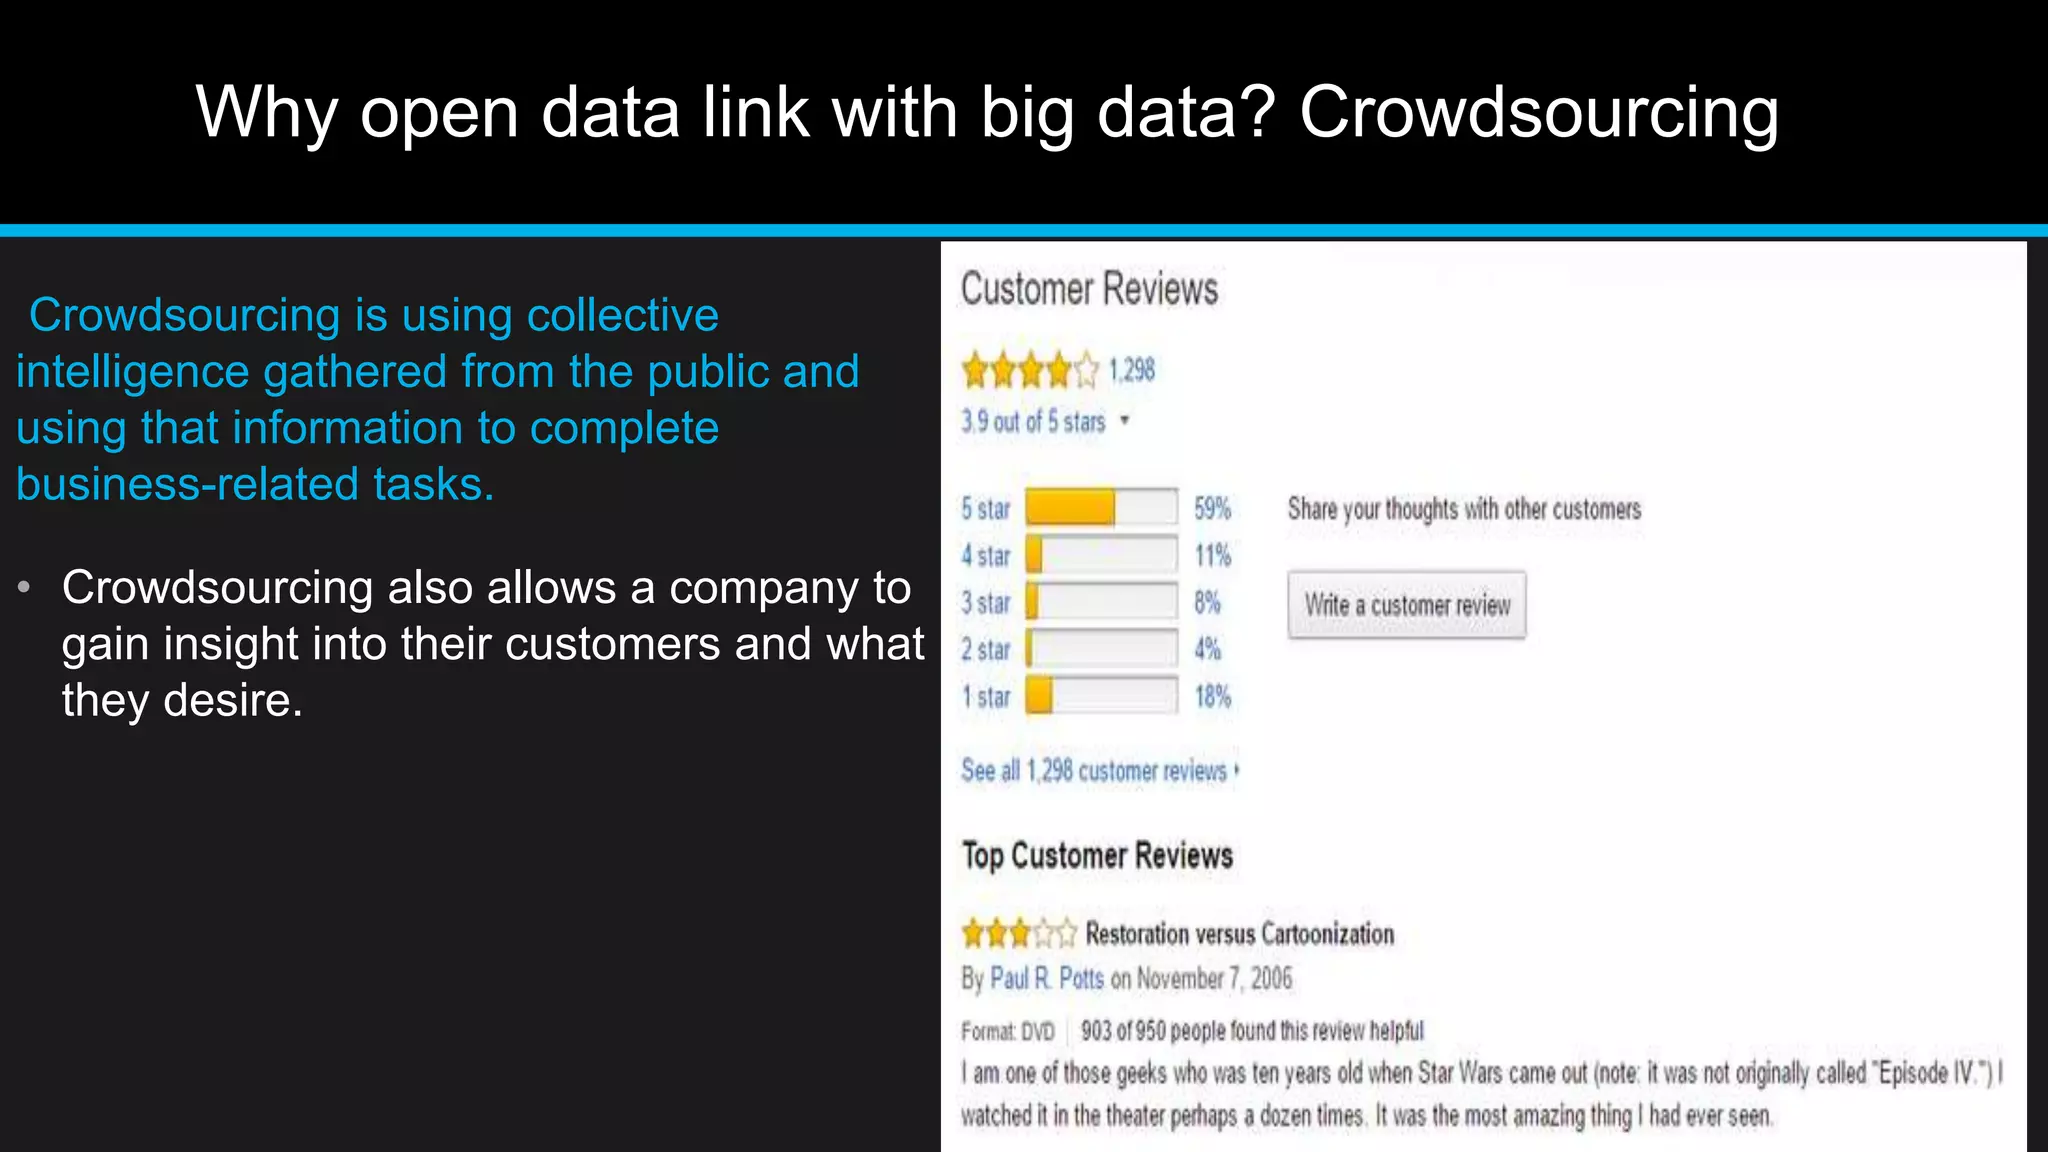
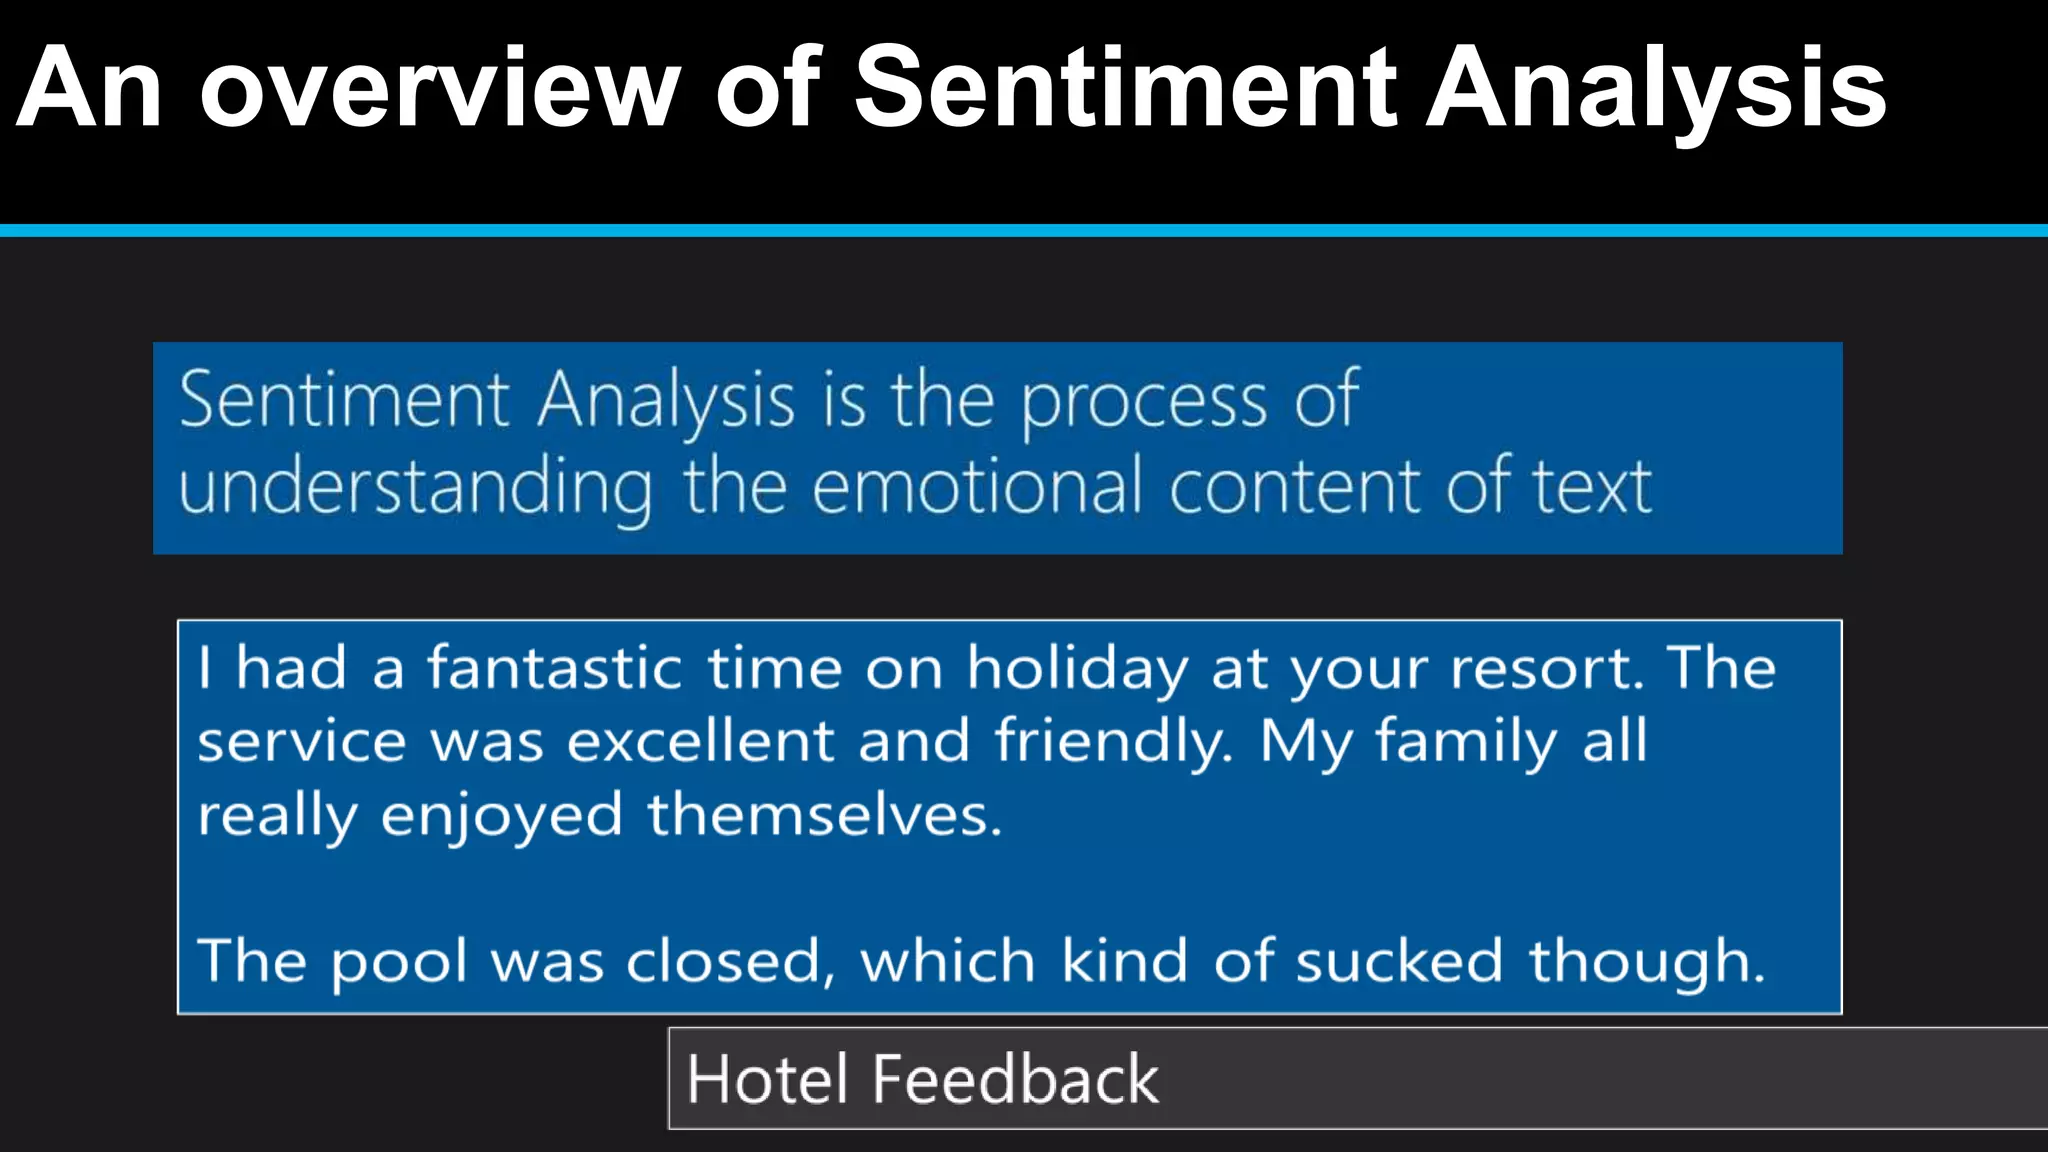
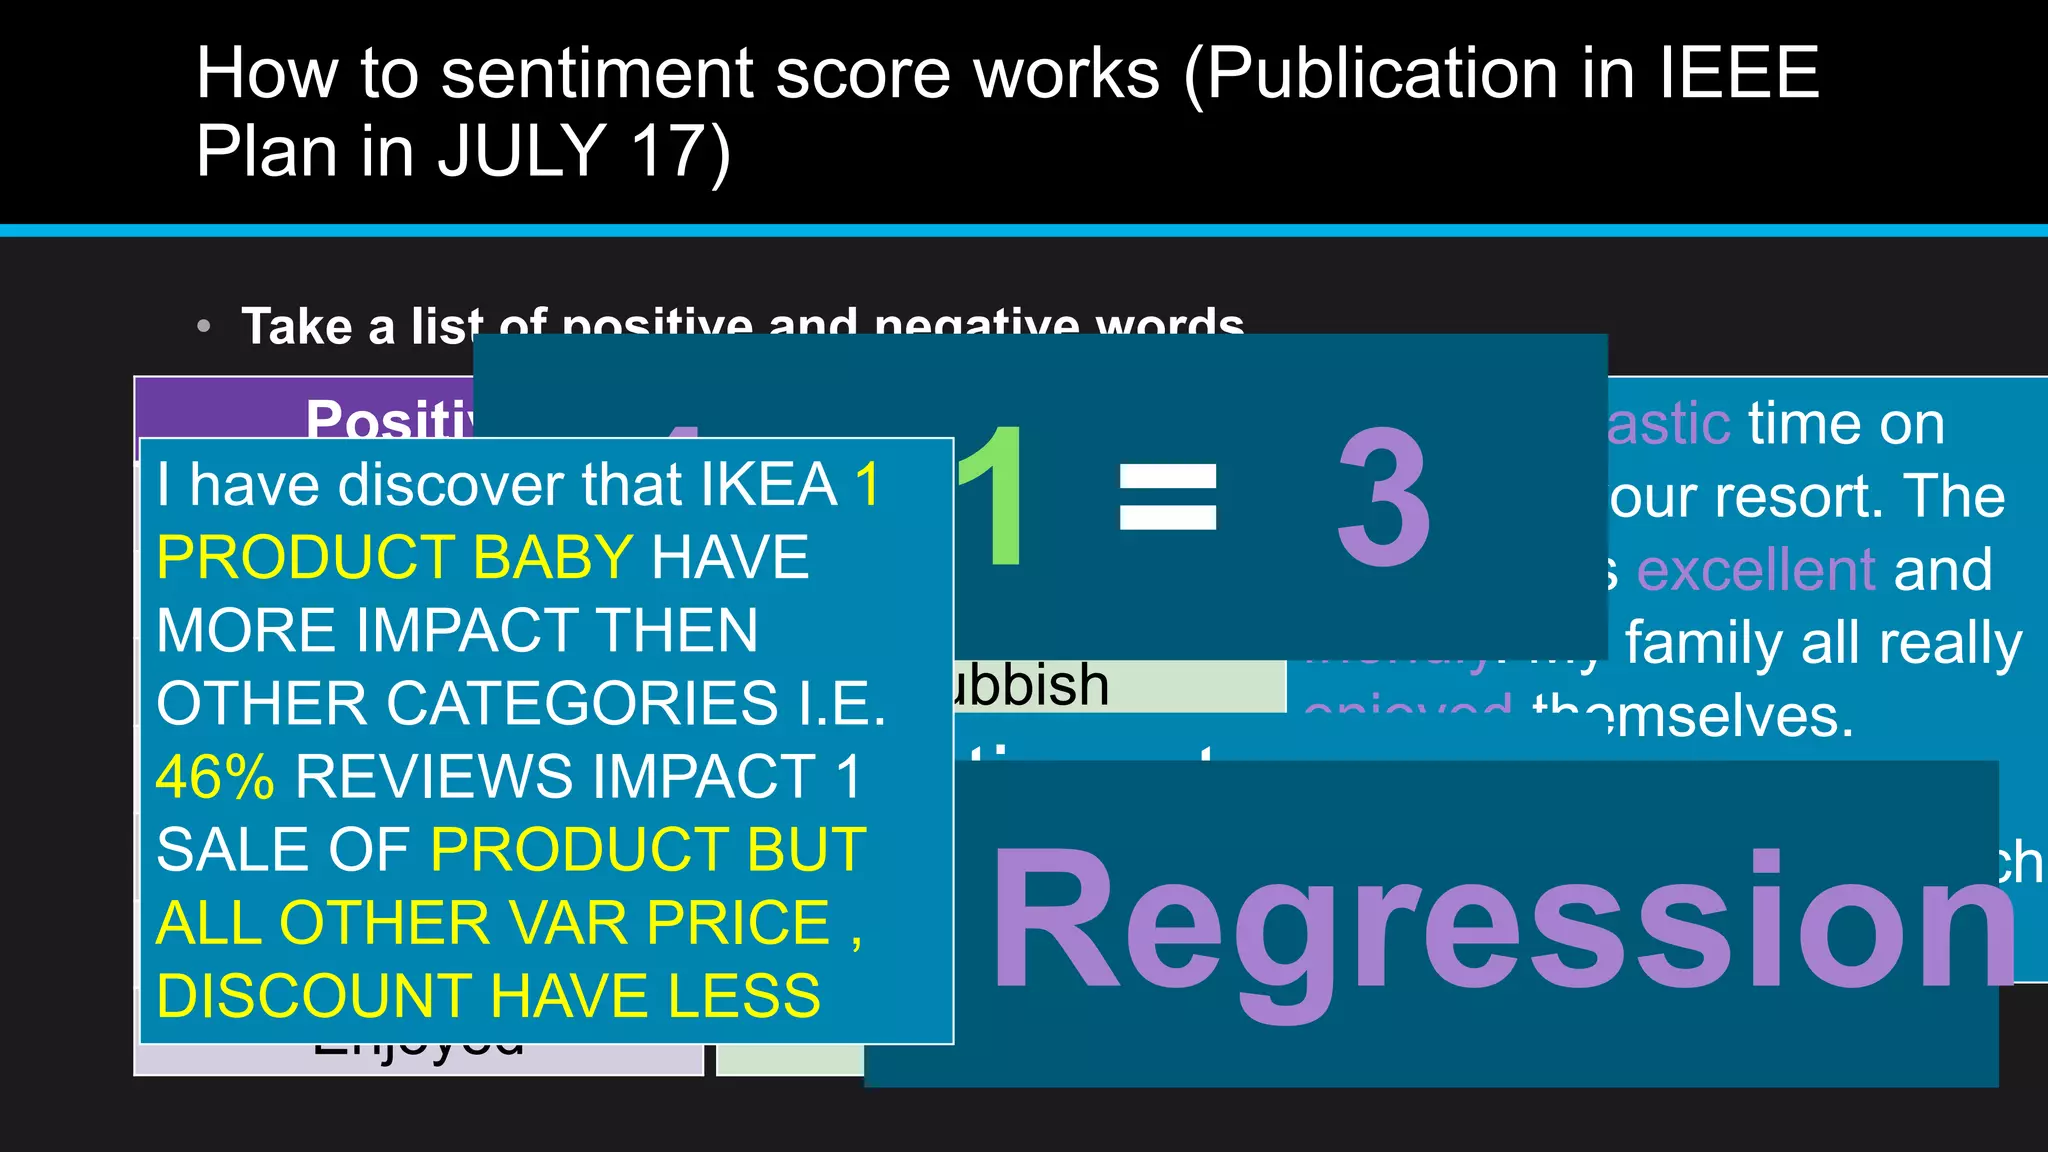
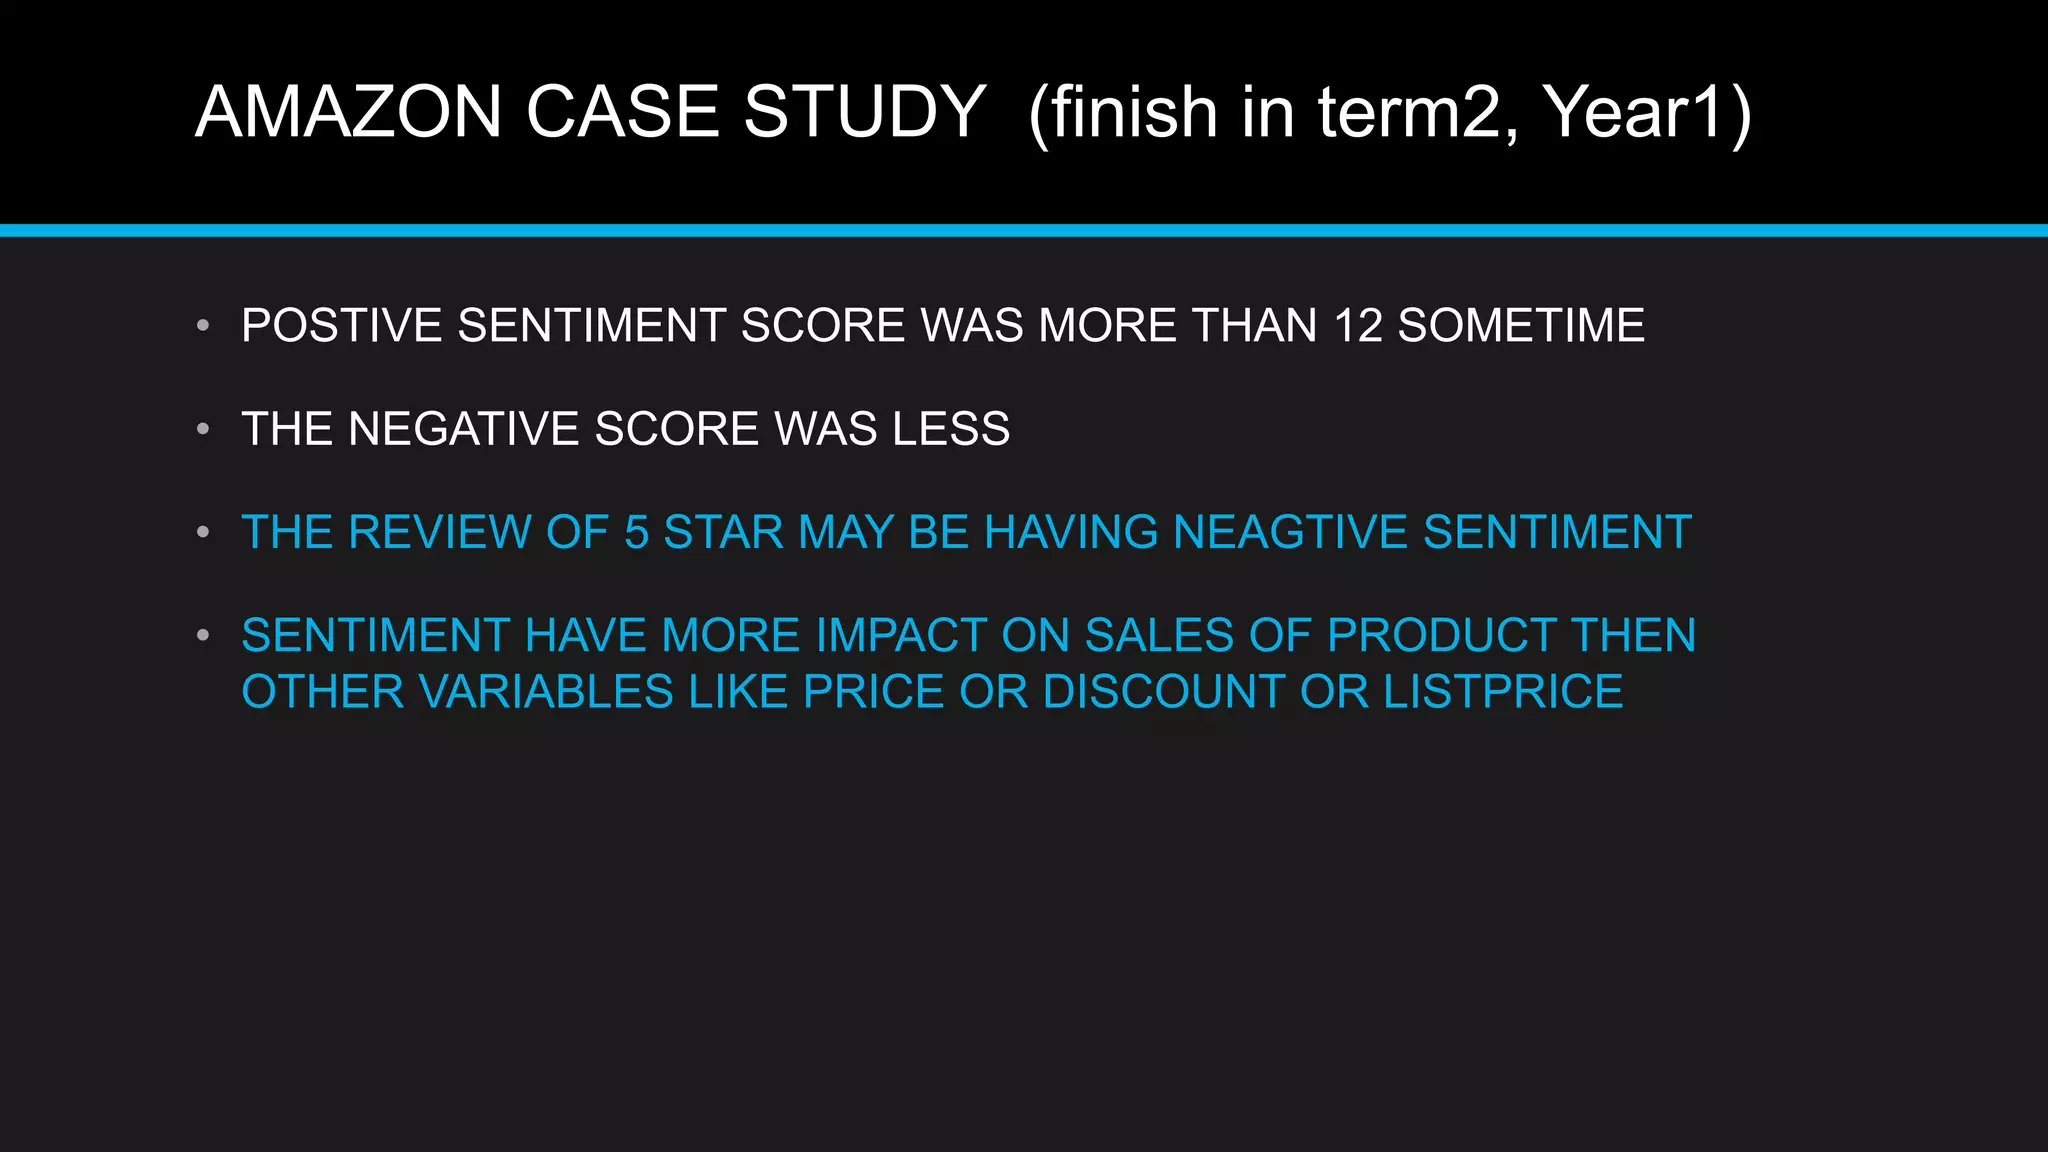
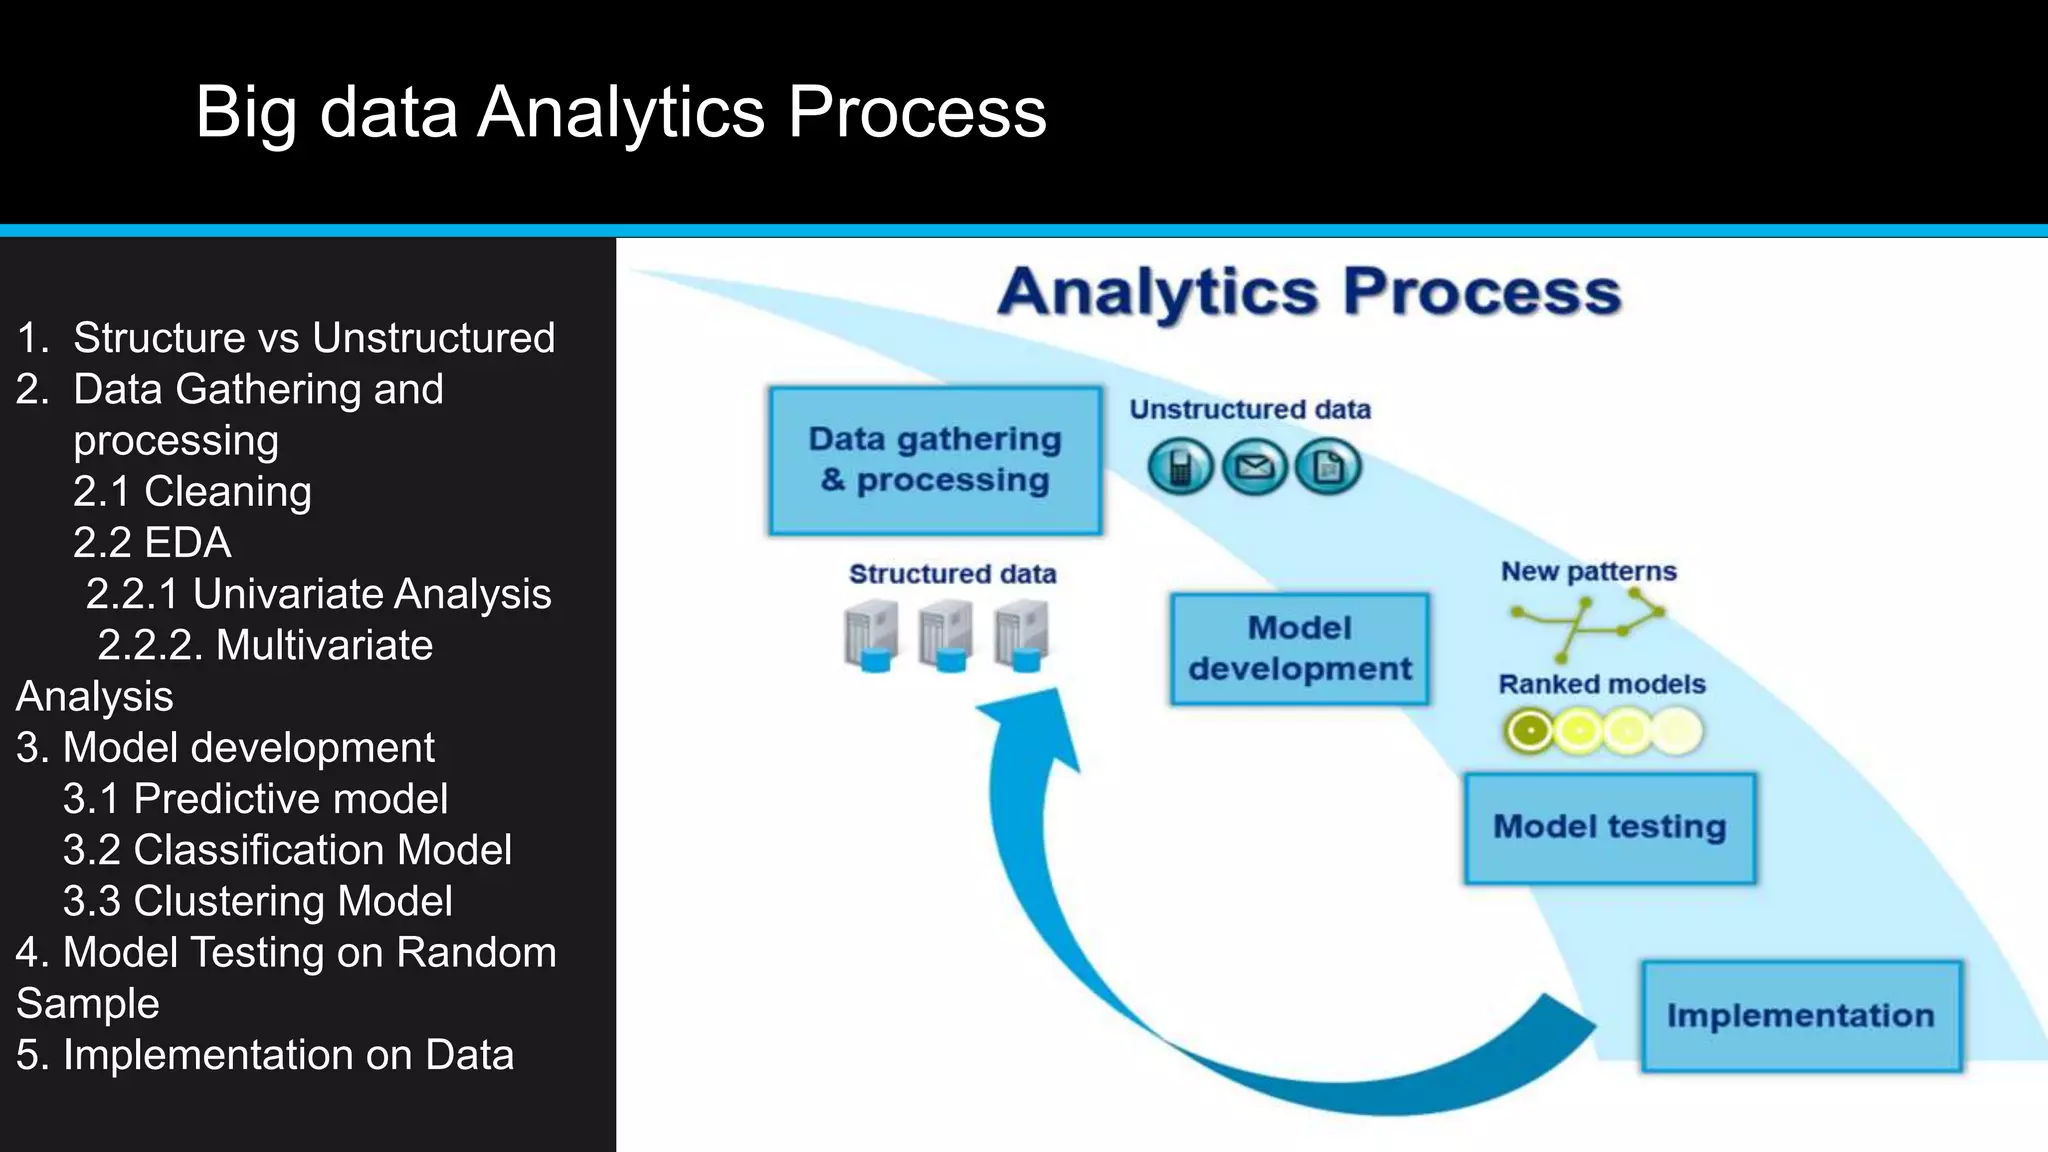
Big Data Analytics (Application
prospective and OMAN Open Data)
Sharjeel Imtiaz | PhD Big Data - In Progress | University of East London, UK
What is Big data?
How can I understand what my customers are saying and thinking?
Big Data Definition
• Big data is the term for a collection of data sets so large and complex that it
becomes difficult to process using on-hand database management tools or
traditional data processing applications.
• The challenges include capture, curation, storage, search, sharing, transfer,
analysis, and visualization
How Much Data? Statistics
• Google processes 20 PB a day (2008)
• Wayback Machine has 3 PB + 100 TB/month (3/2009)
• Facebook has 2.5 PB of user data + 15 TB/day (4/2009)
• eBay has 6.5 PB of user data + 50 TB/day (5/2009)
• CERN’s Large Hydron Collider (LHC) generates 15 PB a year
640K ought to be
enough for anybody.
Big Data (Volume) Applications
12+ TBs
of tweet data
every day
25+ TBs of
log data
every day
?TBsof
dataeveryday
2+
billion
people on
the Web
by end
2011
30 billion RFID
tags today
(1.3B in 2005)
4.6
billion
camera
phones
world wide
100s of
millions
of GPS
enabled
devices
sold
annually
76 million smart
meters in 2009…
200M by 2014
Variety (Complexity)
• Relational Data (Tables/Transaction/Legacy Data)
• Text Data (Web)
• Semi-structured Data (XML)
• Graph Data
• Social Network, Semantic Web (RDF), …
• Streaming Data
• You can only scan the data once
• A single application can be generating/collecting many
types of data
• Big Public Data (online, weather, finance, etc)
6
To extract knowledge all these types of
data need to linked together
The Earthscope
• The Earthscope is the world's largest science
project. Designed to track North America's
geological evolution, this observatory records
data over 3.8 million square miles,
amassing 67 terabytes of data. It analyzes
seismic slips in the San Andreas fault, sure,
but also the plume of magma underneath
Yellowstone and much, much more.
(http://www.msnbc.msn.com/id/44363598/ns/
technology_and_science-
future_of_technology/#.TmetOdQ--uI)
Some Make it 4V’s
8
4 Vs are not enough now
new trend of 5,6 Vs are
emerging for example,
human less concept of
stores (AMAZON)
Why open data link with big data? Crowdsourcing
Crowdsourcing is using collective
intelligence gathered from the public and
using that information to complete
business-related tasks.
• Crowdsourcing also allows a company to
gain insight into their customers and what
they desire.
An overview of Sentiment Analysis
How to sentiment score works (Publication in IEEE
Plan in JULY 17)
• Take a list of positive and negative words
Positive
Good
Great
Fantastic
Excellent
Friendly
Awesome
Enjoyed
Negative
Bad
Worse
Rubbish
Sucked
Awful
Terrible
Bogus
I had a fantastic time on
holiday at your resort. The
service was excellent and
friendly. My family all really
enjoyed themselves.
The pool was closed, which
kind of sucked though.
4 1- = 3
Overall sentiment:
Positive
Regression
I have discover that IKEA 1
PRODUCT BABY HAVE
MORE IMPACT THEN
OTHER CATEGORIES I.E.
46% REVIEWS IMPACT 1
SALE OF PRODUCT BUT
ALL OTHER VAR PRICE ,
DISCOUNT HAVE LESS
AMAZON CASE STUDY (finish in term2, Year1)
• POSTIVE SENTIMENT SCORE WAS MORE THAN 12 SOMETIME
• THE NEGATIVE SCORE WAS LESS
• THE REVIEW OF 5 STAR MAY BE HAVING NEAGTIVE SENTIMENT
• SENTIMENT HAVE MORE IMPACT ON SALES OF PRODUCT THEN
OTHER VARIABLES LIKE PRICE OR DISCOUNT OR LISTPRICE
Big Data
• Lots of data is being collected
and warehoused
• Web data, e-commerce
• purchases at department/
grocery stores
• Bank/Credit Card
transactions
• Social Network
Overview
Application of open data and big data
• “Open Data are all stored data which could be made accessible in a public
interest without any restrictions for usage and distribution”
OPEN DATA AND BIG DATA SOURCES IN GULF
IS THAT ENOUGH? IS THERE ANY POLICY ? IS
THERE INFRASTRUTURE?
Oman release open data vs data infrastructure
Oman need open data and
Legal sense
• For example,
crowdsourcing
• legal policy for
anonymized data if data
Have name and address
It is harm to privacy.
• Data infrastructure
(data structures,
interoperability at all
levels e.g. tools find
information
automatically.
• make your
syntax/formats explicit
and register them in
known registry
Oman release open data vs data infrastructure
• need simple mechanisms supporting single identity and single sign-on
• need trust in academia to exchange attributes (Code of Conduct is promising)
For example, plenty to anonymize public data is big in money.
• must be worldwide since data is worldwide
• can’t be true that all set up own user databases
OPEN DATA INFRASTRUCTURE BENCHMARK
• United kingdom :
• https://data.gov.uk/
• https://data.gov.uk/data/search
• Road Safety Data
• Department for Transport These
files provide detailed road safety
data about the circumstances of
personal injury road accidents in
GB from 1979, the types (including
Make and Model) of vehicles
involved and the
Unstructured format (csv /zip file)
why unstructured?
• No privacy
• Transparent Gov, science
and
cooperation
• People benefits
• Private companies Benefits
• generate economic values
• Create better citizens
Big data Analytics Process
1. Structure vs Unstructured
2. Data Gathering and
processing
2.1 Cleaning
2.2 EDA
2.2.1 Univariate Analysis
2.2.2. Multivariate
Analysis
3. Model development
3.1 Predictive model
3.2 Classification Model
3.3 Clustering Model
4. Model Testing on Random
Sample
5. Implementation on Data
Unstructured Data variables
Controlled
variables
• These are kept
the same
throughout your
experiments
Independent
variable
• The one variable
you purposely
change and test
Dependent
variable
• The measure of
change
observed
because of
independent
variable
• Decide how you
will measure the
change
A case study of Credit Scoring
Source : UCI OPEN DATA
Do credit (loan) is a risk or non risk (yes/No) ?
Variables and TYPES
Variables Scale of Variables Description
Limit_BAL Continuous – Interval Amount of the given credit (NT
dollar): it includes both the
individual consumer credit and
his/her family (supplementary)
credit
Sex Categorical - Nominal Gender (1 = male; 2 = female).
Education Categorical – Nominal Education (1 = graduate
school; 2 = university; 3 = high
school; 4 = others).
Marital Status Categorical – Nominal Marital status (1 = married; 2 =
single; 3 = others).
Age Continues – Interval Age (year).
Pay_0 to Pay_6 Categorical History of past payment. We
tracked the past monthly
payment records (from April to
Adapted Methodology
Step 1
• Cleaning
Step 2
• Exploratory
Data
Analysis(EDA)
Step 3
• Classification
Step 4
• Results
Missing Values are
High
ANALYZE CONTINOUS
VARIABLE – Interval
APPLY IMPUTATION
- CAN NOT REMOVE
MISSING VALUES ?
WHY
Variable
Count
Value_Status
PAY_AMT6 0.23910000 (23%) High
PAY_AMT4 0.21360000 (21 %) High
PAY_AMT2 0.17986667 (17%) High
BILL_AMT6 0.13400000 (13%) Moderate
BILL_AMT4 0.10650000 (10%) Moderate
BILL_AMT2 0.08353333 (8%) Low
PAY_AMT5 0.22343333 (22%) High
PAY_AMT3 0.19893333 (19%) High
PAY_AMT1 0.17496667 (17%) High
BILL_AMT5 0.11686667 (11%) Moderate
BILL_AMT3 0.09566667 (9%) Low
• The Skew Analysis
- Mean vs Median
- median is high then
skewness negative
Outlier analysis and
scaling
- Need to scale well by
scaling technique
- (MIN-MAX OR
LAMBDA)
After scaling all
Continues variables
0-1 the skewness and
outliers scale
Some time outliers is
significant value than
don’t remove it scale it
down
The correlational
analysis using
spearsman
The strong correlation
can have impact on
dependant varables
Classification tree c5.0
Accuracy is 79.83
Error Rate: 20.17
TN+TP/N= ACCURACY
FP+FN=ERROR RATE
Bayesian Classifier
Accuracy is 77 %
error rate is 23%
RISK ARE LESS
• So Classification tree is best in terms of
classification accuracy of 79.83% of not
default credit (loan) holders
therefore there are more good customer
in terms of credit vs bad credit of 20.17.
Finally, error rate of Bayesian classifier is
more than Decision tree so it is n# 2
techniques in terms of priority.
Conclusion
• Big data will available from IOT applications e.g. smart phones in Oman in
near future
• Big data infrastructure benchmarking is highly desire
• Big data insight take more than 90% time of project
• Big data analysis only required tweaking of analysis models but new
implementation for particular problem always research topic
Works Cited
• https://data.gov.uk/dataset/road-accidents-safety-data
• https://www.thebalance.com/what-is-crowdsourcing-marketing-and-how-is-it-
used-2295467
• http://www.shu.edu/technology/
• http://archive.ics.uci.edu/ml/datasets.html?sort=nameUp&view=list

Big Data Analytics and Open Data

  • 1.
    Big Data Analytics(Application prospective and OMAN Open Data) Sharjeel Imtiaz | PhD Big Data - In Progress | University of East London, UK
  • 2.
    What is Bigdata? How can I understand what my customers are saying and thinking?
  • 3.
    Big Data Definition •Big data is the term for a collection of data sets so large and complex that it becomes difficult to process using on-hand database management tools or traditional data processing applications. • The challenges include capture, curation, storage, search, sharing, transfer, analysis, and visualization
  • 4.
    How Much Data?Statistics • Google processes 20 PB a day (2008) • Wayback Machine has 3 PB + 100 TB/month (3/2009) • Facebook has 2.5 PB of user data + 15 TB/day (4/2009) • eBay has 6.5 PB of user data + 50 TB/day (5/2009) • CERN’s Large Hydron Collider (LHC) generates 15 PB a year 640K ought to be enough for anybody.
  • 5.
    Big Data (Volume)Applications 12+ TBs of tweet data every day 25+ TBs of log data every day ?TBsof dataeveryday 2+ billion people on the Web by end 2011 30 billion RFID tags today (1.3B in 2005) 4.6 billion camera phones world wide 100s of millions of GPS enabled devices sold annually 76 million smart meters in 2009… 200M by 2014
  • 6.
    Variety (Complexity) • RelationalData (Tables/Transaction/Legacy Data) • Text Data (Web) • Semi-structured Data (XML) • Graph Data • Social Network, Semantic Web (RDF), … • Streaming Data • You can only scan the data once • A single application can be generating/collecting many types of data • Big Public Data (online, weather, finance, etc) 6 To extract knowledge all these types of data need to linked together
  • 7.
    The Earthscope • TheEarthscope is the world's largest science project. Designed to track North America's geological evolution, this observatory records data over 3.8 million square miles, amassing 67 terabytes of data. It analyzes seismic slips in the San Andreas fault, sure, but also the plume of magma underneath Yellowstone and much, much more. (http://www.msnbc.msn.com/id/44363598/ns/ technology_and_science- future_of_technology/#.TmetOdQ--uI)
  • 8.
    Some Make it4V’s 8 4 Vs are not enough now new trend of 5,6 Vs are emerging for example, human less concept of stores (AMAZON)
  • 9.
    Why open datalink with big data? Crowdsourcing Crowdsourcing is using collective intelligence gathered from the public and using that information to complete business-related tasks. • Crowdsourcing also allows a company to gain insight into their customers and what they desire.
  • 10.
    An overview ofSentiment Analysis
  • 11.
    How to sentimentscore works (Publication in IEEE Plan in JULY 17) • Take a list of positive and negative words Positive Good Great Fantastic Excellent Friendly Awesome Enjoyed Negative Bad Worse Rubbish Sucked Awful Terrible Bogus I had a fantastic time on holiday at your resort. The service was excellent and friendly. My family all really enjoyed themselves. The pool was closed, which kind of sucked though. 4 1- = 3 Overall sentiment: Positive Regression I have discover that IKEA 1 PRODUCT BABY HAVE MORE IMPACT THEN OTHER CATEGORIES I.E. 46% REVIEWS IMPACT 1 SALE OF PRODUCT BUT ALL OTHER VAR PRICE , DISCOUNT HAVE LESS
  • 12.
    AMAZON CASE STUDY(finish in term2, Year1) • POSTIVE SENTIMENT SCORE WAS MORE THAN 12 SOMETIME • THE NEGATIVE SCORE WAS LESS • THE REVIEW OF 5 STAR MAY BE HAVING NEAGTIVE SENTIMENT • SENTIMENT HAVE MORE IMPACT ON SALES OF PRODUCT THEN OTHER VARIABLES LIKE PRICE OR DISCOUNT OR LISTPRICE
  • 13.
    Big Data • Lotsof data is being collected and warehoused • Web data, e-commerce • purchases at department/ grocery stores • Bank/Credit Card transactions • Social Network
  • 14.
  • 15.
    Application of opendata and big data • “Open Data are all stored data which could be made accessible in a public interest without any restrictions for usage and distribution”
  • 16.
    OPEN DATA ANDBIG DATA SOURCES IN GULF IS THAT ENOUGH? IS THERE ANY POLICY ? IS THERE INFRASTRUTURE?
  • 17.
    Oman release opendata vs data infrastructure Oman need open data and Legal sense • For example, crowdsourcing • legal policy for anonymized data if data Have name and address It is harm to privacy. • Data infrastructure (data structures, interoperability at all levels e.g. tools find information automatically. • make your syntax/formats explicit and register them in known registry
  • 18.
    Oman release opendata vs data infrastructure • need simple mechanisms supporting single identity and single sign-on • need trust in academia to exchange attributes (Code of Conduct is promising) For example, plenty to anonymize public data is big in money. • must be worldwide since data is worldwide • can’t be true that all set up own user databases
  • 19.
    OPEN DATA INFRASTRUCTUREBENCHMARK • United kingdom : • https://data.gov.uk/ • https://data.gov.uk/data/search • Road Safety Data • Department for Transport These files provide detailed road safety data about the circumstances of personal injury road accidents in GB from 1979, the types (including Make and Model) of vehicles involved and the
  • 20.
    Unstructured format (csv/zip file) why unstructured? • No privacy • Transparent Gov, science and cooperation • People benefits • Private companies Benefits • generate economic values • Create better citizens
  • 21.
    Big data AnalyticsProcess 1. Structure vs Unstructured 2. Data Gathering and processing 2.1 Cleaning 2.2 EDA 2.2.1 Univariate Analysis 2.2.2. Multivariate Analysis 3. Model development 3.1 Predictive model 3.2 Classification Model 3.3 Clustering Model 4. Model Testing on Random Sample 5. Implementation on Data
  • 22.
    Unstructured Data variables Controlled variables •These are kept the same throughout your experiments Independent variable • The one variable you purposely change and test Dependent variable • The measure of change observed because of independent variable • Decide how you will measure the change
  • 23.
    A case studyof Credit Scoring Source : UCI OPEN DATA Do credit (loan) is a risk or non risk (yes/No) ?
  • 24.
    Variables and TYPES VariablesScale of Variables Description Limit_BAL Continuous – Interval Amount of the given credit (NT dollar): it includes both the individual consumer credit and his/her family (supplementary) credit Sex Categorical - Nominal Gender (1 = male; 2 = female). Education Categorical – Nominal Education (1 = graduate school; 2 = university; 3 = high school; 4 = others). Marital Status Categorical – Nominal Marital status (1 = married; 2 = single; 3 = others). Age Continues – Interval Age (year). Pay_0 to Pay_6 Categorical History of past payment. We tracked the past monthly payment records (from April to
  • 25.
    Adapted Methodology Step 1 •Cleaning Step 2 • Exploratory Data Analysis(EDA) Step 3 • Classification Step 4 • Results
  • 26.
    Missing Values are High ANALYZECONTINOUS VARIABLE – Interval APPLY IMPUTATION - CAN NOT REMOVE MISSING VALUES ? WHY Variable Count Value_Status PAY_AMT6 0.23910000 (23%) High PAY_AMT4 0.21360000 (21 %) High PAY_AMT2 0.17986667 (17%) High BILL_AMT6 0.13400000 (13%) Moderate BILL_AMT4 0.10650000 (10%) Moderate BILL_AMT2 0.08353333 (8%) Low PAY_AMT5 0.22343333 (22%) High PAY_AMT3 0.19893333 (19%) High PAY_AMT1 0.17496667 (17%) High BILL_AMT5 0.11686667 (11%) Moderate BILL_AMT3 0.09566667 (9%) Low
  • 27.
    • The SkewAnalysis - Mean vs Median - median is high then skewness negative Outlier analysis and scaling - Need to scale well by scaling technique - (MIN-MAX OR LAMBDA)
  • 28.
    After scaling all Continuesvariables 0-1 the skewness and outliers scale Some time outliers is significant value than don’t remove it scale it down
  • 29.
    The correlational analysis using spearsman Thestrong correlation can have impact on dependant varables
  • 30.
    Classification tree c5.0 Accuracyis 79.83 Error Rate: 20.17 TN+TP/N= ACCURACY FP+FN=ERROR RATE
  • 31.
    Bayesian Classifier Accuracy is77 % error rate is 23% RISK ARE LESS • So Classification tree is best in terms of classification accuracy of 79.83% of not default credit (loan) holders therefore there are more good customer in terms of credit vs bad credit of 20.17. Finally, error rate of Bayesian classifier is more than Decision tree so it is n# 2 techniques in terms of priority.
  • 32.
    Conclusion • Big datawill available from IOT applications e.g. smart phones in Oman in near future • Big data infrastructure benchmarking is highly desire • Big data insight take more than 90% time of project • Big data analysis only required tweaking of analysis models but new implementation for particular problem always research topic
  • 33.
    Works Cited • https://data.gov.uk/dataset/road-accidents-safety-data •https://www.thebalance.com/what-is-crowdsourcing-marketing-and-how-is-it- used-2295467 • http://www.shu.edu/technology/ • http://archive.ics.uci.edu/ml/datasets.html?sort=nameUp&view=list

Editor's Notes

  • #3 This is the question that your experiment answers
  • #24 Establish hypothesis before you begin the experiment. This should be your best educated guess based on your research.
  • #26 List all of the steps used in completing your experiment. Remember to number your steps.