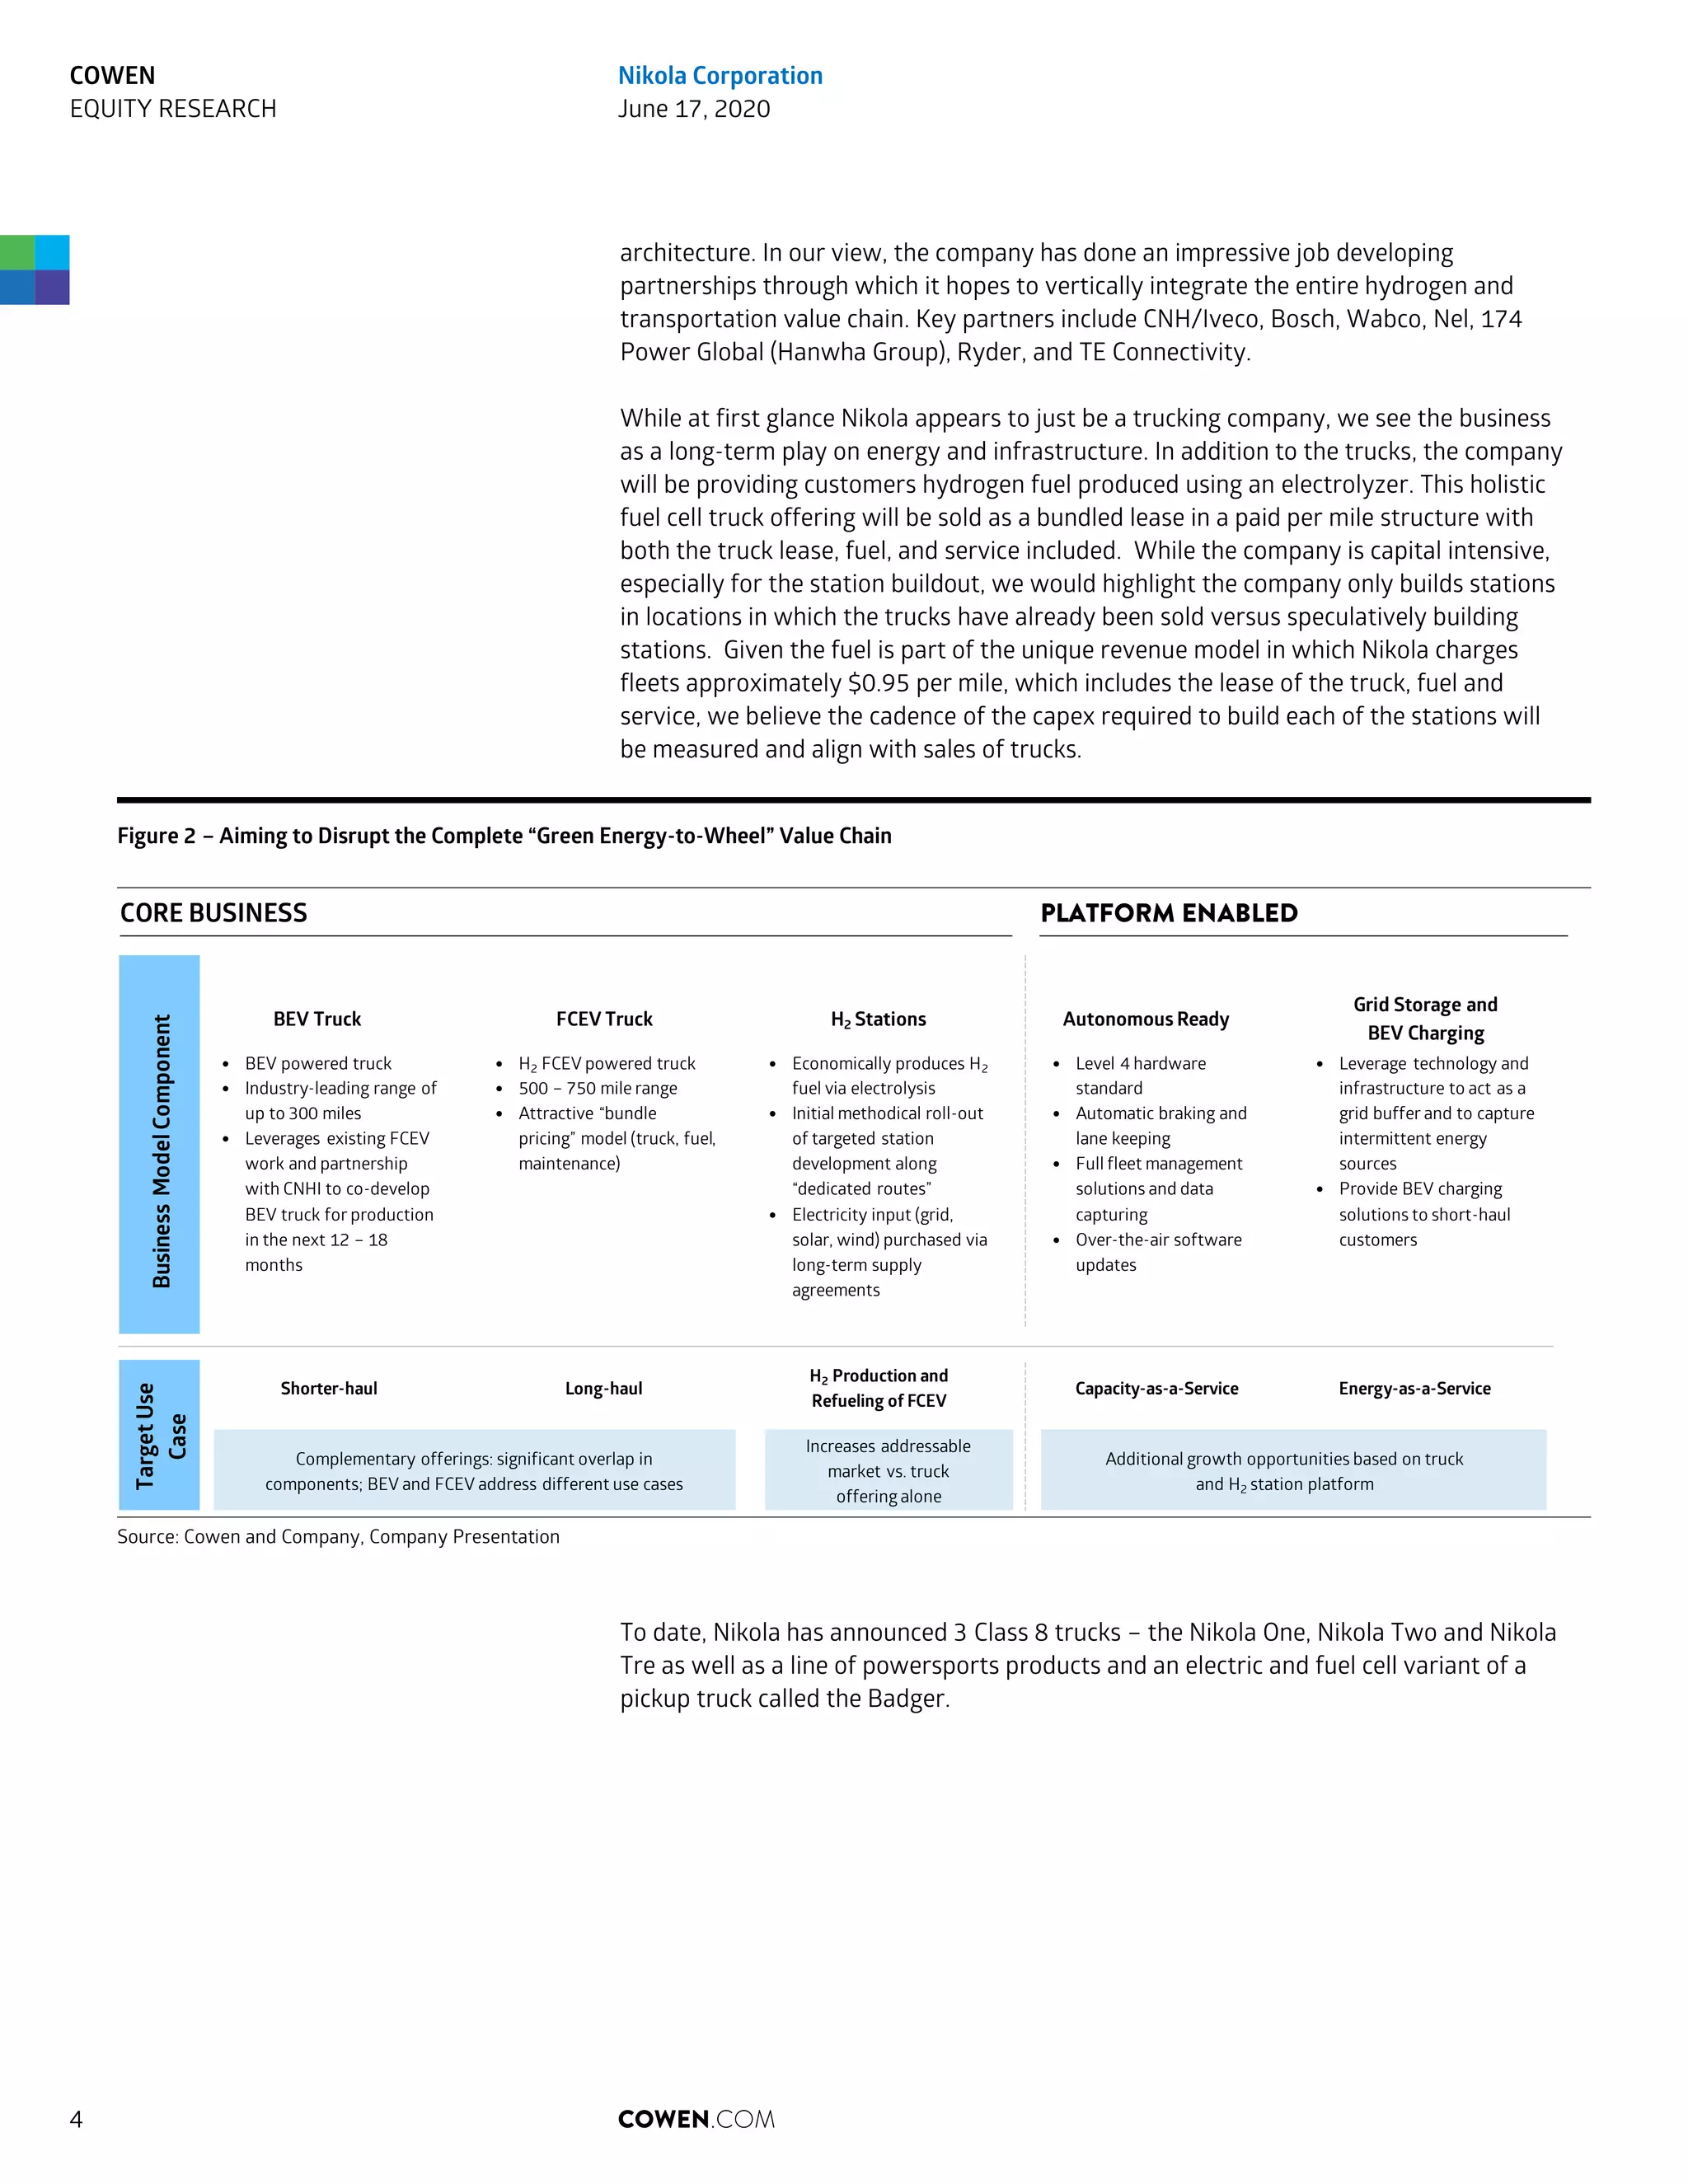
Sustainable Energy & Industrial Technology
NIKOLA CORPORATION
EQUITY RESEARCH INITIATING COVERAGE
June 17, 2020
Price: $62.93 (06/16/2020 )
Price Target: $79.00
OUTPERFORM (1)
INITIATION: MORE THAN JUST A TRUCK
COMPANY; OUTPERFORM AND $79 PRICE
TARGET
Jeffrey Osborne
646 562 1391
jeffrey.osborne@cowen.com
Thomas Boyes
646 562 1378
thomas.boyes@cowen.com
Emily Riccio
646 562 1383
emily.riccio@cowen.com
Key Data
Symbol NASDAQ: NKLA
52-Week Range: $93.99 - $9.92
Market Cap: $22.7B
Net Debt (MM): $232.7
Cash/Share: $0.11
Dil. Shares Out (MM): 360.9
Enterprise Value (MM): $22,944.2
BV/Share: $0.70
Dividend: NA
FY (Dec) 2020E 2021E 2022E 2023E
EPS
Q1 $(0.12) $(0.18) $(0.17) $(0.18)
Q2 $(0.14) $(0.19) $(0.17) $(0.19)
Q3 $(0.17) $(0.19) $(0.18) $(0.17)
Q4 $(0.18) $(0.21) $(0.17) $(0.16)
Year $(0.60) $(0.77) $(0.69) $(0.70)
P/E NM NM NM NM
Revenue (MM)
Year $0.0 $82.5 $300.0 $1,413.5
EV/S - 278.1x 76.5x 16.2x
THE COWEN INSIGHT
We initiate coverage of Nikola with an Outperform rating a price target of $79. We see
Nikola as an intriguing investment opportunity, leveraging one truck platform, 2 power train
options and 3 business segments, with optionality in powersports, pickups and AVs. We
believe the partner ecosystem derisks the ramp in production in '21. We highlight that ~50%
of the revenue stream is fuel related.
Nikola has sprinted out of the gates as a publicly traded company, focused on several
areas of heavy investor interest (carbon free Class 8 trucking, vehicle electrification and
hydrogen fueling). Nikola is likely to be a controversial stock in the eyes of many investors
and onlookers given it is pre-production. We are compelled by the ecosystem that the
company has formulated over the past 5 years, led by Bosch (global leader in electrical
systems) initially and more recently CNH/Iveco (top 5 truck OEM in Europe). This approach
is the opposite of Tesla, who builds as much as possible in-house. Nikola's internally
developed IP largely lies in software/firmware, the BMS (battery management system),
infotainment, aerodynamics to reduce drag coefficient and leverages partners for other
critical components which derisks the ramp in our view.
Innovative Business Model - Nikola's goal is to match or beat the current cost per mile
excluding the driver and lock in fuel certainty, something natural gas and EV trucks have
not been able to do. We assume an average of $0.95/mi relative to most fleets in the
$0.95-1.15/mi range. That cost pays for a 7-year truck lease, hydrogen fuel for 100,000
miles/year, and service. The model drives ~$665,000 of revenue per truck leased, which
about 35% is truck, 50% fuel and 15% service.
Highlights of the Financial Model - We assume initial BEV production in 3Q21 and FCEV
production in 1Q23. Note ~90% of the components in the FCEV are used in the BEV. We see
steady state of demand (and margins) for both the electric (BEV) and fuel cell (FCEV) coming
in the '25 to '26 time frame; however, we model the company breaking into GAAP EBITDA
positive in '24. We see a path to ~15% EBITDA margins assuming ~25,500 trucks are sold in
'26. We assume the company will need to raise ~$500mn in equity in late '21 so there will
be one more trip to the market. We assume accelerated hydrogen station rollouts in the
'24-'27 timeframe are debt financed.
Potential Upcoming Catalysts - We see June 29th Badger (pickup truck) details and
reservation opening as a catalyst as well as the naming of a manufacturing partner. Note
the Badger is not in our modeling at the moment given the lack of clarity on specifics. We
also see likely fueling partners announced and order announcements for the mid-21 launch
of the BEV Class 8 truck driving the stock higher.
Valuation and Price Target - Our $79 price target is based off of a 5.5x EV/Sales on our
2025 estimates. We are modeling 2H21 start of production for the BEV and mid-2023
for the FCEV truck. Our model assumes no production of the Badger, which we believe
is likely conservative given the likely news flow around the vehicle later this month. We
acknowledge a 5.5x multiple is a high growth multiple; however, we believe many unique
characteristics of Nikola and the scarcity value of the first to market zero emission truck
company justify the multiple. We also note the bevy of items that are not in our model that
we believe can accrete to investors over time which could provide further upside to our
price target. We have high confidence the ecosystem can drive revenue growth and a path
to mid-teens EBITDA margins over time.
COWEN.COMPlease see pages 83 to 87 of this report for important disclosures.
AT A GLANCE
Our Investment Thesis
We believe that Nikola is well positioned to address the growing need for low emissions and
zero-emission vehicles in the Class 8 trucking market. The company's focus on battery and
hydrogen technology and use of strategic partners particularly for vehicle manufacturing
should allow for a fairly smooth production ramp, in our view. Longer term we see the
company evolving into a more broad-based energy technology company as hydrogen fueling
infrastructure is slowly built out.
Forthcoming Catalysts
■ Partner for Badger Electric Pickup Truck
■ Strategic Partner(s) for Hydrogen Fueling
■ Potential Use of CNH/Iveco Facility to
Produce Fuel Cell and EV Trucks for the
European Market
Base Case Assumptions
■ Start of BEV production in 3Q21 and
FCEV in 1Q23.
■ No commercial success with Badger
pickup truck.
■ Raises $500mn in equity in 4Q21 for
capex and $775mn in corporate debt
from '23-25.
■ Takes 6 quarters of production of the
BEV truck and 3 quarters of FCEV
production to achieve positive gross
margins.
Upside Scenario
■ A faster ramp of production in Ulm,
Germany at Iveco to achieve 1H21
production and Coolidge, AZ facility starts
production faster in '22.
■ Less dilution or debt needed due to
finding a funding partner for hydrogen
station roll out.
■ Faster gross margin profitability after
start of production.
■ Commercial launch of the Badger pickup
through a partner.
Downside Scenario
■ Ramp up of production in Ulm, Germany
is not successful.
■ Greater dilution is needed for funding
needs of stations and lower output from
Germany and Arizona.
■ Elongated period of negative gross
margins in production.
Price Performance
Jun-20Mar-20Dec-19Sep-19
$100
80
60
40
20
0
Source: Bloomberg
Company Description
Nikola Corporation is a designer, manufacturer, and integrator of battery-electric and
hydrogen powered vehicles, with focus on the trucking market. The company offers
hydrogen infrastructure and fueling solutions for its hydrogen powered vehicles in the form
of a bundled lease solution. Nikola is also pursuing the power sports market with offerings
for both off-road and watersports applications. The company has also developed a pickup
truck called Badger that they are seeking a 3rd party manufacturing partner for.
Analyst Top Picks
Ticker Price (06/16/2020 ) Price Target Rating
Aptiv PLC APTV $76.15 $86.00 Outperform
Hannon Armstrong HASI $29.67 $34.00 Outperform
SolarEdge Technologies SEDG $153.10 $134.00 Outperform
.
COWEN.COM2
COWEN
EQUITY RESEARCH
Nikola Corporation
June 17, 2020
Effective June 17, we are initiating coverage of Nikola with an Outperform rating and a
$79 price target. While the stock at first glance screens expensive, we believe the
ecosystem the company is leveraging through the use of strategic partners for design,
key components and manufacturing should allow a fairly smooth ramp of production of
the battery electric truck in the Summer of 2021, followed by a fuel cell variant in early
2023. In addition, Nikola is much more than just a trucking company and is really a
broad-based energy technology company. The company’s “moat” is above and beyond
just selling a truck with the company setting up a hydrogen station network in North
America today and likely Europe at some point in the future. The aim is to sell “energy
as a service” or “freight as a service” which at first sounds like a bunch of marketing
hype, but as investors fully appreciate the differentiated business model, we believe this
is unique and extracts more value per truck sold. A typical Class 8 truck may sell for
$145,000 and serve as a onetime revenue event for a traditional truck OEM; Nikola
however, is extracting close to $700,000 of economic value by leasing the truck, fuel
and service as part of a subscription for just under $1/mile over 7 years with terms
allowing 100,000 miles per year. We see this as appealing to fleets given it removes
fuel uncertainty, a factor that stunted demand of other alternative fuels such as CNG
and LNG in the past which had swings versus diesel.
The story of reinventing transportation overlaps with sustainable investing in a
significant way. New technologies and business models are emerging that address some
of society’s biggest problems including emissions, health, safety and finite resource
problems. Nikola has an ambitious roadmap ahead of it seeking to combine low cost
renewable energy paired with electrolyzers to create low cost carbon free hydrogen
fuel along corridors where dedicated route fleets travel. That refueling network will be
available to other OEMs as well, not just to Nikola trucks. The first mover advantage of
owning the hydrogen infrastructure and being first to market is the differentiation.
Decarbonizing heavy duty transportation is much more challenging than light duty
vehicles and we believe fuel cells leveraging low cost hydrogen produced through
electrolyzers are the solution to solve the carbon conundrum in heavy-duty long-haul
trucking and other industries such as rail and marine. This concept is only possible in
our minds because of two primary factors. First, fuel cell quality, cost and lifetime has
tremendously improved over the past 2 to 3 years and second, low cost renewable
electricity is now allowing electrolyzers to produce hydrogen at a lower price than
diesel.
Figure 1 – Supply Chain From Contracted Low Cost Renewable Power Generation to Fuel Cell Truck – All on a Cost Per Mile Model
Source: Nikola Corproation
Nikola Corporation is a startup that has captured a great deal of investor and media
attention due to its high-profile investor base and strategic investment from CNH.
Nikola’s primary offering is a Class 8 truck leveraging fuel cells and batteries in a hybrid
COWEN.COM 3
COWEN
EQUITY RESEARCH
Nikola Corporation
June 17, 2020
architecture. In our view, the company has done an impressive job developing
partnerships through which it hopes to vertically integrate the entire hydrogen and
transportation value chain. Key partners include CNH/Iveco, Bosch, Wabco, Nel, 174
Power Global (Hanwha Group), Ryder, and TE Connectivity.
While at first glance Nikola appears to just be a trucking company, we see the business
as a long-term play on energy and infrastructure. In addition to the trucks, the company
will be providing customers hydrogen fuel produced using an electrolyzer. This holistic
fuel cell truck offering will be sold as a bundled lease in a paid per mile structure with
both the truck lease, fuel, and service included. While the company is capital intensive,
especially for the station buildout, we would highlight the company only builds stations
in locations in which the trucks have already been sold versus speculatively building
stations. Given the fuel is part of the unique revenue model in which Nikola charges
fleets approximately $0.95 per mile, which includes the lease of the truck, fuel and
service, we believe the cadence of the capex required to build each of the stations will
be measured and align with sales of trucks.
Figure 2 – Aiming to Disrupt the Complete “Green Energy-to-Wheel” Value Chain
Source: Cowen and Company, Company Presentation
To date, Nikola has announced 3 Class 8 trucks – the Nikola One, Nikola Two and Nikola
Tre as well as a line of powersports products and an electric and fuel cell variant of a
pickup truck called the Badger.
PLATFORM ENABLEDCORE BUSINESS
BusinessModelComponent
TargetUse
Case
Complementary offerings: significant overlap in
components; BEV and FCEV address different use cases
Additional growth opportunities based on truck
and H2 station platform
Increases addressable
market vs. truck
offering alone
H2 Production and
Refueling of FCEV
H2 Stations
• Economically produces H2
fuel via electrolysis
• Initial methodical roll-out
of targeted station
development along
“dedicated routes”
• Electricity input (grid,
solar, wind) purchased via
long-term supply
agreements
Long-haul
FCEV Truck
• H2 FCEV powered truck
• 500 – 750 mile range
• Attractive “bundle
pricing” model (truck, fuel,
maintenance)
Shorter-haul
BEV Truck
• BEV powered truck
• Industry-leading range of
up to 300 miles
• Leverages existing FCEV
work and partnership
with CNHI to co-develop
BEV truck for production
in the next 12 – 18
months
Capacity-as-a-Service
Autonomous Ready
• Level 4 hardware
standard
• Automatic braking and
lane keeping
• Full fleet management
solutions and data
capturing
• Over-the-air software
updates
Energy-as-a-Service
Grid Storage and
BEV Charging
• Leverage technology and
infrastructure to act as a
grid buffer and to capture
intermittent energy
sources
• Provide BEV charging
solutions to short-haul
customers
COWEN.COM4
COWEN
EQUITY RESEARCH
Nikola Corporation
June 17, 2020
Figure 3 – Nikola One Figure 4 – Nikola Two Figure 5 – Nikola Tre
Source: Nikola Corporation
The Nikola One, which debuted in late 2016 as a prototype, features a 250 kWh EV
battery supplying 6 traction electric motors. The Nikola One is a hydrogen fuel cell
electric semi sleeper truck for the North American market. At the time of the launch,
U.S. Express reserved 5,000 fuel cell trucks, albeit with no money down. Nikola at the
time was aiming to have the truck out in 2020; however, now the fuel cell variant is
available in 2023. U.S. Xpress, the fifth largest asset based truckload carrier in the U.S.
with about 6,800 trucks is still using the announcement as part of a hiring push (HERE).
We believe the advanced features of the truck as well as the “cool” factor will help fleets
compete for drivers in a tight labor market for the commercial driving profession. A
Freightwaves article published in March 2017 discussed some of the operational
advantages the vehicle would offer U.S. Xpress. Note Nikola initially was offering 1
million miles of fuel; however, now is offering 700,000 miles, or 100,000 miles per year.
U.S. Xpress makes up more than one-third of the 14,600+ reservations on hand for the
fuel cell truck. We assume the fuel cell trucks that Nikola develops will achieve about 7
to 8 miles per kilogram of hydrogen in most conditions. Management believes that
about 90% of routes in Europe can use a 60kg tank, which would offer a range of 450
miles, and in North America an 80kg tank, which would offer a range of ~600 miles.
The fuel cell electric Nikola Two, is similar to the One but is a day cab features 80kg of
hydrogen storage in type IV carbon fiber tanks that fuels the two fuel cells, which have a
combined 240kW output to charge the 250kWh lithium-ion battery at the base of the
vehicle that powers six 800 Volt AC motors. The company believes that the low weight
of the fuel tanks and purpose-built design will result in the truck weighing 5-7K pounds
less than a similar diesel truck, while still having an estimated range of 500-750 miles
and a 15-20 minute refuel times and looks to compete with or exceed diesel trucks from
a performance standpoint. The ~175 pounds of on-board hydrogen stores ~3MWh of
energy and Nikola estimated at its annual Nikola World exhibition last year that it would
take ~30k pounds of lithium-ion batteries to store a similar amount of energy, making it
not feasible for long-haul trucking. For customers that do not need the range of 500-
750 miles, such as those around cities, the company is offering a BEV version that would
have a smaller range. Both the FCEV and BEV would contain similar architectures, with
the hydrogen tanks and fuel cell replaced with a larger battery pack in the BEV version.
Creating the technology required to power Nikola One and Nikola Two — their zero-
emissions hydrogen fuel cell trucks — required the engineering teams from Bosch, TE
Connectivity, and others to solve for very unique requirements. The teams needed to
develop a powertrain capable of delivering up to 1,000 horsepower, with 2,000 ft-lbs of
torque, provide capacity to carry a 110,000 pound load, achieve full recharge in 15
minutes, and display real-time performance data. The fuel cell variant of the trucks still
has a smaller lithium ion battery, largely for regenerative braking, constant connectivity
COWEN.COM 5
COWEN
EQUITY RESEARCH
Nikola Corporation
June 17, 2020
to allow for over the air (OTA) software updates, and cold starts. We believe that Bosch
has chosen PowerCell as the fuel cell vendor for the Nikola trucks. PowerCell has a long
history in the fuel cell space, having initially been owned by Volvo in Sweden.
The Nikola Tre is an all-electric truck that was unveiled in December 2019 in partnership
with CNH/Iveco. The truck will be built at Iveco’s Ulm, Germany factory and initially be
imported to the United States but also likely be sold in Europe. Iveco is part of Case
New Holland (CNH) and is Europe’s smallest traditional truck maker, competing with
Daimler, Volkswagen and Volvo among others. The prototype of the Nikola Tre was
revealed just three months after the partnership and investment from CNH/Iveco was
announced. Under their agreement, CNH took a $250 million stake in Nikola - comprised
of $100 million in cash and $150 million in services, giving the U.S. company scale and
manufacturing capacity for its various platforms. The truck will initially be all electric but
will have a fuel cell variant in 2023. We believe the Nikola partnership is CNH/Iveco’s
2025 emission compliance strategy. European truck manufacturers will be required to
cut carbon dioxide emissions from new trucks on average by 15% from 2025 and by
30% from 2030, compared with 2019 levels. Note that CNH said in September it would
spin off Iveco and list it separately at the beginning of 2021. The Nikola Tre is based on
the Iveco S-Way platform, a cab over engine truck manufactured since 2019 by the
Italian producer Iveco. Iveco will gain access to Nikola’s electrical technology and
infotainment systems and Nikola will be using many of the components from the Iveco
“parts bin” to manufacture the trucks. FPT Industries out of Turin, Italy, which is part of
Fiat Power Train, will be building the eAxles, the cabs will be made in Madrid, Spain and
final assembly will be done at the Iveco site in Ulm, Germany and then exported directly
to the United States.
Figure 6 – One Platform, Two Powertrains
Source: Nikola Corporation
Nikola's plan offers the most compelling solution we have seen thus far to the chicken
and egg problem for hydrogen infrastructure and consumption that has long plagued
the fuel cell industry and inhibited broader adoption of lower emission technologies
within the heavy-duty transportation sector. The Class 8 market has largely shifted to
COWEN.COM6
COWEN
EQUITY RESEARCH
Nikola Corporation
June 17, 2020
natural gas engines from Cummins to help reduce CO2 emissions in specific areas such
as California, and we see the hybrid fuel cell/battery solution as an intriguing
development.
We believe for Nikola to be successful in the first 10 years of production for the fuel cell
variant the company only needs to have 20 to 25 customers as they will look to phase in
leases for fuel cell trucks on dedicated routes as the stations are build out.
Nikola's strategy of pricing per mile in a lease that bundles in the truck along with both
fuel and service is likely to be viewed as attractive by fleet operators given it provides
stability and predictability that is not possible with diesel and avoids concerns on
residual value. The company has targeted $0.95 per mile, which is competitive with
diesel at $0.95-$1.10, but unlike diesel the price will be fixed due to the Nel hydrogen
partnership and not fluctuate based on the inability to hedge the price of diesel over
long durations. Service is also included in the lease price, with access to the ~800 U.S.
Ryder locations built in as well as with other service providers around the country.
While most truck OEMs are in the high teens to 25% gross margins, we believe Nikola
can trend to 25-30% because of the fueling revenue contribution, which largely kicks in
later in the decade as the fuel cell vehicles roll out to new fleets and stations are build.
We believe the target model below can be obtained by 2029 or 2030.
Figure 7 -Margins Step Up in 2025 as Fueling Revenue Ramps and Costs Decline for BEV/FCEV
Source: Cowen and Company
Note we are assuming the first two years of production are negative GM for the BEV
truck. By 2026 we believe cost reductions in fuel cells and related tanks can drive parity
pricing for BEVs and FCEVs at approximately $180,000 per unit of cost.
Figure 8 – Key BEV and FCEV Unit Modeling Assumptions
Source: Cowen and Company
We see the hydrogen station investment for the company largely tapering off after
2028. While stations under construction peaks in 2026, it takes about 1.5 to 2 years to
finish a station.
Nikola Long Term Model Summary
2021E 2022E 2023E 2024E 2025E 2026E 2027E Target
Revenue (y/y) - 264% 371% 128% 75% 37% 34% -
Gross Margin -14% -1% 11% 17% 25% 27% 27% 30%
Operating Expenses 363% 93% 30% 20% 19% 21% 19% 15% - 17%
Operating Margin -377% -94% -18% 6% 12% 12% 14% 13% - 15%
2021E 2022E 2023E 2024E 2025E 2026E 2027E
Trucks (BEVs)
Deliveries 330 1,200 3,500 7,000 10,000 11,700 12,750
ASP ($k) $250 $250 $250 $250 $250 $250 $250
Cost per Unit ($k) $285 $254 $211 $201 $184 $180 $180
Trucks (FCEVs)
Deliveries - - 2,000 5,000 10,000 13,800 19,250
ASP ($k) - - $235 $235 $235 $235 $235
Cost per Unit ($k) - - $236 $210 $188 $180 $180
COWEN.COM 7
COWEN
EQUITY RESEARCH
Nikola Corporation
June 17, 2020
Figure 9 – Key Hydrogen Station Assumptions
Source: Cowen and Company
Battery and Fuel Cell Class 8 Trucks are Becoming Competitive
Battery electric drivetrains have become competitive with diesel trucks for lighter loads
or shorter distances on a total cost of ownership basis. For the longer range and
especially with heavier loads, all electric trucks are less practical. As battery energy
density and costs fall, we would expect range to increase. We note that Nikola is
focused on both fuel cell trucks, which will be used for dedicated routes on longer hauls
as well as all electric trucks, which are focused on the sub-350-mile market. We would
highlight that Cummins, covered by Matt Elkott shares this view on range as they have
acquired Hydrogenics in order to enter the fuel cell and electrolyzer market.
While a battery electric drivetrain’s cost of ownership increases as range increases, a
fuel cell based drivetrain has a relatively flat relationship with range, similar to the
diesel vehicles that it seeks to displace. To increase the range of a fuel cell truck, all an
OEM needs to do is increase the size of the onboard hydrogen tanks.
2021E 2022E 2023E 2024E 2025E 2026E 2027E
Hydrogen Stations
Hydrogen Stations Placed Under Construction 2 13 28 57 98 108 100
Cumulative Hydrogen Stations Placed in Service (Can be under construction) 2 15 43 100 198 306 406
Stations Completed and Available for Fueling in Period - - 10 14 34 68 106
Cumulative Hydrogen Stations Available for Fueling - - 10 24 58 126 232
Total FCEV Trucks in Service - - 2,000 7,000 17,000 30,800 50,050
COWEN.COM8
COWEN
EQUITY RESEARCH
Nikola Corporation
June 17, 2020
Figure 10 – Technology Comparison of Hydrogen, Battery Electric and Diesel Trucks
Source: Cowen and Company, Company Presentation
(1) Estimated hauling capacity includes both cargo capacity and the weight of the trailer
Weight is critical for trucks, both from a regulatory perspective but also from a
monetization perspective. The fuel cell variant of the Nikola is about 3,000 to 5,000
pounds lighter than its battery electric peer. A general rule of thumb in the trucking
industry is that every pound of cargo hauled is worth about $0.50 so weight limits on a
full load could cost the fleet up to $2,500 at the high end of the delta. Beyond range and
faster refueling, we believe operators that operate near the gross vehicle weight limits
of trucks will also favor hydrogen solutions to avoid this potential financial loss.
Potential Catalysts Ahead For The Stock
We see a variety of near-term catalysts emerging over the next two to three quarters
that in our view can further boost sentiment for the stock. Notably, we are monitoring
the following, which we see a high likelihood of occurring and would be additive to our
initial modeling of the company:
1) Potential for CNH/Iveco’s facility to produce fuel cell and all electric trucks for the
European market.
2) A strategic partner or partners announced for hydrogen fueling
3) A formal launch of the Badger pickup truck leveraging a third party manufacturing
partner
We explore each of these potential catalysts below:
Hydrogen-Electric 100% Battery Electric Diesel
Primary Power Unit (PPU) Hydrogen Fuel Cell Battery Diesel Engine
Refuel/Charge Time 10-15 minutes Several Hours 10-15 minutes
Est. Range
500-750 miles
(Long-haul)
100-350 miles
(Medium-/Short-haul)
500-750 miles
Refill Affect on Electrical Grid
Hydrogen stations act
as buffer & balance grid
Recharge to be managed within grid
load capacity
N/A
PPU Sustainability Profile
Hydrogen is the most
abundant element on planet
Dependent on further advances in
technology
Access to oil reserves can be costly
and prices are highly volatile
Impact on Emissions Zero emission vehicle Zero emission vehicle
Heavy emission vehicle unlikely to
adhere to future regulations on
emissions standards
Est. Vehicle Weight ~22,000 - 24,000 lbs ~25,000-27,000 lbs ~17,000-19,000 lbs
Est. Hauling Capacity(1)
~56,000-58,000 lbs ~53,000-55,000 lbs ~61,000-63,000 lbs
Complementary
Use Cases
COWEN.COM 9
COWEN
EQUITY RESEARCH
Nikola Corporation
June 17, 2020
Europe Momentum - We are upbeat about potential market developments in Europe
given the CO2 regulations in Europe requiring heavy duty vehicles to reduce emissions
by 15% in 2025 and 30% in 2030. In some cases, the failure to comply with the 2025
target could penalize OEMs by as much as €38k per truck. Even absent the fine, we
believe OEMs could see a payback of less than 2 years depending on operating needs.
Europe is much further along in embracing hydrogen as a fuel and given the already
heavy renewable energy penetration rates, we see a solid opportunity to pair surplus
electricity generation with multi-MW electrolyzers to generate cost effective hydrogen
relative to the elevated prices of diesel in the region relative to the United States.
Third party researcher Bloomberg New Energy Finance expects a sharp uptick in fuel
cell heavy duty trucks in 2026, with the market surpassing 2100 units, up from about
450 in 2023. While we believe their forecasts are extremely conservative, we believe
the timing of the hockey stick and regional focus on Europe and the United States are
correct, with China dominating longer term.
Figure 11 – Anticipated Fuel Cell Heavy Duty Commercial Vehicle Sales (‘000)
Source: Bloomberg New Energy Finance, Cowen and Company
Fueling Partnership: Nikola has a strategic partner for many of the key facets of its
business; however, on the hydrogen fueling side the puzzle pieces are only in place for
electrolyzers with NEL equipment and 174 Power Global, a division of Hanwha Group in
Korea, to supply solar panels and potential solar farms that would feed the needed 17.6
MW of electricity needed for each hydrogen station. We would expect management to
look to partner with other suppliers as they seek to build out ~400 potential stations
across the United States and Southern Canada and potentially expand to Europe at
some point in time. Note that ~400 stations should cover the dedicated routes in North
America; however, if the company were to target all of the 1.8 million trucks on the road
today, an additional 300 stations would need to be build out for non-dedicated routes.
We believe the company will focus exclusively on dedicated routes for the first 10 to 12
years of production. Domestically we could envision a partnership or joint venture with
a truck stop chain, similar to what Clean Energy Fuels did with Pilot for natural gas, or
perhaps partner with a more strategic oil & gas company such as Shell or Total. Both
have extensive experience with Hydrogen and Total is already building out stations in
Germany as part of a consortium (more details HERE). Beyond potential capital and
revenue sharing, a major global oil & gas partner could offer expertise in energy trading,
electricity procurement and carbon compliance. We would highlight electricity
-
20
40
60
80
100
120
140
2020 2025 2030 2035 2040
China Europe U.S.
Japan South Korea India
Rest of World
COWEN.COM10
COWEN
EQUITY RESEARCH
Nikola Corporation
June 17, 2020
procurement monitoring as a particular area of focus because electricity comprises
about 85% of the cost to produce hydrogen through electrolysis, thus if a partner were
monitoring spot power prices near each station and taking advantage of disconnects in
pricing which occur frequently on a temporary basis due to heavy renewable electricity
penetration from wind and solar, hydrogen generation through electrolysis could be
viewed as a form of arbitrage and using storage tanks as a means of generating very
cost effective fuel.
We note that Nikola has joined, and currently leads, a consortium of partners and
competitors to create a standard on dispensing equipment so that stations can be
utilized by Nikola and its competitors without fears of compatibility. Air Liquide,
Hyundai, NEL, Nikola Corporation, Shell and Toyota all signed a Memorandum of
Understanding (MOU) for hydrogen fueling components in early 2019. The cross-
industry group of both vehicle and infrastructure companies has signed the MOU with
the purpose to test pre-commercial 70MPa hydrogen heavy duty vehicle high flow
(H70HF) fueling hardware for future Class 8 (40 Ton) trucks. The industry group has
created specifications for the fueling nozzle, vehicle receptacle, dispenser hose and
breakaway device components
Badger Commercialization: We are not assuming any commercialization of the Nikola
Badger in our modeling, which is likely overly conservative. Management has noted they
would only look to commercialize the vehicle if another OEM manufactures it. Recent
press reports and tweets from founder Trevor Milton have noted that formal orders for
the vehicle will commence on June 29th
and that the company is considering three
potential manufacturing partners and the vehicle will be available for customer
deliveries in 2022 or earlier. What the complexion of such a manufacturing agreement
could look like is unclear. We would assume the company would pursue a manufacturing
deal with an existing OEM with excess capacity domestically or someone like a Magna
Steyer, a division of Magna that has over 100 years of experience in vehicle production
and is currently building the Jaguar E and I-Pace, Mercedes G Class, BMW Z5 and 5-
Series as well as the Toyota GR Supra. Magna Steyer also has a contract with Sony to
develop their new electric vehicle, which was launched at CES earlier this year. If Magna
was not the partner, then we believe a deal could be struck with a traditional domestic
OEM. Given the likely low utilization rates at many OEM facilities domestically, we
believe such as deal could be of interest under the right economic scenario for both
parties.
COWEN.COM 11
COWEN
EQUITY RESEARCH
Nikola Corporation
June 17, 2020
Figure 12 – Nikola Badger
Source: Nikola Corporation
Again, we are not assuming in our modeling or positive stance on the stock any success
for the Badger. We note that Chairman Trevor Milton noted via Twitter earlier this
month that on June 29th
reservations would open up for the vehicle and later in the
month on June 10th
said, “exciting news coming with the Badger soon.” Until a thorough
understanding of any launch related costs and timing for the truck are known, we would
rather err on the safe side and not include the vehicle in our model. The Badger truck
itself will be available as either a pure battery-electric or a battery-electric/fuel-cell
hybrid. The electric version will have a claimed 300 miles of range, while the fuel-cell
version will up that number to a claimed 600 miles. We would assume the electric only
version will be available prior to the hybrid fuel cell variant, similar to the cadence of the
truck launch.
We believe the Badger leveraged the Nikola NZT powertrain skateboard, an all-terrain
vehicle we describe further in this report. Press reports and interviews with
management on various podcasts suggest the battery pack will be 160 kWh in size.
Differentiation of Nikola Versus Tesla – Leverage Partners Versus Doing Everything In
House
Both Nikola and Tesla derived their corporate names from the same place, Nikola Tesla,
a Serbian-American who was an engineer and futurist and best known for his
contributions to the modern alternating current (AC) electricity supply system. While
both companies also have extremely charismatic founders who love Twitter and are
involved in the electrification of transportation, the similarities stop there. Elon Musk
has called fuel cells “fool cells”, “staggeringly dumb” a “load of rubbish” for several years
and noted at its annual shareholder meeting that “success is simply not possible” in
hydrogen fuel cells. We don’t see the situation as a zero-sum game and expect both
technologies to coexist in trucking, with range, weight needs and route determining
which technology is used. We see hydrogen as best suited for dedicated routes, which
make up about 20-25% of the 1.8 million Class 8 trucks on North American roadways
today. Keep in mind that Nikola is developing both kinds of trucks despite being known
as a fuel cell trucking company; they will have an all-electric version in 2021.
COWEN.COM12
COWEN
EQUITY RESEARCH
Nikola Corporation
June 17, 2020
While it remains to be seen which technology will win the tug of war for Class 8
trucking, we see both technologies playing a role depending on route and range needs
and believe Mr. Musk is overly simplifying things. While the technology debate between
the two parties will likely persist, we note both companies share similar societal goals in
hoping to revolutionize the transportation industry.
We have covered the fuel cell sector for 15 years now and up until the last 3 to 4 years,
the sector was largely made up of what we would put in the camp as publicly traded
science experiments, comprised of companies with a great deal of hope and associated
investor returns but plagued with high capital costs relative to existing technologies,
inadequate lifetime of the units and uncertainty on where cost efficient hydrogen would
come from. Over the past few years, fuel cell technology and battery technology have
both improved. Nikola is looking to leverage both and we note that about 90% of the
components in a fuel cell truck are the same as the electric variant.
While Nikola is looking to commercialize both fuel cell and battery technologies and
Tesla is looking at just electrified vehicles, the approach to commercialization is radically
different. Nikola’s approach is centered on creating a partner ecosystem, many of which
are co-investors in the company. The two most important partners in our minds are
Bosch and CNH/Iveco. Bosch was critical in accelerating battery and fuel cell integration
into the initial design. Iveco is the market share leader in natural gas engines in Europe,
having shipped over 30,000 units and worked with fleets in helping build out dedicated
natural gas routes. We believe Iveco’s connectivity with fleets that have a bias toward
alternative powertrains as well as robust dealer network can be an asset for Nikola to
leverage, especially as we move closer to 2025 when more stringent CO2 regulations
kick in. Intellectual property developed by Bosch and Nikola are co-owned by both
companies.
Figure 13 - Network of Strategic Partnerships Reduces Execution Risks, Improves Commercialization Timeline and Provides Long-Term Competitive
Advantage
Source: Cowen and Company, Company Presentation
• One of the world´s largest and most
recognized photovoltaic manufacturers
and energy providers
• Series C investor and exclusive solar
panel provider
• #1 global engineering service provider to
the Commercial Vehicle industry for cab
development
• Cab and Chassis engineer
• Largest producer of electrolyzers and
other hydrogen equipment
• Series C investor and hydrogen
production equipment supplier
(electrolyzers and other components for
hydrogen stations)
• Largest truck leasing company in the U.S.
with over 800 service centers and 6,000
highly trained technicians
• Primary but non-exclusive service
partner
• Leading global supplier of braking control
components and air management systems
to medium- and heavy-duty trucks
• Series B investor in Nikola and brake
traction and stability control system
developer
• World's largest independent company for
the development, simulation and testing of
powertrains
• Designer and developer of first-in-class
vehicle and hydrogen fuel cell test facility
• International leader in the development, manufacture, marketing,
and servicing of a vast range of light, medium, and heavy commercial
vehicles
• Series D investor and partner in 50/50 European joint venture and
North American production alliance
• Leading global supplier of technology and services to automotive,
industrial, energy, building technology, and consumer end markets
with ~410,000 employees and ~$90B in annual revenue
• Series B and C investor and powertrain design (e.g., fuel cell,
battery, VCU) co-development partner
• Any related IP will be jointly owned by Nikola
OTHER KEY INDUSTRY PARTNERS
MARQUEE CO-DEVELOPMENT PARTNERS
COWEN.COM 13
COWEN
EQUITY RESEARCH
Nikola Corporation
June 17, 2020
Given Elon Musk was already a billionaire when Tesla was formed, the company had the
luxury of aiming to internally develop and manufacture as much as possible, ranging
from seats to motors and inverters, all of which differentiate Tesla versus peers,
especially in terms of range and electrical efficiency of the battery. Since founder
Trevor Milton was not a billionaire and the company was fairly bootstrapped for cash in
the 2015 and 2016 timeframe, the company’s approach was to leverage partners and
jointly develop IP for a true hybrid fuel cell battery electric truck that had a zero
emission profile. Back in 2015 and 2016, the concept of zero emission trucking was not
actively being discussed or developed by other OEMs, thus we believe many Tier 1 and 2
suppliers were energized by the vision and willing to help. We believe Bosch and
Worthington were some of the key initial partners; however, overtime many more were
added as shown on the figure above but also other smaller partners such as TE
Connectivity and Meritor played a key role. Given the scope of zero emission
transportation has greatly evolved since 2015, we do not believe such an ecosystem of
high-profile strategic partners could be assembled by a startup in today’s environment
as there is less of a debate about the trajectory of zero emission transportation. Nikola’s
view is they aim to share the IP that is jointly developed on many of the facets of their
business.
While Nikola has leveraged extensive use of partners for the key components of the
vehicle and to build out its energy ecosystem, the company largely designed the exterior
and interior of the vehicle with its in-house design team. The infotainment and HMI
(human to machine interface) cluster centered around a 17” display and 13” instrument
cluster is compelling and differentiated in our view. This technology includes video
camera displays in rearview mirrors and digital displays equipped with programs to plan
routes and track mileage, sleep, and expenses. By designing the trucks to help truckers,
they are enabling transport companies to operate more efficiently. For example, the
truck’s data architecture is designed to support more autonomous functionality that can
be used in the future when regulations allow. When the industry decides to use these
features, transport companies can leverage the high-speed data connectivity to platoon
vehicles and predict maintenance, repair, and overall cost-of-ownership, making it easier
to manage the fleet and safer to operate on the road, while also helping reduce driver
errors and fatigue issues.
Figure 14 – Advanced Connectivity Features in the Nikola Two Figure 15 – Infotainment System Should Improve Trucker Experience
Source: Cowen and Company, Company Reports
COWEN.COM14
COWEN
EQUITY RESEARCH
Nikola Corporation
June 17, 2020
We would also note that Nikola filed a lawsuit against Tesla almost two years ago,
claiming that Tesla’s Semi Truck infringed upon a series of three patents for the original
Nikola One truck.
Nikola’s lawsuit against Tesla is centered around the similarities between the trucks
design, with Nikola claiming the fuselage of the tesla semi is too similar to the design of
the Nikola One, which was publicly revealed a year earlier than Tesla’s. The specific
claims are centered around the fuselage itself, the windshield design and the mid-entry
door design with the folding and retractable step. Thus far, the U.S. Patent Office has
upheld Nikola’s patents upon appeal by Tesla.
As noted above, Nikola has leveraged partners to develop prototypes quickly. We
believe a common question investors have among many about the Nikola investment
case is where does the IP reside. Similar to any vehicle, a series of Tier 1 suppliers have
put together the key building blocks for the 3 generations of Nikola trucks. We see the
core IP of Nikola being the business model as they are largely an infrastructure and
energy company that also makes trucks. The unique value proposition of fuel certainty
would not be available to potential customers without the fueling. We believe Bosch
and CNH/Iveco largely derisk the ramp up relative to other startups who are attempting
to do everything inhouse such as Tesla. Over time, now that Nikola has ample liquidity,
we could see some key differentiated components brought in-house. Perusing the
company’s current job postings as of the publication of this report suggests that is the
direction they are headed. Openings for inverter engineers, firmware, software and
system architecture engineers to us suggest the company will expand on some of the
key building blocks that partners have developed.
Nikola also noted in a November 19, 2019 press release that they have developed a
1,100 watt-hours per kilogram lithium ion battery, which would double the range of a
vehicle, reduce weight by ~40% and cut 50% of the material cost per kWh compared to
existing lithium ion batteries. In subsequent press interviews, it became clear that
Nikola has only manufactured these cells with smaller form factor pouch cells relative to
what is needed in a vehicle or truck. Migrating to larger form factors has been a
challenge for numerous startups as coin sized cells migrate to full sized units. While we
are unclear of the specifics of the battery claim and are not assuming any success in our
modeling, press reports with founder Trevor Milton noted the battery eliminates costly
cathode components such as nickel, cobalt and magnesium and uses a “while different
type of chemical with a lithium component.” In a Forbes interview, Mr. Milton noted
that the battery was developed by an unnamed university lab Nikola was involved with
and they have “locked up all the IP.” With the battery development, Nikola has added 15
PhDs and 5 master’s degree team members from the unnamed company. There are
numerous alternative form factors and chemistry combinations for lithium-based
batteries, so it is unclear if Nikola is working on a sulfur-based battery leveraging lithium
metal, some form of solid state, or something else. Other press reports noted that the
battery is more conductive than standard 2170 form factor cells given the Nikola
approach removes binder material and electric current collectors from the cell, which
take up weight and space within the battery. We note that Daimler has some intensive
work underway in lithium sulfur batteries as well as we were in attendance for their
battery update at last year’s International Battery Seminar presentation. The team from
Daimler noted challenges with liquid electrolyte to lithium sulfur ratios (E/S ratio) and
cycle life and challenges with Wh/L, however if higher abuse tolerances could be
achieved, they felt it could be commercialized. Now that the company is publicly traded,
we would expect more details to emerge at some point; however, we are assuming no
commercialization of any in-house developed battery technology and anticipate Nikola
will use off the shelf 2170 format cylindrical cells and do their own pack assembly,
similar to what Tesla does today at the Gigafactory leveraging Panasonic cells. Note
COWEN.COM 15
COWEN
EQUITY RESEARCH
Nikola Corporation
June 17, 2020
Nikola, nor Bosch that we are aware of, does not have a framework agreement with a
cell vendor similar to Tesla’s with Panasonic. Commentary from Nikola management at
their April 2020 analyst day for the sell side noted the company works with all 3 major
cell vendors (LG, Samsung SDI and Panasonic).
Unique Business Model – Pay Per Mile Instead of Buying the Truck
Nikola is offering a differentiated bundled lease model, which provides customers with
the fuel cell truck, hydrogen fuel, and maintenance for a fixed price per mile, locks in fuel
demand and significantly de-risks infrastructure development. Note that the bundled
truck, fuel and service model is only offered with the fuel cell variants of Nikola’s trucks
whereas the all-electric trucks do not offer the bundle and revenue recognition is just at
the time of the sale.
Figure 16 – Nikola Revenue Segmentation
Source: Cowen and Company
We highlight that the company as of the date of the IPO had 800 trucks from Anheuser
Busch that had a legally binding contract and a reservation list of 14,600 trucks.
Typically, fleets place deposits on trucks when they have confidence that they will
receive their truck within 12 months. This is done in an effort to slot in new trucks into
the schedule of expiring leases. As we move closer to 2023, we would anticipate that
many fleets in this reservation base will migrate to formal contracts. The lack of
committed backlog has been a source of investor anxiety and we would expect
management to make every effort to convey growing backlog as orders materialize.
Note that orders can only be taken from fleets operating on corridors that have fueling
built out, which has started between Los Angeles and Phoenix along Interstate 10;
however, we believe the Interstate 5 corridor north from Los Angeles to San Francisco
will be built out and then likely San Francisco to Reno along Interstate 80. Over time,
we expect the company to move eastward along Interstate 10 and 80 and branching out
to other Interstate routes.
Note the all-electric Nikola Tre also does not have a publicly announced backlog, but
given shipments are anticipated to commence in mid-2021, we would expect press
releases from Nikola in the coming months for the European built Nikola Tre.
Nikola Revenue Contribution by Key End Markets ($mn)
2021E 2022E 2023E 2024E 2025E 2026E 2027E
Truck - BEV $83 $300 $875 $1,750 $2,500 $2,925 $3,188
Truck - FCEV $0 $0 $470 $1,175 $2,350 $3,243 $4,524
Service & Maintenance $0 $0 $12 $54 $141 $278 $471
Hydrogen $0 $0 $56 $245 $640 $1,263 $2,139
Other Revenue (Powersports, Badger) $0 $0 $0 $0 $0 $0 $0
Total Revenue $83 $300 $1,413 $3,223 $5,631 $7,708 $10,321
COWEN.COM16
COWEN
EQUITY RESEARCH
Nikola Corporation
June 17, 2020
Figure 17 - Nikola’s Advantage: Bundled FCEV Offering is More Attractive Than Diesel
Source: Cowen and Company, Company Presentation
As fleet customers take delivery of their trucks, Nikola looks to securitize the truck
portion of the lease. Our model assumes they can extract ~$160,000 of value per truck
securitization assuming a 7% interest rate. We assume the actual truck price is
$235,000, so just under 70% of the value of the truck is being securitized to free up cash
for the company. Assuming a $0.95/mile subscription is entered into, that will generate
$665,000 of revenue over the 7-year term. We believe about ~35% of the $665,000
revenue stream is allocated to the fuel cell truck, ~50% to the fuel and the remaining
~15% is attributed to service and maintenance.
Some of the basic math to drive our revenue assumptions for the fuel cell related trucks
are as follows:
 Lifetime Revenue - $0.95/mile x 100,000 miles/year x 7 years = $665,000
 Assumed truck price of $235,000 – because it is securitized, revenue
recognition for this portion of the revenue stream can occur immediately as
the lease commences - $235,000/$665,000 = ~35%.
 Revenue attributable to fuel – 700,000 miles / 7.5 miles per kg of hydrogen x
$3.75/kg price for fuel = $350,000, or ~53% of the total $665,000 revenue
stream. This revenue stream is recognized ratably over the 7-year lease. We
believe if Nikola can procure power at $35/MWh, that they can produce fuel at
$2.50/kg including depreciation. We estimate the sensitivity to electricity
prices, which make up ~85% of the cost to produce hydrogen is about $0.50-
0.60/kg for every $10 change in electricity price per MWh. Note that both
hydrogen trucks and diesel trucks get about 7-8 miles per unit of fuel, either
per gallon or per kilogram, so the price for hydrogen per kilogram needs to be
roughly in line with a 7-year average of diesel price per gallon to make
economic sense.
Total cost of ownership certainty
Historically, diesel fuel has comprised anywhere from 40-60% of
total ownership costs(1). Nikola’s Bundled Lease offers operators
complete cost predictability at cost parity with diesel
Better Performance
Outperforms diesel and battery trucks in range, horsepower and
torque. Shorter recharge time than battery electric trucks
Enhanced Safety
6x2 drive, torque vectoring, faster stopping, lower center of
gravity
Hydrogen Safer than Diesel
Lower vapor pressure, will not form combustible mixture with air,
harder to ignite, hydrogen dissipates into atmosphere
Extensive safety testing performed by third-party experts
Environmentally Friendly
Zero emissions and nearly silent. Hydrogen stations powered by
renewables
Autonomous Ready
Enhanced autopilot, automatic braking, and automatic lane keeping
standard on each vehicle
THE INDUSTRY’S FIRST EVER “BUNDLED PRICING”
PROJECTED NIKOLA VS. DIESEL COST PER MILE
• 7-year lease/700,000 miles
• Lease includes the cost of truck, hydrogen fuel, repair,
and maintenance
• Lease model eliminatespayback period and technology
risk for customers, enablingmore rapid adoption
Includes all
vehicle, service
& maintenance
and fuel costs
Fuel Cost:
~$0.51 per Mile
Service & Maint:
~$0.21 Per Mile
Vehicle
Payments:
~$0.26 per Mile
$0.00
$0.20
$0.40
$0.60
$0.80
$1.00
$1.20
Nikola Traditional Diesel
Total TCO:
$0.95 per Mile
Total TCO(2):
~$0.97 per Mile
COWEN.COM 17
COWEN
EQUITY RESEARCH
Nikola Corporation
June 17, 2020
 Lastly, service is anticipated to be just under 15% of the revenue stream at
about $80,000 over the 7 years. We are assuming service makes up about 11
cents per mile and that it costs about 7% of revenue. We see this as the
segment of the model with the most likely volatility and uncertainty. Nikola
originally signed a service agreement with Ryder in 2016 that was exclusive;
however, both parties have agreed to release the exclusivity clause in recent
weeks. Service and maintenance cost of goods are booked in the P&L as they
are incurred and the cash flow impact is also booked as service & maintenance
is provided. Fuel cell trucks are anticipated to have substantially lower service
and maintenance needs per mile tan diesel trucks, mainly due to fewer
mechanical moving pieces relative to diesel.
Figure 18 - Single Fuel Cell Truck Lease Unit Economics
Source: Cowen and Company, Company Presentation
1) Analysis does not include potential financing charges that may be incurred to securitize and monetize some portion of the Nikola lease
2) Hydrogen fuel cost includes all hydrogen station related operating expenses including electricity costs, water costs, station personnel cost, and hydrogen station
maintenance
3) Vehicle profit presented before corporate general and administrative expenses
4) Assumes each station has a 21-year useful life and supports 210 truck leases during each 7-year lease period
5) Does not include any potential upside from truck residual value at the end of the lease
Nikola will use securitizations to recycle capital from the fuel cell 7 year leases. Our
model assumes a 7% interest rate, 7 year loan term with a ~70% loan to value, which
leads to a 1.7x debt service coverage ratio assuming a price of $235,000 for the truck
and approximately $160,000 of initial cash flow is securitized. We believe such a
structure could be setup with an investment bank or perhaps with a financial arm of
Cash New Holland.
PROJECTED CASH GENERATED PER TRUCK LEASE PROJECTED LEASE MODEL ECONOMICS
$665,000
$188,174
$230,637
$46,760
$26,365
$173,064
Lease Revenue Truck Materials
& Labor
Total Fueling
Cost
Service, Maint.
& Other
Station Capex
Per Lease
Cash Per Truck
Lease
Projected Nikola Lease Model Economics (1)
Gross Revenue $665,000
Materials $173,624
Labor - direct and indirect 7,500
Warranty Expense @ 3.0% of Truck Revenue 7,050
Truck Cost $188,174
Nikola Cost per kg of Hydrogen $2.47
x kg of Hydrogen used over 700,000 miles @ 7.5 Miles/kg 93,333
Hydrogen Cost Per Truck Lease(2)
$230,637
Service & Maintenance Cost @ $0.067/Mile $46,760
Total Service & Maintenance Cost $46,760
Total Cost of Nikola Lease $465,571
Vehicle Profit Per Nikola Lease (Before Corporate G&A)(3)
$199,429
Vehicle Profit Margin 30.0%
Station CapEx per Lease(4)
$26,365
Cash Generated per Truck Lease(5)
$173,064
Each individual FCEV truck lease is anticipated to have steady cash generation over the life of the lease
COWEN.COM18
COWEN
EQUITY RESEARCH
Nikola Corporation
June 17, 2020
Figure 19 – Nikola Illustrative Example of Securitization Structure
Source: Nikola Corporation (April 2020 Analyst Day)
The lease model with the accompanying securitizations has an impact on the timing of
revenue recognition and associated cash flow. The company has provided a helpful
illustrative example regarding the matter.
COWEN.COM 19
COWEN
EQUITY RESEARCH
Nikola Corporation
June 17, 2020
Figure 20 – Illustrative Fuel Cell Truck P&L and Cash Flow
Source: Nikola Corporation (April 2020 Analyst Day)
1) Numbers in the table illustrate approximate amounts to which Nikola on average expects to receive from FCEV lease
2) Numbers in the table per lease year does not sum to the total lease value due to rounding
Opportunities Outside Trucking Look Intriguing But Path to Commercialization For
Nikola is Unclear
We note that Nikola has developed several products in its Powersports division, aiming
to leverage a “halo effect” of the brand. Outside of potential success with the Reckless
with the Marines and other affiliated Department of Defense agencies, we are not
hopeful on any of the products on this segment. We view them largely as a distraction
for management, with a different channel to market, service and repair. While we find
the product features compelling, we just don’t believe management should be spending
time in commercializing these products. The NZT, which stands for net zero toll, and
Reckless were initially focused on by Nikola because the platforms allowed for faster
testing of suspension components from Meritor now used on the truck, motor design,
batteries and battery management software. Now that those features have all been
fully baked, we believe these additional projects should only be explored if they can be
done in a capex light manner through the use of a third party for manufacturing. We
believe there is also optionality to do a joint venture with a partner for this segment or
to divest it at some point in time as well.
COWEN.COM20
COWEN
EQUITY RESEARCH
Nikola Corporation
June 17, 2020
Figure 21 – Nikola NZT Figure 22 Reckless Figure 23 – Nikola WAV
Source: Nikola Corporation
The NZT is an off-highway vehicle (OHV) that Nikola is marketing. The company’s
website indicates that the NZT will start production in 2021 and pricing starts at
$80,000. With HVAC, torque vectoring, infotainment/HMI, and ABS brakes pricing is
anticipated to be $95,000-$100,000. There are two primary variants of the NZT, the
NZT 198 which has a 198kw offering 266hp as well as the NZT Limited, which is based
on a 440kw drivetrain pumping out 590hp. The NZT also has 3 different battery pack
sizes, ranging from 75 kWh, 100 kWh and 125 kWh, offering ranges of 90, 120 and 150
miles respectively.
Targeting the military, the Reckless is based on the NZT platform and the company was
awarded a $4.35mn contract in October 2019 in conjunction with Pratt & Miller
Engineering to integrate fuel cells. Nikola received $1mn of the $4.35mn project. The
Reckless OHV (off highway vehicle) is a completely electric vehicle that can go from 0 to
100 kilometers-per-hour in just over three seconds. The vehicle has a modular capability
that can plug and play with a remote weapons station and military drones. The Reckless
uses a 125-kWh battery pumping out 555hp and 4,900 ft-lbs. of torque with four
separate electric motors. The vehicle is named after Staff Sergeant Reckless, a heavily
decorated war horse in the United States Marines during the Korean War that delivered
supplies without a handler to the front lines of battle. The Reckless was initially called
the Nikola Zero and tested by the Marines at Camp Pendleton in 2017, largely against
the Polaris RZR line. The goal of the Reckless design is to be narrow enough to fit into a
V-22 Osprey aircraft. The vehicle also has a low acoustic and thermal signature. The
vehicle can also act as a generator for the military, exporting 15kw of power.
Lastly, the Nikola WAV is a jet ski style vehicle that Nikola has introduced that features
some high tech attributes including a 12-inch, 4K display embedded in the dash and LED
lights in the front and back of the vehicle. Nikola has developed a battery architecture
specifically for watercraft. The company’s website has no expected production date or
cost available; however, they are taking no money down reservation orders.
COWEN.COM 21
COWEN
EQUITY RESEARCH
Nikola Corporation
June 17, 2020
What Is Not In Our Model That Could Be Upside
Our modeling of Nikola only assumes commercialization of the BEV and FCEV trucks and
related fueling and service. We believe there are multiple areas of upside to our model;
however, handicapping the probabilities of success in any of the areas highlighted below
is a challenge, thus we have elected to exclude them.
 Powersports – assume no revenue from NZT, Reckless and WAV
 We are assuming the JV with CNH/Iveco only produces BEV trucks from 2021
to 2023 until manufacturing migrates to the Coolidge, Arizona facility in the
Summer of 2023. We see a high probability that this is overly conservative,
especially as Iveco moves closer to the 2025 CO2 mandates in Europe.
 We are assuming zero residual value for the leased vehicles, which could be
overly conservative.
 We are assuming no success for autonomous trucking in our model. We
believe that fleets could be in a position to pay Nikola about $0.40/mile should
autonomous trucking work. Nikola's trucks are designed with autonomous
driving in mind, which may provide revenue to Nikola in the future as well as
potential cost savings to customers. All Nikola products will be built with a
space claim for an autonomous hardware suite. Given the nature of Nikola’s
dedicated route customers, operating point-to-point interstate routes between
its hydrogen stations, Nikola’s trucks provide an ideal testing environment for
further development and advancement of autonomous technology. When the
various regulatory agencies have approved some level of autonomy, the
company will likely consider a partnership with a software vendor. We note
Bosch is already developing such software for Daimler and others in the light
duty vehicle market.
 We are not assuming any success in energy optimization, where the company
could essentially use electrolyzers and related hydrogen storage tanks as a
form of economic arbitrage. The increased volatility from renewable energy
creates a distorted energy production curve, resulting in both predictable (e.g.,
the sun comes out every day) and unpredictable (e.g., the wind blows stronger
on some days compared to others) surplus energy production capacity. This
surplus energy typically goes unused, and in extreme cases must be traded
away at zero or even negative revenue to the utility provider. Hydrogen
production can be used to balance the grid by taking excess energy production
and storing it for future use. Nikola can also help balance the grid by allowing
utilities and power providers to interrupt hydrogen station electricity
consumption during peak demand. Nikola's ability to turn excess energy into
hydrogen may offer operators and energy providers the ability to increase
revenue by selling otherwise wasted off-peak generating capacity.
Additionally, the ability to store unused energy in the form of hydrogen
reduces the need for peak power generating plants that are typically costly to
build and operate, and that historically are heavily underutilized. Instead,
Nikola could potentially build excess hydrogen storage on-site, then sell excess
hydrogen back to the grid during periods of peak demand. It is this area where
we think a partnership with a Shell, Total or other energy production and
trading firms would make strategic sense. Each station in its current design
has about 30 hours of hydrogen storage, assuming full utilization of about 210
trucks per day. The level of storage could be opportunistically increased in
certain geographies that have more volatile swings in electricity pricing such as
the Texas panhandle from excess wind power production.
COWEN.COM22
COWEN
EQUITY RESEARCH
Nikola Corporation
June 17, 2020
Figure 24 – Volatile Energy Production Curves Created by Renewable
Power Create an Opportunity for Electrolyzers
Figure 25 – Beyond Fuel, Hydrogen Can Be Used as a Power Source
Source: Nikola Corporation
 We are assuming the company does not receive any form of government
incentives, either for the purchase of the truck or state or regional programs
such as the low-carbon fuel standard (LCFS) in California. Given the bevy of
government incentives that in recent weeks have accelerated, in particular in
Europe, we believe this is another area of conservatism in the model. The
Nikola team has noted in recent investor presentations that the LCFS credit in
California could offset the capital cost of the facility by $5-10 million. Note
Nikola plans to build 10 to 12 stations in California.
COWEN.COM 23
COWEN
EQUITY RESEARCH
Nikola Corporation
June 17, 2020
Figure 26 – Summary of Notable Policies Supporting Fuel Cell Vehicles
Source: Bloomberg New Energy Finance
Coolidge, Arizona Manufacturing Facility Ramp Key to the 2023 and Beyond Story
In the Spring of 2019, Nikola acquired about 400 acres of land in Coolidge, Arizona,
which is about 50 miles south of Phoenix, Arizona. The land, which was bought for an
undisclosed sum, is located in the Inland Port Arizona industrial park, which is served by
rail and truck. Rail abuts the property and Interstates 10 and 8 are nearby.
Nikola intends to break ground on the Coolidge site in 3Q20, with the aim of having
initial final assembly possible in late 2021. The company expects 5,000-unit capacity in
Coolidge in early 2022 and reaching a full capacity available of 45,000-50,000 units by
the end of 2023 assuming the factory runs 2 shifts. Should the company run 3 shifts,
we believe there is enough capacity to produce up to 55,000-60,000 trucks per annum.
The company anticipates that one third of the capacity will be for BEVs, with the
remainder for FCEVs. We note that both trucks can be manufactured on the same
assembly line and they have ~90% parts commonality between them.
COWEN.COM24
COWEN
EQUITY RESEARCH
Nikola Corporation
June 17, 2020
Beginning in 2021, Nikola expects to utilize existing excess capacity at Iveco's Ulm,
Germany plant to begin production of the Nikola Tre BEV for U.S. delivery. These first
trucks will be imported into the U.S. to fulfill launch customer orders. Nikola will also
build the Nikola Tre (both BEV and FCEV) for the European market in Iveco's Ulm,
Germany facility. The Ulm facility has the ability or product 5,000-10,000 trucks per
year. The company expects most 2021 BEV sales to be focused on California and New
York, states that have incentives. The trucks will focus on urban metro, inner city, local
delivery, port operations and drayage operations applications. We believe one to two
launch customers will be announced in the coming months and participate in initial fleet
testing and initial production of the all-electric Nikola Tre.
The company has laid out several phases of construction for investors to monitor:
Phase 1—Low Volume Production—up to 5,000 units per year:
 Begin construction mid-2020
 Warehouse space (approximately 100,000 - 150,000 square feet)
 Low-volume production capacity (approximately 5,000 units per year)
 Complete construction by the end of 2021
 Commissioning and start-up with Nikola Tre BEV in production in Q1 2022
Phase 2—High Volume Production—up to 50,000 units per year:
 Begin construction early-2021
 Complete manufacturing facility (approximately 1,000,000 square feet)
 High-volume production capacity (approximately 50,000 units per year)
 Complete construction by the end of 2022
 Commissioning and start-up with Nikola Two FCEV in production in Q1 2023
A Deeper Look into the Heavy Duty Commercial Trucking Market
The global commercial vehicle market, in its broadest definition, includes light, medium,
and heavy-duty trucks, buses, RVs, vans, and other commercial vehicles. We estimate it
to be well in excess of $1.0 trillion dollars in revenue globally. The US pure-play truck
OEMs operate primarily in the truck manufacturing market, and within that, primarily in
the medium and heavy-duty markets. Narrowing down the market further, heavy-duty
(class 8 and 7) trucks in North America constitute one half to just over two thirds of
OEM business. PACCAR and Navistar are the only US-based, pure play commercial
vehicle OEMs. Nikola is aiming to join the crowd in 2021 with the launch of their battery
electric truck.
COWEN.COM 25
COWEN
EQUITY RESEARCH
Nikola Corporation
June 17, 2020
Figure 27 : Overview of Commercial Vehicle Classifications
Source: Cowen and Company estimates and DOT
End markets for heavy-duty trucks include industrial, consumer, and vocational
applications in the truckload, LTL, and other freight industries. Additionally, many non-
freight companies and government agencies have their own trucking fleets. Medium-
duty trucks are used in parcel service and local pickup and delivery operations as well as
in lighter vocational applications.
Global Heavy-Duty Class 8 Truck Market
A subset of the global >6t truck market discussed above, the global Class 8 tractor
production market exceeds $250Bn in annual revenue, according to our estimate. This is
on production of more than 2.2MM units. We estimate that North America has a roughly
$45Bn market share, or just under 20% of global revenue. This is on production of
~325K units, or ~14% of global production.
Duty Class Gross Vehicle
Weight (lbs)
Class 1 0 - 6,000
Class 2 6,001 - 10,000
Class 3 10,001 - 14,000 ˂6t & ˃6t
Class 4 14,001 - 16,000
Class 5 16,001 - 19,500
Class 6 19,501 - 26,000 ˃6t Truck Market
Class 7 26,001 - 33,000
Class 8 33,001 - 80,000 ˃16t Truck Market
˂6t
Gross Vehicle Weight Classification (t)
Light Duty
Medium Duty
Heavy Duty
COWEN.COM26
COWEN
EQUITY RESEARCH
Nikola Corporation
June 17, 2020
Figure 28 : The Global Class 8 Production Market Consists of 20 Primary Manufacturers (2019)
Source: Cowen and Company estimates, PACCAR, ACT Research
Figure 29 : Daimler Enjoys the Largest Class 8 Market Share in the US, Followed by PACCAR – March 2020 Retail Sales
Source: Cowen and Company estimates, PACCAR, SEC filings, ACT Research
Daimler
(Freightliner,
Western Star)
40%
PACCAR
(Kenworth,
Peterbilt)
30%
Volvo (Volvo,
Mack)
19%
Navistar
11%
United StatesClass8 Market Share
COWEN.COM 27
COWEN
EQUITY RESEARCH
Nikola Corporation
June 17, 2020
Figure 30 - Historical and Projected US Class 8 Active Population and Average Age
Source: Cowen and Company estimates and ACT historical data
ACT Research segments the on-highway Class 8 freight market between private and
for-hire fleets, representing 53% and 47% of the Class 8 market, respectively. Private
fleets, such as Anheuser-Busch ("AB"), Walmart, are almost all regular route operations
or "dedicated" routes running point-to-point. The for-hire market, such as JB Hunt, XPO
Logistics, can be further broken down into: contract 32%, spot 12%, and dedicated 3%.
Dedicated for-hire fleets are mostly outsourced private fleets that run point-to-point.
Historically Relatively High Barriers to Entry; Powertrain Shift Presents Opportunity
for New Entrants
Unlike its customer base, which is highly fragmented, the North American heavy-duty
truck manufacturing market is dominated primarily by four companies controlling 99%
of the market: Daimler, PACCAR, Volvo, and Navistar. Of these, only PACCAR and
Navistar are U.S. based and can be considered pure-play truck OEMs.
The long-haul freight market is still dominated by diesel powertrains, given the fuel's
ubiquity and substantially higher energy density. However, in the post VW emissions
scandal era, governments have begun to examine emissions regulations more closely.
The charge has been most notably led by local government and cities primarily in
Europe, which have begun to set regulations limiting diesel vehicle usage or even
outright banning them. Given many OEMs operate on global production platforms the
industry expects to see widespread availability of alternative powertrains overtime.
COWEN.COM28
COWEN
EQUITY RESEARCH
Nikola Corporation
June 17, 2020
The short driving distances and frequent stop-and-go duty cycles of commercial vehicles
make them excellent candidates for incorporating cleaner modes of propulsion, which
can increase fuel economy by 30-40%, reduce harmful emission by up to 30% and
reduce maintenance costs by up to 30%. With heavy-duty diesel vehicles offering
extremely poor fuel economies of 5-7mpg, a 30-40% improvement can result in
significant fuel consumption savings.
There are a number of factors for fleets to consider when deciding whether or not to
buy an electric, fuel cell or natural gas vehicle. We are seeing positive developments in
all of the factors including initial purchase price, fuel costs and maintenance costs.
Beyond maintenance expenses, miles driven per year is a key metric. Most
conversations we have had with fleets at tradeshows such as MATS, The Work Truck
Show and ACT (Advanced Clean Transportation) have indicated that a truck needs to
consume 15,000 gallons of fuel per year at a minimum to make the economics of
powertrain conversion work, with a more compelling situation at 20,000 gallons. Note
the typical truck gets upwards of 6 to 7 miles per gallon in fuel economy.
Figure 31 - Overview of Nikola’s Addressable Market
Source: Cowen and Company, Company Presentation
1) Includes both short-haul and long-haul heavy duty truck markets
2) Including vehicle, fuel, and service & maintenance; based on proprietary research from ACT Research
While the light duty vehicle (passenger car) market gets the bulk of attention as it
relates to electrification, there is an accelerating shift toward cleaner and cost-effective
solutions in the bus, refuse, and Class 4-8 trucking market. The societal pressure and
regional political will are in place to eliminate truck emissions over time. The only
questions are how and when. OEMs have stepped up their offerings in the last 12 to 18
months and the sector is no longer dominated by startups, with Daimler, Volvo,
PACCAR, etc. now launching new platforms. The trends of fuel efficiency, safety, and
connectivity seen in the passenger vehicle market are making their way into the
commercial vehicle market as well.
• Commercial vehicle buying decision driven by Total Cost of Ownership (TCO)
• The largest Class 8 fleets are replaced every 3-5 years on average — adoption of new technology is expected to be rapid once it passes TCO
parity threshold
• Increasingly stringent global emissions standards will increase comparative advantage of zero emissions vehicles relative to diesel
• In some cases, such as city centers, diesel will be banned entirely
• Governments, fleet owners, and other stakeholders are demanding a zero emissions solution
KEY DRIVERS FOR ZERO EMISSION COMMERCIAL VEHICLE DEMAND
• Dedicated routes are primarily comprised of private fleets and
dedicated operations of large for-hire carriers
• For initial rollout of FCEV, Nikola will target the largest private
and dedicated fleets with either nationwide or significant
regional distribution networks
• Focus on dedicated routes allows for targeted, capital-efficient
deployment of hydrogen stations
N.A CLASS 8 TRUCK SEGMENT STRATEGY
1,800,000 class 8 semi-trucks on the road daily (1)
+25%
450,000 trucks run on
dedicated routes
75%
1,350,000 trucks
COWEN.COM 29
COWEN
EQUITY RESEARCH
Nikola Corporation
June 17, 2020
We don't see a silver bullet technology evolving in a winner take all scenario, with
natural gas, propane, electric, and fuel cells all playing a role. Historically, natural gas
and propane were the most cost effective; however, the move toward zero carbon as a
focus of corporate fleets in California and others is leading the industry more toward
electrified solutions in our view.
According to the Environmental Protection Agency and the European Environment
Agency, the transportation industry causes an estimated 25% to 30% of U.S. and EU
greenhouse gas emissions. While heavy-duty trucking represents less than 10% of the
overall industry, it is responsible for approximately 40% of transportation industry GHG
according to the International Council on Clean Transportation. With ever-expanding e-
commerce freight demands that society accelerated during the COVID-19 pandemic,
zero-emission vehicles are believed to be one of the only viable options for a sustainable
future.
Figure 32 – Three Primary Drivers to New Powertrain Adoption for Trucks
Source: Cowen and Company, Bloomberg New Energy Finance
According to third party consultancy Bloomberg New Energy Finance (BNEF), for lighter
trucks and urban duty cycles, battery electrics (BEV) or range-extender hybrids (REX)
will be at cost parity with diesels on a total cost of ownership (TCO) basis within three
years. For some use cases, they are already the lower cost option. However, the capital
costs of electric light trucks will not reach those of diesel until 2026 for REX or 2030 for
BEV according to their analysis. Operators and manufacturers will have to devise new
funding schemes to take advantage of the lower lifetime costs. New financing
mechanisms such as what Duke Energy is doing with UPS and commercial trucking
partner Workhorse Group are aligned with BNEF’s views. In this situation, Duke is
financing the charging infrastructure and batteries within the trucks and UPS is paying
an upfront cost comparable to a traditional internal combustion engine truck. Duke then
intends to use the batteries in a second life application within its own electric grid once
the state of charge falls below acceptable use for UPS within its daily routes.
Rising
policy
support
Evolving
financing
methods
Falling
battery
costs
• Subsidies
• Mandates and targets
• Battery leasing
• New charging solutions
• Improving TCO competitiveness
• Approaching upfront price parity
COWEN.COM30
COWEN
EQUITY RESEARCH
Nikola Corporation
June 17, 2020
BNEF further expects that heavy-duty electrified trucks for urban applications will cost
at least twice as much as equivalent diesel vehicles (on an upfront basis) until the early
2020s. Still, their TCOs will approach those of diesel by 2022 and all-electrics will reach
TCO parity in the mid-2020s. Electrifying the long-haul heavy-duty segment is a
challenge due to charging infrastructure issues and weight penalties, both topics that
we explore further in this discussion.
Lastly, BNEF has noted that the economics of natural gas drivetrains are getting better
for heavy-duty vehicles, while diesel powertrains will incur increasing cost burdens for
emissions compliance. Natural gas trucks have already reached TCO parity with diesel in
long-haul applications and will do so in urban duty cycles by the early 2020s.
Figure 33 - Total Cost of Ownership ($/mile) of Light Commercial
Vehicles in the United States (Various Powertrain
Technologies)
Figure 34 - Total Cost of Ownership ($/ton-mile) of Light
Commercial Vehicles in the United States (Various
Powertrain Technologies)
Source: Bloomberg New Energy Finance
Globally, about 29% of greenhouse gas emissions emanate from the transportation
sector. Governments continue to focus on driving GHGs down and thus have regulations
in place for the auto industry. To that end, the price of fuel is not impacting the direction
the industry is headed in terms of fuel efficiency, new technology being added to the
vehicle, or emission reduction initiatives.
Commercial delivery trucks are an initial area of focus on alternative powertrain
developments and the industry is at the nexus of several mega trends underway in
society today.
 Urbanization (see our Smart Cities report HERE)
 Online commerce and demands for just in time delivery
 Corporate desire to reduce their CO2 footprint (see our ESG report HERE)
0.0
0.2
0.4
0.6
0.8
1.0
1.2
1.4
2018 2019 2020 2021 2022 2023 2024 2025 2026 2027 2028 2029 2030
$/mile
Diesel
CNG
LNG
BEV
REX
0.00
0.05
0.10
0.15
0.20
0.25
0.30
0.35
2018201920202021202220232024202520262027202820292030
$/ton-mile
Diesel
CNG
LNG
BEV
REX
COWEN.COM 31
COWEN
EQUITY RESEARCH
Nikola Corporation
June 17, 2020
EU negotiators agreed to impose a cap on CO2 emissions for trucks for the first time on
February 18th
2019, following an increase in the requirements for cars that we
highlighted in our Ahead of the Curve report HERE. The EU government has set a 30%
CO2 reduction for 2030 fleet compared to 2019 levels, and also endorsed a 15%
reduction for 2025 in the interim. Switching from diesel to natural gas trucks can result
in a 20% reduction in C02, and up to 100% reduction for trucks that utilize renewable
biogas. We see the Westport portfolio as very attractive for OEMs looking for a range of
alternative powertrain solutions to meet these regulations and could see increased
activity from new customers.
Connectivity and Automation; Path to Improving Vehicle Efficiency
Fleet operators are increasingly engaging with vehicle technology suppliers to explore
the benefits of connected and autonomous vehicles. In the short and midterm, rather
than removing the driver, these systems are intended to increase retention while also
improving vehicle safety and reducing costs. Many fleet operators can see driver
turnover rates as high as a 100% annually, which elevates both hiring and logistic costs.
ADAS technologies can improve working conditions for drivers and also capture data
and coach drivers on more efficient vehicle operation.
Purdue University is spearheading work on platooning, which requires the intersection
of connectivity and automation. Platooning can improve emissions and save on fuel
costs by as much as 7%, however, under manual operation, this is difficult to do safely.
In order to take advantage of platooning benefits, trucks need to follow at a distance as
low as 40 feet. Human brake reaction time under good conditions is 1.40 seconds but
using connected and autonomous technology can reduce that response time to just 0.03
seconds. Using V2V systems, multiple trucks can be incorporated into a platoon. For a
more thorough investigation of autonomous trucks, see our Ahead of the Curve report
HERE.
Drivers and Fuel Remain the Largest Cost Component for Fleet Operators
The largest cost component for vehicles on a per mile basis is the driver followed by the
cost of fueling the vehicle. Fleet operators are continuously searching for ways to better
control these costs given these factors represent 65% of average per mile fleet costs.
New powertrains are largely focused on reducing fuel costs and hopefully repair and
maintenance costs. Vehicle connectivity coupled with ADAS and autonomous systems
could help to improve driver efficiency and vehicle operation. Drivers under levels 4 and
5 of autonomy could be eligible to fulfill mandatory rest brakes while the truck is still
under operation. This would not only improve work quality for the driver, but also allow
the truck to operate more efficiently by making more deliveries over a shorter period of
time. Additionally, connected systems can assist the driver with braking and
acceleration rates as well as leverage telematics and infrastructure sensors to plot more
efficient delivery routes in real time.
COWEN.COM32
COWEN
EQUITY RESEARCH
Nikola Corporation
June 17, 2020
Figure 35 – Average Fleet Total Cost Per Mile
Source: Purdue University (Work Truck Show 2018), Cowen and Company
Exploring Technology Developments in Trucking Powertrains
Much like the early days of natural gas, battery technologies must determine where the
dividing line is for higher horsepower applications. Eight or nine years ago, the debate
for heavy duty trucking was how to store natural gas on trucks, CNG or LNG.
Figure 36 – Tug of War Between Natural Gas and Battery/Fuel Cell Solutions in Transportation
Source: Cowen and Company, Company Reports
Heavy duty trucking segment is often in the middle of the debate on alternative
powertrains due to its position in the fuel consumption spectrum. Like CNG, Battery
Electric Vehicles (BEVs) will quickly dominate the passenger vehicle markets through the
Class 6-7 segments of transport buses, and refuse trucks, though getting enough
kilowatt-hours stored on anything larger becomes a challenge.
Driver,
40%
Fuel, 25%
Purchase,
14%
Repair,
10%
Other,
11%
Car Truck Bus Garbage Truck 18- Wheeler Plane Train Ship
BEV FCEV
CNG LNG
COWEN.COM 33
COWEN
EQUITY RESEARCH
Nikola Corporation
June 17, 2020
Both battery electric and fuel cell technologies require their own unique infrastructure;
one being the power grid’s need to update its distribution system, while fuel cells will
require a major roll-out of hydrogen refueling centers. While the infrastructure isn’t
usually the focus of investors, it remains top of mind for fleets evaluating adoption of
alternative powertrain solutions and in our mind a potential gating factor for adoption
relative to passenger cars which can charge at home or at work.
Figure 37 – Estimated Equipment Prices and Cost Per Mile of Various Heavy Duty Powertrains
Source: ACT Conference 2018, Cowen and Company
Battery Electric Powertrains
The early market for commercial electric vehicles was constrained by high prices and
limited demand. Falling battery costs, engineering advancements, and anticipation of
more stringent emissions regulations, especially in cities, are driving renewed interest in
the sector. Tesla’s bold claims in 2017 regarding its Semi truck offering have made fleets
take notice and sharpen their pencils on exploring battery electric trucks in greater
detail.
Elon Musk on Twitter November 12, 2017 on the Tesla Semi Truck Launch – “This will
blow your mind clear out of your skull and into an alternate dimension.”
Much of what was revealed in 2017 still doesn’t exist today and the ramp up of Tesla’s
offering is still unclear. While Tesla’s initial aim of selling up to 100,000 trucks per year
in 2021 were far off of reality (they now claim “limited” volumes in 2020), the market is
moving quickly toward electrified options, with Daimler most recently leading the
charge.
Competitive Environment Intense – Nikola Looks to Have First Mover Advantage and
Controls the Fueling
Nikola is not without competitors in the race to decarbonize Class 8 trucking. While
Tesla’s Semi launch is the most topical for investors since their 2017 reveal, there are
many other electric and fuel cell Class 8 trucks in development.
Diesel Natural Gas (NG) Hydrogen Fuel Cell (FCEV) Electric (BEV)
Cost $140,000 Capital Cost
$42,000 Residual Value
$3.13/gal diesel fuel
$2.75/gal DEF
$185,000 Capital Cost
$40,000 Residual Value
$2.48/dge of nat gas
$300/DGE in tanks
$350,000 Capital Cost
Residual Value N/A
$1.50/dge H2
$0.11/kWh
$300/kWh in batteries
$180,000 Capital Cost
$0 Residual Value Analysis
$0.11/kWh
$100/kWh in batteries
Range 1,000+ miles
Dual Alum. Tanks
Dense fuelingnetwork
600 miles
120DGE tank package
Adequate fueling
network
1,000+ miles
350kWh storage
H2 fuelingnetwork notyet
available
500 miles
1MW storage
Surperchargingstations not
yet available
Weight
(Battery Pack
Weight/kWh)
20,000 lbs. 21,000 lbs. 20,000 lbs.
10-15#/kWh
24,000 lbs.
10-15#/kWh
Performance 6.5 - 8.5 mpg
425 – 600 hp
1,650 ft-lb
$0.10/mi maintenance
5.0 - 6.0 mpge
400 hp
1,400 ft-lb
$0.115/mi maintenance
13 - 15 mpge
1,000 hp
2,000 ft-lb
$0.00/mi maintenance
17 - 19 mpge
1,000 hp
2,000 ft-lb
$0.08/mi maintenance
OperatingCost
per Mile
$0.775 $0.926 $0.72 $0.726
COWEN.COM34
COWEN
EQUITY RESEARCH
Nikola Corporation
June 17, 2020
Figure 38 – Tesla Semi Truck Figure 39 – Interior View of Tesla Semi
Source: Tesla
Kenworth has showcased its T680 version. XOS Trucks, Hylilion, Lion Electric, Daimler
and many others have entered the fray for the all-electric side. On the fuel cell side,
testing has been underway for several years. The biggest step forward in the industry in
our view was Cummins’ (covered by Matt Elkott) acquisition of Hydrogenics in 2019.
The transaction brought in-house fuel cells and electrolyzers to an engine OEM.
Cummins’ commentary at trade shows such as ACT and the Work Truck Show since the
acquisition are aligned with Nikola’s view of the world, that above 300 miles of range
will be a challenge to accomplish with an all-electric version of a Class 8 truck.
In addition, more recently in the middle of the pandemic, Volvo Group and Daimler Truck
formed a joint venture to develop fuel cell based trucking solutions. The venture aims to
have initial production in 2024 and will not be offering fueling according to statements
made at the time of the announcement.
Weichai, China’s largest engine OEM has also taken a ~20% stake in fuel cell maker
Ballard Power and has formed a joint venture that expects to begin production this
Summer for the China market. Separately, Ballard is working with Paccar on testing fuel
cell trucks in the Los Angeles area for drayage applications.
Competition in the Class 8 heavy-duty truck industry is intense and new regulatory
requirements for vehicle emissions, technological advances, and shifting customer
demands are causing the industry to evolve towards zero-emission solutions.
COWEN.COM 35
COWEN
EQUITY RESEARCH
Nikola Corporation
June 17, 2020
Figure 40 - Select Medium and Heavy Duty BEV and FCEV Announcements
Source: Cowen and Company, company Presentation
Fleets will likely look at total cost of ownership (TCO) as a primary factor in comparing
solutions from companies like Nikola among other factors such as :
 product performance and uptime;
 availability of charging or re-fueling network;
 emissions profile;
 vehicle quality, reliability and safety;
 technological innovation;
 improved vehicle operational visibility;
 ease of autonomous capability development; and
 service options
BEV ANNOUNCEMENTS
FCEV ANNOUNCEMENTS
• Market is awakening to the vast
potential of BEV and FCEV heavy duty
trucks
• Nikola trucks are in advanced stages of
development and testing and are
expected to meet specific use case
needs, supporting potential rapid
market adoption
CF Electric
Short Haul and Refuse Fleet
trials 2019
AEOS
Class 7 Truck
Announced production 2020
ET-1
Class 8 Truck
Announced production 2019
International eMV
Medium Duty
Production 2021
Semi
Class 8 Truck
Limited production 2020
Plan to spend €1B+ in electro
mobility by 2025
FCEV Truck
Heavy Duty
Limited production Q4 2019 (10 units)
H2 XCIENT
Heavy Duty
Production 2023
FCEV Truck
Class 8 Truck
No announced production
Announced goal to have H2 series-
production vehicles by the end of the
2020s
JV With Volvo - Production 2024/25
eActros
Class 8 Truck
Serial Production 2021
eCascadia
Class 8 Truck
Serial production 2021
E-Fuso Vision One
Class 8 Truck
Serial production 2021
FL and FE
Medium and Heavy Duty
Serial production March 2020
Z.E. Lineup
Short Haul and Refuse
Pre-series model testing 2H19
LR Refuse
Refuse
Testing 2020
Same Truck Group
COWEN.COM36
COWEN
EQUITY RESEARCH
Nikola Corporation
June 17, 2020
Daimler’s own view of electrified trucking solutions suggests that subsidized use cases,
such as what we see in the ports of California due to California Air Resources Board
requirements, will be the first market for adoption. We note that Nikola is also starting
in California with anchor customer Anheuser Busch, leveraging its Van Nuys, CA
brewery and building out stations in Interstate 10 for the route between the Los
Angeles and Phoenix area.
The push to decarbonize trucking has drawn a great deal of interest in recent months,
with a greater focus on Europe; however, while Federal mandates are not as strict,
regional rules such as those in California as well as commercial desire to reduce carbon
footprints is leading to increased interest in the sector. Since 2016, transportation has
been the biggest direct source of U.S. greenhouse gas emissions. Most of the sector’s
emissions come from road transport, which derives over 90 percent of its energy from
petroleum. According to the EPA and the EEA the transportation industry causes an
estimated 25% to 30% of U.S. and EU greenhouse gas emissions. While heavy-duty
trucking represents less than 10% of the vehicle population, the ICCT estimates it is
responsible for approximately 40% of emissions from the transportation industry,
making them disproportionate contributors to pollution. Diesel vehicles are a major
source of harmful air pollutants and GHG emissions. The associated local air pollution,
particulates of oxides of nitrogen and particulate matter emissions, negatively impacts
health and quality of life. Additionally, diesel exhaust has been classified as a potential
human carcinogen by the EPA and the International Agency for Research on Cancer.
Studies done on exposure to high levels of diesel exhaust indicate a greater risk of lung
cancer.
A significant share of global GHG emissions stem from heavy-duty vehicle
transportation. We believe zero-emission vehicles are one of the only viable options to
reduce emissions in the transportation sector to meet climate, ozone, and regulatory
targets. According to the U.S. Emissions Center for Climate and Energy Solutions, in
2017, U.S. GHG emissions totaled 6,457 million metric tons ("MMT") of CO2 equivalents.
Medium and heavy-duty vehicles accounted for 7% of total emissions, equal to 431
MMT of CO2 equivalents. The EEA's report on GHG in Europe found that in 2017, EU
GHG emissions totaled 4,481 MMT of CO2 equivalents. Heavy-duty vehicles accounted
for 5% of total emissions, equal to 224MMT of CO2 equivalents.
In addition, consumers are increasingly demanding that corporations take action to
reduce their carbon footprint. A study by Nielsen cited that nearly half (48%) of U.S.
consumers say they would "definitely" or "probably" change their consumption habits to
reduce their impact on the environment, placing reducing emissions high on the agenda
for large corporates. For example:
 Amazon has pledged to become carbon neutral by 2040;
 BP has pledged to become carbon neutral by 2050;
 DB Schenker plans to reduce specific CO2 emissions by 30% before 2020 and
50% before 2030, compared to 2006 baseline;
 DHL set a goal to reduce all logistics-related emissions to zero by 2050;
 UPS has committed to sourcing 40% of its ground fuel from low carbon or
alternative fuels by 2025
COWEN.COM 37
COWEN
EQUITY RESEARCH
Nikola Corporation
June 17, 2020
 Walmart set a goal of an 18% emissions reduction in their own operations by
2025 and to work with suppliers to reduce emissions by 1 gigaton by 2030.
The trucking industry has less volume for lithium ion batteries than passenger
cars and the associated packs are typically a different form factor. This is the
primary factor for why pricing in 2019 is about 20-30% above typically cited
passenger car battery prices.
Battery Price Decline Critical for Adoption of Electrified Trucks
Battery prices for heavy duty trucks will take longer to reach industry wide averages
due to customized battery management systems. We note that one factor to watch
however is that a number of heavy-duty truck makers are also in the passenger vehicle
business and may be able to combine purchasing power to further drive down costs.
Figure 41 – Anticipated Battery Costs For Heavy and Light Duty Commercial Vehicles
Source: Bloomberg New Energy Finance
Elon Musk says his company’s battery-powered big rig will be 20% cheaper to operate
than diesel trucks and represents “economic suicide for rail.” Mr. Musk stated that the
cost of running three or more "platooned" electric semis would approach the cost of
shipping rail. Without knowing the cost of the electric trucks, the cost of building the
infrastructure nationwide and internationally to support such trucks as well as other
costs, we wouldn't want to speculate as to how accurate or how far off the mark such a
statement is (most of what Mr. Musk says is exaggerated, especially around timing, in
our view).
Tesla’s passenger car sales are about 2/3 domestic and 1/3 international. If the same
breakdown were true for trucks Tesla would have about 35% domestic share of Class 8
trucks and 6% globally, both figures we find incredibly unlikely given the risk averse
nature of fleet operators.
Tesla’s view is that the truck will be 20% cheaper to operate on a per mile basis. Many
details on their assumptions were not provided. We have attempted to build a payback
analysis using the 2 main assumptions they did offer - $0.07/kWh electricity and
~$100/kWh battery packs. If those assumptions are used, we get to a 3-year payback.
0
50
100
150
200
250
300
350
400
2018 2019 2020 2021 2022 2023 2024 2025 2026 2027 2028 2029 2030
2018 $/kWh
HCV battery price
LCV battery price
Experience curve
COWEN.COM38
COWEN
EQUITY RESEARCH
Nikola Corporation
June 17, 2020
Note DHL and others have indicated paybacks cold be as low as 2 years. Assuming
current battery prices and commercial electricity pricing from the grid of $0.09/kWh in
lieu of solar, we see paybacks today more in the 5 to 6-year time frame. If Tesla is
unable to drop its 2170 battery production costs down to the $100/kWh range from the
current $150-175 range (and industry pricing of $175), we believe the Tesla Semi will be
dead on arrival. Our estimated sensitivity to those assumptions is shown below.
Figure 42 –Estimated Tesla Semi Payback Period
Source: Cowen and Company, Tesla
A traditional diesel truck has about an 800 to 1,000-mile range between refueling and
Tesla noted that its truck will have a range of 500 miles at maximum gross vehicle
weight at highway speeds (60 miles per hour). Tesla further noted that 80% of routes
for truckers are less than 250 miles, noting that it could return to base and recharge.
In regard to charging, Tesla has noted that a traditional truck can take 20 minutes to
refuel with diesel and that Tesla trucks are aimed at charging at their origin or
destination and would be able to achieve 400 miles of range with a charge of 30
minutes through a series of “mega” chargers worldwide. Tesla views 400 miles as 6 to 7
hours of driving for a traditional trucker and charging can be done while the trucker is
taking a break for a meal or to use the restroom. The “mega” chargers will be solar
powered chargers with Tesla Powerpacks, which should enable the company to
guarantee electricity rates in a particular region to the fleet operator. While the “mega”
charger idea sounds impressive, we also note that these chargers are likely to have
challenges with permits and interconnections with utilities as many substations near
potential customers likely do not have enough capacity to deal with such a load
increase.
Estimated Payback - Electric Trucks vs. Diesel Class 8 Trucks (Years)
3.0 $25 $50 $75 $100 $125 $150 $175 $200
$0.03 0.3 1.0 1.8 2.5 3.3 4.0 4.7 5.5
$0.04 0.3 1.1 1.9 2.6 3.4 4.1 4.9 5.7
$0.05 0.3 1.1 1.9 2.7 3.5 4.3 5.1 5.9
$0.06 0.4 1.2 2.0 2.8 3.7 4.5 5.3 6.2
$0.07 0.4 1.2 2.1 3.0 3.8 4.7 5.6 6.4
$0.08 0.4 1.3 2.2 3.1 4.0 4.9 5.8 6.7
$0.09 0.4 1.4 2.3 3.3 4.2 5.1 6.1 7.0
$0.10 0.4 1.4 2.4 3.4 4.4 5.4 6.4 7.4
$0.11 0.4 1.5 2.5 3.6 4.7 5.7 6.8 7.8
$0.12 0.5 1.6 2.7 3.8 4.9 6.0 7.1 8.2
$0.13 0.5 1.7 2.9 4.0 5.2 6.4 7.6 8.7
$0.14 0.5 1.8 3.0 4.3 5.5 6.8 8.0 9.3
$0.15 0.6 1.9 3.2 4.6 5.9 7.3 8.6 9.9
ElectricityPrice($/kWh)
Battery Cost ($/kWh)
2020 Tesla Target E stimated Current Industry Pricing
COWEN.COM 39
COWEN
EQUITY RESEARCH
Nikola Corporation
June 17, 2020
Duty Cycles Are Key for Electrified Truck Growth
Duty cycles that present the greatest opportunity for Electrified Truck growth are urban
delivery or other uses that fit these parameters:
 Return-to-base operation, where the vehicle returns at end of shift for
overnight charging.
 Fixed route, within 80 miles round trip.
 A lot of stop-and-start driving to allow for regenerative braking.
 Diminishing load, where the truck gets lighter after each delivery, helping
extend vehicle range.
 Lower-speed operation (usually below 60 mph) to preserve battery power.
The early market for commercial electric vehicles was constrained by high prices and
limited demand. Falling battery costs, engineering advancements, and anticipation of
more stringent emissions regulations, especially in cities, are driving renewed interest in
the sector. Large volume truck manufacturers are largely absent from the EV market
but that is beginning to change driven by Daimler currently and momentum from Volvo
and CNH in Europe over the next few years. Instead, today the market is served by an
abundance of smaller powertrain manufacturers. Most lack the funding to scale
production, so we expect more partnerships and acquisitions over the next few years.
Unfortunately for emerging vendors in the market, many have faced financial difficulties
over the years, which has led to some potential customer anxiety.
Elements that Allow Electrified Trucks to Have a Positive Payback
There are 3 critical areas that allow for an electrified truck to have a positive payback:
1) Fuel Cost Savings: Essentially comparing the cost of electricity per mile versus
fuel costs.
2) Lower Maintenance Costs:
 The battery, motor and associated power electronics of electrified vehicles
require little to no maintenance
 Minimal fluid changes or maintenance
 Brake wear can be reduced due to regenerative braking
 Fewer moving parts relative to an internal combustion engine
3) Increased Productivity: Short range applications that exceed 40 to 50 stops per
day actually prove problematic for diesel-powered trucks with new diesel
emissions technologies, such as diesel particulate filters (DPF) that require
periodic regeneration cycles to burn off soot. Typically, diesel engines need to
travel at highway speeds to allow for a regeneration cycle during the day;
however, such speeds may be rarely achieved in an urban delivery van. Should
this regeneration not be achieved, drivers typically have to take time out of their
day for the regeneration cycle to be completed.
COWEN.COM40
COWEN
EQUITY RESEARCH
Nikola Corporation
June 17, 2020
Vehicle Light Weighting Helping to Drive Down EV Costs
The characteristics of batteries needed for commercial trucks differs from passenger
cars as it is assumed that fast charging will be more routinely used and more
importantly there are weight limits on commercial trucks. A battery pack in a
commercial truck can weigh 2,000-4,000 pounds and that is a sacrifice to cargo.
Batteries today cost about $200/kWh in the industry for vendors outside of Tesla and
weigh approximately 10-15 lbs/kWh, which displaces payload. The alternative is to run
a hybrid fuel cell and battery solution, which adds the requirement to store hydrogen in
extremely high pressure tanks, which also adds to weight.
In trucking, much of the shift to all electric powertrains has come in lower class vehicles
given the energy density differential compared to diesel fuel. However, vehicle light
weighting in Class 7 and 8 trucks is helping to reduce costs by requiring smaller
batteries thereby increasing cargo capacity and range. TPI Composites is partnering
with Navistar to provide composite tractor and frame rails for Class 8 trucks. For more
information see our note HERE.
Charging Infrastructure Requires New Investments in Energy Grid
Energy grid advancements will be crucial as EV adoption grows. While overall energy
capacity is not an issue, utility companies are making investments today to deal with
peak power availability issues that EVs would likely cause. Peak power supply issues will
likely manifest most acutely in passenger vehicles where charging behavior is likely to
be similar across all users, i.e. vehicles charging when owners return from work.
Monetary incentives and software systems can be leveraged by utilities to modulate
charging rate to ensure stable power supply while providing customers with sufficient
energy to fully charge their vehicle before use the following day. Trucking companies
will face similar issues given the larger energy demands of work trucks compared to
traditional passenger vehicles. A Tesla MEGA-Charger, which will be needed to support
charging for the company’s all electric semi-truck could require 1.8MW of energy.
Adopters will likely need reinforced T&D infrastructure to support a fully electric
trucking fleet as well as charging integration with utilities to control peak demand.
Figure 43 – Peak Electrical Power Capacity (kW)
Source: Daimler (Green Truck Summit 2018), Cowen and Company
820 kW
2.2 MW
350 kW
1.8 MW
0
500
1,000
1,500
2,000
2,500
DTNA HQ Building WST Trck Mfg
Plant
ionity "Fast"
Charging Station
(Europe)
Tesla MEGA-
Charger
(kW)
COWEN.COM 41
COWEN
EQUITY RESEARCH
Nikola Corporation
June 17, 2020
Fuel Cell Powertrains
A fuel cell is a device that produces electricity by way of an electrochemical reaction.
These units combine fuels with ambient oxygen, producing electricity, water, and heat.
This is a clean electrical generation technology that emits significantly lower levels of
greenhouse gases that have been linked to global warming causation. The lower levels
of greenhouse gas emittance stems from the comparatively high efficiencies achieved
by fuel cell systems, which have reached levels north of 80% when the fuel cell’s waste
heat is captured-- compared to ~33% for combustion engines. Different fuel cells, based
on their input fuels, have different characteristics, making each distinct fuel cell better
suited for different generation applications; transport, portable, or stationary.
The excitement over hydrogen relates to its potential as a pollution-free energy source,
which, if produced from renewable means, would not release any carbon dioxide
emissions and would slow the pace of global warming. In addition, the fact that
hydrogen is the most abundant element on earth (though rarely found in its pure form)
and can be produced from the electrolysis of water makes it an ideal fuel choice of the
future.
Key Points Regarding the Fuel Cell Industry:
 Hydrogen is a high energy content fuel that can be generated using renewable
energy sources for stationary power or transportation applications.
 Hydrogen can act as a form of renewable energy storage.
 Plans for a hydrogen-based society are materializing, but still far from a
reality.
 Cities, countries, and companies are moving forward with hydrogen
production, fuel cell technologies, and hydrogen car roll-outs. However,
uncertainty surrounding costs, logistics, and impact are slowing
implementation.
Natural Gas Powertrains
The conversion to natural gas by fleet operators represents an economical and
environmentally significant development in the trucking market; however, market share
remains in the low single digits for the technology. Third-party researcher ACT forecasts
that about 2% of Class 8 trucks sold in the United States in 2019 and this year are
natural gas powered. Large fleets, such as UPS, who just placed a multi-year 6,000-unit
order are driving that share. Share within buses in the U.S. is much higher; however, the
heavy-duty market is largely dominated by just a handful of fleets. Within Europe,
engine and truck maker IVECO, part of CNH Industrial, estimates that LNG will make up
6-8% of the heavy-duty market by 2024. The adoption of natural gas will not only
benefit fleet owners but also drive demand for tank and engine manufacturers. The
decline in the price of a barrel of oil, and by extension the price of diesel fuel, has had a
cooling effect on the pace of natural gas adoption by fleets. However, we believe that
payback periods remain compelling. In fact, by our estimates, fleets employing in-house
compression could see paybacks in almost two years. Furthermore, we have seen
anecdotal evidence showing that many customers will choose to convert a portion of
their trucking fleet to natural gas when payback periods are approximately two and half
years or less.
COWEN.COM42
COWEN
EQUITY RESEARCH
Nikola Corporation
June 17, 2020
Diesel has been the default fuel in trucking applications due to its high energy density.
Increasingly stringent emissions regulations and the falling cost of natural gas have
spurred many trucking fleets to explore natural gas as a diesel substitute. Diesel
emissions have a much higher particulate content due do the complex composition of
diesel fuel. Diesel fuel has 14 carbon atoms and 30 hydrogen atoms, giving it a hydrogen
to carbon ratio of 2 to 1, while methane has a ratio of 4 to 1. Methane natural gas has
the highest hydrogen-to-carbon ratio of any hydrocarbon.
Figure 44 – Molecular Composition of Diesel Fuel and Methane Gas
Source: ACT Research, Cowen and Company
Natural Gas Trucking Market Background
While Nikola is only exposed to the battery electric and fuel cell variants of
transportation, we believe investors should be aware of the benefits that natural gas
offers. Both CEO Mark Russell and founder Trevor Milton of Nikola have a great deal of
experience in natural gas trucking in their backgrounds and would highlight the fuel
certainty that hydrogen using electrolyzers offers fleets relative to natural gas fleets,
where pricing can be volatile. Both the fuel cell and natural gas industry have had
historical issues with quality and lifetime and related maintenance costs, but we believe
those dynamics are largely in the past. The natural gas trucking market gives fleet
operators access to a fuel system that is more cost efficient than diesel, once lifetime
costs are considered. The more miles a turn operates on an annual basis the better the
economics and the quicker the payback. As natural gas infrastructure continues to
expand, long-haul operators could become even better candidates for fleet conversion.
Additionally, while natural gas has less energy content, it is a cleaner burning fuel that
requires less complex and expensive emissions control systems to meet current and
future emissions regulations. The below table further summarizes the positive
attributes of natural gas adoptions for heavy duty trucking applications as well as the
hurdles that still exist when compared to diesel fuel.
COWEN.COM 43
COWEN
EQUITY RESEARCH
Nikola Corporation
June 17, 2020
Figure 45 – LNG/CNG Trucking Opportunity Has Many Pros and Cons
Source: Cowen and Company
The natural gas trucking industry comprises of three main segments. The first segment
is the fuel producers and distributors, as well as the fueling stations themselves. The
next major segment of the industry is the manufacturing of natural gas trucks, which
requires collaboration from engine developers and manufacturers, fuel system
designers and installers, as well as OEMs that supply the trucks. Westport, through its
subsidiaries, is the largest natural gas engine manufacturer at present. Fuel system
designers and installers include both tank and systems manufacturers and work with
engine suppliers and OEMs to integrate natural gas systems into trucks. Ultimately,
these trucks are purchased by the third segment, fleet operators, for use in the field.
Forces for Change Forces Against Change
Total Fuel Cost per Mile
Long-term Oil/Diesel Prices
Price Stability (price at pump
insensitive to spot price)
Energy Independence
RecentMajor Engine and OEM
Vehicle ProductAnnouncements
80% Engine PartCommonality with
Diesel
No Aftertreatment
Infrastructure Investments &
Announcements (Clean Energy,Shell,
Trillium)
Sustainability Commitment(& Green
Marketing)
Environmental Combustion Advantage
Energy Content
Engine Efficiency
LNG/CNG Tank Cost
Range
Few Product Offerings
LNG Handling (Cryogenic)
Training (Drivers, Techs, etc.)
Major Investment to Bring
Repair Facilities up to Codes
Little Refueling Infrastructure
Uncertain Truck Residual
Value
Environmental: Extraction
(fracking) Concerns
NaturalGasBecomesaFuelofChoiceforClass8TrucksintheU.S.
COWEN.COM44
COWEN
EQUITY RESEARCH
Nikola Corporation
June 17, 2020
Figure 46 – Natural Gas Transportation Industry Participants
Source: Westport Fuel Systems
Exploring Types of Natural Gas Engines
Natural gas engines are very similar to diesel engines, sharing around 80% of the same
components. The block, crank shaft, main bearing, piston rods, and exhaust gas
recirculation system (EGR) are all the same. While overall horsepower and torque is
slightly lower relative to the output from diesel engines, natural gas engines continue to
improve. Due to the physical properties of natural gas, it cannot be ignited through
compression, which is how diesel engines operate. Natural gas engines use spark plugs
to ignite the fuel and employ a stoichiometric exhaust gas recirculation (SEGR) system
to control combustion. SEGR helps to improve fuel economy and power density as well
as lower emissions. The introduction of 12-liter natural gas engines has greatly
expanded natural gas trucking applications. These engines can now output between 320
and 400 horsepower and produce 1,150 to 1,450 lb/ft of torque.
There are also two types of natural gas compression ignited systems, which use a
combination of both diesel and natural gas. The first is a substitution system, which
replaces a portion of diesel fuel with natural gas. Between 0% and 65% of the fuel
stream can be replaced, which means that these systems can operate solely on diesel if
necessary. The second engine system is high-pressure direct inject (HDPI), which uses a
small amount of diesel as a pilot spray to cause ignition. This can be done with as little
as 10% diesel fuel in the total fuel mix. The problem with this technology is that since it
requires a diesel fuel pilot spray, it also needs a separate diesel fuel tank and an after-
treatment system.
COWEN.COM 45
COWEN
EQUITY RESEARCH
Nikola Corporation
June 17, 2020
Cummins Near-Zero Engine Picking Up Momentum
The Cummins Near-Zero natural gas engine, leveraging Westport technology as part of
their CWI joint venture appears to be gaining momentum as OEMs qualify the engine.
Fleets such as San Diego Metropolitan Transit System and the City of Los Angeles are
continuing with their aggressive transit bus deployments, and we see an uptick in Class
8 demand, especially for drayage trucks at the ports in California. Cummins delivered
7,395 trucks in 2018, and we believe 8,000-10,000 truck deliveries likely occurred in
2019, based on our conversations with industry participants.
Cummins Westport unveiled their rebranded “Near Zero” natural gas engines at the ACT
show in 2017, challenging the low-emissions leadership of the battery electric industry.
The 6.7, 8.9 and 11.9L engines that the JV offers are now fully launched and feature all
of the latest refinements of the Near Zero design. The low NOx engines will be
rebranded B6.7N, the 8.9 liter will be L9N, and the 12 liter will be the ISX12N. The 9-
and 12-liter offerings will be certified to 0.02 grams of NOx per brake-horsepower,
which is 90% below the current CARB standard, but more importantly, competitive with
battery electric vehicles.
Exploring Fuel Cell Technology and Hydrogen Generation and Refueling
Hydrogen technology represents a promising, multifaceted pathway that could offer
many industries ranging from power generation to transportation a new strategy for
navigating the transition to net zero emissions.
Meeting climate targets will require a clean molecule. About 80% of the energy
consumed in the world is provided in the form of a molecule, namely oil, gas and coal.
The remaining 20% of energy is in the form of electricity, which is anticipated to grow as
more facets of the global economy are electrified in a decarbonized, digital and
distributed fashion.
Some parts of the economy can be easily electrified and some are a severe challenge.
Some parts of society require the physical properties of a molecule to be electrified such
as high energy density and the capacity to store energy for long periods of time.
Industries such as heavy duty trucking, shipping and aviation need the ability to perform
a chemical reaction. Other industries such as cement, aluminum, glass, chemical
production, fertilizers, steel and glass are extremely energy intensive and are striving to
decarbonize. We see hydrogen meeting the needs of many of these industries given it
can be used as fuel, heat or a feedstock and in addition it can be versatile, storable, clean
and reactive. In addition, now that electricity costs from wind and solar have fallen so
much, hydrogen can be produced cost effectively with low or zero emissions.
The hydrogen industry is a big business today, with over 100mn metric tons produced
annually and revenue in the industry north of $130 billion according to figures from
Bloomberg new Energy Finance. About 99% of the world’s hydrogen is made from fossil
fuels. The IEA estimates that about 2.2% of global emissions stem from hydrogen and
the industry consumes about 6% of the world’s natural gas and 2% of the world’s coal.
COWEN.COM46
COWEN
EQUITY RESEARCH
Nikola Corporation
June 17, 2020
Hydrogen Has Seven Roles to Play in the Decarbonized Energy Transition
We see hydrogen as a versatile energy carrier and positioned to benefit from low cost
renewable power to create “green hydrogen” which is carbon free. This has been an
aspiration of the industry for over a decade; however, was never cost effective given
the high cost of electricity. Now that renewable power costs have fallen and electrolyzer
technology has scaled to the MW scale, we see the 2020s being the decade of the
hydrogen economy.
Figure 47 – Wind and Solar Levelized Cost of Energy Trends
Source: NEL Investor Presentation
We see hydrogen playing seven roles in the broader decades long energy transition that
is playing out. Hydrogen has a role in both power generation and transportation.
1) Within the broader renewable energy ecosystem, we see hydrogen serving as a
means of long-term energy storage, in particular taking advantage of excess
renewable power generated from wind and solar and storing hydrogen.
2) Hydrogen can serve as the conduit to enable large scale renewable electricity into
the grid.
3) In addition, hydrogen can be stored to transfer energy between regions or even
between seasons to increased energy resilience.
4) Hydrogen can decarbonize transportation, which today is reliant on fossil fuels and
generates over 20% of the world’s carbon dioxide.
5) Hydrogen has a role to play in heat, namely for cogeneration units to generate heat
and power for industrial uses.
6) Hydrogen can also take advantage of existing natural gas networks and leverage
this infrastructure to provide cost effective heat and power.
$135
$124
$71 $72 $70
$59 $55 $47 $45 $42 $41
2009 2010 2011 2012 2013 2014 2015 2016 2017 2018 2019
Global Avg Wind (Onshore) LCOE
(Unsubsidized Levelized Cost of Energy ($/MWh)
$359
$248
$157
$125
$98
$79
$64 $55 $50 $43 $40
2009 2010 2011 2012 2013 2014 2015 2016 2017 2018 2019
Global Avg Solar PV LCOE
(Unsubsidized Levelized Cost of Energy ($/MWh)
Hydrogen plays seven roles in the
decarbonized energy transition.
COWEN.COM 47
COWEN
EQUITY RESEARCH
Nikola Corporation
June 17, 2020
7) Currently, most hydrogen is produced via steam methane reformation leveraging
natural gas, which is carbon intensive. Over time, we expect chemical ammonia,
fertilizer and refineries to migrate to cleaner uses of hydrogen. Hydrogen can be
used to produce cleaner chemicals and steel, leveraging captured carbon to
produce iron ore.
Figure 48 – Hydrogen Can Play Seven Key Roles in the Decarbonized Energy Transition
Source: Cowen and Company
The excitement over hydrogen relates to its potential as a pollution-free energy source,
which, if produced from renewable means, would not release any carbon dioxide
emissions and would slow the pace of global warming. In addition, the fact that
hydrogen is the most abundant element on earth (though rarely found in its pure form)
and can be produced from the electrolysis of water makes it an ideal fuel choice of the
future.
Most investors probably have painful memories of the tech bubble, when shares of fuel
cell companies were bid up under the belief that automotive adoption of fuel cells was
just around the corner. The investing world believed that in a matter of a few years, fuel
cells would displace the internal combustion engine, the incumbent engine technology
for nearly a century. As investors soon learned, fuel cell companies became notorious
for over promising and under delivering on the capabilities of their products, and the
commercialization of automotive fuel cells kept being pushed out.
Enable large-scale
renewables integration
and power generation
Distribute energy
across sectors and
regions
Act as a buffer to
increase system
resilience
Help decarbonize
transportation
Help decarbonize industrial
energy use
Help decarbonize building
heat and power
Serve as renewable
feedstock
Enable the renewable-energy System Decarbonize End Uses
COWEN.COM48
COWEN
EQUITY RESEARCH
Nikola Corporation
June 17, 2020
From the beginning, the fuel cell manufacturers were using flawed logic. They were
attempting to run before they could crawl, in our view. The automotive market is one of
the most difficult and demanding markets, given the extreme operating conditions and
need for high reliability. In the laboratory, the fuel cell companies believed that they
could meet the challenges, but in reality, they were far from meeting the performance,
price, or reliability standards of the automotive manufacturers.
As a result, fuel cell manufacturers de-emphasized the automotive market and searched
for ways to monetize their research and development investments. Now the industry’s
focus is on forklifts, backup power, residential electricity and heat cogeneration, and
larger systems for commercial and industrial use. While many challenges are still ahead
of fuel cell manufacturers, we believe that market adoption for some applications is
around the corner. Whether the fuel cell manufacturers can make money manufacturing
their products is a different question, but we believe demand is growing.
With any new technology, there are many hurdles to market adoption and challenges
that need to be overcome. We believe price is still the limiting factor for fuel cells, as the
cost per kilowatt is higher than incumbent technologies, especially batteries in many use
cases. Despite a higher upfront capital cost, fuel cells can offer a lower total cost of
ownership in specific applications, such as heavy duty trucking, backup/distributed
power and forklifts. The immature nature of the industry has hindered the ability to
develop a track record. The manufacturers claim that their products have longer run
times and higher reliability than current technologies, but the products have not had the
time to prove themselves in the field. Finally, the migration to fuel cell technology
requires a drastic transformation in fueling infrastructure, providing fuel cell purchasers
with cost competitive and reliable fuel deliveries (or onsite hydrogen generation is also
an option).
Nascent fuel cell market was unable to
meet demands of a mature automotive
market.
COWEN.COM 49
COWEN
EQUITY RESEARCH
Nikola Corporation
June 17, 2020
Figure 49 – Evolution of the Hydrogen Economy
Source: Greentech Media
In the following pages, we explore the different end markets that are potentially on the
cusp of fuel cell adoption. We also discuss the challenges, cost competitiveness, and
likelihood of significant market adoption. Finally, we review the technology and discuss
the different types of fuel cells.
Fuel cell technology is advancing but remains a higher cost alternative to other clean
energy alternatives. As the technology improves, it has been incorporated into trucks
and vehicles, stationary power units, as well as forklifts. Longer term, we see an uptick
in heavy duty/high power applications in marine and trains/trams. However, any
meaningful success has largely come as a direct result of significant government
incentive programs to date. We are encouraged by the recent developments made in
fuel cell technology, most notably with the first commercially available fuel cell cars
hitting the road in the last few years, but significant progress must be made before
mass adoption takes place. In addition, it still remains to be seen which companies can
demonstrate a path to sustained profitable growth.
COWEN.COM50
COWEN
EQUITY RESEARCH
Nikola Corporation
June 17, 2020
There are numerous types of fuel cells which we highlight below. Most of the publicly
traded companies produce PEM fuel cells, described below. Bloom Energy specializes in
solid oxide fuel cells that have high efficiencies. FuelCell Energy is one of the few
producers of molten carbonate fuel cells in the world.
Figure 50 - Comparison of Fuel Cell Technologies
Source: Cowen and Company, U.S. Department of Energy
Fuel Cell
Type
Common
Electrolyte
Operating
Temp.
Typical
Stack
Size
Applications Advantages Challenges
Proton
Exchange
Membrane
(PEM)
Perfluorosulfonic
Acid
< 1200 C
< 1 kW –
100 kW
• Backup power
• Portable power
• Distributed
generation
• Transportation
• Specialty
vehicles
• Solid state electrolyte
reduces corrosion &
electrolyte
managementproblems
• Low temperature
• Quick start-up and
load following
• Expensivecatalysts
• Sensitive to fuel
impurities
Alkaline
(AFC)
Aqueous
potassium soaked
in a porous matrix
or alkaline
polymer
membrane
< 1000 C 1-100 kW
• Military
• Space
• Backup power
• Transportation
• Wider range of stable
materials allows lower
cost components
• Low temperatures
• Quick start-up
• Sensitive to CO2 in fuel
and air
• Electrolyte
management
(Aqueous)
• Electrolyte conductivity
(polymer)
Phosphoric
Acid (PAFC)
Phosphoricacid
soaked in a
porous matrix or
imbibed in a
polymer
membrane
150-2000 C 5-400 kW
• Distributed
generation
• Suitable for CHP
• Increased toleranceto
fuel impurities
• Expensivecatalyst
• Long start-up time
• Sulfur sensitivity
Molten
Carbonate
(MCFC)
Molten lithium,
sodium,or
potassium
carbonates
soaked in a
porous matrix
600-7000 C
300 kW –
3 MW,
300 kW
module
• Electric utility
• Distributed
generation
• High efficiency
• Fuel flexibility
• Suitable for CHP
• Hybrid/gas turbine
engine
• High temperature
corrosion and
breakdown ofcell
components
• Long start-up time
• Low power density
Solid Oxide
(SOFC)
Yttria stabilized
zirconia
500-10000
C
1kW –
2 MW
• Auxiliarypower
• Electric power
• Distributed
generation
• High efficiency
• Fuel flexibility
• Solid electrolyte
• Suitable for CHP
• High temperature
corrosion and
breakdown ofcell
components
• Long start-up time
• Limited number of
shutfdowns
COWEN.COM 51
COWEN
EQUITY RESEARCH
Nikola Corporation
June 17, 2020
What Is a Fuel Cell?
A fuel cell is a device that produces electricity by way of an electrochemical reaction.
These units combine fuels with ambient oxygen, producing electricity, water, and heat.
This is a clean electrical generation technology that emits significantly lower levels of
greenhouse gases that have been linked to global warming causation. The lower levels
of greenhouse gas emittance stems from the comparatively high efficiencies achieved
by fuel cell systems, which have reached levels north of 80% when the fuel cell’s waste
heat is captured- compared to ~33% for combustion engines. Different fuel cells, based
on their input fuels, have different characteristics, making each distinct fuel cell better
suited for different generation applications; transport, portable, or stationary.
How Does a Fuel Cell Work?
Fuel cells are electrochemical devices that combine hydrocarbon fuel with oxygen from
the air to produce electricity and heat. The process by which electricity is created is
electrochemical, not combustion based, making fuel cells the cleanest and most efficient
form of distributed power generation available. Similar to a battery, fuel cell technology
incorporates an anode and a cathode with an electrolyte in between.
Figure 51 – Fuel Cell Process Simplification
Source: Department of Energy
Fuel cell technology follows a relatively similar process regardless of the injected fuel.
The structure is somewhat similar to that of a battery, which generates energy using its
internally stored chemicals. The battery dies once theses stored chemicals are depleted.
Fuel cells are different in that they use an external source of chemical energy, a
At the Anode, a platinum
catalyst causes the
Hydrogen to split into
positive Hydrogen ions
(protons) & negatively
charged electrons
At the Cathode, the
electrons and
positively charged
hydrogen ions
combine with
Oxygen to form
Water, which flows
out of the cell
3
…while Oxygen from the air is
channeled to the cathode on the
other side of the cell
6
Hydrogen fuel is channeled through field
flow plates to the Anode on one side of
the fuel cell…
…and the negatively charged
electrons are forced to travel
along an external circuit to
the Cathode, creating an
electrical current
The Polymer
Electrolyte Membrane
(PEM) allows only the
positively charged ions
to pass through to the
cathode...
4 5
21
Energy from a fuel cell is produced
through an electrochemical reaction and
not combustion.
COWEN.COM52
COWEN
EQUITY RESEARCH
Nikola Corporation
June 17, 2020
hydrogen rich fuel, which can be continually injected into the cell, allowing it to
continuously generate electricity until its components fail.
Figure 52 – Basic Structure of a PEM Fuel Cell
Source: Fuel Cell Markets
A fuel cell’s structure revolves chiefly on an anode, cathode, and an electrolyte barrier
separating the two. Initially, hydrogen rich gas is injected into a flow chamber on the
anode side of the cell, while oxygen is injected into the flow chamber on the cathode
side of the cell. The natural relationship between hydrogen (H2) and oxygen (O2) – the
natural propensity for the molecules to combine to form water (H2O) is what drives the
electro chemical reaction. These gases are not able to immediately combine within the
cell due to the electrolyte barrier that exists between the cathode and the anode.
However, if the hydrogen molecule is split into protons and electrons, the positively
charge protons will be able pass through the electrolyte barrier, leaving the negatively
charged electrons behind. The catalyst component of the fuel cell, inserted immediately
next to the anode, reacts with hydrogen molecule as they are drawn to the cathode,
encouraging it to split. At this point, the molecule has broken down into positively
charged protons, and negatively charged electrons. The protons travel through
electrolyte to reach to the cathode chamber. Because, the negatively charged electrons
are unable to permeate the electrolyte barrier, they are forced to find another way to
the cathode.
Note that many fuel cell companies are aiming to use less catalyst as this is one of the
more expensive pieces of the bill of materials. Fuel cells require an electrocatalyst for
the reactions to proceed quickly at the low temperatures at which they operate. And the
very best catalyst is platinum. Of course, platinum is a precious metal that is expensive.
So if you use a lot of platinum, you can make a fuel cell work extremely well, but it will
be very expensive. In recent years companies like 3M, Ballard Power, Honda, and Toyota
COWEN.COM 53
COWEN
EQUITY RESEARCH
Nikola Corporation
June 17, 2020
have discovered ways of dramatically reducing the amount of platinum that is used
while increasing the performance of the fuel cell.
Fuel cells use a wire to link the anode and cathode, which circumvents the electrolyte
barrier and creates a path of least resistance for the electron to follow. The negatively
charged hydrogen electrons use this pathway to reach the cathode side of the cell. Once
the hydrogen electrons reach the cathode chamber, they recombine with the hydrogen
protons that made it through the electrolyte barrier, creating hydrogen which then
immediately combines with the oxygen to make water.
The wire on which the electrons travel to reach to the cathode side of the fuel cell
creates a constant electrical current. Importantly, the primary byproducts that this
system creates are heat and the water, making fuel cells an attractive technology for
power generation. It is important to mention that there are trace amounts of NOx, SOx,
and some other particulates, but are diminutive when compared to traditional forms of
energy generation.
It is key to take note that an individual fuel cell is not the entirety of the power
generation component. Fuel cell companies sell their technologies in what are called fuel
cell stacks, or simply, “stacks”. These stacks consist of multiple fuel cells side by side,
akin to a loaf of bread, combining to create a single unit that delivers a substantial
amount of power.
Fuel Cell Variations
The fundamental characteristics of fuel cells allow for various fuel cell technologies.
While the central design of a fuel cell does not change, different structural materials and
gaseous inputs can dramatically change the technological and economical profile of a
unit- and therefore, that unit’s suitability for transportation, portable, or stationary
power generation. The largest variables impacting the profiles of these units are the
input gas, and the nobility of the metal used as the catalyst.
Figure 53 – Megawatts Shipped by Fuel Cell Type
Source: Company reports, E4Tech, Fuel Cell Today, Cowen and Company estimates
-
200
400
600
800
1,000
1,200
2009 2010 2011 2012 2013 2014 2015 2016 2017 2018 2019
MWs PEMFC DMFC PAFC SOFC MCFC AFC
COWEN.COM54
COWEN
EQUITY RESEARCH
Nikola Corporation
June 17, 2020
Polymer electrolyte membrane fuel cells (“PEMFCs”) are typically fueled with pure
hydrogen and offer high power density, while employing relatively low weight and
volume. These FCs, also referred to as proton exchange membrane FCs, operate at a
relatively low temperature (80℃). Low operating temperatures allow FCs to start up
faster, making them more ideal for transportation needs, and it reduces the wear and
tear on the systems internal components, increasing system life. However, the lower
operating temperatures drive up the cost of the FC. At such temperatures, the system
catalyst must be a high quality, noble metal or the electrons and protons of the
hydrogen molecule will fail to split. This high-quality metal is usually platinum, and costs
significantly more than replacement metals that perform the needed catalytic functions
in higher temperature FCs. Secondly, platinum is easily susceptible to poisoning from
carbon monoxide, which can drastically reduce the efficiency of the system to the point
where it is no longer operable. In order to deracinate this risk an extra reactor must be
incorporated into the system, subsequently increasing costs. In order to combat a
number of the issues that drive up costs within PEMFCs, scientists have developed,
what are referred to as, high temperature PEM fuel cells that have an operating
temperature ranging from 150℃ to 200℃. At these temperatures, issues such as
susceptibility to carbon monoxide poisoning subside which allows for fewer system
components, reducing the cost of the fuel cell. As seen in figure 95, PEMFCs are far and
away the leading technology for fuel cell shipments.
Figure 54 – PEM Fuel Cell Structure
Source: Department of Energy
COWEN.COM 55
COWEN
EQUITY RESEARCH
Nikola Corporation
June 17, 2020
Molten carbonate fuel cells (“MCFCs”) are typically used for large, stationary power
generation. The MCFCs use an electrolyte composed of a molten carbonate salt mixture
and operates at a relatively high temperature, 650℃. The high operating temperatures
of these fuel cells serve as both a benefit and a negative for the systems economics. At
such high temperatures, the natural reaction kinetics are significantly improved,
meaning that a noble metal catalyst is not required to serve as a “booster” of sorts,
rather, various cheaper, non-precious metals can be used. These non-precious metals
are also not susceptible to carbon monoxide poisoning, meaning there is no need to
install an additional reactor. Finally, because of the high temperatures, the system
produces a substantial amount of waste heat, which, when captured, can boost the
overall fuel efficiencies to well over 80%. MCFCs also suffer because of their high
temperatures, chiefly because of the corrosive impact it has on the systems
components. Currently the life of an MCFC is roughly equivalent to five years.
Phosphoric acid fuel cells were the first FCs to be sold commercially. PAFCs are
generally used for stationary power generation but have been incorporated into larger
transportation vehicles such as buses. In situations where cogeneration can be captured,
these fuel cells can yield efficiency levels greater than 80%, however they offer only
slight efficiency improvements over combustion generation as a standalone electric
generator. PAFCs require a platinum catalyst and are less powerful than other FCs when
compared on a weight/volume basis.
We do note that while the megawatts are growing for fuel cells, the unit shipments are
generally flattish over the past several years. This is solely due to increases in energy
density per unit, which helps drive down costs relative to incumbent power solutions.
Figure 55 – Units Shipped by Fuel Cell Type
Source: Company reports, E4Tech, Fuel Cell Today, Cowen and Company estimates
-
10
20
30
40
50
60
70
80
2009 2010 2011 2012 2013 2014 2015 2016 2017 2018 2019
in thousands PEMFC DMFC PAFC SOFC MCFC AFC
COWEN.COM56
COWEN
EQUITY RESEARCH
Nikola Corporation
June 17, 2020
Solid oxide fuel cells are used for stationary power generation and the market is led by
Bloom Energy. These fuel cells reach temperatures of 1000℃, and can yield efficiencies
of over 60% without co-generation, making them extremely efficient. If waste heat
produced by the system is also harnessed, system efficiencies can achieve levels above
80%. Like other high-temp FCs, SOFCs benefit from not requiring a precious metal
catalyst. Because of the system’s extreme operating temperatures, input fuels actually
reform within the fuel cell which eliminates the need for external reforming and
increases the amount of hydrocarbon fuels that can be used in the system. What is also
unique about SOFCs, is due to their natural resistance to otherwise poisonous levels of
Sulphur, these units can also be fueled by coal gas. SOFCs carry most, if not all of the
benefits mentioned prior about high temperature FCs. However, because of these
extreme heats, SOFCs require additional safety precautions, such as heat shielding
components to protect personnel. These systems also suffer from durability concerns as
the extreme temperatures substantially increase the rate of wear on FC components.
Finally, alkaline fuel cells (“AFCs”) were one of the earliest developed fuel cell
technologies. This technology is famous for its incorporation on NASAs space shuttles,
where it was used to generate power and water for the astronauts onboard. AFCs
operate at a relatively low temperature, yet do not require a precious metal to be used
as its catalyst. The AFCs biggest downside is its heightened sensitivity to carbon dioxide
poisoning, which can dramatically impact the cells performance. This technology has not
been used recently.
Figure 56 - Comparison of Fuel Cell Technologies
Source: Cowen and Company
Fuel Cell Systems
Beyond the fuel technology choices above, each cell is part of a complete system which
can be difficult to integrate and control performance and lifetime characteristics. The
design of fuel cell systems is complex and varies according to cell type and application.
Generally, all fuel cell systems are composed of a stack (discussed above), a fuel
processor, a current converter, and a heat recovery system. In addition, most systems
also include subsystems to control cell humidity, temperature, gas pressure, and
wastewater.
Fuel Cell Type SOFC PAFC MCFC PEM-FC
Electrical Efficiency 65% 42% 47%-60% 30%
Modularity Yes No Yes Yes
Data Center Reliability Yes No Yes No
Readiness Shipping Shipping Shipping Shipping
Fuel Cell Stack Capability
Cycle Without Purge Gas Yes No No No
High Utilization Fraction Yes No No No
Automated Manufacturing Yes No No Possible
System Architecture
DC-Bus Centric Yes No No No
Rapid Installation Yes No No Small scale, portable
COWEN.COM 57
COWEN
EQUITY RESEARCH
Nikola Corporation
June 17, 2020
Fuel Cell Stack - The cell is the functional unit of the entire system, but does not produce
enough useful power in isolation, so it is electrically combined in series with other cells
to form the stack. The amount of direct current power generated by the stack is
dependent on cell type, size, operating temperature, and pressure.
Fuel Processor - The fuel processor converts fuel into a useable form by the fuel cell
through a reforming process. Hydrocarbon fuels are separated into a mixture of
hydrogen and carbon compounds, which are then sent to another reactor to remove
impurities, such as carbon monoxide. If these impurities reach the cell, they are said to
“poison” the catalyst by binding to it, reducing the efficiency and lifetime of the system.
The purified hydrogen is then fed to the cell for processing. Systems that are being fed
pure hydrogen and high temperature cells (such as molten carbonate and solid oxide
fuel cells) usually do not need a fuel processor, but some sort of filtration system is
usually still needed for impurity removal.
Current Inverters and Conditioners - Current inverters and conditioners convert the
electrical output of the fuel cell stack and make it useable for the required application.
The fuel cell produces direct current (DC), so if the intended application runs on
alternating current (AC), as in homes and offices, the current will have to be converted
by an inverter. Power conditioning applies to both types of current and refers to the
control of current flow, voltage, frequency, and other characteristics demanded by the
application. Conditioning reduces system efficiency by ~2-6%.
Heat Recovery System - The heat recovery system is used in cogeneration applications
to produce steam or hot water or converted to electricity via a gas turbine. This helps to
significantly increase the overall electrical efficiency of the system
Fuel Cell Technology Challenges
The fuel cell industry faces many challenges before full scale commercialization of the
technology takes place. In our view, cost, durability, system size, and heat recovery are
all areas that need further development and improvement to make fuel cells a
commercial reality. Of course, the hurdles are different for each application and
electrolyte technology, but generally, these issues need to be addressed across the
board.
Cost – To encourage adoption of fuel cells, the total cost of ownership must be lower
than that of the incumbent technology and the upfront cost should not be considerably
higher. Though total cost of ownership is the appropriate way to examine competing
technologies, initial costs are often the deciding factor when tight budgets need to be
met. In the automotive sector, internal combustion engines currently cost $25-35/kW,
while fuel cell systems cost ~$50/kW. The primary way to drive the cost down is to
continue reducing the usage of precious metal catalysts, such as platinum, in the fuel cell
stack. The price points for stationary systems are considerably higher, in the range of
$400-750/kW. In addition, the cost of hydrogen generation, storage, and distribution
needs to be reduced to the equivalent cost of gasoline for automotive applications.
Durability – Due to short operating history, the reliability and durability track record of
most fuel cell products remains unproven. For stationary applications, fuel cells must
have more than 40,000 hours of reliable operations in a temperature range of -35°C to
40°C. Automotive applications require a lifetime of at least 5,000 hours (equivalent to
150,000 miles), with the capability of rapid start in freezing temperatures, a hurdle
which is proving quite challenging for fuel cell manufacturers.
COWEN.COM58
COWEN
EQUITY RESEARCH
Nikola Corporation
June 17, 2020
System Size – The current size and weight of fuel cell systems needs to be reduced,
especially if automotive use is ever to gain wide adoption. This refers not only to the
stack, but also to the major subsystems and parts that make up the balance of system.
For automotive use, fuel storage presents a special problem due to the physical
properties of hydrogen. Hydrogen’s light weight means that it takes up a large amount
of space in gaseous form, resulting in larger storage tanks. Compressing and liquefying
hydrogen are very energy intensive compared to natural gas. In addition, hydrogen is
only in liquid form at cryogenic temperatures, making storage difficult for automotive
applications.
Heat Recovery Systems – The electrical efficiency of most fuel cell systems is not much
higher than the combustion of fossil fuels, but the cogeneration of heat in high
temperature fuel cells allows for overall efficiency of up to 80%. Low temperature fuel
cells, such as PEMs, have limited uses for thermal byproduct, necessitating the
development of more effective heat recovery systems.
Transportation Opportunities for Fuel Cells
Fuel efficiency continues to be a major focus of auto OEMs despite the recent drop in
fuel pricing. We see multiple technologies emerging, ranging from engine downsizing
leveraging turbo chargers, start-stop systems, hybrids, plug-in hybrids and full-EVs. In
general, we see a broader shift toward the electrified vehicle (hybrid and EV) driven by
substantial increases in fuel economy, which will enable OEMs to hit their regulatory
requirements in various end markets.
Figure 57 – Market for Fuel Cell Vehicles
Source: Ballard Power Investor Presentation – September 2018
OEMs continue to say regulatory mandates in the European Union, China, United States,
Mexico, Japan, South Korea, India, and Brazil are the driver for “greener” engines from a
fuel economy and CO2 perspective. Globally, about 28% of greenhouse gas emissions
emanate from the transportation sector. Governments continue to focus on driving
GHGs down and thus have regulations in place for the auto industry. To that end, the
price of fuel is not impacting the direction the industry is headed in terms of fuel
efficiency, new technology being added to the vehicle, or emission reduction initiatives.
OEMs stress regulatory mandates
already in place across the globe
are the catalyst for “greener”
engines from a fuel economy and
CO2 perspective.
COWEN.COM 59
COWEN
EQUITY RESEARCH
Nikola Corporation
June 17, 2020
Figure 58 – Greenhouse Gas Emissions (GHG) by Economic Sector
Note: Data last aggregated and reported in 2019, and therefore reflect 2018 emissions., Total Emissions in 2018 =
6,677 Million Metric Tons of CO2 equivalent.
Source: Cowen and Company, EPA
Exploring Various Fuel Cell Applications in Greater Detail
2019 was a pivotal year for the fuel cell industry. Shipments passed 1.1 GW, the first-
time industry broke the 1 GW barrier. There was a bevy of activity with strategic
partnerships and acquisitions made to move the industry forward. Materials handling,
buses and stationary power applications are driving the market today; however,
trucking, marine and trains all show promise toward the middle of the decade.
We explore these markets and others such as marine and trains in greater detail below.
Transportation solutions for heavy duty and commercial vehicles, buses and potentially
light duty vehicles have held a lot of promise in their use of fuel cells for the past two
decades. We see the most promise in heavy duty applications and buses and are more
cautious on passenger cars.
At the start of 2020, Bloomberg New Energy Finance estimates there were about
17,000 passenger cars utilizing fuel cells on the road, 4,250 fuel cell buses and about
1,000 commercial vehicles using fuel cells.
Transportation
28.2%
Electricity
26.9%
Industry
22.0%
Commercial &
Residential
12.3%
Agriculture
10.6%
COWEN.COM60
COWEN
EQUITY RESEARCH
Nikola Corporation
June 17, 2020
Figure 59 - Estimated number of FCVs on the road globally at the
beginning of 2020
Figure 60 - Cumulative number of FCVs sold in China by the end of 2019
Source: Bloomberg New Energy Finance
Note: CV stands for commercial vehicle. PV stands for passenger vehicle.
Source: Bloomberg New Energy Finance, China Association of Automobile
Manufacturers.
Note: CV stands for commercial vehicle. PV stands for passenger vehicle.
Bloomberg New Energy Finance is positive on the long-term future of fuel cell
transportation solutions assuming governments provide adequate support to scale the
market over the coming two decades. In the researcher’s long-term outlook, they
envision a scenario where governments around the world set zero tailpipe emission
targets for road transport by 2050 and chose to make hydrogen a significant part of
that vision. In that scenario, BNEF estimates FCVs could capture up to 25% of light duty
vehicle fleets, 30% of bus fleets, 50% of medium duty commercial vehicle fleets and 75%
of the heavy duty commercial vehicle fleet.
Heavy Duty Trucks and Commercial Vehicles
We see the heavy duty truck and commercial vehicle markets as the next potential end
market to adopt hydrogen fuel cell vehicles since fleet operators looking to transition
from fossil fuels see the benefits of hydrogen fuel cell electric vehicles compared to
battery electric vehicles in certain use cases. While infrastructure remains a challenge,
the similar experience to diesel trucks for hydrogen FCEVs, with quick refuel times,
compared to battery electric vehicles (who require grid upgrades), make hydrogen fuel
cells a much more attractive option for long-haul transport. We also see an opportunity
for shorter and medium distance transportation and delivery uses in cases where
hydrogen infrastructure built out for Amazon, Walmart, FedEx and other material
handling customers can be utilized for fleets.
17,000
4,250
22,250
0
5,000
10,000
15,000
20,000
Number ofFCVs
CV
Bus
PV
4,185
937
5,176
0
1,000
2,000
3,000
4,000
5,000
Number ofFCVs
PV
CV
Bus
COWEN.COM 61
COWEN
EQUITY RESEARCH
Nikola Corporation
June 17, 2020
Plug Power has provided fuel cell airport ground support equipment at FedEx’s
Memphis hub, where the 13,000 gas and diesel tuggers had traditionally been used,
resulted in air quality issues. Plug and its partner, Workhorse, are looking to expand
their fuel cell powered electric delivery truck project from the first trial vehicle to 20.
The vehicle features an 80 kWh, which alone would limit the vehicle’s range to about 60
miles. FedEx will be able to utilize the fuel cell to expand the range of the vehicles
relative to a battery only vehicle to approximately 150 miles, which is about the daily
average for a typical delivery truck. To meet the higher range needs, the Plug
Power/Workhorse delivery vehicle utilizes two 10kW fuel cell systems and 6 hydrogen
tanks containing 11.6kg that charges the battery throughout the day to enable
~156kWh of capacity.
Figure 61 - Progen Modular Architecture
Source: As Presented by Plug Power at the Battery Show 2018
The Class 8 market has largely shifted to natural gas in areas with CO2 restrictions, such
as California, and we see the hybrid fuel cell/battery solution as an intriguing
development. Ballard has tested units with Kenworth for drayage applications and we
see new entrants in the Class 8 market gaining steam in electrification. Note Cummins is
also active in the fuel cell market following their acquisition of Hydrogenics, so the
incumbent players are not standing still. Daimler and Volvo also formed a joint venture
in 2020 to aim to have a fuel cell truck on the road in the 2024/2025 timeframe.
Westport Fuel Systems has also indicated that the company's natural gas fuel injection
technology and compression systems are easily transferrable to hydrogen fuel as well.
Nikola has showcased its class 8 working Nikola Two prototypes and introduced its
Nikola Tre concept geared toward the North American and European markets
respectively. The vehicles will come in both a fuel cell electric variant targeting long
range transport, and a battery electric variant targeting shorter routes.
COWEN.COM62
COWEN
EQUITY RESEARCH
Nikola Corporation
June 17, 2020
Figure 62 - Nikola Two Fuel Cell Powered Truck
Source: Photographed by Cowen and Company at Nikola Word 2019
Nikola and Nel, its hydrogen infrastructure partner, are building out hydrogen refueling
stations utilizing electrolyzers. Each station will be sited at or near major customer
depots and along customer routes to ensure that utilization is high and customer range-
anxiety is low. By ensuring that new fueling locations are added directly in advance of
customer vehicle shipments, the partners believe they can successfully solve the chicken
and egg problem that has long inhibited greater fuel cell electric vehicle adoption.
Hydrogen will be produced on-site via Nel electrolysis technology. Nikola and Nel are
targeting 100% renewable energy to produce hydrogen. Nikola's power assumption of
~$0.35 per kWh is the key to the company's energy cost projections (achievable with
today's low cost of solar and wind power under a power purchase agreement as well as
nuclear in some areas). We believe 80-85% of the cost of producing hydrogen through
electrolyzers is the electricity cost. In addition to fueling the needs from Nikola trucks,
the company noted that it plans to offer standardized charging for other heavy-duty
CVs and meet the light duty vehicle charging standards used by Toyota and others who
have produced FCEVs in small scale production in California. Given the fixed energy
costs provided by PPAs, the company plans to charge ~$6 per kg of fuel, which is ~50%
of what early adopters of FCEVs in California are currently paying. Given infrastructure
remains a challenge for the entire fuel cell group under our coverage, we see this large-
scale build out as a potential catalyst for broader adoption and activity for the entire
space. We see the increased hydrogen availability at lower costs a long-term positive to
other fuel cell application providers.
We see dedicated route trucks as the most likely candidate for fuel cell trucking use.
These types of trucks make up about 25% of the market of 1.8 million trucks on the road
in the U.S. today. Dedicated routes are primarily comprised of private fleets and
dedicated operations of large for-hire carriers. For initial rollout of FCEV, we see Nikola,
Cummins, and others targeting the largest private and dedicated fleets with either
nationwide or significant regional distribution networks. Focus on dedicated routes
allows for targeted, capital-efficient deployment of hydrogen stations
COWEN.COM 63
COWEN
EQUITY RESEARCH
Nikola Corporation
June 17, 2020
Figure 63 - 1,800,000 class 8 semi-trucks on the road daily (1)
Source: Cowen and Company
(1) Includes both short-haul and long-haul heavy duty truck markets
(2) Including vehicle, fuel, and service & maintenance; based on proprietary research from ACT Research
Electrolyzers Are the Key to Green Hydrogen Generation To Drive Down
CO2 For Numerous Fuel Cell Applications
Hydrogen is the most abundant element on earth, accounting for 75% of mass and 90%
of atoms, but is rarely found free in nature. Instead, it forms compounds with all other
elements (except inert gases), meaning that none of the earth’s hydrogen is in a useable
form for fuel cells or other energy applications. However, hydrogen can be produced by
breaking the chemical bonds in water, hydrocarbon fuels, such as natural gas, oil, and
coal, and other compounds.
The hype about hydrogen relates to its potential as a pollution-free energy source,
which, coupled with its abundance in nature, makes it a very appealing fuel of the
future. When hydrocarbon fuels are burned, they produce carbon dioxide (CO2), which is
considered to be the primary cause of global warming, as well as nitrogen oxides (NOX)
and sulfur oxides (SOX), which form acid rain. In contrast, when hydrogen is
electrochemically combined with oxygen, the only products are pure water and heat.
While this is true in theory, practical applications of hydrogen as a fuel source yields
very different result.
There are many different applications for hydrogen overtime. We do not explore them
all in this report; however, the analysis below from The Hydrogen Council, an industry
consortium, highlights the growth opportunity across a diverse set of end markets.
+25%
450,000 trucks run on
dedicated routes
75%
1,350,000 trucks
COWEN.COM64
COWEN
EQUITY RESEARCH
Nikola Corporation
June 17, 2020
Figure 64 – Global Energy Demand Supplied with Hydrogen
Source: Hydrogen Council Presentation
Most of today’s anthropogenic hydrogen, both internationally and in the U.S., is
produced by steam methane reforming of natural gas. The steam methane reforming
process consists of two process steps. In the first step, the major component of natural
gas, methane (CH4), reacts with steam to form hydrogen and carbon monoxide. In the
second step, water gas shift, carbon monoxide is reacted with steam to produce
additional hydrogen and carbon dioxide. Pressure swing adsorption (PSA) technology is
needed for hydrogen purification in the steam-methane reforming (SMR) process, to get
high purity hydrogen suitable for fueling fuel cell electric vehicles (FCEVs). The PSA
process involves the adsorption of impurities from a hydrogen rich feed gas onto a fixed
bed of adsorbents at high pressure. The impurities are subsequently desorbed at low
pressure into off-gas stream which results in production of an extremely pure hydrogen
product (99.999%). Steam methane reforming systems have high production rates, and
need large investment to install, which makes them suitable for central production
facilities that produce tons of hydrogen every day, such as what a refinery or ammonia
facility would use.
156
114
79
70
63
63
56 70
98
196
545
2015 2020 2030 2040 2050
Global Energy Demand Supplied with Hydrogen
(in millions of tons)
Transportation Industrial Energy Building Heat & Power
Existing Feedstock Users New Feedstock (CCU, DRI) Power Generation, Buffering
COWEN.COM 65
COWEN
EQUITY RESEARCH
Nikola Corporation
June 17, 2020
Figure 65 – Hydrogen Industry Value Chain
Source: Cowen and Company
The least expensive and most common way of producing hydrogen is through a process
of reforming hydrocarbon fuels, where the chemical bonds between the hydrogen and
carbon atoms are broken. Steam reforming is the most common reforming method and
involves the mixing of fuel and steam in the presence of a metal catalyst. This produces
hydrogen and carbon monoxide, which is changed into carbon dioxide through a second
reaction. Over 90% of all hydrogen is produced through reforming, resulting in a
significant amount of CO2 being released, though some emissions savings is realized
through the high conversion efficiency of the process. In addition, when hydrogen is
burned with air, NOX is formed, due to the high nitrogen content of air. Companies like
Linde, Air Liquide and others are leaders in the hydrogen generation market from “grey”
sources using traditional natural gas and coal and over time expect to transition to
“blue” production where CO2 is managed.
Fossil Fuel
Nuclear
Solar
Wind
Hydropower
Electricity
Electrolysis
Steam
Methane
Reforming
Water
Hydrogen
Storage &
Reconversion
Natural Gas
Grid
Refineries
Methanol
Plants
Ammonia/
Urea Plants
Power
Electricity & Gas
Mobility
Industry
Farms
COWEN.COM66
COWEN
EQUITY RESEARCH
Nikola Corporation
June 17, 2020
Figure 66 – Blue and Green Hydrogen Production Value Chain
Source: Ballard Power
Renewable hydrogen is the foundation for achieving decarbonization in difficult to
otherwise electrify sectors. We can make renewable hydrogen from renewable solar
electricity and renewable wind electricity.
Transportation companies can decarbonize international freight and aircraft travel, long
haul trucks, and trains and all of these things that some people say we cannot
decarbonize with current technologies.
COWEN.COM 67
COWEN
EQUITY RESEARCH
Nikola Corporation
June 17, 2020
Figure 67 – Hydrogen Incumbents Can Leverage Existing Distribution Network
Source: Linde Investor Presentation
COWEN.COM68
COWEN
EQUITY RESEARCH
Nikola Corporation
June 17, 2020
In October 2019, Linde, a market leader in industrial gases, made an investment in ITM
Power. ITM is a British manufacturer of polymer electrolyte membrane (PEM)
electrolyzers. The two companies also formed a joint venture to implement ITM’s
equipment into hydrogen projects. Linde will focus on providing global green gas
solutions at an industrial scale – 10MW and up – using ITM Power’s modular PEM
electrolysis technology and Linde’s EPC expertise to deliver turnkey solutions to
customers. Air Liquide has also entered into an agreement with Engie for several
projects of green hydrogen.
The bulk of hydrogen is used for refining and ammonia production and produced with
natural gas according to figures from Platts and the International Energy Association.
Figure 68 – Global Pure Hydrogen Demand Figure 69 – Hydrogen Production Feedstock Energy (2018)
Source: Platts Analytics Webinar Presentation, March 2020
Water electrolysis is the second most common method of hydrogen production. Among
the challenges that face water electrolysis is the high system cost for electrolysis
systems which resulted in low penetrations of PEM electrolysis technology in the
market historically. Three major types of electrolyzers are currently produced
commercially:
 Alkaline electrolyzers are a demonstrated water electrolysis technology at
large scale, but they tend to have lower system efficiency.
 Polymer electrolyte membrane (PEM) electrolyzers work at temperatures
between 50°C and 95°C. PEM electrolysis is a commercial technology that
could still be improved through additional R&D to drive down costs, electricity
consumption and system efficiency.
 Solid oxide electrolyzers are still in early commercialization stage and still
need more work to scale up into commercial systems.
COWEN.COM 69
COWEN
EQUITY RESEARCH
Nikola Corporation
June 17, 2020
Alkaline electrolysis is considered an extremely mature technology and has been
marketed for decades. PEM electrolysis technology, on the other hand, has positioned
itself as a competitive technology and in the past had challenges in scaling to the MW
class system size. A PEM electrolyzer stack consists of repeating cells that are
electrically connected in series and reactant water/product gas connected in parallel.
Thick metal plates (called end plates) from both ends are added to structurally hold
these cells inside the stack. Large scale green hydrogen users such as Nikola Corporation
intend to use alkaline electrolyzers based on the terms of the June 2018 contract
between Nikola and Norwegian electrolyzer producer NEL. The agreement calls for up
to 448 stations across the US with a total capacity of 1 GW. Nikola believes that over
time they may need 700 stations to cover all of the United States and Canada. Based on
figures in the Nel press release, the electrolyzer count per station will average 16. The
figures also suggest that the devices will be A-485s, the company’s highest-capacity
units. Nel’s arrangement with Nikola calls for Nel to provide all elements of the fueling
station. In addition to electrolyzers, this will include equipment for compression,
storage, and dispensing. A station with 16 electrolyzers will require approximately 35.2
MW of power. We note that the NEL solution is modular so for $15-20 million can
produce 8,000 kg per day, which can serve approximately 210 trucks daily and consume
about 17.6 MW of electricity. Bloomberg New Energy Finance estimates that alkaline
electrolyzers cost about $1,200/kWh in 2019, a drop of about 40% since 2014.
At the core of each of these modules is a polymer membrane with cathode and anode
catalyst layers coated on the both sides of the membrane to form what is called
catalyst-coated membrane (CCM). The porous transport layer (PTL) is a layer that
enhances water diffusion and water splitting reaction on the surface of the membrane
in the electrolysis cells. Bipolar plates, as the name suggests, have a cathodic side and an
anodic side. Their main function is to separate cells in the stack, and they have channels
that facilitate the transport of water, hydrogen, and oxygen inside the stack.
Figure 70 – PEM Electrolysis Offers Numerous Advantages But Challenges With Multi-MW Scale
Source: NEL, Cowen and Company
Benefit PEM
Onsite
Generation
Alkaline Reformers Delivered
Dynamic Operating Range o o
Response Time o o o
Scale o
Lower Cost of Ownership o o
Safety o o o
Environmentally Friendly o o o
Storage o o o
Efficiency o
COWEN.COM70
COWEN
EQUITY RESEARCH
Nikola Corporation
June 17, 2020
Water electrolysis, which involves the breakdown of water into hydrogen gas and
oxygen gas by passing an electric current through water, has been used to create
hydrogen for over 100 years. The resultant hydrogen gas is then captured and used for
industrial gas applications, hydrogen fueling applications and in the storage of
renewable and surplus energy. Proton exchange membrane (PEM)-based
electrochemical technology was invented at General Electric Company (GE) in the mid-
1950s for use in the U.S. space program, and the technology ultimately was utilized
aboard NASA’s Gemini series of spacecraft in the 1960s. Through the 1970s and 1980s,
GE and later, Hamilton Sundstrand, developed robust and reliable PEM-based water
electrolysis technology for critical U.S. and U.K. submarine oxygen life support.
Figure 71 – Technology Development, Low Cost Feedstock and Policy Support Needed for Low
Carbon Hydrogen Production to Compete
Source: Platts Analytics Webinar Presentation, March 2020
Note: costs exclude transportation, storage, and dispensing equipment
Hydrogen pump prices in California today are typically in the $10 to $12/kg range.
Bloomberg New Energy Finance expects that with policy support, that could fall below
$4/kg by 2030. Note that the above figures from Platts exclude dispensing and storage
whereas the BNEF figures below are including these costs and are true at the pump
prices. We would also note that the energy cost assumptions by Platts at $65/MWh
look high in our view. We see onsite electrolysis using low cost renewable power as well
as including the costs of delivering the hydrogen to a pump from the steam methane
approach narrowing the gap between the two technologies over the coming years.
COWEN.COM 71
COWEN
EQUITY RESEARCH
Nikola Corporation
June 17, 2020
Figure 72 – Estimated Hydrogen Prices at the Pump
Source: Bloomberg New Energy Finance
Clearly a low cost electricity source is the driver to lower cost over time. Given the cost
curve of solar and wind, we expect more developers to look to sign deals with large
scale PEM electrolyzer facilities that would run at 90% or more capacity factors. We
estimate that 80-85% of the cost of producing hydrogen via electrolysis stems from
electricity cost assumptions.
Figure 73 – Relative Cost Advantage of SMR is Correlated with Natural Gas Price, Electricity Prices
and Electrolyzer Usage
Source: Platts Analytics Webinar Presentation, March 2020
Note: costs exclude transportation, storage, and dispensing equipment
To truly create pollution-free fuel cells, hydrogen must be produced by renewable
means and will likely take many years before reaching cost competitiveness. The
remaining 5-10% of hydrogen is produced through the electrolysis of water into
hydrogen gas and oxygen gas. This process itself does not give off any pollution, but
requires a significant amount of electricity, which is produced through the combustion
of hydrocarbon fuels (creating pollution). The ultimate goal is to power the electrolysis
reaction by renewable means, such as solar power or wind power. This will result in the
added benefit of being able to store excess power created by the renewable sources.
COWEN.COM72
COWEN
EQUITY RESEARCH
Nikola Corporation
June 17, 2020
Electrolysis is extremely energy intensive and will result in the hydrogen produced being
capable of generating one-quarter of the electricity that was initially used to produce
the hydrogen. Due to the high electric requirements of the process, it is typically 1.5-
3.0X more expensive than steam reforming, and when coupled with a renewable source
of energy, such as solar power, the cost disparity is even greater. When electrolysis can
be powered by renewable means, fuel cells can achieve the status as being pollution-
free, but this is a while away. In the near term, hydrogen will continue to be produced
primarily through steam reforming.
It takes about 11.1 liters, or about 2.9 gallons of water to produce 1 kilogram of
hydrogen. In most states, industrial waters costs are less than $10 per 1,000 gallons. An
8-ton electrolyzer station that consumes about 17.6MW of power is anticipated to
consume approximately 8.5 million gallons of water per year.
One kilogram of hydrogen contains nearly the same energy as one gallon of diesel and
offers the same amount of mileage (about 7-8 miles in most applications). This means
that for hydrogen to ever gain adoption as a fuel source, the total cost to the consumer
must at least be at parity with the incumbent fuel source. For automotive, that means
that hydrogen must cost between $3-$4/kg, approximately the cost of a gallon of
gasoline in recent years.
As intermittent renewables (wind and solar) gain ground, the grid will require more
sources of flexibility. This term encompasses a vast array of possible resources: flexible
generation, demand response, interconnection, and storage. We note that it is possible,
likely through a partner, that Nikola could look to leverage their hydrogen generation
stations in the power to gas market, essentially leveraging low cost electricity stored as
hydrogen to then be used for power generation in the future assuming a fuel cell was on
site, or at a minimum arbitraging electricity during the day. While not core to the
business today, we see the energy side of the Nikola model offering long-term
optionality as the network stations are built out.
Utilities seem to be increasingly looking at hydrogen solutions for longer duration
storage solutions, above and beyond what lithium ion can offer. Pilot projects that eOn
(now Unper) and Enbridge have undertaken over the past 5 years are proving to be
reference sites to showcase how hydrogen can be used at scale to absorb excess
renewables output, serving to balance and smooth the grid. Under the right conditions,
hydrogen can be produced in Germany using curtailed wind power overnight and
produce hydrogen at less than $2.50/kg, which is competitive with steam methane
reformation.
COWEN.COM 73
COWEN
EQUITY RESEARCH
Nikola Corporation
June 17, 2020
Figure 74 - Hydrogen Fits Into a Complex Storage Ecosystem
Source: Bloomberg New Energy Finance
Hydrogen storage systems can provide storage from days to months at a time,
compared to batteries which are typically limited to a few hours. Hydrogen is a means
of long term electricity storage because large volumes of the gas can be stored and
converted to and from power using electrolyzers and fuel cells. An electrolyzer uses
electricity to split water molecules, producing hydrogen and oxygen.
There are multiple applications for fuel cells and hydrogen solutions within the grid
landscape for both in front of the meter and behind the meter applications. In particular,
we see applications such as:
Power to Fuel – Hydrogen produced from electricity that is pressurized and used
directly as a fuel for fuel cell vehicles.
Power to Power – Hydrogen made from electricity that is pressurized, stored and
converted back into electricity via a fuel cell.
Power to Gas – Production of hydrogen from curtailed renewables and cheap wholesale
energy, compressing the hydrogen and then injecting it into the gas grid.
Discharge duration
System capacity
Seconds
Minutes
Hours
Days
Weeks
Months
1kW 100kW 1MW 10MW 100MW 1,000MW
Lithium-ion
batteries
Super capacitor
Compressed air
energy storage
Pumped hydroHydrogen
10kW
Sodium-sulfur batteries
Flow batteries
Flywheels
Electrical Mechanical Electrochemical Hydrogen-related
COWEN.COM74
COWEN
EQUITY RESEARCH
Nikola Corporation
June 17, 2020
Figure 75 - Hydrogen Pathways for Grid Applications Are Numerous
Source: Bloomberg New Energy Finance
Power-to-Gas Market Overview
Power-to-Gas technology effectively harvests electricity produced through renewable
sources (i.e. wind and solar) and readily converts said electricity into a more usable
form. In a Power-to-Gas system, excess electricity is converted via electrolysis into
hydrogen gas. This hydrogen gas is then methanized and fed into a natural gas pipeline,
where it can be transported and used at a later point in time for electricity production in
a cogeneration plant. The argument for menthanization of the gas, as opposed to the
straight transfer of hydrogen, is that hydrogen has a much lower volume-related energy
density, two-thirds lower than that of methane. The Power-to-Gas process provides a
long-term solution to the inherent fluctuations in renewable energy production and
provides a functional and time-tested energy storage solution that effectively bottles
the electricity produced by the wind and sun. Unlike other energy storage techniques,
Power-to-Gas provides the means to both store and transport energy resulting in higher
overall efficiency.
Hydrogenics, now part of Cummins, is pioneering Power-to-Gas technology, however,
implementation of this technology is still in its infancy. Cummins is still in the process of
working with utilities to demonstrate the effectivity and scalability of its technology,
setting the stage for future commercial project development. Progress has been made in
Germany and Canada thus far, but we believe many other countries are evaluating the
technology.
Non-renewable
electricity
generation
Utility-scale solar and wind
Fuel cells /
Thermal plants
Distributed solar and
wind
Electrolytic
hydrogen
production
Electrolytic
hydrogen
production
Hydrogen
separation
Methanation
Natural gas
plants
Gas storage
Electric grid
Microgrid,
backup power
Hydrogen
markets
(FCEV, industrial
uses, etc.)
Natural gas
markets (with
our without
hydrogen blend)
Source of oxygen
Source of
carbon
Upstream
hydrogen
injection
Downstream
hydrogen
injection
Conditioning
Hydrogen
storage
Non-renewable electricity
Renewable electricity
Hydrogen
Hydrogen/natural gas blend
Natural gas
Steam
methane
reformation
Reformer
COWEN.COM 75
COWEN
EQUITY RESEARCH
Nikola Corporation
June 17, 2020
Pilot projects are increasingly granted special access to exceed pipeline regulations for
power to gas demonstrations.
 Germany: 30% injection of hydrogen pilot into a microgrid outside the city of
Öhringen to begin in 2021.
 France: 20% blending in residential area of 100 homes and one commercial
center.
 United Kingdom: 20% blending in Keele University microgrid supporting 100
homes and 30 commercial buildings.
 Italy: 5% blending in gas pipeline feeding two industrial factories.
 Austria: 100kW PEM electrolyzer used for grid balancing and direct hydrogen
pipeline injection.
Outside of the Power-to-Gas market leveraging excess wind and storing the hydrogen
created through electrolysis in the natural gas pipelines, there is an opportunity to
participate in the biofuels market. Until 2015, the oil industry in Germany was required
to put a minimum percentage of biofuels on the market (6.25% energy content of their
transport fuel sales). The rules have changed in 2015 and now refiners must reduce the
greenhouse gas emissions of their products by 3.5% in 2015, 4% in 2017 and 6% by
2020. In the past, the “climate friendly” attributes of biofuels did not matter in Germany
as refiners just wanted gallons, regardless of how they were created. We believe the EU
Fuel Quality Directive could incentivize the deployment of low-carbon hydrogen
throughout the production process of conventional petroleum fuels.
Not only legislation is pushing the use of “clean” hydrogen in the refining sector, but also
more extensive process treatment of residues and higher diesel demand compared with
traditional gasoline is increasing hydrogen demand. Hydrogen is used in a traditional
refinery to hydro-treat crude oil as part of the refining process to improve the hydrogen
to carbon ratio of the fuel. Should renewable hydrogen be used in this production
process, we believe refineries can make solid progress in reducing their GHG footprint.
Coincidently, the bulk of the refineries in Germany are in Northern Germany, close to the
area where onshore and offshore wind farms are located that can be tapped cost
effectively to run through electrolyzers in off-peak hours to create renewable hydrogen.
History of Nikola Corporation
Nikola Corporation started as Nikola Motors in 2015 in Salt Lake City, Utah with the
build out of the initial development team. The company initially worked out of founder
Trevor Milton’s basement and started by hiring a chief engineer, chief designer and a
battery engineer. We believe tank supplier Worthington was Nikola’s first outside
investor, with current CEO Mark Russell having been the COO at Worthington and
during his tenure at Worthington, the company purchased Trevor Milton’s prior trucking
venture called dHybrd Systems which focused on natural gas trucking and was sold in
2014. Mr. Milton briefly worked for current CEO Mark Russel at Worthington before
leaving to start Nikola in 2015. Mr. Milton said in a media interview that he needed an
experienced hand to help build out and run Nikola and recruited Mark Russell to be
Nikola’s president last year, a title which he retains in addition to being CEO.
COWEN.COM76
COWEN
EQUITY RESEARCH
Nikola Corporation
June 17, 2020
The company began prototyping its Nikola One truck the following year before signing a
development partnership with Bosch and an equipment supply agreement with NEL in
2017. After 6 months of due diligence and allocating 100 engineers to the program,
Bosch became a strategic partner in early 2017 and an investor in the company in a
Series B round in late 2017. Bosch also participated in a subsequent Series C round in
2018. In 2018, Nikola signed an agreement with Anheuser-Busch for 800 vehicles and
expanded its relationship with NEL for the development of hydrogen fueling stations.
The company went on in 2019 to unveil the alpha version of its Nikola Two truck at
Nikola World and entered into a North American production alliance and European JV
with CNHI/Iveco. Prior to the JV with CNH/Iveco, Nikola had signed a deal with
Fitzgerald Glider Kits to build the first 5,000 Nikola trucks before the Arizona factory
opens. The company has moved primary operations to Phoenix, Arizona, where it
conducts the majority of its research and development as well as its initial
manufacturing operations. In March of 2020 the company merged with VectoIQ (VTIQ)
via a business combination and now trades publicly under the ticker NKLA.
Key Risk Factors to Consider
Operational Risks
Production Risk – Nikola is has not yet commenced full scale production of any of the
company’s battery powered for fuel cell vehicles. There is risk that production delays
could not only delay revenue recognition, but lead to order cancelations if customers
find alternative solutions
Product Risk - The success of Nikola’s products are dependent on market acceptance,
which is influenced by many factors including cost competitiveness of fuel cell products
and consumers’ reluctance to trying new products.
Technology Risk – There is a risk that the company’s battery or fuel cell technology is
not able to compete with its competitor’s efforts on either a cost or performance basis.
Strategic Risks
Customer Diversification Risk – Nikola is currently engaged with several large fleet
operators for its initial vehicle launches through 2023. Customer concentration could be
a material risk for the company in the event the company invests in hydrogen
infrastructure to accommodate a fleet operator that is not willing or unable to operate
the Nikola vehicles.
Regulatory Risk – There is a risk that current emission restrictions are relaxed,
potentially offsetting the urgency for fleets to reduce their carbon footprint
Financial Risks
Currency Risk – Nikola, through the use of a JV, is seeking to enter into the European
market. Currency fluctuations could have a material impact on any components that
require local sourcing and could also impact the sale price. We also note there is a
currency translation risk when the company reports earnings on sales originating in
countries outside of the United States.
COWEN.COM 77
COWEN
EQUITY RESEARCH
Nikola Corporation
June 17, 2020
Financing Risk – The company’s ability to access capital through debt financing will likely
be critical for its hydrogen infrastructure buildout, absent a partner willing to fund the
endeavor. Additionally, given Nikola’s intention to securitize its truck leases an adverse
event in the credit markets may make it more difficult to maintain liquidity if the market
become inaccessible.
Valuation and Price Target
We value Nikola Corporation using a blend of 2023 and 2025 multiples. Given Nikola’s
rollout of stations will likely take 8 to 10 years to complete, we believe a long-term view
of potential earnings power is warranted. The challenge with this approach is few
companies in the hydrogen economy peer group have estimates beyond 2023.
Our $79 price target is derived using a blend of 2023 and 2025 EV/Sales multiples. We
use a 22x EV/Sales multiple on our 2023 revenue estimate. We believe the recurring
revenue nature of Nikola’s business model due to the hydrogen fuel and service revenue
deserve a premium to the peer group.
Why are modeling is likely overly conservative: We note that our modeling of Nikola is
entirely based off of the North American trucking opportunity and assumes all
CNH/Iveco produced units in Ulm, Germany enter the U.S. market and the JV does not
focus on Europe. We also are assuming no regulatory credits aide the company, no
residual value of the trucks, and also no 3rd parties assist with the capital expenses of
the station buildout which is anticipated to be completed toward the end of the decade.
In addition, we are assuming no revenue contribution at all from the Nikola Badger
pickup truck program, which management in recent Twitter, media and investor
conference appearances has indicated is a program they aim to commercialize in 2022
and beyond leveraging third parties. We believe the optionality of these programs is
baked into expectations of the stock today; however, given the lack of clarity on timing
and scope, we are reluctant to model the program. We also note that while Nikola
believes they can outsell the Ford F-series pickup truck line, which sells just under 1
million units per year, we believe sales in the 50,000 to 100,000 are more attainable
after a year or two of production should the vehicle be commercialized. If the company
sold 50,000 vehicles at a price of $70,000, that would add about $3.5 billion of annual
revenue to our estimates. Given the desire to use 3rd
party manufacturing, we don’t see
margins being inline with Nikola’s trucks or Tesla in the mid-20s and likely in the low to
mid-teens.
COWEN.COM78
COWEN
EQUITY RESEARCH
Nikola Corporation
June 17, 2020
Figure 76 - Nikola Corporation EV/Sales Figure 77 – Nikola Corporation – EV/EBITDA
Source: Thomson Reuters, Cowen and Company
We see Nikola’s projected growth and future margin profile above the peer groups
shown below and also note the recurring nature of fuel revenue in 2025 beyond as the
installed base and fueling station network accelerates.
Figure 78 – Future Transportation Peers
EV/Sales
Figure 79 – Hydrogen Economy Peers
EV/Sales
Figure 80 – Commercial Vehicle Peers
EV/Sales
Source: Thomson Reuters Consensus Estimates
Figure 81 – Future Transportation Peers
EV/EBITDA
Figure 82 – Hydrogen Economy Peers
EV/EBITDA
Figure 83 – Commercial Vehicles EV/EBITDA
Source: Thomson Reuters Consensus Estimates
88.5x
18.8x
8.2x
4.7x 3.4x 2.6x
0.0x
10.0x
20.0x
30.0x
40.0x
50.0x
60.0x
70.0x
80.0x
90.0x
100.0x
2022E 2023E 2024E 2025E 2026E 2027E
145.8x
39.9x
28.0x
18.6x
0.0x
20.0x
40.0x
60.0x
80.0x
100.0x
120.0x
140.0x
160.0x
CY 2024 CY 2025 2026E 2027E
0.0x
2.0x
4.0x
6.0x
8.0x
10.0x
12.0x
2022E 2023E 2024E 2025E
NIO Inc Virgin Galactic Holdings Inc Tesla Inc
0.0x
5.0x
10.0x
15.0x
20.0x
25.0x
30.0x
35.0x
40.0x
2022E 2023E 2024E 2025E
Ballard Power Systems Inc ITM Power PLC
Nel ASA Plug Power Inc
Powercell Sweden AB (publ)
0.0x
0.2x
0.4x
0.6x
0.8x
1.0x
1.2x
1.4x
1.6x
1.8x
2022E 2023E 2024E
Navistar International Corp Paccar Inc Traton SE Volvo AB
0.0x
10.0x
20.0x
30.0x
40.0x
50.0x
60.0x
70.0x
2022E 2023E 2024E 2025E
NIO Inc Virgin Galactic Holdings Inc Tesla Inc
0.0x
20.0x
40.0x
60.0x
80.0x
100.0x
120.0x
140.0x
160.0x
180.0x
2022E 2023E 2024E
Ballard Power Systems Inc ITM Power PLC
Nel ASA Plug Power Inc
Powercell Sweden AB (publ)
0.0x
2.0x
4.0x
6.0x
8.0x
10.0x
12.0x
2022E 2023E 2024E
Navistar International Corp Paccar Inc Traton SE Volvo AB
COWEN.COM 79
COWEN
EQUITY RESEARCH
Nikola Corporation
June 17, 2020
Charts and Exhibits
Figure 84 – Revenue and Growth Rate (Y/Y)
Source: Cowen and Company, Company Reports
Figure 85 – Gross Profit and Gross Margin
Source: Cowen and Company, Company Reports
0.0%
50.0%
100.0%
150.0%
200.0%
250.0%
300.0%
350.0%
400.0%
450.0%
0.00
2000.00
4000.00
6000.00
8000.00
10000.00
12000.00
F1Q20E
F2Q20E
F3Q20E
F4Q20E
F1Q21E
F2Q21E
F3Q21E
F4Q21E
F1Q22E
F2Q22E
F3Q22E
F4Q22E
F1Q23E
F2Q23E
F3Q23E
F4Q23E
F1Q24E
F2Q24E
F3Q24E
F4Q24E
F1Q25E
F2Q25E
F3Q25E
F4Q25E
F1Q26E
F2Q26E
F3Q26E
F4Q26E
F1Q27E
F2Q27E
F3Q27E
F4Q27E
2020E
2021E
2022E
2023E
2024E
2025E
2026E
2027E
Revenue ($mn)
Revenue ($ millions) Change Y/Y (%)
-20.0%
-15.0%
-10.0%
-5.0%
0.0%
5.0%
10.0%
15.0%
20.0%
25.0%
30.0%
-500
0
500
1000
1500
2000
2500
3000
F1Q20E
F2Q20E
F3Q20E
F4Q20E
F1Q21E
F2Q21E
F3Q21E
F4Q21E
F1Q22E
F2Q22E
F3Q22E
F4Q22E
F1Q23E
F2Q23E
F3Q23E
F4Q23E
F1Q24E
F2Q24E
F3Q24E
F4Q24E
F1Q25E
F2Q25E
F3Q25E
F4Q25E
F1Q26E
F2Q26E
F3Q26E
F4Q26E
F1Q27E
F2Q27E
F3Q27E
F4Q27E
2020E
2021E
2022E
2023E
2024E
2025E
2026E
2027E
Margin %Gross Profit ($ mn)
Gross Profit ($ millions) Gross Margin (%)
COWEN.COM80
COWEN
EQUITY RESEARCH
Nikola Corporation
June 17, 2020
Figure 86 – Operating Profit and Operating Margin
Source: Cowen and Company, Company Reports
Figure 87 – Adjusted EBITDA and Adjusted EBITDA Margin
Source: Cowen and Company, Company Reports
-1200.0%
-1000.0%
-800.0%
-600.0%
-400.0%
-200.0%
0.0%
200.0%
-400
-200
0
200
400
600
800
1000
F1Q20E
F2Q20E
F3Q20E
F4Q20E
F1Q21E
F2Q21E
F3Q21E
F4Q21E
F1Q22E
F2Q22E
F3Q22E
F4Q22E
F1Q23E
F2Q23E
F3Q23E
F4Q23E
F1Q24E
F2Q24E
F3Q24E
F4Q24E
F1Q25E
F2Q25E
F3Q25E
F4Q25E
F1Q26E
F2Q26E
F3Q26E
F4Q26E
F1Q27E
F2Q27E
F3Q27E
F4Q27E
2020E
2021E
2022E
2023E
2024E
2025E
2026E
2027E
Margin %Operating Profit ($ mn)
Operating Profit Operating Margin (%)
-1000.0%
-900.0%
-800.0%
-700.0%
-600.0%
-500.0%
-400.0%
-300.0%
-200.0%
-100.0%
0.0%
100.0%
-400
-200
0
200
400
600
800
1000
1200
1400
1600
F1Q20E
F2Q20E
F3Q20E
F4Q20E
F1Q21E
F2Q21E
F3Q21E
F4Q21E
F1Q22E
F2Q22E
F3Q22E
F4Q22E
F1Q23E
F2Q23E
F3Q23E
F4Q23E
F1Q24E
F2Q24E
F3Q24E
F4Q24E
F1Q25E
F2Q25E
F3Q25E
F4Q25E
F1Q26E
F2Q26E
F3Q26E
F4Q26E
F1Q27E
F2Q27E
F3Q27E
F4Q27E
2020E
2021E
2022E
2023E
2024E
2025E
2026E
2027E
Margin %Adjusted EBITDA ($ mn)
Adjusted EBITDA EBITDA Margin (%)
COWEN.COM 81
COWEN
EQUITY RESEARCH
Nikola Corporation
June 17, 2020
Nikola Corporation
Summarized Income Statement - December Fiscal Year
(Dollar amounts in millions, except per share)
Fiscal Fiscal Fiscal Fiscal Fiscal Fiscal Fiscal Fiscal Fiscal
Year 1QA 2QE 3QE 4QE Year 1QE 2QE 3QE 4QE Year Year Year Year Year Year Year
2019A Mar-20 Jun-20 Sep-20 Dec-20 2020E Mar-21 Jun-21 Sep-21 Dec-21 2021E 2022E 2023E 2024E 2025E 2026E 2027E
Revenue $0.48 $0.058 $0.000 $0.000 $0.000 $0.058 $0.000 $0.000 $7.500 $75.000 $82.500 $300.000 $1,413.491 $3,223.488 $5,630.958 $7,708.216 $10,321.097
% y-o-y change 179% -53% -100% -100% -100% -88% -100% 142141% 264% 371% 128% 75% 37% 34%
Incremental Revenue 0.3 0.0 (0.1) 0.0 0.0 (0.4) 0.0 0.0 7.5 67.5 82.4 217.5 1,113.5 1,810.0 2,407.5 2,077.3 2,612.9
Cost of Goods Sold $0.27 $0.000 $0.000 $0.000 $0.000 $0.00 $0.000 $0.000 $8.550 $85.500 $94.05 $302.27 $1,252.58 $2,660.56 $4,250.65 $5,658.90 $7,542.69
Gross Profit (GAAP) 0.21 0.06 - - - 0.06 - - (1.05) (10.50) (11.55) (2.27) 160.91 562.93 1,380.31 2,049.31 2,778.41
Total Gross Profit Margin (GAAP) 43.8% 100.0% 100.0% -14.0% -14.0% -14.0% -0.8% 11.4% 17.5% 24.5% 26.6% 26.9%
Operating Expenses
Selling, General and Administrative 20.69 17.805 20.476 22.933 25.226 86.441 26.488 27.812 29.203 30.663 114.166 153.009 283.647 473.506 769.340 1,056.339 1,295.364
% of Revenues 4292.9% 30699.0% 149036.2% 389.4% 40.9% 138.4% 51.0% 20.1% 14.7% 13.7% 13.7% 12.6%
Research and Development 67.51 14.269 31.738 38.086 39.990 124.082 46.388 47.084 46.142 45.681 185.296 125.349 133.903 169.375 328.022 533.393 677.782
% of Revenues 14007.1% 24601.0% 213934.6% 615.2% 60.9% 224.6% 41.8% 9.5% 5.3% 5.8% 6.9% 6.6%
Total Operating Expenses (GAAP) 88.21 32.07 52.21 61.02 65.22 210.52 72.88 74.90 75.35 76.34 299.46 278.36 417.55 642.88 1,097.36 1,589.73 1,973.15
% of Revenues 18300.0% 55300.0% 362970.7% 1004.6% 101.8% 363.0% 92.8% 29.5% 19.9% 19.5% 20.6% 19.1%
Operating Income (GAAP) (88.00) (32.02) (52.21) (61.02) (65.22) (210.47) (72.88) (74.90) (76.40) (86.84) (311.01) (280.63) (256.64) (79.95) 282.94 459.58 805.26
EBIT Margin -18256.2% -552 -362870.7% -1018.6% -115.8% -377.0% -93.5% -18.2% -2.5% 5.0% 6.0% 7.8%
% y-o-y Change 25% 36% 163% 419% 178% 139% 128% 43% 25% 33% 48% -10% -9% -69% -454% 62% 75%
EBITDA (GAAP) (104.45) (32.40) (54.11) (63.82) (66.32) (216.65) (69.58) (68.40) (64.90) (70.34) (273.21) (178.63) (84.64) 182.05 664.94 946.58 1,427.26
EBITDA Margin -21671.0% -55859% -373529.4% -865% -94% -331.2% -59.5% -6.0% 5.6% 11.8% 12.3% 13.8%
% y-o-y Change 57% 36% 172% 450% 187% 107% 115% 26% 2% 6% 26% -35% -53% -315% 265% 42% 51%
Other (income) expense, net 0.51 1.15 4.50 7.20 6.50 19.35 5.70 5.00 5.00 5.10 20.80 21.03 54.81 111.26 210.92 332.02 498.14
Interest expense (1.46) 0.06 0.50 1.00 1.00 2.56 1.00 1.50 1.50 1.60 5.60 9.03 36.81 93.26 192.92 314.02 480.14
Pre-Tax Income (88.51) (33.16) (56.71) (68.22) (71.72) (229.81) (78.58) (79.90) (81.40) (91.94) (331.81) (301.66) (311.45) (191.21) 72.02 127.56 307.12
Income Taxes (Credit) 0.15 0.00 - - - 0.00 - - - - - - - - - - -
Effective Tax Rate -0.2% 0.0% 0.0% 0.0% 0.0% 0.0% 0.0% 0.0% 0.0% 0.0% 0.0% 0.0% 0.0% 0.0% 0.0% 0.0% 0.0%
Reported Net Income (Loss) (105.47) (33.16) (56.71) (68.22) (71.72) (229.81) (78.58) (79.90) (81.40) (91.94) (331.81) (301.66) (311.45) (191.21) 72.02 127.56 307.12
EPS (GAAP) ($0.29) ($0.08) ($0.13) ($0.16) ($0.17) ($0.54) ($0.18) ($0.19) ($0.19) ($0.21) ($0.77) ($0.69) ($0.70) ($0.43) $0.16 $0.28 $0.66
Weighted Average Share Count 359.139 403.907 424.500 425.561 426.625 420.148 427.692 428.761 429.833 436.807 430.773 439.544 443.956 448.413 452.913 457.460 462.051
Adjusted EBITDA (79.441) (32.398) (54.114) (63.819) (66.316) (216.647) (69.576) (68.396) (64.895) (70.344) (273.211) (178.628) (84.642) 182.046 664.944 946.582 1,427.263
Adjusted EBITDA Margin -16481.5% -55858.6% -373529.4% -865.3% -93.8% -331.2% -59.5% -6.0% 5.6% 11.8% 12.3% 13.8%
Selected Balance Sheet Items and Statistics
Cash, Equivalents & ST Investments $101.4 $744.9 $906.0 $791.8 $671.0 $671.0 $522.4 $377.6 $231.1 $593.4 $593.4 $101.8 $119.2 $165.6 $270.7 $157.8 $640.9
Sequential % Change -42% 635% 22% -13% -15% 562% -22% -28% -39% 157% -12% -83% 17% 39% 63% -42% 306%
Sequential Absolute Change ($73) $644 $161 ($114) ($121) $570 ($149) ($145) ($146) $362 ($78) ($492) $17 $46 $105 ($113) $483
Cash & Equivalents $101.4 $744.9 $906.0 $791.8 $671.0 $671.0 $522.4 $377.6 $231.1 $593.4 $593.4 $101.8 $119.2 $165.6 $270.7 $157.8 $640.9
Accounts Receivables $0.0 $0.4 $0.0 $0.0 $0.0 $0.0 $0.0 $0.0 $2.5 $25.0 $25.0 $30.8 $155.3 $337.9 $552.6 $709.6 $910.6
DSOs 12 30 30 30 30 0 30 30 30 30 111 38 40 38 36 34 32
Inventories $0.0 $0.0 $0.0 $0.0 $0.0 $0.0 $0.0 $0.0 $2.3 $22.8 $22.8 $23.2 $105.8 $218.0 $326.1 $416.3 $531.1
Inventory Turns 15.0 15.0 15.0 15.0 15.0 15.0 15.0 15.0 4.1 13.0 11.8 12.2 13.0 13.6 14.2
Accounts Payable $0.0 $7.6 $0.0 $0.0 $0.0 $0.0 $0.0 $0.0 $4.8 $47.5 $47.5 $48.3 $220.3 $454.1 $679.4 $867.2 $1,106.4
Estimated Cash Flows (Operating Activities Only, Does Not Include Financing etc...)
Change in Accounts Receivables (Cash Dec.) (0.01) (0.43) 0.45 - - 0.02 - - (2.50) (22.50) (25.00) (5.83) (124.44) (182.65) (214.70) (156.98) (201.03)
Change in Accounts Payables (Cash Dec.) (16.50) 7.55 (7.55) - - - - - 4.75 42.75 47.50 0.81 172.04 233.72 225.28 187.85 239.21
Change in Inventories (Cash Dec.) - - - - - - - - (2.28) (20.52) (22.80) (0.39) (82.58) (112.19) (108.14) (90.17) (114.82)
Estimated Cash from Operating Activities (94.88) (25.34) (61.72) (64.82) (67.32) (219.20) (70.58) (69.90) (66.43) (72.21) (279.11) (193.07) (156.42) 27.68 374.47 573.26 870.48
Est. Free Cash Flow (CFO minus Capex) (95.75) (26.78) (113.82) (114.12) (120.82) (375.53) (148.58) (144.90) (146.43) (139.21) (579.11) (491.57) (554.92) (714.82) (971.03) (1,205.74) (925.52)
Capital Expenditures (0.88) (1.44) (52.10) (49.30) (53.50) (156.34) (78.00) (75.00) (80.00) (67.00) (300.00) (298.50) (398.50) (742.50) (1,345.50) (1,779.00) (1,796.00)
Depreciation and amortization 2.32 0.70 2.10 3.40 4.40 10.60 8.00 10.00 15.00 20.00 53.00 114.00 190.00 280.00 400.00 505.00 640.00
Source: Company data, Cowen and Company estimates
COWEN.COM82
COWEN
EQUITY RESEARCH
Nikola Corporation
June 17, 2020
VALUATION METHODOLOGY AND RISKS
Valuation Methodology
Sustainable Energy & Industrial Technology:
Our primary inputs to valuation are earnings and earnings growth (P/E and PEG) for the
next two years. In cases where GAAP net income includes large, non-cash items (e.g., SBC
or intangible amortization), we may use non-GAAP EPS. For companies with an emerging
business model, we may use future-year earnings discounted back. As a cross check to an
earnings multiple, we may also use a DCF analysis. For situations where earnings are not
visible within our forecast horizon, we may use asset values (P/Book, P/TBV).
Investment Risks
Sustainable Energy & Industrial Technology:
Demand for Sustainable Technology may be strongly influenced by government regulations,
subsidies, and mandates as well as the overall health of the global macro economy. Share
prices and financial results may be sensitive to policy changes and outcomes may be difficult
to predict, due to the political nature of the process.
Risks To The Price Target
Operational Risks
Production Risk – Nikola is has not yet commenced full scale production of any of the
company’s battery powered for fuel cell vehicles. There is risk that production delays
could not only delay revenue recognition, but lead to order cancelations if customers find
alternative solutions
Product Risk - The success of Nikola’s products are dependent on market acceptance,
which is influenced by many factors including cost competitiveness of fuel cell products and
consumers’ reluctance to trying new products.
Technology Risk – There is a risk that the company’s battery or fuel cell technology is not
able to compete with its competitor’s efforts on either a cost or performance basis.
Strategic Risks
Customer Diversification Risk – Nikola is currently engaged with several large fleet operators
for its initial vehicle launches through 2023. Customer concentration could be a material
risk for the company in the event the company invests in hydrogen infrastructure to
accommodate a fleet operator that is not willing or unable to operate the Nikola vehicles.
Regulatory Risk – There is a risk that current emission restrictions are relaxed, potentially
offsetting the urgency for fleets to reduce their carbon footprint
Financial Risks
Currency Risk – Nikola, through the use of a JV, is seeking to enter into the European market.
Currency fluctuations could have a material impact on any components that require local
sourcing and could also impact the sale price. We also note there is a currency translation
risk when the company reports earnings on sales originating in countries outside of the
United States.
Financing Risk – The company’s ability to access capital through debt financing will likely
be critical for its hydrogen infrastructure buildout, absent a partner willing to fund the
endeavor. Additionally, given Nikola’s intention to securitize its truck leases an adverse event
in the credit markets may make it more difficult to maintain liquidity if the market become
inaccessible.
COWEN.COM 83
COWEN
EQUITY RESEARCH
Nikola Corporation
June 17, 2020
ADDENDUM
Stocks Mentioned In Important Disclosures
Ticker Company Name
APTV Aptiv PLC
HASI Hannon Armstrong
NKLA Nikola Corporation
SEDG SolarEdge Technologies
Analyst Certification
Each author of this research report hereby certifies that (i) the views expressed in the research report accurately reflect his or her personal views about any and all of the subject
securities or issuers, and (ii) no part of his or her compensation was, is, or will be related, directly or indirectly, to the specific recommendations or views expressed in this report.
Important Disclosures
Cowen and Company, LLC and or its affiliates make a market in the stock of Nikola Corporation, Aptiv PLC, Hannon Armstrong and SolarEdge Technologies securities.
Cowen and Company, LLC managed or co-managed a public offering of Nikola Corporation in the past 12 months.
Cowen and Company, LLC received compensation for investment banking services from Nikola Corporation in the past 12 months.
Cowen and Company, LLC and/or its affiliates expect to receive, or intend to seek, compensation for investment banking services in the next 3 months from Nikola Corporation.
Nikola Corporation is or has been in the past 12 months a client of Cowen and Company, LLC; Cowen and Company, LLC has provided or is providing investment banking services
during the past 12 months.
Cowen and Company, LLC compensates research analysts for activities and services intended to benefit the firm's investor clients. Individual compensation determinations for research
analysts, including the author(s) of this report, are based on a variety of factors, including the overall profitability of the firm and the total revenue derived from all sources, including
revenues from investment banking, sales and trading or principal trading revenues. Cowen and Company, LLC does not compensate research analysts based on specific investment
banking transactions or specific sales and trading or principal trading revenues.
Disclaimer
Our research reports are simultaneously available to all clients are on our client website. Research reports are for our clients only. Not all research reports are disseminated, e-mailed
or made available to third-party aggregators. Cowen and Company, LLC is not responsible for the redistribution of research by third party aggregators. Selected research reports are
available in printed form in addition to an electronic form. All published research reports can be obtained on the firm’s client website, https://cowenlibrary.bluematrix.com/client/
library.jsp.
The information, opinions, estimates and forecasts are as of the date of this report and subject to change without prior notification. We seek to update our research as appropriate, but
various regulations may prevent us from doing so. Research reports are published at irregular intervals as appropriate in the analyst’s judgement.
Further information on subject securities may be obtained from our offices. This research report is published solely for information purposes, and is not to be construed as an offer
to sell or the solicitation of an offer to buy any security in any state where such an offer or solicitation would be illegal. Other than disclosures relating to Cowen and Company, LLC,
the information herein is based on sources we believe to be reliable but is not guaranteed by us and does not purport to be a complete statement or summary of the available data.
Any opinions expressed herein are statements of our judgment on this date and are subject to change without notice. The opinions and recommendations herein do not take into
account individual client circumstances, objectives or needs and are not intended as recommendations of investment strategy. The recipients of this report must make their own
independent decisions regarding any securities subject to this research report. In some cases, securities and other financial instruments may be difficult to value or sell and reliable
information about the value or risks related to the security or financial instrument may be difficult to obtain. To the extent that this report discusses any legal proceedings or issues,
it has not been prepared to express or intended to express any legal conclusion, opinion or advice. Our salespeople, traders and other professionals may provide oral or written
market commentary or trading strategies to our clients that reflect opinions that are contrary to the opinions expressed in our research. Our principal trading area and investing
businesses may make investment decisions that are inconsistent with recommendations or views expressed in our research. Cowen and Company, LLC maintains physical, electronic
and procedural information barriers to address the flow of information between and among departments within Cowen and Company, LLC in order to prevent and avoid conflicts of
interest with respect to analyst recommendations.
For important disclosures regarding the companies that are the subject of this research report, please contact Compliance Department, Cowen and Company, LLC, 599 Lexington
Avenue, 20th Floor, New York, NY 10022. In addition, the same important disclosures, with the exception of the valuation methods and risks, are available on the Firm's disclosure
website at https://cowen.bluematrix.com/sellside/Disclosures.action.
Equity Research Price Targets: Cowen and Company, LLC assigns price targets on all companies covered in equity research unless noted otherwise. The equity research price target
for an issuer's stock represents the value that the analyst reasonably expects the stock to reach over a performance period of twelve months. Any price targets in equity securities
in this report should be considered in the context of all prior published Cowen and Company, LLC equity research reports (including the disclosures in any such equity report or on
the Firm's disclosure website), which may or may not include equity research price targets, as well as developments relating to the issuer, its industry and the financial markets. For
equity research price target valuation methodology and risks associated with the achievement of any given equity research price target, please see the analyst's equity research report
publishing such targets.
Cowen Cross-Asset Research: Due to the nature of the fixed income market, the issuers or debt securities of the issuers discussed in “Cowen Cross-Asset Research” reports do not
assign ratings and price targets and may not be continuously followed. Accordingly, investors must regard such branded reports as providing stand-alone analysis and reflecting the
analyst’s opinion as of the date of the report and should not expect continuing analysis or additional reports relating to such issuers or debt securities of the issuers.
From time to time “Cowen Cross-Asset Research” analysts provide investment recommendations on securities that are the subject of this report. These recommendations are intended
only as of the time and date of publication and only within the parameters specified in each individual report. “Cowen Cross-Asset Research” investment recommendations are made
strictly on a case-by-case basis, and no recommendation is provided as part of an overarching rating system or other set of consistently applied benchmarks. The views expressed in
"Cross-Asset Research" report may differ from the views offered in the firm’s equity research reports prepared for our clients.
Notice to UK Investors: This publication is produced by Cowen and Company, LLC which is regulated in the United States by FINRA. It is to be communicated only to persons of a kind
described in Articles 19 and 49 of the Financial Services and Markets Act 2000 (Financial Promotion) Order 2005. It must not be further transmitted to any other person without our
consent.
COWEN.COM84
COWEN
EQUITY RESEARCH
Nikola Corporation
June 17, 2020
Notice to European Union Investors: Individuals producing recommendations are required to obtain certain licenses by the Financial Regulatory Authority (FINRA). You can review the
author’s current licensing status and history, employment history and, if any, reported regulatory, customer dispute, criminal and other matters via “Brokercheck by FINRA” at http://
brokercheck.finra.org/. An individual’s licensing status with FINRA should not be construed as an endorsement by FINRA. General biographical information is also available for each
Research Analyst at www.cowen.com.
Additionally, the complete preceding 12-month recommendations history related to recommendation in this research report is available at https://cowen.bluematrix.com/sellside/
Disclosures.action
Cowen and Company, LLC and/or its affiliates beneficially own .5% or more of the common equity securities of Nikola Corporation.
The recommendation contained in this report was produced at June 16, 2020, 20:14 ET. and disseminated at June 17, 2020, 05:28 ET.
Copyright, User Agreement and other general information related to this report
© 2020 Cowen and Company, LLC. All rights reserved. Member NYSE, FINRA and SIPC. This research report is prepared for the exclusive use of Cowen clients and may not be
reproduced, displayed, modified, distributed, transmitted or disclosed, in whole or in part, or in any form or manner, to others outside your organization without the express prior
written consent of Cowen. Cowen research reports are distributed simultaneously to all clients eligible to receive such research reports. Any unauthorized use or disclosure is
prohibited. Receipt and/or review of this research constitutes your agreement not to reproduce, display, modify, distribute, transmit, or disclose to others outside your organization.
All Cowen trademarks displayed in this report are owned by Cowen and may not be used without its prior written consent.
Cowen and Company, LLC. New York 646 562 1010 Boston 617 946 3700 San Francisco 415 646 7200 Chicago 312 577 2240 Cleveland 440 331 3531 Atlanta 866 544 7009
Stamford 646 616 3000 Washington, D.C. 202 868 5300 London (affiliate) 44 207 071 7500
COWEN AND COMPANY EQUITY RESEARCH RATING DEFINITIONS
Outperform (1): The stock is expected to achieve a total positive return of at least 15% over the next 12 months
Market Perform (2): The stock is expected to have a total return that falls between the parameters of an Outperform and Underperform over the next 12 months
Underperform (3): Stock is expected to achieve a total negative return of at least 10% over the next 12 months
Assumption: The expected total return calculation includes anticipated dividend yield
Cowen and Company Equity Research Rating Distribution
Distribution of Ratings/Investment Banking Services (IB) as of 03/31/20
Rating Count Ratings Distribution Count IB Services/Past 12 Months
Buy (a) 486 63.04% 127 26.13%
Hold (b) 276 35.80% 17 6.16%
Sell (c) 9 1.17% 0 0.00%
(a) Corresponds to "Outperform" rated stocks as defined in Cowen and Company, LLC's equity research rating definitions. (b) Corresponds to "Market Perform" as defined in Cowen
and Company, LLC's equity research ratings definitions. (c) Corresponds to "Underperform" as defined in Cowen and Company, LLC's equity research ratings definitions. Cowen and
Company Equity Research Rating Distribution Table does not include any company for which the equity research rating is currently suspended or any debt security followed by Cowen
Credit Research and Trading.
Note: "Buy", "Hold" and "Sell" are not terms that Cowen and Company, LLC uses in its ratings system and should not be construed as investment options. Rather, these ratings terms
are used illustratively to comply with FINRA regulation.
Aptiv PLC Rating History as of 06/15/2020
powered by: BlueMatrix
140
120
100
80
60
40
20
Jul 17 Oct 17 Jan 18 Apr 18 Jul 18 Oct 18 Jan 19 Apr 19 Jul 19 Oct 19 Jan 20 Apr 20
I:(1):$120.00
09/25/17
(1):$102.00
12/05/17
(1):$107.00
01/18/18
(1):$109.00
02/01/18
(1):$110.00
05/02/18
(1):$109.00
07/19/18
(1):$112.00
07/31/18
(1):$101.00
10/15/18
(1):$89.00
01/04/19
(1):$96.00
01/31/19
(1):$105.00
04/22/19
(1):$100.00
05/02/19
(1):$97.00
05/28/19
(1):$95.00
07/19/19
(1):$102.00
07/31/19
(1):$108.00
09/24/19
(1):$107.00
10/08/19
(1):$106.00
10/31/19
(1):$112.00
12/17/19
(1):$109.00
01/31/20
(1):$82.00
03/26/20
(1):$75.00
04/22/20
(1):$86.00
05/05/20
Closing Price Target Price
COWEN.COM 85
COWEN
EQUITY RESEARCH
Nikola Corporation
June 17, 2020
Hannon Armstrong Rating History as of 06/15/2020
powered by: BlueMatrix
45
40
35
30
25
20
15
Jul 17 Oct 17 Jan 18 Apr 18 Jul 18 Oct 18 Jan 19 Apr 19 Jul 19 Oct 19 Jan 20 Apr 20
(1):$28.00
06/22/17
(1):$29.00
10/24/17
(1):$28.00
11/07/17
(1):$25.00
02/26/18
(1):$24.00
05/07/18
(1):$27.00
11/05/18
(1):$29.50
02/26/19
(1):$31.50
05/07/19
(1):$32.00
08/07/19
(1):$37.50
11/04/19
(1):$40.00
02/14/20
(1):$32.00
03/26/20
(1):$31.00
04/15/20
(1):$34.00
05/11/20
Closing Price Target Price
Nikola Corporation Rating History as of 06/15/2020
powered by: BlueMatrix
100
80
60
40
20
0
Jul 17 Oct 17 Jan 18 Apr 18 Jul 18 Oct 18 Jan 19 Apr 19 Jul 19 Oct 19 Jan 20 Apr 20
Closing Price Target Price
SolarEdge Technologies Rating History as of 06/15/2020
powered by: BlueMatrix
160
140
120
100
80
60
40
20
0
Jul 17 Oct 17 Jan 18 Apr 18 Jul 18 Oct 18 Jan 19 Apr 19 Jul 19 Oct 19 Jan 20 Apr 20
(1):$24.00
07/13/17
(1):$31.00
08/03/17
(1):$41.00
11/09/17
(1):$53.00
02/14/18
(1):$59.00
05/04/18
(1):$57.00
08/02/18
(1):$51.00
10/29/18
(1):$52.00
02/21/19
(1):$65.00
05/07/19
(1):$74.00
07/12/19
(1):$85.00
08/07/19
(1):$102.00
09/25/19
(1):$108.00
11/07/19
(1):$118.00
11/26/19
(1):$136.00
02/14/20
(1):$145.00
02/20/20
(1):$138.00
03/26/20
(1):$134.00
04/23/20
Closing Price Target Price
Legend for Price Chart:
I = Initiation | 1 = Outperform | 2 = Market Perform | 3 = Underperform | UR = Price Target Under Review | T = Terminated Coverage | $xx = Price Target | NA = Not Available |
S=Suspended
COWEN.COM86
COWEN
EQUITY RESEARCH
Nikola Corporation
June 17, 2020
POINTS OF CONTACT
Analyst Profiles
Jeffrey Osborne
Stamford
646 562 1391
jeffrey.osborne@cowen.com
Jeff Osborne is an analyst covering
sustainable energy tech. He has a BS from
Trinity University and an MBA from Wayne
State University.
Thomas Boyes
New York
646 562 1378
thomas.boyes@cowen.com
Thomas Boyes is an associate covering
sustainable energy technology. He has a BS
in finance from Saint Joseph's University.
Emily Riccio
New York
646 562 1383
emily.riccio@cowen.com
Emily Riccio is an associate covering
sustainable energy technology. She received
a BA in economics from Trinity College.
Reaching Cowen
Main U.S. Locations
New York
599 Lexington Avenue
New York, NY 10022
646 562 1010
800 221 5616
Atlanta
3424 Peachtree Road NE
Suite 2200
Atlanta, GA 30326
866 544 7009
Boston
Two International Place
Boston, MA 02110
617 946 3700
800 343 7068
Chicago
181 West Madison Street
Suite 3135
Chicago, IL 60602
312 577 2240
Cleveland
20006 Detroit Road
Suite 100
Rocky River, OH 44116
440 331 3531
Stamford
262 Harbor Drive
Stamford, CT 06902
646 616 3000
San Francisco
One Maritime Plaza, 9th Floor
San Francisco, CA 94111
415 646 7200
800 858 9316
Washington, D.C.
2900 K Street, NW
Suite 520
Washington, DC 20007
202 868 5300
International Location
Cowen International Limited
London
1 Snowden Street - 11th Floor
London EC2A 2DQ
United Kingdom
44 20 7071 7500
COWENRESEARCH COWEN COWEN INC.
COWEN.COM 87
COWEN
EQUITY RESEARCH
Nikola Corporation
June 17, 2020

Cowen Nikola Initiation Report

  • 1.
    Sustainable Energy &Industrial Technology NIKOLA CORPORATION EQUITY RESEARCH INITIATING COVERAGE June 17, 2020 Price: $62.93 (06/16/2020 ) Price Target: $79.00 OUTPERFORM (1) INITIATION: MORE THAN JUST A TRUCK COMPANY; OUTPERFORM AND $79 PRICE TARGET Jeffrey Osborne 646 562 1391 jeffrey.osborne@cowen.com Thomas Boyes 646 562 1378 thomas.boyes@cowen.com Emily Riccio 646 562 1383 emily.riccio@cowen.com Key Data Symbol NASDAQ: NKLA 52-Week Range: $93.99 - $9.92 Market Cap: $22.7B Net Debt (MM): $232.7 Cash/Share: $0.11 Dil. Shares Out (MM): 360.9 Enterprise Value (MM): $22,944.2 BV/Share: $0.70 Dividend: NA FY (Dec) 2020E 2021E 2022E 2023E EPS Q1 $(0.12) $(0.18) $(0.17) $(0.18) Q2 $(0.14) $(0.19) $(0.17) $(0.19) Q3 $(0.17) $(0.19) $(0.18) $(0.17) Q4 $(0.18) $(0.21) $(0.17) $(0.16) Year $(0.60) $(0.77) $(0.69) $(0.70) P/E NM NM NM NM Revenue (MM) Year $0.0 $82.5 $300.0 $1,413.5 EV/S - 278.1x 76.5x 16.2x THE COWEN INSIGHT We initiate coverage of Nikola with an Outperform rating a price target of $79. We see Nikola as an intriguing investment opportunity, leveraging one truck platform, 2 power train options and 3 business segments, with optionality in powersports, pickups and AVs. We believe the partner ecosystem derisks the ramp in production in '21. We highlight that ~50% of the revenue stream is fuel related. Nikola has sprinted out of the gates as a publicly traded company, focused on several areas of heavy investor interest (carbon free Class 8 trucking, vehicle electrification and hydrogen fueling). Nikola is likely to be a controversial stock in the eyes of many investors and onlookers given it is pre-production. We are compelled by the ecosystem that the company has formulated over the past 5 years, led by Bosch (global leader in electrical systems) initially and more recently CNH/Iveco (top 5 truck OEM in Europe). This approach is the opposite of Tesla, who builds as much as possible in-house. Nikola's internally developed IP largely lies in software/firmware, the BMS (battery management system), infotainment, aerodynamics to reduce drag coefficient and leverages partners for other critical components which derisks the ramp in our view. Innovative Business Model - Nikola's goal is to match or beat the current cost per mile excluding the driver and lock in fuel certainty, something natural gas and EV trucks have not been able to do. We assume an average of $0.95/mi relative to most fleets in the $0.95-1.15/mi range. That cost pays for a 7-year truck lease, hydrogen fuel for 100,000 miles/year, and service. The model drives ~$665,000 of revenue per truck leased, which about 35% is truck, 50% fuel and 15% service. Highlights of the Financial Model - We assume initial BEV production in 3Q21 and FCEV production in 1Q23. Note ~90% of the components in the FCEV are used in the BEV. We see steady state of demand (and margins) for both the electric (BEV) and fuel cell (FCEV) coming in the '25 to '26 time frame; however, we model the company breaking into GAAP EBITDA positive in '24. We see a path to ~15% EBITDA margins assuming ~25,500 trucks are sold in '26. We assume the company will need to raise ~$500mn in equity in late '21 so there will be one more trip to the market. We assume accelerated hydrogen station rollouts in the '24-'27 timeframe are debt financed. Potential Upcoming Catalysts - We see June 29th Badger (pickup truck) details and reservation opening as a catalyst as well as the naming of a manufacturing partner. Note the Badger is not in our modeling at the moment given the lack of clarity on specifics. We also see likely fueling partners announced and order announcements for the mid-21 launch of the BEV Class 8 truck driving the stock higher. Valuation and Price Target - Our $79 price target is based off of a 5.5x EV/Sales on our 2025 estimates. We are modeling 2H21 start of production for the BEV and mid-2023 for the FCEV truck. Our model assumes no production of the Badger, which we believe is likely conservative given the likely news flow around the vehicle later this month. We acknowledge a 5.5x multiple is a high growth multiple; however, we believe many unique characteristics of Nikola and the scarcity value of the first to market zero emission truck company justify the multiple. We also note the bevy of items that are not in our model that we believe can accrete to investors over time which could provide further upside to our price target. We have high confidence the ecosystem can drive revenue growth and a path to mid-teens EBITDA margins over time. COWEN.COMPlease see pages 83 to 87 of this report for important disclosures.
  • 2.
    AT A GLANCE OurInvestment Thesis We believe that Nikola is well positioned to address the growing need for low emissions and zero-emission vehicles in the Class 8 trucking market. The company's focus on battery and hydrogen technology and use of strategic partners particularly for vehicle manufacturing should allow for a fairly smooth production ramp, in our view. Longer term we see the company evolving into a more broad-based energy technology company as hydrogen fueling infrastructure is slowly built out. Forthcoming Catalysts ■ Partner for Badger Electric Pickup Truck ■ Strategic Partner(s) for Hydrogen Fueling ■ Potential Use of CNH/Iveco Facility to Produce Fuel Cell and EV Trucks for the European Market Base Case Assumptions ■ Start of BEV production in 3Q21 and FCEV in 1Q23. ■ No commercial success with Badger pickup truck. ■ Raises $500mn in equity in 4Q21 for capex and $775mn in corporate debt from '23-25. ■ Takes 6 quarters of production of the BEV truck and 3 quarters of FCEV production to achieve positive gross margins. Upside Scenario ■ A faster ramp of production in Ulm, Germany at Iveco to achieve 1H21 production and Coolidge, AZ facility starts production faster in '22. ■ Less dilution or debt needed due to finding a funding partner for hydrogen station roll out. ■ Faster gross margin profitability after start of production. ■ Commercial launch of the Badger pickup through a partner. Downside Scenario ■ Ramp up of production in Ulm, Germany is not successful. ■ Greater dilution is needed for funding needs of stations and lower output from Germany and Arizona. ■ Elongated period of negative gross margins in production. Price Performance Jun-20Mar-20Dec-19Sep-19 $100 80 60 40 20 0 Source: Bloomberg Company Description Nikola Corporation is a designer, manufacturer, and integrator of battery-electric and hydrogen powered vehicles, with focus on the trucking market. The company offers hydrogen infrastructure and fueling solutions for its hydrogen powered vehicles in the form of a bundled lease solution. Nikola is also pursuing the power sports market with offerings for both off-road and watersports applications. The company has also developed a pickup truck called Badger that they are seeking a 3rd party manufacturing partner for. Analyst Top Picks Ticker Price (06/16/2020 ) Price Target Rating Aptiv PLC APTV $76.15 $86.00 Outperform Hannon Armstrong HASI $29.67 $34.00 Outperform SolarEdge Technologies SEDG $153.10 $134.00 Outperform . COWEN.COM2 COWEN EQUITY RESEARCH Nikola Corporation June 17, 2020
  • 3.
    Effective June 17,we are initiating coverage of Nikola with an Outperform rating and a $79 price target. While the stock at first glance screens expensive, we believe the ecosystem the company is leveraging through the use of strategic partners for design, key components and manufacturing should allow a fairly smooth ramp of production of the battery electric truck in the Summer of 2021, followed by a fuel cell variant in early 2023. In addition, Nikola is much more than just a trucking company and is really a broad-based energy technology company. The company’s “moat” is above and beyond just selling a truck with the company setting up a hydrogen station network in North America today and likely Europe at some point in the future. The aim is to sell “energy as a service” or “freight as a service” which at first sounds like a bunch of marketing hype, but as investors fully appreciate the differentiated business model, we believe this is unique and extracts more value per truck sold. A typical Class 8 truck may sell for $145,000 and serve as a onetime revenue event for a traditional truck OEM; Nikola however, is extracting close to $700,000 of economic value by leasing the truck, fuel and service as part of a subscription for just under $1/mile over 7 years with terms allowing 100,000 miles per year. We see this as appealing to fleets given it removes fuel uncertainty, a factor that stunted demand of other alternative fuels such as CNG and LNG in the past which had swings versus diesel. The story of reinventing transportation overlaps with sustainable investing in a significant way. New technologies and business models are emerging that address some of society’s biggest problems including emissions, health, safety and finite resource problems. Nikola has an ambitious roadmap ahead of it seeking to combine low cost renewable energy paired with electrolyzers to create low cost carbon free hydrogen fuel along corridors where dedicated route fleets travel. That refueling network will be available to other OEMs as well, not just to Nikola trucks. The first mover advantage of owning the hydrogen infrastructure and being first to market is the differentiation. Decarbonizing heavy duty transportation is much more challenging than light duty vehicles and we believe fuel cells leveraging low cost hydrogen produced through electrolyzers are the solution to solve the carbon conundrum in heavy-duty long-haul trucking and other industries such as rail and marine. This concept is only possible in our minds because of two primary factors. First, fuel cell quality, cost and lifetime has tremendously improved over the past 2 to 3 years and second, low cost renewable electricity is now allowing electrolyzers to produce hydrogen at a lower price than diesel. Figure 1 – Supply Chain From Contracted Low Cost Renewable Power Generation to Fuel Cell Truck – All on a Cost Per Mile Model Source: Nikola Corproation Nikola Corporation is a startup that has captured a great deal of investor and media attention due to its high-profile investor base and strategic investment from CNH. Nikola’s primary offering is a Class 8 truck leveraging fuel cells and batteries in a hybrid COWEN.COM 3 COWEN EQUITY RESEARCH Nikola Corporation June 17, 2020
  • 4.
    architecture. In ourview, the company has done an impressive job developing partnerships through which it hopes to vertically integrate the entire hydrogen and transportation value chain. Key partners include CNH/Iveco, Bosch, Wabco, Nel, 174 Power Global (Hanwha Group), Ryder, and TE Connectivity. While at first glance Nikola appears to just be a trucking company, we see the business as a long-term play on energy and infrastructure. In addition to the trucks, the company will be providing customers hydrogen fuel produced using an electrolyzer. This holistic fuel cell truck offering will be sold as a bundled lease in a paid per mile structure with both the truck lease, fuel, and service included. While the company is capital intensive, especially for the station buildout, we would highlight the company only builds stations in locations in which the trucks have already been sold versus speculatively building stations. Given the fuel is part of the unique revenue model in which Nikola charges fleets approximately $0.95 per mile, which includes the lease of the truck, fuel and service, we believe the cadence of the capex required to build each of the stations will be measured and align with sales of trucks. Figure 2 – Aiming to Disrupt the Complete “Green Energy-to-Wheel” Value Chain Source: Cowen and Company, Company Presentation To date, Nikola has announced 3 Class 8 trucks – the Nikola One, Nikola Two and Nikola Tre as well as a line of powersports products and an electric and fuel cell variant of a pickup truck called the Badger. PLATFORM ENABLEDCORE BUSINESS BusinessModelComponent TargetUse Case Complementary offerings: significant overlap in components; BEV and FCEV address different use cases Additional growth opportunities based on truck and H2 station platform Increases addressable market vs. truck offering alone H2 Production and Refueling of FCEV H2 Stations • Economically produces H2 fuel via electrolysis • Initial methodical roll-out of targeted station development along “dedicated routes” • Electricity input (grid, solar, wind) purchased via long-term supply agreements Long-haul FCEV Truck • H2 FCEV powered truck • 500 – 750 mile range • Attractive “bundle pricing” model (truck, fuel, maintenance) Shorter-haul BEV Truck • BEV powered truck • Industry-leading range of up to 300 miles • Leverages existing FCEV work and partnership with CNHI to co-develop BEV truck for production in the next 12 – 18 months Capacity-as-a-Service Autonomous Ready • Level 4 hardware standard • Automatic braking and lane keeping • Full fleet management solutions and data capturing • Over-the-air software updates Energy-as-a-Service Grid Storage and BEV Charging • Leverage technology and infrastructure to act as a grid buffer and to capture intermittent energy sources • Provide BEV charging solutions to short-haul customers COWEN.COM4 COWEN EQUITY RESEARCH Nikola Corporation June 17, 2020
  • 5.
    Figure 3 –Nikola One Figure 4 – Nikola Two Figure 5 – Nikola Tre Source: Nikola Corporation The Nikola One, which debuted in late 2016 as a prototype, features a 250 kWh EV battery supplying 6 traction electric motors. The Nikola One is a hydrogen fuel cell electric semi sleeper truck for the North American market. At the time of the launch, U.S. Express reserved 5,000 fuel cell trucks, albeit with no money down. Nikola at the time was aiming to have the truck out in 2020; however, now the fuel cell variant is available in 2023. U.S. Xpress, the fifth largest asset based truckload carrier in the U.S. with about 6,800 trucks is still using the announcement as part of a hiring push (HERE). We believe the advanced features of the truck as well as the “cool” factor will help fleets compete for drivers in a tight labor market for the commercial driving profession. A Freightwaves article published in March 2017 discussed some of the operational advantages the vehicle would offer U.S. Xpress. Note Nikola initially was offering 1 million miles of fuel; however, now is offering 700,000 miles, or 100,000 miles per year. U.S. Xpress makes up more than one-third of the 14,600+ reservations on hand for the fuel cell truck. We assume the fuel cell trucks that Nikola develops will achieve about 7 to 8 miles per kilogram of hydrogen in most conditions. Management believes that about 90% of routes in Europe can use a 60kg tank, which would offer a range of 450 miles, and in North America an 80kg tank, which would offer a range of ~600 miles. The fuel cell electric Nikola Two, is similar to the One but is a day cab features 80kg of hydrogen storage in type IV carbon fiber tanks that fuels the two fuel cells, which have a combined 240kW output to charge the 250kWh lithium-ion battery at the base of the vehicle that powers six 800 Volt AC motors. The company believes that the low weight of the fuel tanks and purpose-built design will result in the truck weighing 5-7K pounds less than a similar diesel truck, while still having an estimated range of 500-750 miles and a 15-20 minute refuel times and looks to compete with or exceed diesel trucks from a performance standpoint. The ~175 pounds of on-board hydrogen stores ~3MWh of energy and Nikola estimated at its annual Nikola World exhibition last year that it would take ~30k pounds of lithium-ion batteries to store a similar amount of energy, making it not feasible for long-haul trucking. For customers that do not need the range of 500- 750 miles, such as those around cities, the company is offering a BEV version that would have a smaller range. Both the FCEV and BEV would contain similar architectures, with the hydrogen tanks and fuel cell replaced with a larger battery pack in the BEV version. Creating the technology required to power Nikola One and Nikola Two — their zero- emissions hydrogen fuel cell trucks — required the engineering teams from Bosch, TE Connectivity, and others to solve for very unique requirements. The teams needed to develop a powertrain capable of delivering up to 1,000 horsepower, with 2,000 ft-lbs of torque, provide capacity to carry a 110,000 pound load, achieve full recharge in 15 minutes, and display real-time performance data. The fuel cell variant of the trucks still has a smaller lithium ion battery, largely for regenerative braking, constant connectivity COWEN.COM 5 COWEN EQUITY RESEARCH Nikola Corporation June 17, 2020
  • 6.
    to allow forover the air (OTA) software updates, and cold starts. We believe that Bosch has chosen PowerCell as the fuel cell vendor for the Nikola trucks. PowerCell has a long history in the fuel cell space, having initially been owned by Volvo in Sweden. The Nikola Tre is an all-electric truck that was unveiled in December 2019 in partnership with CNH/Iveco. The truck will be built at Iveco’s Ulm, Germany factory and initially be imported to the United States but also likely be sold in Europe. Iveco is part of Case New Holland (CNH) and is Europe’s smallest traditional truck maker, competing with Daimler, Volkswagen and Volvo among others. The prototype of the Nikola Tre was revealed just three months after the partnership and investment from CNH/Iveco was announced. Under their agreement, CNH took a $250 million stake in Nikola - comprised of $100 million in cash and $150 million in services, giving the U.S. company scale and manufacturing capacity for its various platforms. The truck will initially be all electric but will have a fuel cell variant in 2023. We believe the Nikola partnership is CNH/Iveco’s 2025 emission compliance strategy. European truck manufacturers will be required to cut carbon dioxide emissions from new trucks on average by 15% from 2025 and by 30% from 2030, compared with 2019 levels. Note that CNH said in September it would spin off Iveco and list it separately at the beginning of 2021. The Nikola Tre is based on the Iveco S-Way platform, a cab over engine truck manufactured since 2019 by the Italian producer Iveco. Iveco will gain access to Nikola’s electrical technology and infotainment systems and Nikola will be using many of the components from the Iveco “parts bin” to manufacture the trucks. FPT Industries out of Turin, Italy, which is part of Fiat Power Train, will be building the eAxles, the cabs will be made in Madrid, Spain and final assembly will be done at the Iveco site in Ulm, Germany and then exported directly to the United States. Figure 6 – One Platform, Two Powertrains Source: Nikola Corporation Nikola's plan offers the most compelling solution we have seen thus far to the chicken and egg problem for hydrogen infrastructure and consumption that has long plagued the fuel cell industry and inhibited broader adoption of lower emission technologies within the heavy-duty transportation sector. The Class 8 market has largely shifted to COWEN.COM6 COWEN EQUITY RESEARCH Nikola Corporation June 17, 2020
  • 7.
    natural gas enginesfrom Cummins to help reduce CO2 emissions in specific areas such as California, and we see the hybrid fuel cell/battery solution as an intriguing development. We believe for Nikola to be successful in the first 10 years of production for the fuel cell variant the company only needs to have 20 to 25 customers as they will look to phase in leases for fuel cell trucks on dedicated routes as the stations are build out. Nikola's strategy of pricing per mile in a lease that bundles in the truck along with both fuel and service is likely to be viewed as attractive by fleet operators given it provides stability and predictability that is not possible with diesel and avoids concerns on residual value. The company has targeted $0.95 per mile, which is competitive with diesel at $0.95-$1.10, but unlike diesel the price will be fixed due to the Nel hydrogen partnership and not fluctuate based on the inability to hedge the price of diesel over long durations. Service is also included in the lease price, with access to the ~800 U.S. Ryder locations built in as well as with other service providers around the country. While most truck OEMs are in the high teens to 25% gross margins, we believe Nikola can trend to 25-30% because of the fueling revenue contribution, which largely kicks in later in the decade as the fuel cell vehicles roll out to new fleets and stations are build. We believe the target model below can be obtained by 2029 or 2030. Figure 7 -Margins Step Up in 2025 as Fueling Revenue Ramps and Costs Decline for BEV/FCEV Source: Cowen and Company Note we are assuming the first two years of production are negative GM for the BEV truck. By 2026 we believe cost reductions in fuel cells and related tanks can drive parity pricing for BEVs and FCEVs at approximately $180,000 per unit of cost. Figure 8 – Key BEV and FCEV Unit Modeling Assumptions Source: Cowen and Company We see the hydrogen station investment for the company largely tapering off after 2028. While stations under construction peaks in 2026, it takes about 1.5 to 2 years to finish a station. Nikola Long Term Model Summary 2021E 2022E 2023E 2024E 2025E 2026E 2027E Target Revenue (y/y) - 264% 371% 128% 75% 37% 34% - Gross Margin -14% -1% 11% 17% 25% 27% 27% 30% Operating Expenses 363% 93% 30% 20% 19% 21% 19% 15% - 17% Operating Margin -377% -94% -18% 6% 12% 12% 14% 13% - 15% 2021E 2022E 2023E 2024E 2025E 2026E 2027E Trucks (BEVs) Deliveries 330 1,200 3,500 7,000 10,000 11,700 12,750 ASP ($k) $250 $250 $250 $250 $250 $250 $250 Cost per Unit ($k) $285 $254 $211 $201 $184 $180 $180 Trucks (FCEVs) Deliveries - - 2,000 5,000 10,000 13,800 19,250 ASP ($k) - - $235 $235 $235 $235 $235 Cost per Unit ($k) - - $236 $210 $188 $180 $180 COWEN.COM 7 COWEN EQUITY RESEARCH Nikola Corporation June 17, 2020
  • 8.
    Figure 9 –Key Hydrogen Station Assumptions Source: Cowen and Company Battery and Fuel Cell Class 8 Trucks are Becoming Competitive Battery electric drivetrains have become competitive with diesel trucks for lighter loads or shorter distances on a total cost of ownership basis. For the longer range and especially with heavier loads, all electric trucks are less practical. As battery energy density and costs fall, we would expect range to increase. We note that Nikola is focused on both fuel cell trucks, which will be used for dedicated routes on longer hauls as well as all electric trucks, which are focused on the sub-350-mile market. We would highlight that Cummins, covered by Matt Elkott shares this view on range as they have acquired Hydrogenics in order to enter the fuel cell and electrolyzer market. While a battery electric drivetrain’s cost of ownership increases as range increases, a fuel cell based drivetrain has a relatively flat relationship with range, similar to the diesel vehicles that it seeks to displace. To increase the range of a fuel cell truck, all an OEM needs to do is increase the size of the onboard hydrogen tanks. 2021E 2022E 2023E 2024E 2025E 2026E 2027E Hydrogen Stations Hydrogen Stations Placed Under Construction 2 13 28 57 98 108 100 Cumulative Hydrogen Stations Placed in Service (Can be under construction) 2 15 43 100 198 306 406 Stations Completed and Available for Fueling in Period - - 10 14 34 68 106 Cumulative Hydrogen Stations Available for Fueling - - 10 24 58 126 232 Total FCEV Trucks in Service - - 2,000 7,000 17,000 30,800 50,050 COWEN.COM8 COWEN EQUITY RESEARCH Nikola Corporation June 17, 2020
  • 9.
    Figure 10 –Technology Comparison of Hydrogen, Battery Electric and Diesel Trucks Source: Cowen and Company, Company Presentation (1) Estimated hauling capacity includes both cargo capacity and the weight of the trailer Weight is critical for trucks, both from a regulatory perspective but also from a monetization perspective. The fuel cell variant of the Nikola is about 3,000 to 5,000 pounds lighter than its battery electric peer. A general rule of thumb in the trucking industry is that every pound of cargo hauled is worth about $0.50 so weight limits on a full load could cost the fleet up to $2,500 at the high end of the delta. Beyond range and faster refueling, we believe operators that operate near the gross vehicle weight limits of trucks will also favor hydrogen solutions to avoid this potential financial loss. Potential Catalysts Ahead For The Stock We see a variety of near-term catalysts emerging over the next two to three quarters that in our view can further boost sentiment for the stock. Notably, we are monitoring the following, which we see a high likelihood of occurring and would be additive to our initial modeling of the company: 1) Potential for CNH/Iveco’s facility to produce fuel cell and all electric trucks for the European market. 2) A strategic partner or partners announced for hydrogen fueling 3) A formal launch of the Badger pickup truck leveraging a third party manufacturing partner We explore each of these potential catalysts below: Hydrogen-Electric 100% Battery Electric Diesel Primary Power Unit (PPU) Hydrogen Fuel Cell Battery Diesel Engine Refuel/Charge Time 10-15 minutes Several Hours 10-15 minutes Est. Range 500-750 miles (Long-haul) 100-350 miles (Medium-/Short-haul) 500-750 miles Refill Affect on Electrical Grid Hydrogen stations act as buffer & balance grid Recharge to be managed within grid load capacity N/A PPU Sustainability Profile Hydrogen is the most abundant element on planet Dependent on further advances in technology Access to oil reserves can be costly and prices are highly volatile Impact on Emissions Zero emission vehicle Zero emission vehicle Heavy emission vehicle unlikely to adhere to future regulations on emissions standards Est. Vehicle Weight ~22,000 - 24,000 lbs ~25,000-27,000 lbs ~17,000-19,000 lbs Est. Hauling Capacity(1) ~56,000-58,000 lbs ~53,000-55,000 lbs ~61,000-63,000 lbs Complementary Use Cases COWEN.COM 9 COWEN EQUITY RESEARCH Nikola Corporation June 17, 2020
  • 10.
    Europe Momentum -We are upbeat about potential market developments in Europe given the CO2 regulations in Europe requiring heavy duty vehicles to reduce emissions by 15% in 2025 and 30% in 2030. In some cases, the failure to comply with the 2025 target could penalize OEMs by as much as €38k per truck. Even absent the fine, we believe OEMs could see a payback of less than 2 years depending on operating needs. Europe is much further along in embracing hydrogen as a fuel and given the already heavy renewable energy penetration rates, we see a solid opportunity to pair surplus electricity generation with multi-MW electrolyzers to generate cost effective hydrogen relative to the elevated prices of diesel in the region relative to the United States. Third party researcher Bloomberg New Energy Finance expects a sharp uptick in fuel cell heavy duty trucks in 2026, with the market surpassing 2100 units, up from about 450 in 2023. While we believe their forecasts are extremely conservative, we believe the timing of the hockey stick and regional focus on Europe and the United States are correct, with China dominating longer term. Figure 11 – Anticipated Fuel Cell Heavy Duty Commercial Vehicle Sales (‘000) Source: Bloomberg New Energy Finance, Cowen and Company Fueling Partnership: Nikola has a strategic partner for many of the key facets of its business; however, on the hydrogen fueling side the puzzle pieces are only in place for electrolyzers with NEL equipment and 174 Power Global, a division of Hanwha Group in Korea, to supply solar panels and potential solar farms that would feed the needed 17.6 MW of electricity needed for each hydrogen station. We would expect management to look to partner with other suppliers as they seek to build out ~400 potential stations across the United States and Southern Canada and potentially expand to Europe at some point in time. Note that ~400 stations should cover the dedicated routes in North America; however, if the company were to target all of the 1.8 million trucks on the road today, an additional 300 stations would need to be build out for non-dedicated routes. We believe the company will focus exclusively on dedicated routes for the first 10 to 12 years of production. Domestically we could envision a partnership or joint venture with a truck stop chain, similar to what Clean Energy Fuels did with Pilot for natural gas, or perhaps partner with a more strategic oil & gas company such as Shell or Total. Both have extensive experience with Hydrogen and Total is already building out stations in Germany as part of a consortium (more details HERE). Beyond potential capital and revenue sharing, a major global oil & gas partner could offer expertise in energy trading, electricity procurement and carbon compliance. We would highlight electricity - 20 40 60 80 100 120 140 2020 2025 2030 2035 2040 China Europe U.S. Japan South Korea India Rest of World COWEN.COM10 COWEN EQUITY RESEARCH Nikola Corporation June 17, 2020
  • 11.
    procurement monitoring asa particular area of focus because electricity comprises about 85% of the cost to produce hydrogen through electrolysis, thus if a partner were monitoring spot power prices near each station and taking advantage of disconnects in pricing which occur frequently on a temporary basis due to heavy renewable electricity penetration from wind and solar, hydrogen generation through electrolysis could be viewed as a form of arbitrage and using storage tanks as a means of generating very cost effective fuel. We note that Nikola has joined, and currently leads, a consortium of partners and competitors to create a standard on dispensing equipment so that stations can be utilized by Nikola and its competitors without fears of compatibility. Air Liquide, Hyundai, NEL, Nikola Corporation, Shell and Toyota all signed a Memorandum of Understanding (MOU) for hydrogen fueling components in early 2019. The cross- industry group of both vehicle and infrastructure companies has signed the MOU with the purpose to test pre-commercial 70MPa hydrogen heavy duty vehicle high flow (H70HF) fueling hardware for future Class 8 (40 Ton) trucks. The industry group has created specifications for the fueling nozzle, vehicle receptacle, dispenser hose and breakaway device components Badger Commercialization: We are not assuming any commercialization of the Nikola Badger in our modeling, which is likely overly conservative. Management has noted they would only look to commercialize the vehicle if another OEM manufactures it. Recent press reports and tweets from founder Trevor Milton have noted that formal orders for the vehicle will commence on June 29th and that the company is considering three potential manufacturing partners and the vehicle will be available for customer deliveries in 2022 or earlier. What the complexion of such a manufacturing agreement could look like is unclear. We would assume the company would pursue a manufacturing deal with an existing OEM with excess capacity domestically or someone like a Magna Steyer, a division of Magna that has over 100 years of experience in vehicle production and is currently building the Jaguar E and I-Pace, Mercedes G Class, BMW Z5 and 5- Series as well as the Toyota GR Supra. Magna Steyer also has a contract with Sony to develop their new electric vehicle, which was launched at CES earlier this year. If Magna was not the partner, then we believe a deal could be struck with a traditional domestic OEM. Given the likely low utilization rates at many OEM facilities domestically, we believe such as deal could be of interest under the right economic scenario for both parties. COWEN.COM 11 COWEN EQUITY RESEARCH Nikola Corporation June 17, 2020
  • 12.
    Figure 12 –Nikola Badger Source: Nikola Corporation Again, we are not assuming in our modeling or positive stance on the stock any success for the Badger. We note that Chairman Trevor Milton noted via Twitter earlier this month that on June 29th reservations would open up for the vehicle and later in the month on June 10th said, “exciting news coming with the Badger soon.” Until a thorough understanding of any launch related costs and timing for the truck are known, we would rather err on the safe side and not include the vehicle in our model. The Badger truck itself will be available as either a pure battery-electric or a battery-electric/fuel-cell hybrid. The electric version will have a claimed 300 miles of range, while the fuel-cell version will up that number to a claimed 600 miles. We would assume the electric only version will be available prior to the hybrid fuel cell variant, similar to the cadence of the truck launch. We believe the Badger leveraged the Nikola NZT powertrain skateboard, an all-terrain vehicle we describe further in this report. Press reports and interviews with management on various podcasts suggest the battery pack will be 160 kWh in size. Differentiation of Nikola Versus Tesla – Leverage Partners Versus Doing Everything In House Both Nikola and Tesla derived their corporate names from the same place, Nikola Tesla, a Serbian-American who was an engineer and futurist and best known for his contributions to the modern alternating current (AC) electricity supply system. While both companies also have extremely charismatic founders who love Twitter and are involved in the electrification of transportation, the similarities stop there. Elon Musk has called fuel cells “fool cells”, “staggeringly dumb” a “load of rubbish” for several years and noted at its annual shareholder meeting that “success is simply not possible” in hydrogen fuel cells. We don’t see the situation as a zero-sum game and expect both technologies to coexist in trucking, with range, weight needs and route determining which technology is used. We see hydrogen as best suited for dedicated routes, which make up about 20-25% of the 1.8 million Class 8 trucks on North American roadways today. Keep in mind that Nikola is developing both kinds of trucks despite being known as a fuel cell trucking company; they will have an all-electric version in 2021. COWEN.COM12 COWEN EQUITY RESEARCH Nikola Corporation June 17, 2020
  • 13.
    While it remainsto be seen which technology will win the tug of war for Class 8 trucking, we see both technologies playing a role depending on route and range needs and believe Mr. Musk is overly simplifying things. While the technology debate between the two parties will likely persist, we note both companies share similar societal goals in hoping to revolutionize the transportation industry. We have covered the fuel cell sector for 15 years now and up until the last 3 to 4 years, the sector was largely made up of what we would put in the camp as publicly traded science experiments, comprised of companies with a great deal of hope and associated investor returns but plagued with high capital costs relative to existing technologies, inadequate lifetime of the units and uncertainty on where cost efficient hydrogen would come from. Over the past few years, fuel cell technology and battery technology have both improved. Nikola is looking to leverage both and we note that about 90% of the components in a fuel cell truck are the same as the electric variant. While Nikola is looking to commercialize both fuel cell and battery technologies and Tesla is looking at just electrified vehicles, the approach to commercialization is radically different. Nikola’s approach is centered on creating a partner ecosystem, many of which are co-investors in the company. The two most important partners in our minds are Bosch and CNH/Iveco. Bosch was critical in accelerating battery and fuel cell integration into the initial design. Iveco is the market share leader in natural gas engines in Europe, having shipped over 30,000 units and worked with fleets in helping build out dedicated natural gas routes. We believe Iveco’s connectivity with fleets that have a bias toward alternative powertrains as well as robust dealer network can be an asset for Nikola to leverage, especially as we move closer to 2025 when more stringent CO2 regulations kick in. Intellectual property developed by Bosch and Nikola are co-owned by both companies. Figure 13 - Network of Strategic Partnerships Reduces Execution Risks, Improves Commercialization Timeline and Provides Long-Term Competitive Advantage Source: Cowen and Company, Company Presentation • One of the world´s largest and most recognized photovoltaic manufacturers and energy providers • Series C investor and exclusive solar panel provider • #1 global engineering service provider to the Commercial Vehicle industry for cab development • Cab and Chassis engineer • Largest producer of electrolyzers and other hydrogen equipment • Series C investor and hydrogen production equipment supplier (electrolyzers and other components for hydrogen stations) • Largest truck leasing company in the U.S. with over 800 service centers and 6,000 highly trained technicians • Primary but non-exclusive service partner • Leading global supplier of braking control components and air management systems to medium- and heavy-duty trucks • Series B investor in Nikola and brake traction and stability control system developer • World's largest independent company for the development, simulation and testing of powertrains • Designer and developer of first-in-class vehicle and hydrogen fuel cell test facility • International leader in the development, manufacture, marketing, and servicing of a vast range of light, medium, and heavy commercial vehicles • Series D investor and partner in 50/50 European joint venture and North American production alliance • Leading global supplier of technology and services to automotive, industrial, energy, building technology, and consumer end markets with ~410,000 employees and ~$90B in annual revenue • Series B and C investor and powertrain design (e.g., fuel cell, battery, VCU) co-development partner • Any related IP will be jointly owned by Nikola OTHER KEY INDUSTRY PARTNERS MARQUEE CO-DEVELOPMENT PARTNERS COWEN.COM 13 COWEN EQUITY RESEARCH Nikola Corporation June 17, 2020
  • 14.
    Given Elon Muskwas already a billionaire when Tesla was formed, the company had the luxury of aiming to internally develop and manufacture as much as possible, ranging from seats to motors and inverters, all of which differentiate Tesla versus peers, especially in terms of range and electrical efficiency of the battery. Since founder Trevor Milton was not a billionaire and the company was fairly bootstrapped for cash in the 2015 and 2016 timeframe, the company’s approach was to leverage partners and jointly develop IP for a true hybrid fuel cell battery electric truck that had a zero emission profile. Back in 2015 and 2016, the concept of zero emission trucking was not actively being discussed or developed by other OEMs, thus we believe many Tier 1 and 2 suppliers were energized by the vision and willing to help. We believe Bosch and Worthington were some of the key initial partners; however, overtime many more were added as shown on the figure above but also other smaller partners such as TE Connectivity and Meritor played a key role. Given the scope of zero emission transportation has greatly evolved since 2015, we do not believe such an ecosystem of high-profile strategic partners could be assembled by a startup in today’s environment as there is less of a debate about the trajectory of zero emission transportation. Nikola’s view is they aim to share the IP that is jointly developed on many of the facets of their business. While Nikola has leveraged extensive use of partners for the key components of the vehicle and to build out its energy ecosystem, the company largely designed the exterior and interior of the vehicle with its in-house design team. The infotainment and HMI (human to machine interface) cluster centered around a 17” display and 13” instrument cluster is compelling and differentiated in our view. This technology includes video camera displays in rearview mirrors and digital displays equipped with programs to plan routes and track mileage, sleep, and expenses. By designing the trucks to help truckers, they are enabling transport companies to operate more efficiently. For example, the truck’s data architecture is designed to support more autonomous functionality that can be used in the future when regulations allow. When the industry decides to use these features, transport companies can leverage the high-speed data connectivity to platoon vehicles and predict maintenance, repair, and overall cost-of-ownership, making it easier to manage the fleet and safer to operate on the road, while also helping reduce driver errors and fatigue issues. Figure 14 – Advanced Connectivity Features in the Nikola Two Figure 15 – Infotainment System Should Improve Trucker Experience Source: Cowen and Company, Company Reports COWEN.COM14 COWEN EQUITY RESEARCH Nikola Corporation June 17, 2020
  • 15.
    We would alsonote that Nikola filed a lawsuit against Tesla almost two years ago, claiming that Tesla’s Semi Truck infringed upon a series of three patents for the original Nikola One truck. Nikola’s lawsuit against Tesla is centered around the similarities between the trucks design, with Nikola claiming the fuselage of the tesla semi is too similar to the design of the Nikola One, which was publicly revealed a year earlier than Tesla’s. The specific claims are centered around the fuselage itself, the windshield design and the mid-entry door design with the folding and retractable step. Thus far, the U.S. Patent Office has upheld Nikola’s patents upon appeal by Tesla. As noted above, Nikola has leveraged partners to develop prototypes quickly. We believe a common question investors have among many about the Nikola investment case is where does the IP reside. Similar to any vehicle, a series of Tier 1 suppliers have put together the key building blocks for the 3 generations of Nikola trucks. We see the core IP of Nikola being the business model as they are largely an infrastructure and energy company that also makes trucks. The unique value proposition of fuel certainty would not be available to potential customers without the fueling. We believe Bosch and CNH/Iveco largely derisk the ramp up relative to other startups who are attempting to do everything inhouse such as Tesla. Over time, now that Nikola has ample liquidity, we could see some key differentiated components brought in-house. Perusing the company’s current job postings as of the publication of this report suggests that is the direction they are headed. Openings for inverter engineers, firmware, software and system architecture engineers to us suggest the company will expand on some of the key building blocks that partners have developed. Nikola also noted in a November 19, 2019 press release that they have developed a 1,100 watt-hours per kilogram lithium ion battery, which would double the range of a vehicle, reduce weight by ~40% and cut 50% of the material cost per kWh compared to existing lithium ion batteries. In subsequent press interviews, it became clear that Nikola has only manufactured these cells with smaller form factor pouch cells relative to what is needed in a vehicle or truck. Migrating to larger form factors has been a challenge for numerous startups as coin sized cells migrate to full sized units. While we are unclear of the specifics of the battery claim and are not assuming any success in our modeling, press reports with founder Trevor Milton noted the battery eliminates costly cathode components such as nickel, cobalt and magnesium and uses a “while different type of chemical with a lithium component.” In a Forbes interview, Mr. Milton noted that the battery was developed by an unnamed university lab Nikola was involved with and they have “locked up all the IP.” With the battery development, Nikola has added 15 PhDs and 5 master’s degree team members from the unnamed company. There are numerous alternative form factors and chemistry combinations for lithium-based batteries, so it is unclear if Nikola is working on a sulfur-based battery leveraging lithium metal, some form of solid state, or something else. Other press reports noted that the battery is more conductive than standard 2170 form factor cells given the Nikola approach removes binder material and electric current collectors from the cell, which take up weight and space within the battery. We note that Daimler has some intensive work underway in lithium sulfur batteries as well as we were in attendance for their battery update at last year’s International Battery Seminar presentation. The team from Daimler noted challenges with liquid electrolyte to lithium sulfur ratios (E/S ratio) and cycle life and challenges with Wh/L, however if higher abuse tolerances could be achieved, they felt it could be commercialized. Now that the company is publicly traded, we would expect more details to emerge at some point; however, we are assuming no commercialization of any in-house developed battery technology and anticipate Nikola will use off the shelf 2170 format cylindrical cells and do their own pack assembly, similar to what Tesla does today at the Gigafactory leveraging Panasonic cells. Note COWEN.COM 15 COWEN EQUITY RESEARCH Nikola Corporation June 17, 2020
  • 16.
    Nikola, nor Boschthat we are aware of, does not have a framework agreement with a cell vendor similar to Tesla’s with Panasonic. Commentary from Nikola management at their April 2020 analyst day for the sell side noted the company works with all 3 major cell vendors (LG, Samsung SDI and Panasonic). Unique Business Model – Pay Per Mile Instead of Buying the Truck Nikola is offering a differentiated bundled lease model, which provides customers with the fuel cell truck, hydrogen fuel, and maintenance for a fixed price per mile, locks in fuel demand and significantly de-risks infrastructure development. Note that the bundled truck, fuel and service model is only offered with the fuel cell variants of Nikola’s trucks whereas the all-electric trucks do not offer the bundle and revenue recognition is just at the time of the sale. Figure 16 – Nikola Revenue Segmentation Source: Cowen and Company We highlight that the company as of the date of the IPO had 800 trucks from Anheuser Busch that had a legally binding contract and a reservation list of 14,600 trucks. Typically, fleets place deposits on trucks when they have confidence that they will receive their truck within 12 months. This is done in an effort to slot in new trucks into the schedule of expiring leases. As we move closer to 2023, we would anticipate that many fleets in this reservation base will migrate to formal contracts. The lack of committed backlog has been a source of investor anxiety and we would expect management to make every effort to convey growing backlog as orders materialize. Note that orders can only be taken from fleets operating on corridors that have fueling built out, which has started between Los Angeles and Phoenix along Interstate 10; however, we believe the Interstate 5 corridor north from Los Angeles to San Francisco will be built out and then likely San Francisco to Reno along Interstate 80. Over time, we expect the company to move eastward along Interstate 10 and 80 and branching out to other Interstate routes. Note the all-electric Nikola Tre also does not have a publicly announced backlog, but given shipments are anticipated to commence in mid-2021, we would expect press releases from Nikola in the coming months for the European built Nikola Tre. Nikola Revenue Contribution by Key End Markets ($mn) 2021E 2022E 2023E 2024E 2025E 2026E 2027E Truck - BEV $83 $300 $875 $1,750 $2,500 $2,925 $3,188 Truck - FCEV $0 $0 $470 $1,175 $2,350 $3,243 $4,524 Service & Maintenance $0 $0 $12 $54 $141 $278 $471 Hydrogen $0 $0 $56 $245 $640 $1,263 $2,139 Other Revenue (Powersports, Badger) $0 $0 $0 $0 $0 $0 $0 Total Revenue $83 $300 $1,413 $3,223 $5,631 $7,708 $10,321 COWEN.COM16 COWEN EQUITY RESEARCH Nikola Corporation June 17, 2020
  • 17.
    Figure 17 -Nikola’s Advantage: Bundled FCEV Offering is More Attractive Than Diesel Source: Cowen and Company, Company Presentation As fleet customers take delivery of their trucks, Nikola looks to securitize the truck portion of the lease. Our model assumes they can extract ~$160,000 of value per truck securitization assuming a 7% interest rate. We assume the actual truck price is $235,000, so just under 70% of the value of the truck is being securitized to free up cash for the company. Assuming a $0.95/mile subscription is entered into, that will generate $665,000 of revenue over the 7-year term. We believe about ~35% of the $665,000 revenue stream is allocated to the fuel cell truck, ~50% to the fuel and the remaining ~15% is attributed to service and maintenance. Some of the basic math to drive our revenue assumptions for the fuel cell related trucks are as follows:  Lifetime Revenue - $0.95/mile x 100,000 miles/year x 7 years = $665,000  Assumed truck price of $235,000 – because it is securitized, revenue recognition for this portion of the revenue stream can occur immediately as the lease commences - $235,000/$665,000 = ~35%.  Revenue attributable to fuel – 700,000 miles / 7.5 miles per kg of hydrogen x $3.75/kg price for fuel = $350,000, or ~53% of the total $665,000 revenue stream. This revenue stream is recognized ratably over the 7-year lease. We believe if Nikola can procure power at $35/MWh, that they can produce fuel at $2.50/kg including depreciation. We estimate the sensitivity to electricity prices, which make up ~85% of the cost to produce hydrogen is about $0.50- 0.60/kg for every $10 change in electricity price per MWh. Note that both hydrogen trucks and diesel trucks get about 7-8 miles per unit of fuel, either per gallon or per kilogram, so the price for hydrogen per kilogram needs to be roughly in line with a 7-year average of diesel price per gallon to make economic sense. Total cost of ownership certainty Historically, diesel fuel has comprised anywhere from 40-60% of total ownership costs(1). Nikola’s Bundled Lease offers operators complete cost predictability at cost parity with diesel Better Performance Outperforms diesel and battery trucks in range, horsepower and torque. Shorter recharge time than battery electric trucks Enhanced Safety 6x2 drive, torque vectoring, faster stopping, lower center of gravity Hydrogen Safer than Diesel Lower vapor pressure, will not form combustible mixture with air, harder to ignite, hydrogen dissipates into atmosphere Extensive safety testing performed by third-party experts Environmentally Friendly Zero emissions and nearly silent. Hydrogen stations powered by renewables Autonomous Ready Enhanced autopilot, automatic braking, and automatic lane keeping standard on each vehicle THE INDUSTRY’S FIRST EVER “BUNDLED PRICING” PROJECTED NIKOLA VS. DIESEL COST PER MILE • 7-year lease/700,000 miles • Lease includes the cost of truck, hydrogen fuel, repair, and maintenance • Lease model eliminatespayback period and technology risk for customers, enablingmore rapid adoption Includes all vehicle, service & maintenance and fuel costs Fuel Cost: ~$0.51 per Mile Service & Maint: ~$0.21 Per Mile Vehicle Payments: ~$0.26 per Mile $0.00 $0.20 $0.40 $0.60 $0.80 $1.00 $1.20 Nikola Traditional Diesel Total TCO: $0.95 per Mile Total TCO(2): ~$0.97 per Mile COWEN.COM 17 COWEN EQUITY RESEARCH Nikola Corporation June 17, 2020
  • 18.
     Lastly, serviceis anticipated to be just under 15% of the revenue stream at about $80,000 over the 7 years. We are assuming service makes up about 11 cents per mile and that it costs about 7% of revenue. We see this as the segment of the model with the most likely volatility and uncertainty. Nikola originally signed a service agreement with Ryder in 2016 that was exclusive; however, both parties have agreed to release the exclusivity clause in recent weeks. Service and maintenance cost of goods are booked in the P&L as they are incurred and the cash flow impact is also booked as service & maintenance is provided. Fuel cell trucks are anticipated to have substantially lower service and maintenance needs per mile tan diesel trucks, mainly due to fewer mechanical moving pieces relative to diesel. Figure 18 - Single Fuel Cell Truck Lease Unit Economics Source: Cowen and Company, Company Presentation 1) Analysis does not include potential financing charges that may be incurred to securitize and monetize some portion of the Nikola lease 2) Hydrogen fuel cost includes all hydrogen station related operating expenses including electricity costs, water costs, station personnel cost, and hydrogen station maintenance 3) Vehicle profit presented before corporate general and administrative expenses 4) Assumes each station has a 21-year useful life and supports 210 truck leases during each 7-year lease period 5) Does not include any potential upside from truck residual value at the end of the lease Nikola will use securitizations to recycle capital from the fuel cell 7 year leases. Our model assumes a 7% interest rate, 7 year loan term with a ~70% loan to value, which leads to a 1.7x debt service coverage ratio assuming a price of $235,000 for the truck and approximately $160,000 of initial cash flow is securitized. We believe such a structure could be setup with an investment bank or perhaps with a financial arm of Cash New Holland. PROJECTED CASH GENERATED PER TRUCK LEASE PROJECTED LEASE MODEL ECONOMICS $665,000 $188,174 $230,637 $46,760 $26,365 $173,064 Lease Revenue Truck Materials & Labor Total Fueling Cost Service, Maint. & Other Station Capex Per Lease Cash Per Truck Lease Projected Nikola Lease Model Economics (1) Gross Revenue $665,000 Materials $173,624 Labor - direct and indirect 7,500 Warranty Expense @ 3.0% of Truck Revenue 7,050 Truck Cost $188,174 Nikola Cost per kg of Hydrogen $2.47 x kg of Hydrogen used over 700,000 miles @ 7.5 Miles/kg 93,333 Hydrogen Cost Per Truck Lease(2) $230,637 Service & Maintenance Cost @ $0.067/Mile $46,760 Total Service & Maintenance Cost $46,760 Total Cost of Nikola Lease $465,571 Vehicle Profit Per Nikola Lease (Before Corporate G&A)(3) $199,429 Vehicle Profit Margin 30.0% Station CapEx per Lease(4) $26,365 Cash Generated per Truck Lease(5) $173,064 Each individual FCEV truck lease is anticipated to have steady cash generation over the life of the lease COWEN.COM18 COWEN EQUITY RESEARCH Nikola Corporation June 17, 2020
  • 19.
    Figure 19 –Nikola Illustrative Example of Securitization Structure Source: Nikola Corporation (April 2020 Analyst Day) The lease model with the accompanying securitizations has an impact on the timing of revenue recognition and associated cash flow. The company has provided a helpful illustrative example regarding the matter. COWEN.COM 19 COWEN EQUITY RESEARCH Nikola Corporation June 17, 2020
  • 20.
    Figure 20 –Illustrative Fuel Cell Truck P&L and Cash Flow Source: Nikola Corporation (April 2020 Analyst Day) 1) Numbers in the table illustrate approximate amounts to which Nikola on average expects to receive from FCEV lease 2) Numbers in the table per lease year does not sum to the total lease value due to rounding Opportunities Outside Trucking Look Intriguing But Path to Commercialization For Nikola is Unclear We note that Nikola has developed several products in its Powersports division, aiming to leverage a “halo effect” of the brand. Outside of potential success with the Reckless with the Marines and other affiliated Department of Defense agencies, we are not hopeful on any of the products on this segment. We view them largely as a distraction for management, with a different channel to market, service and repair. While we find the product features compelling, we just don’t believe management should be spending time in commercializing these products. The NZT, which stands for net zero toll, and Reckless were initially focused on by Nikola because the platforms allowed for faster testing of suspension components from Meritor now used on the truck, motor design, batteries and battery management software. Now that those features have all been fully baked, we believe these additional projects should only be explored if they can be done in a capex light manner through the use of a third party for manufacturing. We believe there is also optionality to do a joint venture with a partner for this segment or to divest it at some point in time as well. COWEN.COM20 COWEN EQUITY RESEARCH Nikola Corporation June 17, 2020
  • 21.
    Figure 21 –Nikola NZT Figure 22 Reckless Figure 23 – Nikola WAV Source: Nikola Corporation The NZT is an off-highway vehicle (OHV) that Nikola is marketing. The company’s website indicates that the NZT will start production in 2021 and pricing starts at $80,000. With HVAC, torque vectoring, infotainment/HMI, and ABS brakes pricing is anticipated to be $95,000-$100,000. There are two primary variants of the NZT, the NZT 198 which has a 198kw offering 266hp as well as the NZT Limited, which is based on a 440kw drivetrain pumping out 590hp. The NZT also has 3 different battery pack sizes, ranging from 75 kWh, 100 kWh and 125 kWh, offering ranges of 90, 120 and 150 miles respectively. Targeting the military, the Reckless is based on the NZT platform and the company was awarded a $4.35mn contract in October 2019 in conjunction with Pratt & Miller Engineering to integrate fuel cells. Nikola received $1mn of the $4.35mn project. The Reckless OHV (off highway vehicle) is a completely electric vehicle that can go from 0 to 100 kilometers-per-hour in just over three seconds. The vehicle has a modular capability that can plug and play with a remote weapons station and military drones. The Reckless uses a 125-kWh battery pumping out 555hp and 4,900 ft-lbs. of torque with four separate electric motors. The vehicle is named after Staff Sergeant Reckless, a heavily decorated war horse in the United States Marines during the Korean War that delivered supplies without a handler to the front lines of battle. The Reckless was initially called the Nikola Zero and tested by the Marines at Camp Pendleton in 2017, largely against the Polaris RZR line. The goal of the Reckless design is to be narrow enough to fit into a V-22 Osprey aircraft. The vehicle also has a low acoustic and thermal signature. The vehicle can also act as a generator for the military, exporting 15kw of power. Lastly, the Nikola WAV is a jet ski style vehicle that Nikola has introduced that features some high tech attributes including a 12-inch, 4K display embedded in the dash and LED lights in the front and back of the vehicle. Nikola has developed a battery architecture specifically for watercraft. The company’s website has no expected production date or cost available; however, they are taking no money down reservation orders. COWEN.COM 21 COWEN EQUITY RESEARCH Nikola Corporation June 17, 2020
  • 22.
    What Is NotIn Our Model That Could Be Upside Our modeling of Nikola only assumes commercialization of the BEV and FCEV trucks and related fueling and service. We believe there are multiple areas of upside to our model; however, handicapping the probabilities of success in any of the areas highlighted below is a challenge, thus we have elected to exclude them.  Powersports – assume no revenue from NZT, Reckless and WAV  We are assuming the JV with CNH/Iveco only produces BEV trucks from 2021 to 2023 until manufacturing migrates to the Coolidge, Arizona facility in the Summer of 2023. We see a high probability that this is overly conservative, especially as Iveco moves closer to the 2025 CO2 mandates in Europe.  We are assuming zero residual value for the leased vehicles, which could be overly conservative.  We are assuming no success for autonomous trucking in our model. We believe that fleets could be in a position to pay Nikola about $0.40/mile should autonomous trucking work. Nikola's trucks are designed with autonomous driving in mind, which may provide revenue to Nikola in the future as well as potential cost savings to customers. All Nikola products will be built with a space claim for an autonomous hardware suite. Given the nature of Nikola’s dedicated route customers, operating point-to-point interstate routes between its hydrogen stations, Nikola’s trucks provide an ideal testing environment for further development and advancement of autonomous technology. When the various regulatory agencies have approved some level of autonomy, the company will likely consider a partnership with a software vendor. We note Bosch is already developing such software for Daimler and others in the light duty vehicle market.  We are not assuming any success in energy optimization, where the company could essentially use electrolyzers and related hydrogen storage tanks as a form of economic arbitrage. The increased volatility from renewable energy creates a distorted energy production curve, resulting in both predictable (e.g., the sun comes out every day) and unpredictable (e.g., the wind blows stronger on some days compared to others) surplus energy production capacity. This surplus energy typically goes unused, and in extreme cases must be traded away at zero or even negative revenue to the utility provider. Hydrogen production can be used to balance the grid by taking excess energy production and storing it for future use. Nikola can also help balance the grid by allowing utilities and power providers to interrupt hydrogen station electricity consumption during peak demand. Nikola's ability to turn excess energy into hydrogen may offer operators and energy providers the ability to increase revenue by selling otherwise wasted off-peak generating capacity. Additionally, the ability to store unused energy in the form of hydrogen reduces the need for peak power generating plants that are typically costly to build and operate, and that historically are heavily underutilized. Instead, Nikola could potentially build excess hydrogen storage on-site, then sell excess hydrogen back to the grid during periods of peak demand. It is this area where we think a partnership with a Shell, Total or other energy production and trading firms would make strategic sense. Each station in its current design has about 30 hours of hydrogen storage, assuming full utilization of about 210 trucks per day. The level of storage could be opportunistically increased in certain geographies that have more volatile swings in electricity pricing such as the Texas panhandle from excess wind power production. COWEN.COM22 COWEN EQUITY RESEARCH Nikola Corporation June 17, 2020
  • 23.
    Figure 24 –Volatile Energy Production Curves Created by Renewable Power Create an Opportunity for Electrolyzers Figure 25 – Beyond Fuel, Hydrogen Can Be Used as a Power Source Source: Nikola Corporation  We are assuming the company does not receive any form of government incentives, either for the purchase of the truck or state or regional programs such as the low-carbon fuel standard (LCFS) in California. Given the bevy of government incentives that in recent weeks have accelerated, in particular in Europe, we believe this is another area of conservatism in the model. The Nikola team has noted in recent investor presentations that the LCFS credit in California could offset the capital cost of the facility by $5-10 million. Note Nikola plans to build 10 to 12 stations in California. COWEN.COM 23 COWEN EQUITY RESEARCH Nikola Corporation June 17, 2020
  • 24.
    Figure 26 –Summary of Notable Policies Supporting Fuel Cell Vehicles Source: Bloomberg New Energy Finance Coolidge, Arizona Manufacturing Facility Ramp Key to the 2023 and Beyond Story In the Spring of 2019, Nikola acquired about 400 acres of land in Coolidge, Arizona, which is about 50 miles south of Phoenix, Arizona. The land, which was bought for an undisclosed sum, is located in the Inland Port Arizona industrial park, which is served by rail and truck. Rail abuts the property and Interstates 10 and 8 are nearby. Nikola intends to break ground on the Coolidge site in 3Q20, with the aim of having initial final assembly possible in late 2021. The company expects 5,000-unit capacity in Coolidge in early 2022 and reaching a full capacity available of 45,000-50,000 units by the end of 2023 assuming the factory runs 2 shifts. Should the company run 3 shifts, we believe there is enough capacity to produce up to 55,000-60,000 trucks per annum. The company anticipates that one third of the capacity will be for BEVs, with the remainder for FCEVs. We note that both trucks can be manufactured on the same assembly line and they have ~90% parts commonality between them. COWEN.COM24 COWEN EQUITY RESEARCH Nikola Corporation June 17, 2020
  • 25.
    Beginning in 2021,Nikola expects to utilize existing excess capacity at Iveco's Ulm, Germany plant to begin production of the Nikola Tre BEV for U.S. delivery. These first trucks will be imported into the U.S. to fulfill launch customer orders. Nikola will also build the Nikola Tre (both BEV and FCEV) for the European market in Iveco's Ulm, Germany facility. The Ulm facility has the ability or product 5,000-10,000 trucks per year. The company expects most 2021 BEV sales to be focused on California and New York, states that have incentives. The trucks will focus on urban metro, inner city, local delivery, port operations and drayage operations applications. We believe one to two launch customers will be announced in the coming months and participate in initial fleet testing and initial production of the all-electric Nikola Tre. The company has laid out several phases of construction for investors to monitor: Phase 1—Low Volume Production—up to 5,000 units per year:  Begin construction mid-2020  Warehouse space (approximately 100,000 - 150,000 square feet)  Low-volume production capacity (approximately 5,000 units per year)  Complete construction by the end of 2021  Commissioning and start-up with Nikola Tre BEV in production in Q1 2022 Phase 2—High Volume Production—up to 50,000 units per year:  Begin construction early-2021  Complete manufacturing facility (approximately 1,000,000 square feet)  High-volume production capacity (approximately 50,000 units per year)  Complete construction by the end of 2022  Commissioning and start-up with Nikola Two FCEV in production in Q1 2023 A Deeper Look into the Heavy Duty Commercial Trucking Market The global commercial vehicle market, in its broadest definition, includes light, medium, and heavy-duty trucks, buses, RVs, vans, and other commercial vehicles. We estimate it to be well in excess of $1.0 trillion dollars in revenue globally. The US pure-play truck OEMs operate primarily in the truck manufacturing market, and within that, primarily in the medium and heavy-duty markets. Narrowing down the market further, heavy-duty (class 8 and 7) trucks in North America constitute one half to just over two thirds of OEM business. PACCAR and Navistar are the only US-based, pure play commercial vehicle OEMs. Nikola is aiming to join the crowd in 2021 with the launch of their battery electric truck. COWEN.COM 25 COWEN EQUITY RESEARCH Nikola Corporation June 17, 2020
  • 26.
    Figure 27 :Overview of Commercial Vehicle Classifications Source: Cowen and Company estimates and DOT End markets for heavy-duty trucks include industrial, consumer, and vocational applications in the truckload, LTL, and other freight industries. Additionally, many non- freight companies and government agencies have their own trucking fleets. Medium- duty trucks are used in parcel service and local pickup and delivery operations as well as in lighter vocational applications. Global Heavy-Duty Class 8 Truck Market A subset of the global >6t truck market discussed above, the global Class 8 tractor production market exceeds $250Bn in annual revenue, according to our estimate. This is on production of more than 2.2MM units. We estimate that North America has a roughly $45Bn market share, or just under 20% of global revenue. This is on production of ~325K units, or ~14% of global production. Duty Class Gross Vehicle Weight (lbs) Class 1 0 - 6,000 Class 2 6,001 - 10,000 Class 3 10,001 - 14,000 ˂6t & ˃6t Class 4 14,001 - 16,000 Class 5 16,001 - 19,500 Class 6 19,501 - 26,000 ˃6t Truck Market Class 7 26,001 - 33,000 Class 8 33,001 - 80,000 ˃16t Truck Market ˂6t Gross Vehicle Weight Classification (t) Light Duty Medium Duty Heavy Duty COWEN.COM26 COWEN EQUITY RESEARCH Nikola Corporation June 17, 2020
  • 27.
    Figure 28 :The Global Class 8 Production Market Consists of 20 Primary Manufacturers (2019) Source: Cowen and Company estimates, PACCAR, ACT Research Figure 29 : Daimler Enjoys the Largest Class 8 Market Share in the US, Followed by PACCAR – March 2020 Retail Sales Source: Cowen and Company estimates, PACCAR, SEC filings, ACT Research Daimler (Freightliner, Western Star) 40% PACCAR (Kenworth, Peterbilt) 30% Volvo (Volvo, Mack) 19% Navistar 11% United StatesClass8 Market Share COWEN.COM 27 COWEN EQUITY RESEARCH Nikola Corporation June 17, 2020
  • 28.
    Figure 30 -Historical and Projected US Class 8 Active Population and Average Age Source: Cowen and Company estimates and ACT historical data ACT Research segments the on-highway Class 8 freight market between private and for-hire fleets, representing 53% and 47% of the Class 8 market, respectively. Private fleets, such as Anheuser-Busch ("AB"), Walmart, are almost all regular route operations or "dedicated" routes running point-to-point. The for-hire market, such as JB Hunt, XPO Logistics, can be further broken down into: contract 32%, spot 12%, and dedicated 3%. Dedicated for-hire fleets are mostly outsourced private fleets that run point-to-point. Historically Relatively High Barriers to Entry; Powertrain Shift Presents Opportunity for New Entrants Unlike its customer base, which is highly fragmented, the North American heavy-duty truck manufacturing market is dominated primarily by four companies controlling 99% of the market: Daimler, PACCAR, Volvo, and Navistar. Of these, only PACCAR and Navistar are U.S. based and can be considered pure-play truck OEMs. The long-haul freight market is still dominated by diesel powertrains, given the fuel's ubiquity and substantially higher energy density. However, in the post VW emissions scandal era, governments have begun to examine emissions regulations more closely. The charge has been most notably led by local government and cities primarily in Europe, which have begun to set regulations limiting diesel vehicle usage or even outright banning them. Given many OEMs operate on global production platforms the industry expects to see widespread availability of alternative powertrains overtime. COWEN.COM28 COWEN EQUITY RESEARCH Nikola Corporation June 17, 2020
  • 29.
    The short drivingdistances and frequent stop-and-go duty cycles of commercial vehicles make them excellent candidates for incorporating cleaner modes of propulsion, which can increase fuel economy by 30-40%, reduce harmful emission by up to 30% and reduce maintenance costs by up to 30%. With heavy-duty diesel vehicles offering extremely poor fuel economies of 5-7mpg, a 30-40% improvement can result in significant fuel consumption savings. There are a number of factors for fleets to consider when deciding whether or not to buy an electric, fuel cell or natural gas vehicle. We are seeing positive developments in all of the factors including initial purchase price, fuel costs and maintenance costs. Beyond maintenance expenses, miles driven per year is a key metric. Most conversations we have had with fleets at tradeshows such as MATS, The Work Truck Show and ACT (Advanced Clean Transportation) have indicated that a truck needs to consume 15,000 gallons of fuel per year at a minimum to make the economics of powertrain conversion work, with a more compelling situation at 20,000 gallons. Note the typical truck gets upwards of 6 to 7 miles per gallon in fuel economy. Figure 31 - Overview of Nikola’s Addressable Market Source: Cowen and Company, Company Presentation 1) Includes both short-haul and long-haul heavy duty truck markets 2) Including vehicle, fuel, and service & maintenance; based on proprietary research from ACT Research While the light duty vehicle (passenger car) market gets the bulk of attention as it relates to electrification, there is an accelerating shift toward cleaner and cost-effective solutions in the bus, refuse, and Class 4-8 trucking market. The societal pressure and regional political will are in place to eliminate truck emissions over time. The only questions are how and when. OEMs have stepped up their offerings in the last 12 to 18 months and the sector is no longer dominated by startups, with Daimler, Volvo, PACCAR, etc. now launching new platforms. The trends of fuel efficiency, safety, and connectivity seen in the passenger vehicle market are making their way into the commercial vehicle market as well. • Commercial vehicle buying decision driven by Total Cost of Ownership (TCO) • The largest Class 8 fleets are replaced every 3-5 years on average — adoption of new technology is expected to be rapid once it passes TCO parity threshold • Increasingly stringent global emissions standards will increase comparative advantage of zero emissions vehicles relative to diesel • In some cases, such as city centers, diesel will be banned entirely • Governments, fleet owners, and other stakeholders are demanding a zero emissions solution KEY DRIVERS FOR ZERO EMISSION COMMERCIAL VEHICLE DEMAND • Dedicated routes are primarily comprised of private fleets and dedicated operations of large for-hire carriers • For initial rollout of FCEV, Nikola will target the largest private and dedicated fleets with either nationwide or significant regional distribution networks • Focus on dedicated routes allows for targeted, capital-efficient deployment of hydrogen stations N.A CLASS 8 TRUCK SEGMENT STRATEGY 1,800,000 class 8 semi-trucks on the road daily (1) +25% 450,000 trucks run on dedicated routes 75% 1,350,000 trucks COWEN.COM 29 COWEN EQUITY RESEARCH Nikola Corporation June 17, 2020
  • 30.
    We don't seea silver bullet technology evolving in a winner take all scenario, with natural gas, propane, electric, and fuel cells all playing a role. Historically, natural gas and propane were the most cost effective; however, the move toward zero carbon as a focus of corporate fleets in California and others is leading the industry more toward electrified solutions in our view. According to the Environmental Protection Agency and the European Environment Agency, the transportation industry causes an estimated 25% to 30% of U.S. and EU greenhouse gas emissions. While heavy-duty trucking represents less than 10% of the overall industry, it is responsible for approximately 40% of transportation industry GHG according to the International Council on Clean Transportation. With ever-expanding e- commerce freight demands that society accelerated during the COVID-19 pandemic, zero-emission vehicles are believed to be one of the only viable options for a sustainable future. Figure 32 – Three Primary Drivers to New Powertrain Adoption for Trucks Source: Cowen and Company, Bloomberg New Energy Finance According to third party consultancy Bloomberg New Energy Finance (BNEF), for lighter trucks and urban duty cycles, battery electrics (BEV) or range-extender hybrids (REX) will be at cost parity with diesels on a total cost of ownership (TCO) basis within three years. For some use cases, they are already the lower cost option. However, the capital costs of electric light trucks will not reach those of diesel until 2026 for REX or 2030 for BEV according to their analysis. Operators and manufacturers will have to devise new funding schemes to take advantage of the lower lifetime costs. New financing mechanisms such as what Duke Energy is doing with UPS and commercial trucking partner Workhorse Group are aligned with BNEF’s views. In this situation, Duke is financing the charging infrastructure and batteries within the trucks and UPS is paying an upfront cost comparable to a traditional internal combustion engine truck. Duke then intends to use the batteries in a second life application within its own electric grid once the state of charge falls below acceptable use for UPS within its daily routes. Rising policy support Evolving financing methods Falling battery costs • Subsidies • Mandates and targets • Battery leasing • New charging solutions • Improving TCO competitiveness • Approaching upfront price parity COWEN.COM30 COWEN EQUITY RESEARCH Nikola Corporation June 17, 2020
  • 31.
    BNEF further expectsthat heavy-duty electrified trucks for urban applications will cost at least twice as much as equivalent diesel vehicles (on an upfront basis) until the early 2020s. Still, their TCOs will approach those of diesel by 2022 and all-electrics will reach TCO parity in the mid-2020s. Electrifying the long-haul heavy-duty segment is a challenge due to charging infrastructure issues and weight penalties, both topics that we explore further in this discussion. Lastly, BNEF has noted that the economics of natural gas drivetrains are getting better for heavy-duty vehicles, while diesel powertrains will incur increasing cost burdens for emissions compliance. Natural gas trucks have already reached TCO parity with diesel in long-haul applications and will do so in urban duty cycles by the early 2020s. Figure 33 - Total Cost of Ownership ($/mile) of Light Commercial Vehicles in the United States (Various Powertrain Technologies) Figure 34 - Total Cost of Ownership ($/ton-mile) of Light Commercial Vehicles in the United States (Various Powertrain Technologies) Source: Bloomberg New Energy Finance Globally, about 29% of greenhouse gas emissions emanate from the transportation sector. Governments continue to focus on driving GHGs down and thus have regulations in place for the auto industry. To that end, the price of fuel is not impacting the direction the industry is headed in terms of fuel efficiency, new technology being added to the vehicle, or emission reduction initiatives. Commercial delivery trucks are an initial area of focus on alternative powertrain developments and the industry is at the nexus of several mega trends underway in society today.  Urbanization (see our Smart Cities report HERE)  Online commerce and demands for just in time delivery  Corporate desire to reduce their CO2 footprint (see our ESG report HERE) 0.0 0.2 0.4 0.6 0.8 1.0 1.2 1.4 2018 2019 2020 2021 2022 2023 2024 2025 2026 2027 2028 2029 2030 $/mile Diesel CNG LNG BEV REX 0.00 0.05 0.10 0.15 0.20 0.25 0.30 0.35 2018201920202021202220232024202520262027202820292030 $/ton-mile Diesel CNG LNG BEV REX COWEN.COM 31 COWEN EQUITY RESEARCH Nikola Corporation June 17, 2020
  • 32.
    EU negotiators agreedto impose a cap on CO2 emissions for trucks for the first time on February 18th 2019, following an increase in the requirements for cars that we highlighted in our Ahead of the Curve report HERE. The EU government has set a 30% CO2 reduction for 2030 fleet compared to 2019 levels, and also endorsed a 15% reduction for 2025 in the interim. Switching from diesel to natural gas trucks can result in a 20% reduction in C02, and up to 100% reduction for trucks that utilize renewable biogas. We see the Westport portfolio as very attractive for OEMs looking for a range of alternative powertrain solutions to meet these regulations and could see increased activity from new customers. Connectivity and Automation; Path to Improving Vehicle Efficiency Fleet operators are increasingly engaging with vehicle technology suppliers to explore the benefits of connected and autonomous vehicles. In the short and midterm, rather than removing the driver, these systems are intended to increase retention while also improving vehicle safety and reducing costs. Many fleet operators can see driver turnover rates as high as a 100% annually, which elevates both hiring and logistic costs. ADAS technologies can improve working conditions for drivers and also capture data and coach drivers on more efficient vehicle operation. Purdue University is spearheading work on platooning, which requires the intersection of connectivity and automation. Platooning can improve emissions and save on fuel costs by as much as 7%, however, under manual operation, this is difficult to do safely. In order to take advantage of platooning benefits, trucks need to follow at a distance as low as 40 feet. Human brake reaction time under good conditions is 1.40 seconds but using connected and autonomous technology can reduce that response time to just 0.03 seconds. Using V2V systems, multiple trucks can be incorporated into a platoon. For a more thorough investigation of autonomous trucks, see our Ahead of the Curve report HERE. Drivers and Fuel Remain the Largest Cost Component for Fleet Operators The largest cost component for vehicles on a per mile basis is the driver followed by the cost of fueling the vehicle. Fleet operators are continuously searching for ways to better control these costs given these factors represent 65% of average per mile fleet costs. New powertrains are largely focused on reducing fuel costs and hopefully repair and maintenance costs. Vehicle connectivity coupled with ADAS and autonomous systems could help to improve driver efficiency and vehicle operation. Drivers under levels 4 and 5 of autonomy could be eligible to fulfill mandatory rest brakes while the truck is still under operation. This would not only improve work quality for the driver, but also allow the truck to operate more efficiently by making more deliveries over a shorter period of time. Additionally, connected systems can assist the driver with braking and acceleration rates as well as leverage telematics and infrastructure sensors to plot more efficient delivery routes in real time. COWEN.COM32 COWEN EQUITY RESEARCH Nikola Corporation June 17, 2020
  • 33.
    Figure 35 –Average Fleet Total Cost Per Mile Source: Purdue University (Work Truck Show 2018), Cowen and Company Exploring Technology Developments in Trucking Powertrains Much like the early days of natural gas, battery technologies must determine where the dividing line is for higher horsepower applications. Eight or nine years ago, the debate for heavy duty trucking was how to store natural gas on trucks, CNG or LNG. Figure 36 – Tug of War Between Natural Gas and Battery/Fuel Cell Solutions in Transportation Source: Cowen and Company, Company Reports Heavy duty trucking segment is often in the middle of the debate on alternative powertrains due to its position in the fuel consumption spectrum. Like CNG, Battery Electric Vehicles (BEVs) will quickly dominate the passenger vehicle markets through the Class 6-7 segments of transport buses, and refuse trucks, though getting enough kilowatt-hours stored on anything larger becomes a challenge. Driver, 40% Fuel, 25% Purchase, 14% Repair, 10% Other, 11% Car Truck Bus Garbage Truck 18- Wheeler Plane Train Ship BEV FCEV CNG LNG COWEN.COM 33 COWEN EQUITY RESEARCH Nikola Corporation June 17, 2020
  • 34.
    Both battery electricand fuel cell technologies require their own unique infrastructure; one being the power grid’s need to update its distribution system, while fuel cells will require a major roll-out of hydrogen refueling centers. While the infrastructure isn’t usually the focus of investors, it remains top of mind for fleets evaluating adoption of alternative powertrain solutions and in our mind a potential gating factor for adoption relative to passenger cars which can charge at home or at work. Figure 37 – Estimated Equipment Prices and Cost Per Mile of Various Heavy Duty Powertrains Source: ACT Conference 2018, Cowen and Company Battery Electric Powertrains The early market for commercial electric vehicles was constrained by high prices and limited demand. Falling battery costs, engineering advancements, and anticipation of more stringent emissions regulations, especially in cities, are driving renewed interest in the sector. Tesla’s bold claims in 2017 regarding its Semi truck offering have made fleets take notice and sharpen their pencils on exploring battery electric trucks in greater detail. Elon Musk on Twitter November 12, 2017 on the Tesla Semi Truck Launch – “This will blow your mind clear out of your skull and into an alternate dimension.” Much of what was revealed in 2017 still doesn’t exist today and the ramp up of Tesla’s offering is still unclear. While Tesla’s initial aim of selling up to 100,000 trucks per year in 2021 were far off of reality (they now claim “limited” volumes in 2020), the market is moving quickly toward electrified options, with Daimler most recently leading the charge. Competitive Environment Intense – Nikola Looks to Have First Mover Advantage and Controls the Fueling Nikola is not without competitors in the race to decarbonize Class 8 trucking. While Tesla’s Semi launch is the most topical for investors since their 2017 reveal, there are many other electric and fuel cell Class 8 trucks in development. Diesel Natural Gas (NG) Hydrogen Fuel Cell (FCEV) Electric (BEV) Cost $140,000 Capital Cost $42,000 Residual Value $3.13/gal diesel fuel $2.75/gal DEF $185,000 Capital Cost $40,000 Residual Value $2.48/dge of nat gas $300/DGE in tanks $350,000 Capital Cost Residual Value N/A $1.50/dge H2 $0.11/kWh $300/kWh in batteries $180,000 Capital Cost $0 Residual Value Analysis $0.11/kWh $100/kWh in batteries Range 1,000+ miles Dual Alum. Tanks Dense fuelingnetwork 600 miles 120DGE tank package Adequate fueling network 1,000+ miles 350kWh storage H2 fuelingnetwork notyet available 500 miles 1MW storage Surperchargingstations not yet available Weight (Battery Pack Weight/kWh) 20,000 lbs. 21,000 lbs. 20,000 lbs. 10-15#/kWh 24,000 lbs. 10-15#/kWh Performance 6.5 - 8.5 mpg 425 – 600 hp 1,650 ft-lb $0.10/mi maintenance 5.0 - 6.0 mpge 400 hp 1,400 ft-lb $0.115/mi maintenance 13 - 15 mpge 1,000 hp 2,000 ft-lb $0.00/mi maintenance 17 - 19 mpge 1,000 hp 2,000 ft-lb $0.08/mi maintenance OperatingCost per Mile $0.775 $0.926 $0.72 $0.726 COWEN.COM34 COWEN EQUITY RESEARCH Nikola Corporation June 17, 2020
  • 35.
    Figure 38 –Tesla Semi Truck Figure 39 – Interior View of Tesla Semi Source: Tesla Kenworth has showcased its T680 version. XOS Trucks, Hylilion, Lion Electric, Daimler and many others have entered the fray for the all-electric side. On the fuel cell side, testing has been underway for several years. The biggest step forward in the industry in our view was Cummins’ (covered by Matt Elkott) acquisition of Hydrogenics in 2019. The transaction brought in-house fuel cells and electrolyzers to an engine OEM. Cummins’ commentary at trade shows such as ACT and the Work Truck Show since the acquisition are aligned with Nikola’s view of the world, that above 300 miles of range will be a challenge to accomplish with an all-electric version of a Class 8 truck. In addition, more recently in the middle of the pandemic, Volvo Group and Daimler Truck formed a joint venture to develop fuel cell based trucking solutions. The venture aims to have initial production in 2024 and will not be offering fueling according to statements made at the time of the announcement. Weichai, China’s largest engine OEM has also taken a ~20% stake in fuel cell maker Ballard Power and has formed a joint venture that expects to begin production this Summer for the China market. Separately, Ballard is working with Paccar on testing fuel cell trucks in the Los Angeles area for drayage applications. Competition in the Class 8 heavy-duty truck industry is intense and new regulatory requirements for vehicle emissions, technological advances, and shifting customer demands are causing the industry to evolve towards zero-emission solutions. COWEN.COM 35 COWEN EQUITY RESEARCH Nikola Corporation June 17, 2020
  • 36.
    Figure 40 -Select Medium and Heavy Duty BEV and FCEV Announcements Source: Cowen and Company, company Presentation Fleets will likely look at total cost of ownership (TCO) as a primary factor in comparing solutions from companies like Nikola among other factors such as :  product performance and uptime;  availability of charging or re-fueling network;  emissions profile;  vehicle quality, reliability and safety;  technological innovation;  improved vehicle operational visibility;  ease of autonomous capability development; and  service options BEV ANNOUNCEMENTS FCEV ANNOUNCEMENTS • Market is awakening to the vast potential of BEV and FCEV heavy duty trucks • Nikola trucks are in advanced stages of development and testing and are expected to meet specific use case needs, supporting potential rapid market adoption CF Electric Short Haul and Refuse Fleet trials 2019 AEOS Class 7 Truck Announced production 2020 ET-1 Class 8 Truck Announced production 2019 International eMV Medium Duty Production 2021 Semi Class 8 Truck Limited production 2020 Plan to spend €1B+ in electro mobility by 2025 FCEV Truck Heavy Duty Limited production Q4 2019 (10 units) H2 XCIENT Heavy Duty Production 2023 FCEV Truck Class 8 Truck No announced production Announced goal to have H2 series- production vehicles by the end of the 2020s JV With Volvo - Production 2024/25 eActros Class 8 Truck Serial Production 2021 eCascadia Class 8 Truck Serial production 2021 E-Fuso Vision One Class 8 Truck Serial production 2021 FL and FE Medium and Heavy Duty Serial production March 2020 Z.E. Lineup Short Haul and Refuse Pre-series model testing 2H19 LR Refuse Refuse Testing 2020 Same Truck Group COWEN.COM36 COWEN EQUITY RESEARCH Nikola Corporation June 17, 2020
  • 37.
    Daimler’s own viewof electrified trucking solutions suggests that subsidized use cases, such as what we see in the ports of California due to California Air Resources Board requirements, will be the first market for adoption. We note that Nikola is also starting in California with anchor customer Anheuser Busch, leveraging its Van Nuys, CA brewery and building out stations in Interstate 10 for the route between the Los Angeles and Phoenix area. The push to decarbonize trucking has drawn a great deal of interest in recent months, with a greater focus on Europe; however, while Federal mandates are not as strict, regional rules such as those in California as well as commercial desire to reduce carbon footprints is leading to increased interest in the sector. Since 2016, transportation has been the biggest direct source of U.S. greenhouse gas emissions. Most of the sector’s emissions come from road transport, which derives over 90 percent of its energy from petroleum. According to the EPA and the EEA the transportation industry causes an estimated 25% to 30% of U.S. and EU greenhouse gas emissions. While heavy-duty trucking represents less than 10% of the vehicle population, the ICCT estimates it is responsible for approximately 40% of emissions from the transportation industry, making them disproportionate contributors to pollution. Diesel vehicles are a major source of harmful air pollutants and GHG emissions. The associated local air pollution, particulates of oxides of nitrogen and particulate matter emissions, negatively impacts health and quality of life. Additionally, diesel exhaust has been classified as a potential human carcinogen by the EPA and the International Agency for Research on Cancer. Studies done on exposure to high levels of diesel exhaust indicate a greater risk of lung cancer. A significant share of global GHG emissions stem from heavy-duty vehicle transportation. We believe zero-emission vehicles are one of the only viable options to reduce emissions in the transportation sector to meet climate, ozone, and regulatory targets. According to the U.S. Emissions Center for Climate and Energy Solutions, in 2017, U.S. GHG emissions totaled 6,457 million metric tons ("MMT") of CO2 equivalents. Medium and heavy-duty vehicles accounted for 7% of total emissions, equal to 431 MMT of CO2 equivalents. The EEA's report on GHG in Europe found that in 2017, EU GHG emissions totaled 4,481 MMT of CO2 equivalents. Heavy-duty vehicles accounted for 5% of total emissions, equal to 224MMT of CO2 equivalents. In addition, consumers are increasingly demanding that corporations take action to reduce their carbon footprint. A study by Nielsen cited that nearly half (48%) of U.S. consumers say they would "definitely" or "probably" change their consumption habits to reduce their impact on the environment, placing reducing emissions high on the agenda for large corporates. For example:  Amazon has pledged to become carbon neutral by 2040;  BP has pledged to become carbon neutral by 2050;  DB Schenker plans to reduce specific CO2 emissions by 30% before 2020 and 50% before 2030, compared to 2006 baseline;  DHL set a goal to reduce all logistics-related emissions to zero by 2050;  UPS has committed to sourcing 40% of its ground fuel from low carbon or alternative fuels by 2025 COWEN.COM 37 COWEN EQUITY RESEARCH Nikola Corporation June 17, 2020
  • 38.
     Walmart seta goal of an 18% emissions reduction in their own operations by 2025 and to work with suppliers to reduce emissions by 1 gigaton by 2030. The trucking industry has less volume for lithium ion batteries than passenger cars and the associated packs are typically a different form factor. This is the primary factor for why pricing in 2019 is about 20-30% above typically cited passenger car battery prices. Battery Price Decline Critical for Adoption of Electrified Trucks Battery prices for heavy duty trucks will take longer to reach industry wide averages due to customized battery management systems. We note that one factor to watch however is that a number of heavy-duty truck makers are also in the passenger vehicle business and may be able to combine purchasing power to further drive down costs. Figure 41 – Anticipated Battery Costs For Heavy and Light Duty Commercial Vehicles Source: Bloomberg New Energy Finance Elon Musk says his company’s battery-powered big rig will be 20% cheaper to operate than diesel trucks and represents “economic suicide for rail.” Mr. Musk stated that the cost of running three or more "platooned" electric semis would approach the cost of shipping rail. Without knowing the cost of the electric trucks, the cost of building the infrastructure nationwide and internationally to support such trucks as well as other costs, we wouldn't want to speculate as to how accurate or how far off the mark such a statement is (most of what Mr. Musk says is exaggerated, especially around timing, in our view). Tesla’s passenger car sales are about 2/3 domestic and 1/3 international. If the same breakdown were true for trucks Tesla would have about 35% domestic share of Class 8 trucks and 6% globally, both figures we find incredibly unlikely given the risk averse nature of fleet operators. Tesla’s view is that the truck will be 20% cheaper to operate on a per mile basis. Many details on their assumptions were not provided. We have attempted to build a payback analysis using the 2 main assumptions they did offer - $0.07/kWh electricity and ~$100/kWh battery packs. If those assumptions are used, we get to a 3-year payback. 0 50 100 150 200 250 300 350 400 2018 2019 2020 2021 2022 2023 2024 2025 2026 2027 2028 2029 2030 2018 $/kWh HCV battery price LCV battery price Experience curve COWEN.COM38 COWEN EQUITY RESEARCH Nikola Corporation June 17, 2020
  • 39.
    Note DHL andothers have indicated paybacks cold be as low as 2 years. Assuming current battery prices and commercial electricity pricing from the grid of $0.09/kWh in lieu of solar, we see paybacks today more in the 5 to 6-year time frame. If Tesla is unable to drop its 2170 battery production costs down to the $100/kWh range from the current $150-175 range (and industry pricing of $175), we believe the Tesla Semi will be dead on arrival. Our estimated sensitivity to those assumptions is shown below. Figure 42 –Estimated Tesla Semi Payback Period Source: Cowen and Company, Tesla A traditional diesel truck has about an 800 to 1,000-mile range between refueling and Tesla noted that its truck will have a range of 500 miles at maximum gross vehicle weight at highway speeds (60 miles per hour). Tesla further noted that 80% of routes for truckers are less than 250 miles, noting that it could return to base and recharge. In regard to charging, Tesla has noted that a traditional truck can take 20 minutes to refuel with diesel and that Tesla trucks are aimed at charging at their origin or destination and would be able to achieve 400 miles of range with a charge of 30 minutes through a series of “mega” chargers worldwide. Tesla views 400 miles as 6 to 7 hours of driving for a traditional trucker and charging can be done while the trucker is taking a break for a meal or to use the restroom. The “mega” chargers will be solar powered chargers with Tesla Powerpacks, which should enable the company to guarantee electricity rates in a particular region to the fleet operator. While the “mega” charger idea sounds impressive, we also note that these chargers are likely to have challenges with permits and interconnections with utilities as many substations near potential customers likely do not have enough capacity to deal with such a load increase. Estimated Payback - Electric Trucks vs. Diesel Class 8 Trucks (Years) 3.0 $25 $50 $75 $100 $125 $150 $175 $200 $0.03 0.3 1.0 1.8 2.5 3.3 4.0 4.7 5.5 $0.04 0.3 1.1 1.9 2.6 3.4 4.1 4.9 5.7 $0.05 0.3 1.1 1.9 2.7 3.5 4.3 5.1 5.9 $0.06 0.4 1.2 2.0 2.8 3.7 4.5 5.3 6.2 $0.07 0.4 1.2 2.1 3.0 3.8 4.7 5.6 6.4 $0.08 0.4 1.3 2.2 3.1 4.0 4.9 5.8 6.7 $0.09 0.4 1.4 2.3 3.3 4.2 5.1 6.1 7.0 $0.10 0.4 1.4 2.4 3.4 4.4 5.4 6.4 7.4 $0.11 0.4 1.5 2.5 3.6 4.7 5.7 6.8 7.8 $0.12 0.5 1.6 2.7 3.8 4.9 6.0 7.1 8.2 $0.13 0.5 1.7 2.9 4.0 5.2 6.4 7.6 8.7 $0.14 0.5 1.8 3.0 4.3 5.5 6.8 8.0 9.3 $0.15 0.6 1.9 3.2 4.6 5.9 7.3 8.6 9.9 ElectricityPrice($/kWh) Battery Cost ($/kWh) 2020 Tesla Target E stimated Current Industry Pricing COWEN.COM 39 COWEN EQUITY RESEARCH Nikola Corporation June 17, 2020
  • 40.
    Duty Cycles AreKey for Electrified Truck Growth Duty cycles that present the greatest opportunity for Electrified Truck growth are urban delivery or other uses that fit these parameters:  Return-to-base operation, where the vehicle returns at end of shift for overnight charging.  Fixed route, within 80 miles round trip.  A lot of stop-and-start driving to allow for regenerative braking.  Diminishing load, where the truck gets lighter after each delivery, helping extend vehicle range.  Lower-speed operation (usually below 60 mph) to preserve battery power. The early market for commercial electric vehicles was constrained by high prices and limited demand. Falling battery costs, engineering advancements, and anticipation of more stringent emissions regulations, especially in cities, are driving renewed interest in the sector. Large volume truck manufacturers are largely absent from the EV market but that is beginning to change driven by Daimler currently and momentum from Volvo and CNH in Europe over the next few years. Instead, today the market is served by an abundance of smaller powertrain manufacturers. Most lack the funding to scale production, so we expect more partnerships and acquisitions over the next few years. Unfortunately for emerging vendors in the market, many have faced financial difficulties over the years, which has led to some potential customer anxiety. Elements that Allow Electrified Trucks to Have a Positive Payback There are 3 critical areas that allow for an electrified truck to have a positive payback: 1) Fuel Cost Savings: Essentially comparing the cost of electricity per mile versus fuel costs. 2) Lower Maintenance Costs:  The battery, motor and associated power electronics of electrified vehicles require little to no maintenance  Minimal fluid changes or maintenance  Brake wear can be reduced due to regenerative braking  Fewer moving parts relative to an internal combustion engine 3) Increased Productivity: Short range applications that exceed 40 to 50 stops per day actually prove problematic for diesel-powered trucks with new diesel emissions technologies, such as diesel particulate filters (DPF) that require periodic regeneration cycles to burn off soot. Typically, diesel engines need to travel at highway speeds to allow for a regeneration cycle during the day; however, such speeds may be rarely achieved in an urban delivery van. Should this regeneration not be achieved, drivers typically have to take time out of their day for the regeneration cycle to be completed. COWEN.COM40 COWEN EQUITY RESEARCH Nikola Corporation June 17, 2020
  • 41.
    Vehicle Light WeightingHelping to Drive Down EV Costs The characteristics of batteries needed for commercial trucks differs from passenger cars as it is assumed that fast charging will be more routinely used and more importantly there are weight limits on commercial trucks. A battery pack in a commercial truck can weigh 2,000-4,000 pounds and that is a sacrifice to cargo. Batteries today cost about $200/kWh in the industry for vendors outside of Tesla and weigh approximately 10-15 lbs/kWh, which displaces payload. The alternative is to run a hybrid fuel cell and battery solution, which adds the requirement to store hydrogen in extremely high pressure tanks, which also adds to weight. In trucking, much of the shift to all electric powertrains has come in lower class vehicles given the energy density differential compared to diesel fuel. However, vehicle light weighting in Class 7 and 8 trucks is helping to reduce costs by requiring smaller batteries thereby increasing cargo capacity and range. TPI Composites is partnering with Navistar to provide composite tractor and frame rails for Class 8 trucks. For more information see our note HERE. Charging Infrastructure Requires New Investments in Energy Grid Energy grid advancements will be crucial as EV adoption grows. While overall energy capacity is not an issue, utility companies are making investments today to deal with peak power availability issues that EVs would likely cause. Peak power supply issues will likely manifest most acutely in passenger vehicles where charging behavior is likely to be similar across all users, i.e. vehicles charging when owners return from work. Monetary incentives and software systems can be leveraged by utilities to modulate charging rate to ensure stable power supply while providing customers with sufficient energy to fully charge their vehicle before use the following day. Trucking companies will face similar issues given the larger energy demands of work trucks compared to traditional passenger vehicles. A Tesla MEGA-Charger, which will be needed to support charging for the company’s all electric semi-truck could require 1.8MW of energy. Adopters will likely need reinforced T&D infrastructure to support a fully electric trucking fleet as well as charging integration with utilities to control peak demand. Figure 43 – Peak Electrical Power Capacity (kW) Source: Daimler (Green Truck Summit 2018), Cowen and Company 820 kW 2.2 MW 350 kW 1.8 MW 0 500 1,000 1,500 2,000 2,500 DTNA HQ Building WST Trck Mfg Plant ionity "Fast" Charging Station (Europe) Tesla MEGA- Charger (kW) COWEN.COM 41 COWEN EQUITY RESEARCH Nikola Corporation June 17, 2020
  • 42.
    Fuel Cell Powertrains Afuel cell is a device that produces electricity by way of an electrochemical reaction. These units combine fuels with ambient oxygen, producing electricity, water, and heat. This is a clean electrical generation technology that emits significantly lower levels of greenhouse gases that have been linked to global warming causation. The lower levels of greenhouse gas emittance stems from the comparatively high efficiencies achieved by fuel cell systems, which have reached levels north of 80% when the fuel cell’s waste heat is captured-- compared to ~33% for combustion engines. Different fuel cells, based on their input fuels, have different characteristics, making each distinct fuel cell better suited for different generation applications; transport, portable, or stationary. The excitement over hydrogen relates to its potential as a pollution-free energy source, which, if produced from renewable means, would not release any carbon dioxide emissions and would slow the pace of global warming. In addition, the fact that hydrogen is the most abundant element on earth (though rarely found in its pure form) and can be produced from the electrolysis of water makes it an ideal fuel choice of the future. Key Points Regarding the Fuel Cell Industry:  Hydrogen is a high energy content fuel that can be generated using renewable energy sources for stationary power or transportation applications.  Hydrogen can act as a form of renewable energy storage.  Plans for a hydrogen-based society are materializing, but still far from a reality.  Cities, countries, and companies are moving forward with hydrogen production, fuel cell technologies, and hydrogen car roll-outs. However, uncertainty surrounding costs, logistics, and impact are slowing implementation. Natural Gas Powertrains The conversion to natural gas by fleet operators represents an economical and environmentally significant development in the trucking market; however, market share remains in the low single digits for the technology. Third-party researcher ACT forecasts that about 2% of Class 8 trucks sold in the United States in 2019 and this year are natural gas powered. Large fleets, such as UPS, who just placed a multi-year 6,000-unit order are driving that share. Share within buses in the U.S. is much higher; however, the heavy-duty market is largely dominated by just a handful of fleets. Within Europe, engine and truck maker IVECO, part of CNH Industrial, estimates that LNG will make up 6-8% of the heavy-duty market by 2024. The adoption of natural gas will not only benefit fleet owners but also drive demand for tank and engine manufacturers. The decline in the price of a barrel of oil, and by extension the price of diesel fuel, has had a cooling effect on the pace of natural gas adoption by fleets. However, we believe that payback periods remain compelling. In fact, by our estimates, fleets employing in-house compression could see paybacks in almost two years. Furthermore, we have seen anecdotal evidence showing that many customers will choose to convert a portion of their trucking fleet to natural gas when payback periods are approximately two and half years or less. COWEN.COM42 COWEN EQUITY RESEARCH Nikola Corporation June 17, 2020
  • 43.
    Diesel has beenthe default fuel in trucking applications due to its high energy density. Increasingly stringent emissions regulations and the falling cost of natural gas have spurred many trucking fleets to explore natural gas as a diesel substitute. Diesel emissions have a much higher particulate content due do the complex composition of diesel fuel. Diesel fuel has 14 carbon atoms and 30 hydrogen atoms, giving it a hydrogen to carbon ratio of 2 to 1, while methane has a ratio of 4 to 1. Methane natural gas has the highest hydrogen-to-carbon ratio of any hydrocarbon. Figure 44 – Molecular Composition of Diesel Fuel and Methane Gas Source: ACT Research, Cowen and Company Natural Gas Trucking Market Background While Nikola is only exposed to the battery electric and fuel cell variants of transportation, we believe investors should be aware of the benefits that natural gas offers. Both CEO Mark Russell and founder Trevor Milton of Nikola have a great deal of experience in natural gas trucking in their backgrounds and would highlight the fuel certainty that hydrogen using electrolyzers offers fleets relative to natural gas fleets, where pricing can be volatile. Both the fuel cell and natural gas industry have had historical issues with quality and lifetime and related maintenance costs, but we believe those dynamics are largely in the past. The natural gas trucking market gives fleet operators access to a fuel system that is more cost efficient than diesel, once lifetime costs are considered. The more miles a turn operates on an annual basis the better the economics and the quicker the payback. As natural gas infrastructure continues to expand, long-haul operators could become even better candidates for fleet conversion. Additionally, while natural gas has less energy content, it is a cleaner burning fuel that requires less complex and expensive emissions control systems to meet current and future emissions regulations. The below table further summarizes the positive attributes of natural gas adoptions for heavy duty trucking applications as well as the hurdles that still exist when compared to diesel fuel. COWEN.COM 43 COWEN EQUITY RESEARCH Nikola Corporation June 17, 2020
  • 44.
    Figure 45 –LNG/CNG Trucking Opportunity Has Many Pros and Cons Source: Cowen and Company The natural gas trucking industry comprises of three main segments. The first segment is the fuel producers and distributors, as well as the fueling stations themselves. The next major segment of the industry is the manufacturing of natural gas trucks, which requires collaboration from engine developers and manufacturers, fuel system designers and installers, as well as OEMs that supply the trucks. Westport, through its subsidiaries, is the largest natural gas engine manufacturer at present. Fuel system designers and installers include both tank and systems manufacturers and work with engine suppliers and OEMs to integrate natural gas systems into trucks. Ultimately, these trucks are purchased by the third segment, fleet operators, for use in the field. Forces for Change Forces Against Change Total Fuel Cost per Mile Long-term Oil/Diesel Prices Price Stability (price at pump insensitive to spot price) Energy Independence RecentMajor Engine and OEM Vehicle ProductAnnouncements 80% Engine PartCommonality with Diesel No Aftertreatment Infrastructure Investments & Announcements (Clean Energy,Shell, Trillium) Sustainability Commitment(& Green Marketing) Environmental Combustion Advantage Energy Content Engine Efficiency LNG/CNG Tank Cost Range Few Product Offerings LNG Handling (Cryogenic) Training (Drivers, Techs, etc.) Major Investment to Bring Repair Facilities up to Codes Little Refueling Infrastructure Uncertain Truck Residual Value Environmental: Extraction (fracking) Concerns NaturalGasBecomesaFuelofChoiceforClass8TrucksintheU.S. COWEN.COM44 COWEN EQUITY RESEARCH Nikola Corporation June 17, 2020
  • 45.
    Figure 46 –Natural Gas Transportation Industry Participants Source: Westport Fuel Systems Exploring Types of Natural Gas Engines Natural gas engines are very similar to diesel engines, sharing around 80% of the same components. The block, crank shaft, main bearing, piston rods, and exhaust gas recirculation system (EGR) are all the same. While overall horsepower and torque is slightly lower relative to the output from diesel engines, natural gas engines continue to improve. Due to the physical properties of natural gas, it cannot be ignited through compression, which is how diesel engines operate. Natural gas engines use spark plugs to ignite the fuel and employ a stoichiometric exhaust gas recirculation (SEGR) system to control combustion. SEGR helps to improve fuel economy and power density as well as lower emissions. The introduction of 12-liter natural gas engines has greatly expanded natural gas trucking applications. These engines can now output between 320 and 400 horsepower and produce 1,150 to 1,450 lb/ft of torque. There are also two types of natural gas compression ignited systems, which use a combination of both diesel and natural gas. The first is a substitution system, which replaces a portion of diesel fuel with natural gas. Between 0% and 65% of the fuel stream can be replaced, which means that these systems can operate solely on diesel if necessary. The second engine system is high-pressure direct inject (HDPI), which uses a small amount of diesel as a pilot spray to cause ignition. This can be done with as little as 10% diesel fuel in the total fuel mix. The problem with this technology is that since it requires a diesel fuel pilot spray, it also needs a separate diesel fuel tank and an after- treatment system. COWEN.COM 45 COWEN EQUITY RESEARCH Nikola Corporation June 17, 2020
  • 46.
    Cummins Near-Zero EnginePicking Up Momentum The Cummins Near-Zero natural gas engine, leveraging Westport technology as part of their CWI joint venture appears to be gaining momentum as OEMs qualify the engine. Fleets such as San Diego Metropolitan Transit System and the City of Los Angeles are continuing with their aggressive transit bus deployments, and we see an uptick in Class 8 demand, especially for drayage trucks at the ports in California. Cummins delivered 7,395 trucks in 2018, and we believe 8,000-10,000 truck deliveries likely occurred in 2019, based on our conversations with industry participants. Cummins Westport unveiled their rebranded “Near Zero” natural gas engines at the ACT show in 2017, challenging the low-emissions leadership of the battery electric industry. The 6.7, 8.9 and 11.9L engines that the JV offers are now fully launched and feature all of the latest refinements of the Near Zero design. The low NOx engines will be rebranded B6.7N, the 8.9 liter will be L9N, and the 12 liter will be the ISX12N. The 9- and 12-liter offerings will be certified to 0.02 grams of NOx per brake-horsepower, which is 90% below the current CARB standard, but more importantly, competitive with battery electric vehicles. Exploring Fuel Cell Technology and Hydrogen Generation and Refueling Hydrogen technology represents a promising, multifaceted pathway that could offer many industries ranging from power generation to transportation a new strategy for navigating the transition to net zero emissions. Meeting climate targets will require a clean molecule. About 80% of the energy consumed in the world is provided in the form of a molecule, namely oil, gas and coal. The remaining 20% of energy is in the form of electricity, which is anticipated to grow as more facets of the global economy are electrified in a decarbonized, digital and distributed fashion. Some parts of the economy can be easily electrified and some are a severe challenge. Some parts of society require the physical properties of a molecule to be electrified such as high energy density and the capacity to store energy for long periods of time. Industries such as heavy duty trucking, shipping and aviation need the ability to perform a chemical reaction. Other industries such as cement, aluminum, glass, chemical production, fertilizers, steel and glass are extremely energy intensive and are striving to decarbonize. We see hydrogen meeting the needs of many of these industries given it can be used as fuel, heat or a feedstock and in addition it can be versatile, storable, clean and reactive. In addition, now that electricity costs from wind and solar have fallen so much, hydrogen can be produced cost effectively with low or zero emissions. The hydrogen industry is a big business today, with over 100mn metric tons produced annually and revenue in the industry north of $130 billion according to figures from Bloomberg new Energy Finance. About 99% of the world’s hydrogen is made from fossil fuels. The IEA estimates that about 2.2% of global emissions stem from hydrogen and the industry consumes about 6% of the world’s natural gas and 2% of the world’s coal. COWEN.COM46 COWEN EQUITY RESEARCH Nikola Corporation June 17, 2020
  • 47.
    Hydrogen Has SevenRoles to Play in the Decarbonized Energy Transition We see hydrogen as a versatile energy carrier and positioned to benefit from low cost renewable power to create “green hydrogen” which is carbon free. This has been an aspiration of the industry for over a decade; however, was never cost effective given the high cost of electricity. Now that renewable power costs have fallen and electrolyzer technology has scaled to the MW scale, we see the 2020s being the decade of the hydrogen economy. Figure 47 – Wind and Solar Levelized Cost of Energy Trends Source: NEL Investor Presentation We see hydrogen playing seven roles in the broader decades long energy transition that is playing out. Hydrogen has a role in both power generation and transportation. 1) Within the broader renewable energy ecosystem, we see hydrogen serving as a means of long-term energy storage, in particular taking advantage of excess renewable power generated from wind and solar and storing hydrogen. 2) Hydrogen can serve as the conduit to enable large scale renewable electricity into the grid. 3) In addition, hydrogen can be stored to transfer energy between regions or even between seasons to increased energy resilience. 4) Hydrogen can decarbonize transportation, which today is reliant on fossil fuels and generates over 20% of the world’s carbon dioxide. 5) Hydrogen has a role to play in heat, namely for cogeneration units to generate heat and power for industrial uses. 6) Hydrogen can also take advantage of existing natural gas networks and leverage this infrastructure to provide cost effective heat and power. $135 $124 $71 $72 $70 $59 $55 $47 $45 $42 $41 2009 2010 2011 2012 2013 2014 2015 2016 2017 2018 2019 Global Avg Wind (Onshore) LCOE (Unsubsidized Levelized Cost of Energy ($/MWh) $359 $248 $157 $125 $98 $79 $64 $55 $50 $43 $40 2009 2010 2011 2012 2013 2014 2015 2016 2017 2018 2019 Global Avg Solar PV LCOE (Unsubsidized Levelized Cost of Energy ($/MWh) Hydrogen plays seven roles in the decarbonized energy transition. COWEN.COM 47 COWEN EQUITY RESEARCH Nikola Corporation June 17, 2020
  • 48.
    7) Currently, mosthydrogen is produced via steam methane reformation leveraging natural gas, which is carbon intensive. Over time, we expect chemical ammonia, fertilizer and refineries to migrate to cleaner uses of hydrogen. Hydrogen can be used to produce cleaner chemicals and steel, leveraging captured carbon to produce iron ore. Figure 48 – Hydrogen Can Play Seven Key Roles in the Decarbonized Energy Transition Source: Cowen and Company The excitement over hydrogen relates to its potential as a pollution-free energy source, which, if produced from renewable means, would not release any carbon dioxide emissions and would slow the pace of global warming. In addition, the fact that hydrogen is the most abundant element on earth (though rarely found in its pure form) and can be produced from the electrolysis of water makes it an ideal fuel choice of the future. Most investors probably have painful memories of the tech bubble, when shares of fuel cell companies were bid up under the belief that automotive adoption of fuel cells was just around the corner. The investing world believed that in a matter of a few years, fuel cells would displace the internal combustion engine, the incumbent engine technology for nearly a century. As investors soon learned, fuel cell companies became notorious for over promising and under delivering on the capabilities of their products, and the commercialization of automotive fuel cells kept being pushed out. Enable large-scale renewables integration and power generation Distribute energy across sectors and regions Act as a buffer to increase system resilience Help decarbonize transportation Help decarbonize industrial energy use Help decarbonize building heat and power Serve as renewable feedstock Enable the renewable-energy System Decarbonize End Uses COWEN.COM48 COWEN EQUITY RESEARCH Nikola Corporation June 17, 2020
  • 49.
    From the beginning,the fuel cell manufacturers were using flawed logic. They were attempting to run before they could crawl, in our view. The automotive market is one of the most difficult and demanding markets, given the extreme operating conditions and need for high reliability. In the laboratory, the fuel cell companies believed that they could meet the challenges, but in reality, they were far from meeting the performance, price, or reliability standards of the automotive manufacturers. As a result, fuel cell manufacturers de-emphasized the automotive market and searched for ways to monetize their research and development investments. Now the industry’s focus is on forklifts, backup power, residential electricity and heat cogeneration, and larger systems for commercial and industrial use. While many challenges are still ahead of fuel cell manufacturers, we believe that market adoption for some applications is around the corner. Whether the fuel cell manufacturers can make money manufacturing their products is a different question, but we believe demand is growing. With any new technology, there are many hurdles to market adoption and challenges that need to be overcome. We believe price is still the limiting factor for fuel cells, as the cost per kilowatt is higher than incumbent technologies, especially batteries in many use cases. Despite a higher upfront capital cost, fuel cells can offer a lower total cost of ownership in specific applications, such as heavy duty trucking, backup/distributed power and forklifts. The immature nature of the industry has hindered the ability to develop a track record. The manufacturers claim that their products have longer run times and higher reliability than current technologies, but the products have not had the time to prove themselves in the field. Finally, the migration to fuel cell technology requires a drastic transformation in fueling infrastructure, providing fuel cell purchasers with cost competitive and reliable fuel deliveries (or onsite hydrogen generation is also an option). Nascent fuel cell market was unable to meet demands of a mature automotive market. COWEN.COM 49 COWEN EQUITY RESEARCH Nikola Corporation June 17, 2020
  • 50.
    Figure 49 –Evolution of the Hydrogen Economy Source: Greentech Media In the following pages, we explore the different end markets that are potentially on the cusp of fuel cell adoption. We also discuss the challenges, cost competitiveness, and likelihood of significant market adoption. Finally, we review the technology and discuss the different types of fuel cells. Fuel cell technology is advancing but remains a higher cost alternative to other clean energy alternatives. As the technology improves, it has been incorporated into trucks and vehicles, stationary power units, as well as forklifts. Longer term, we see an uptick in heavy duty/high power applications in marine and trains/trams. However, any meaningful success has largely come as a direct result of significant government incentive programs to date. We are encouraged by the recent developments made in fuel cell technology, most notably with the first commercially available fuel cell cars hitting the road in the last few years, but significant progress must be made before mass adoption takes place. In addition, it still remains to be seen which companies can demonstrate a path to sustained profitable growth. COWEN.COM50 COWEN EQUITY RESEARCH Nikola Corporation June 17, 2020
  • 51.
    There are numeroustypes of fuel cells which we highlight below. Most of the publicly traded companies produce PEM fuel cells, described below. Bloom Energy specializes in solid oxide fuel cells that have high efficiencies. FuelCell Energy is one of the few producers of molten carbonate fuel cells in the world. Figure 50 - Comparison of Fuel Cell Technologies Source: Cowen and Company, U.S. Department of Energy Fuel Cell Type Common Electrolyte Operating Temp. Typical Stack Size Applications Advantages Challenges Proton Exchange Membrane (PEM) Perfluorosulfonic Acid < 1200 C < 1 kW – 100 kW • Backup power • Portable power • Distributed generation • Transportation • Specialty vehicles • Solid state electrolyte reduces corrosion & electrolyte managementproblems • Low temperature • Quick start-up and load following • Expensivecatalysts • Sensitive to fuel impurities Alkaline (AFC) Aqueous potassium soaked in a porous matrix or alkaline polymer membrane < 1000 C 1-100 kW • Military • Space • Backup power • Transportation • Wider range of stable materials allows lower cost components • Low temperatures • Quick start-up • Sensitive to CO2 in fuel and air • Electrolyte management (Aqueous) • Electrolyte conductivity (polymer) Phosphoric Acid (PAFC) Phosphoricacid soaked in a porous matrix or imbibed in a polymer membrane 150-2000 C 5-400 kW • Distributed generation • Suitable for CHP • Increased toleranceto fuel impurities • Expensivecatalyst • Long start-up time • Sulfur sensitivity Molten Carbonate (MCFC) Molten lithium, sodium,or potassium carbonates soaked in a porous matrix 600-7000 C 300 kW – 3 MW, 300 kW module • Electric utility • Distributed generation • High efficiency • Fuel flexibility • Suitable for CHP • Hybrid/gas turbine engine • High temperature corrosion and breakdown ofcell components • Long start-up time • Low power density Solid Oxide (SOFC) Yttria stabilized zirconia 500-10000 C 1kW – 2 MW • Auxiliarypower • Electric power • Distributed generation • High efficiency • Fuel flexibility • Solid electrolyte • Suitable for CHP • High temperature corrosion and breakdown ofcell components • Long start-up time • Limited number of shutfdowns COWEN.COM 51 COWEN EQUITY RESEARCH Nikola Corporation June 17, 2020
  • 52.
    What Is aFuel Cell? A fuel cell is a device that produces electricity by way of an electrochemical reaction. These units combine fuels with ambient oxygen, producing electricity, water, and heat. This is a clean electrical generation technology that emits significantly lower levels of greenhouse gases that have been linked to global warming causation. The lower levels of greenhouse gas emittance stems from the comparatively high efficiencies achieved by fuel cell systems, which have reached levels north of 80% when the fuel cell’s waste heat is captured- compared to ~33% for combustion engines. Different fuel cells, based on their input fuels, have different characteristics, making each distinct fuel cell better suited for different generation applications; transport, portable, or stationary. How Does a Fuel Cell Work? Fuel cells are electrochemical devices that combine hydrocarbon fuel with oxygen from the air to produce electricity and heat. The process by which electricity is created is electrochemical, not combustion based, making fuel cells the cleanest and most efficient form of distributed power generation available. Similar to a battery, fuel cell technology incorporates an anode and a cathode with an electrolyte in between. Figure 51 – Fuel Cell Process Simplification Source: Department of Energy Fuel cell technology follows a relatively similar process regardless of the injected fuel. The structure is somewhat similar to that of a battery, which generates energy using its internally stored chemicals. The battery dies once theses stored chemicals are depleted. Fuel cells are different in that they use an external source of chemical energy, a At the Anode, a platinum catalyst causes the Hydrogen to split into positive Hydrogen ions (protons) & negatively charged electrons At the Cathode, the electrons and positively charged hydrogen ions combine with Oxygen to form Water, which flows out of the cell 3 …while Oxygen from the air is channeled to the cathode on the other side of the cell 6 Hydrogen fuel is channeled through field flow plates to the Anode on one side of the fuel cell… …and the negatively charged electrons are forced to travel along an external circuit to the Cathode, creating an electrical current The Polymer Electrolyte Membrane (PEM) allows only the positively charged ions to pass through to the cathode... 4 5 21 Energy from a fuel cell is produced through an electrochemical reaction and not combustion. COWEN.COM52 COWEN EQUITY RESEARCH Nikola Corporation June 17, 2020
  • 53.
    hydrogen rich fuel,which can be continually injected into the cell, allowing it to continuously generate electricity until its components fail. Figure 52 – Basic Structure of a PEM Fuel Cell Source: Fuel Cell Markets A fuel cell’s structure revolves chiefly on an anode, cathode, and an electrolyte barrier separating the two. Initially, hydrogen rich gas is injected into a flow chamber on the anode side of the cell, while oxygen is injected into the flow chamber on the cathode side of the cell. The natural relationship between hydrogen (H2) and oxygen (O2) – the natural propensity for the molecules to combine to form water (H2O) is what drives the electro chemical reaction. These gases are not able to immediately combine within the cell due to the electrolyte barrier that exists between the cathode and the anode. However, if the hydrogen molecule is split into protons and electrons, the positively charge protons will be able pass through the electrolyte barrier, leaving the negatively charged electrons behind. The catalyst component of the fuel cell, inserted immediately next to the anode, reacts with hydrogen molecule as they are drawn to the cathode, encouraging it to split. At this point, the molecule has broken down into positively charged protons, and negatively charged electrons. The protons travel through electrolyte to reach to the cathode chamber. Because, the negatively charged electrons are unable to permeate the electrolyte barrier, they are forced to find another way to the cathode. Note that many fuel cell companies are aiming to use less catalyst as this is one of the more expensive pieces of the bill of materials. Fuel cells require an electrocatalyst for the reactions to proceed quickly at the low temperatures at which they operate. And the very best catalyst is platinum. Of course, platinum is a precious metal that is expensive. So if you use a lot of platinum, you can make a fuel cell work extremely well, but it will be very expensive. In recent years companies like 3M, Ballard Power, Honda, and Toyota COWEN.COM 53 COWEN EQUITY RESEARCH Nikola Corporation June 17, 2020
  • 54.
    have discovered waysof dramatically reducing the amount of platinum that is used while increasing the performance of the fuel cell. Fuel cells use a wire to link the anode and cathode, which circumvents the electrolyte barrier and creates a path of least resistance for the electron to follow. The negatively charged hydrogen electrons use this pathway to reach the cathode side of the cell. Once the hydrogen electrons reach the cathode chamber, they recombine with the hydrogen protons that made it through the electrolyte barrier, creating hydrogen which then immediately combines with the oxygen to make water. The wire on which the electrons travel to reach to the cathode side of the fuel cell creates a constant electrical current. Importantly, the primary byproducts that this system creates are heat and the water, making fuel cells an attractive technology for power generation. It is important to mention that there are trace amounts of NOx, SOx, and some other particulates, but are diminutive when compared to traditional forms of energy generation. It is key to take note that an individual fuel cell is not the entirety of the power generation component. Fuel cell companies sell their technologies in what are called fuel cell stacks, or simply, “stacks”. These stacks consist of multiple fuel cells side by side, akin to a loaf of bread, combining to create a single unit that delivers a substantial amount of power. Fuel Cell Variations The fundamental characteristics of fuel cells allow for various fuel cell technologies. While the central design of a fuel cell does not change, different structural materials and gaseous inputs can dramatically change the technological and economical profile of a unit- and therefore, that unit’s suitability for transportation, portable, or stationary power generation. The largest variables impacting the profiles of these units are the input gas, and the nobility of the metal used as the catalyst. Figure 53 – Megawatts Shipped by Fuel Cell Type Source: Company reports, E4Tech, Fuel Cell Today, Cowen and Company estimates - 200 400 600 800 1,000 1,200 2009 2010 2011 2012 2013 2014 2015 2016 2017 2018 2019 MWs PEMFC DMFC PAFC SOFC MCFC AFC COWEN.COM54 COWEN EQUITY RESEARCH Nikola Corporation June 17, 2020
  • 55.
    Polymer electrolyte membranefuel cells (“PEMFCs”) are typically fueled with pure hydrogen and offer high power density, while employing relatively low weight and volume. These FCs, also referred to as proton exchange membrane FCs, operate at a relatively low temperature (80℃). Low operating temperatures allow FCs to start up faster, making them more ideal for transportation needs, and it reduces the wear and tear on the systems internal components, increasing system life. However, the lower operating temperatures drive up the cost of the FC. At such temperatures, the system catalyst must be a high quality, noble metal or the electrons and protons of the hydrogen molecule will fail to split. This high-quality metal is usually platinum, and costs significantly more than replacement metals that perform the needed catalytic functions in higher temperature FCs. Secondly, platinum is easily susceptible to poisoning from carbon monoxide, which can drastically reduce the efficiency of the system to the point where it is no longer operable. In order to deracinate this risk an extra reactor must be incorporated into the system, subsequently increasing costs. In order to combat a number of the issues that drive up costs within PEMFCs, scientists have developed, what are referred to as, high temperature PEM fuel cells that have an operating temperature ranging from 150℃ to 200℃. At these temperatures, issues such as susceptibility to carbon monoxide poisoning subside which allows for fewer system components, reducing the cost of the fuel cell. As seen in figure 95, PEMFCs are far and away the leading technology for fuel cell shipments. Figure 54 – PEM Fuel Cell Structure Source: Department of Energy COWEN.COM 55 COWEN EQUITY RESEARCH Nikola Corporation June 17, 2020
  • 56.
    Molten carbonate fuelcells (“MCFCs”) are typically used for large, stationary power generation. The MCFCs use an electrolyte composed of a molten carbonate salt mixture and operates at a relatively high temperature, 650℃. The high operating temperatures of these fuel cells serve as both a benefit and a negative for the systems economics. At such high temperatures, the natural reaction kinetics are significantly improved, meaning that a noble metal catalyst is not required to serve as a “booster” of sorts, rather, various cheaper, non-precious metals can be used. These non-precious metals are also not susceptible to carbon monoxide poisoning, meaning there is no need to install an additional reactor. Finally, because of the high temperatures, the system produces a substantial amount of waste heat, which, when captured, can boost the overall fuel efficiencies to well over 80%. MCFCs also suffer because of their high temperatures, chiefly because of the corrosive impact it has on the systems components. Currently the life of an MCFC is roughly equivalent to five years. Phosphoric acid fuel cells were the first FCs to be sold commercially. PAFCs are generally used for stationary power generation but have been incorporated into larger transportation vehicles such as buses. In situations where cogeneration can be captured, these fuel cells can yield efficiency levels greater than 80%, however they offer only slight efficiency improvements over combustion generation as a standalone electric generator. PAFCs require a platinum catalyst and are less powerful than other FCs when compared on a weight/volume basis. We do note that while the megawatts are growing for fuel cells, the unit shipments are generally flattish over the past several years. This is solely due to increases in energy density per unit, which helps drive down costs relative to incumbent power solutions. Figure 55 – Units Shipped by Fuel Cell Type Source: Company reports, E4Tech, Fuel Cell Today, Cowen and Company estimates - 10 20 30 40 50 60 70 80 2009 2010 2011 2012 2013 2014 2015 2016 2017 2018 2019 in thousands PEMFC DMFC PAFC SOFC MCFC AFC COWEN.COM56 COWEN EQUITY RESEARCH Nikola Corporation June 17, 2020
  • 57.
    Solid oxide fuelcells are used for stationary power generation and the market is led by Bloom Energy. These fuel cells reach temperatures of 1000℃, and can yield efficiencies of over 60% without co-generation, making them extremely efficient. If waste heat produced by the system is also harnessed, system efficiencies can achieve levels above 80%. Like other high-temp FCs, SOFCs benefit from not requiring a precious metal catalyst. Because of the system’s extreme operating temperatures, input fuels actually reform within the fuel cell which eliminates the need for external reforming and increases the amount of hydrocarbon fuels that can be used in the system. What is also unique about SOFCs, is due to their natural resistance to otherwise poisonous levels of Sulphur, these units can also be fueled by coal gas. SOFCs carry most, if not all of the benefits mentioned prior about high temperature FCs. However, because of these extreme heats, SOFCs require additional safety precautions, such as heat shielding components to protect personnel. These systems also suffer from durability concerns as the extreme temperatures substantially increase the rate of wear on FC components. Finally, alkaline fuel cells (“AFCs”) were one of the earliest developed fuel cell technologies. This technology is famous for its incorporation on NASAs space shuttles, where it was used to generate power and water for the astronauts onboard. AFCs operate at a relatively low temperature, yet do not require a precious metal to be used as its catalyst. The AFCs biggest downside is its heightened sensitivity to carbon dioxide poisoning, which can dramatically impact the cells performance. This technology has not been used recently. Figure 56 - Comparison of Fuel Cell Technologies Source: Cowen and Company Fuel Cell Systems Beyond the fuel technology choices above, each cell is part of a complete system which can be difficult to integrate and control performance and lifetime characteristics. The design of fuel cell systems is complex and varies according to cell type and application. Generally, all fuel cell systems are composed of a stack (discussed above), a fuel processor, a current converter, and a heat recovery system. In addition, most systems also include subsystems to control cell humidity, temperature, gas pressure, and wastewater. Fuel Cell Type SOFC PAFC MCFC PEM-FC Electrical Efficiency 65% 42% 47%-60% 30% Modularity Yes No Yes Yes Data Center Reliability Yes No Yes No Readiness Shipping Shipping Shipping Shipping Fuel Cell Stack Capability Cycle Without Purge Gas Yes No No No High Utilization Fraction Yes No No No Automated Manufacturing Yes No No Possible System Architecture DC-Bus Centric Yes No No No Rapid Installation Yes No No Small scale, portable COWEN.COM 57 COWEN EQUITY RESEARCH Nikola Corporation June 17, 2020
  • 58.
    Fuel Cell Stack- The cell is the functional unit of the entire system, but does not produce enough useful power in isolation, so it is electrically combined in series with other cells to form the stack. The amount of direct current power generated by the stack is dependent on cell type, size, operating temperature, and pressure. Fuel Processor - The fuel processor converts fuel into a useable form by the fuel cell through a reforming process. Hydrocarbon fuels are separated into a mixture of hydrogen and carbon compounds, which are then sent to another reactor to remove impurities, such as carbon monoxide. If these impurities reach the cell, they are said to “poison” the catalyst by binding to it, reducing the efficiency and lifetime of the system. The purified hydrogen is then fed to the cell for processing. Systems that are being fed pure hydrogen and high temperature cells (such as molten carbonate and solid oxide fuel cells) usually do not need a fuel processor, but some sort of filtration system is usually still needed for impurity removal. Current Inverters and Conditioners - Current inverters and conditioners convert the electrical output of the fuel cell stack and make it useable for the required application. The fuel cell produces direct current (DC), so if the intended application runs on alternating current (AC), as in homes and offices, the current will have to be converted by an inverter. Power conditioning applies to both types of current and refers to the control of current flow, voltage, frequency, and other characteristics demanded by the application. Conditioning reduces system efficiency by ~2-6%. Heat Recovery System - The heat recovery system is used in cogeneration applications to produce steam or hot water or converted to electricity via a gas turbine. This helps to significantly increase the overall electrical efficiency of the system Fuel Cell Technology Challenges The fuel cell industry faces many challenges before full scale commercialization of the technology takes place. In our view, cost, durability, system size, and heat recovery are all areas that need further development and improvement to make fuel cells a commercial reality. Of course, the hurdles are different for each application and electrolyte technology, but generally, these issues need to be addressed across the board. Cost – To encourage adoption of fuel cells, the total cost of ownership must be lower than that of the incumbent technology and the upfront cost should not be considerably higher. Though total cost of ownership is the appropriate way to examine competing technologies, initial costs are often the deciding factor when tight budgets need to be met. In the automotive sector, internal combustion engines currently cost $25-35/kW, while fuel cell systems cost ~$50/kW. The primary way to drive the cost down is to continue reducing the usage of precious metal catalysts, such as platinum, in the fuel cell stack. The price points for stationary systems are considerably higher, in the range of $400-750/kW. In addition, the cost of hydrogen generation, storage, and distribution needs to be reduced to the equivalent cost of gasoline for automotive applications. Durability – Due to short operating history, the reliability and durability track record of most fuel cell products remains unproven. For stationary applications, fuel cells must have more than 40,000 hours of reliable operations in a temperature range of -35°C to 40°C. Automotive applications require a lifetime of at least 5,000 hours (equivalent to 150,000 miles), with the capability of rapid start in freezing temperatures, a hurdle which is proving quite challenging for fuel cell manufacturers. COWEN.COM58 COWEN EQUITY RESEARCH Nikola Corporation June 17, 2020
  • 59.
    System Size –The current size and weight of fuel cell systems needs to be reduced, especially if automotive use is ever to gain wide adoption. This refers not only to the stack, but also to the major subsystems and parts that make up the balance of system. For automotive use, fuel storage presents a special problem due to the physical properties of hydrogen. Hydrogen’s light weight means that it takes up a large amount of space in gaseous form, resulting in larger storage tanks. Compressing and liquefying hydrogen are very energy intensive compared to natural gas. In addition, hydrogen is only in liquid form at cryogenic temperatures, making storage difficult for automotive applications. Heat Recovery Systems – The electrical efficiency of most fuel cell systems is not much higher than the combustion of fossil fuels, but the cogeneration of heat in high temperature fuel cells allows for overall efficiency of up to 80%. Low temperature fuel cells, such as PEMs, have limited uses for thermal byproduct, necessitating the development of more effective heat recovery systems. Transportation Opportunities for Fuel Cells Fuel efficiency continues to be a major focus of auto OEMs despite the recent drop in fuel pricing. We see multiple technologies emerging, ranging from engine downsizing leveraging turbo chargers, start-stop systems, hybrids, plug-in hybrids and full-EVs. In general, we see a broader shift toward the electrified vehicle (hybrid and EV) driven by substantial increases in fuel economy, which will enable OEMs to hit their regulatory requirements in various end markets. Figure 57 – Market for Fuel Cell Vehicles Source: Ballard Power Investor Presentation – September 2018 OEMs continue to say regulatory mandates in the European Union, China, United States, Mexico, Japan, South Korea, India, and Brazil are the driver for “greener” engines from a fuel economy and CO2 perspective. Globally, about 28% of greenhouse gas emissions emanate from the transportation sector. Governments continue to focus on driving GHGs down and thus have regulations in place for the auto industry. To that end, the price of fuel is not impacting the direction the industry is headed in terms of fuel efficiency, new technology being added to the vehicle, or emission reduction initiatives. OEMs stress regulatory mandates already in place across the globe are the catalyst for “greener” engines from a fuel economy and CO2 perspective. COWEN.COM 59 COWEN EQUITY RESEARCH Nikola Corporation June 17, 2020
  • 60.
    Figure 58 –Greenhouse Gas Emissions (GHG) by Economic Sector Note: Data last aggregated and reported in 2019, and therefore reflect 2018 emissions., Total Emissions in 2018 = 6,677 Million Metric Tons of CO2 equivalent. Source: Cowen and Company, EPA Exploring Various Fuel Cell Applications in Greater Detail 2019 was a pivotal year for the fuel cell industry. Shipments passed 1.1 GW, the first- time industry broke the 1 GW barrier. There was a bevy of activity with strategic partnerships and acquisitions made to move the industry forward. Materials handling, buses and stationary power applications are driving the market today; however, trucking, marine and trains all show promise toward the middle of the decade. We explore these markets and others such as marine and trains in greater detail below. Transportation solutions for heavy duty and commercial vehicles, buses and potentially light duty vehicles have held a lot of promise in their use of fuel cells for the past two decades. We see the most promise in heavy duty applications and buses and are more cautious on passenger cars. At the start of 2020, Bloomberg New Energy Finance estimates there were about 17,000 passenger cars utilizing fuel cells on the road, 4,250 fuel cell buses and about 1,000 commercial vehicles using fuel cells. Transportation 28.2% Electricity 26.9% Industry 22.0% Commercial & Residential 12.3% Agriculture 10.6% COWEN.COM60 COWEN EQUITY RESEARCH Nikola Corporation June 17, 2020
  • 61.
    Figure 59 -Estimated number of FCVs on the road globally at the beginning of 2020 Figure 60 - Cumulative number of FCVs sold in China by the end of 2019 Source: Bloomberg New Energy Finance Note: CV stands for commercial vehicle. PV stands for passenger vehicle. Source: Bloomberg New Energy Finance, China Association of Automobile Manufacturers. Note: CV stands for commercial vehicle. PV stands for passenger vehicle. Bloomberg New Energy Finance is positive on the long-term future of fuel cell transportation solutions assuming governments provide adequate support to scale the market over the coming two decades. In the researcher’s long-term outlook, they envision a scenario where governments around the world set zero tailpipe emission targets for road transport by 2050 and chose to make hydrogen a significant part of that vision. In that scenario, BNEF estimates FCVs could capture up to 25% of light duty vehicle fleets, 30% of bus fleets, 50% of medium duty commercial vehicle fleets and 75% of the heavy duty commercial vehicle fleet. Heavy Duty Trucks and Commercial Vehicles We see the heavy duty truck and commercial vehicle markets as the next potential end market to adopt hydrogen fuel cell vehicles since fleet operators looking to transition from fossil fuels see the benefits of hydrogen fuel cell electric vehicles compared to battery electric vehicles in certain use cases. While infrastructure remains a challenge, the similar experience to diesel trucks for hydrogen FCEVs, with quick refuel times, compared to battery electric vehicles (who require grid upgrades), make hydrogen fuel cells a much more attractive option for long-haul transport. We also see an opportunity for shorter and medium distance transportation and delivery uses in cases where hydrogen infrastructure built out for Amazon, Walmart, FedEx and other material handling customers can be utilized for fleets. 17,000 4,250 22,250 0 5,000 10,000 15,000 20,000 Number ofFCVs CV Bus PV 4,185 937 5,176 0 1,000 2,000 3,000 4,000 5,000 Number ofFCVs PV CV Bus COWEN.COM 61 COWEN EQUITY RESEARCH Nikola Corporation June 17, 2020
  • 62.
    Plug Power hasprovided fuel cell airport ground support equipment at FedEx’s Memphis hub, where the 13,000 gas and diesel tuggers had traditionally been used, resulted in air quality issues. Plug and its partner, Workhorse, are looking to expand their fuel cell powered electric delivery truck project from the first trial vehicle to 20. The vehicle features an 80 kWh, which alone would limit the vehicle’s range to about 60 miles. FedEx will be able to utilize the fuel cell to expand the range of the vehicles relative to a battery only vehicle to approximately 150 miles, which is about the daily average for a typical delivery truck. To meet the higher range needs, the Plug Power/Workhorse delivery vehicle utilizes two 10kW fuel cell systems and 6 hydrogen tanks containing 11.6kg that charges the battery throughout the day to enable ~156kWh of capacity. Figure 61 - Progen Modular Architecture Source: As Presented by Plug Power at the Battery Show 2018 The Class 8 market has largely shifted to natural gas in areas with CO2 restrictions, such as California, and we see the hybrid fuel cell/battery solution as an intriguing development. Ballard has tested units with Kenworth for drayage applications and we see new entrants in the Class 8 market gaining steam in electrification. Note Cummins is also active in the fuel cell market following their acquisition of Hydrogenics, so the incumbent players are not standing still. Daimler and Volvo also formed a joint venture in 2020 to aim to have a fuel cell truck on the road in the 2024/2025 timeframe. Westport Fuel Systems has also indicated that the company's natural gas fuel injection technology and compression systems are easily transferrable to hydrogen fuel as well. Nikola has showcased its class 8 working Nikola Two prototypes and introduced its Nikola Tre concept geared toward the North American and European markets respectively. The vehicles will come in both a fuel cell electric variant targeting long range transport, and a battery electric variant targeting shorter routes. COWEN.COM62 COWEN EQUITY RESEARCH Nikola Corporation June 17, 2020
  • 63.
    Figure 62 -Nikola Two Fuel Cell Powered Truck Source: Photographed by Cowen and Company at Nikola Word 2019 Nikola and Nel, its hydrogen infrastructure partner, are building out hydrogen refueling stations utilizing electrolyzers. Each station will be sited at or near major customer depots and along customer routes to ensure that utilization is high and customer range- anxiety is low. By ensuring that new fueling locations are added directly in advance of customer vehicle shipments, the partners believe they can successfully solve the chicken and egg problem that has long inhibited greater fuel cell electric vehicle adoption. Hydrogen will be produced on-site via Nel electrolysis technology. Nikola and Nel are targeting 100% renewable energy to produce hydrogen. Nikola's power assumption of ~$0.35 per kWh is the key to the company's energy cost projections (achievable with today's low cost of solar and wind power under a power purchase agreement as well as nuclear in some areas). We believe 80-85% of the cost of producing hydrogen through electrolyzers is the electricity cost. In addition to fueling the needs from Nikola trucks, the company noted that it plans to offer standardized charging for other heavy-duty CVs and meet the light duty vehicle charging standards used by Toyota and others who have produced FCEVs in small scale production in California. Given the fixed energy costs provided by PPAs, the company plans to charge ~$6 per kg of fuel, which is ~50% of what early adopters of FCEVs in California are currently paying. Given infrastructure remains a challenge for the entire fuel cell group under our coverage, we see this large- scale build out as a potential catalyst for broader adoption and activity for the entire space. We see the increased hydrogen availability at lower costs a long-term positive to other fuel cell application providers. We see dedicated route trucks as the most likely candidate for fuel cell trucking use. These types of trucks make up about 25% of the market of 1.8 million trucks on the road in the U.S. today. Dedicated routes are primarily comprised of private fleets and dedicated operations of large for-hire carriers. For initial rollout of FCEV, we see Nikola, Cummins, and others targeting the largest private and dedicated fleets with either nationwide or significant regional distribution networks. Focus on dedicated routes allows for targeted, capital-efficient deployment of hydrogen stations COWEN.COM 63 COWEN EQUITY RESEARCH Nikola Corporation June 17, 2020
  • 64.
    Figure 63 -1,800,000 class 8 semi-trucks on the road daily (1) Source: Cowen and Company (1) Includes both short-haul and long-haul heavy duty truck markets (2) Including vehicle, fuel, and service & maintenance; based on proprietary research from ACT Research Electrolyzers Are the Key to Green Hydrogen Generation To Drive Down CO2 For Numerous Fuel Cell Applications Hydrogen is the most abundant element on earth, accounting for 75% of mass and 90% of atoms, but is rarely found free in nature. Instead, it forms compounds with all other elements (except inert gases), meaning that none of the earth’s hydrogen is in a useable form for fuel cells or other energy applications. However, hydrogen can be produced by breaking the chemical bonds in water, hydrocarbon fuels, such as natural gas, oil, and coal, and other compounds. The hype about hydrogen relates to its potential as a pollution-free energy source, which, coupled with its abundance in nature, makes it a very appealing fuel of the future. When hydrocarbon fuels are burned, they produce carbon dioxide (CO2), which is considered to be the primary cause of global warming, as well as nitrogen oxides (NOX) and sulfur oxides (SOX), which form acid rain. In contrast, when hydrogen is electrochemically combined with oxygen, the only products are pure water and heat. While this is true in theory, practical applications of hydrogen as a fuel source yields very different result. There are many different applications for hydrogen overtime. We do not explore them all in this report; however, the analysis below from The Hydrogen Council, an industry consortium, highlights the growth opportunity across a diverse set of end markets. +25% 450,000 trucks run on dedicated routes 75% 1,350,000 trucks COWEN.COM64 COWEN EQUITY RESEARCH Nikola Corporation June 17, 2020
  • 65.
    Figure 64 –Global Energy Demand Supplied with Hydrogen Source: Hydrogen Council Presentation Most of today’s anthropogenic hydrogen, both internationally and in the U.S., is produced by steam methane reforming of natural gas. The steam methane reforming process consists of two process steps. In the first step, the major component of natural gas, methane (CH4), reacts with steam to form hydrogen and carbon monoxide. In the second step, water gas shift, carbon monoxide is reacted with steam to produce additional hydrogen and carbon dioxide. Pressure swing adsorption (PSA) technology is needed for hydrogen purification in the steam-methane reforming (SMR) process, to get high purity hydrogen suitable for fueling fuel cell electric vehicles (FCEVs). The PSA process involves the adsorption of impurities from a hydrogen rich feed gas onto a fixed bed of adsorbents at high pressure. The impurities are subsequently desorbed at low pressure into off-gas stream which results in production of an extremely pure hydrogen product (99.999%). Steam methane reforming systems have high production rates, and need large investment to install, which makes them suitable for central production facilities that produce tons of hydrogen every day, such as what a refinery or ammonia facility would use. 156 114 79 70 63 63 56 70 98 196 545 2015 2020 2030 2040 2050 Global Energy Demand Supplied with Hydrogen (in millions of tons) Transportation Industrial Energy Building Heat & Power Existing Feedstock Users New Feedstock (CCU, DRI) Power Generation, Buffering COWEN.COM 65 COWEN EQUITY RESEARCH Nikola Corporation June 17, 2020
  • 66.
    Figure 65 –Hydrogen Industry Value Chain Source: Cowen and Company The least expensive and most common way of producing hydrogen is through a process of reforming hydrocarbon fuels, where the chemical bonds between the hydrogen and carbon atoms are broken. Steam reforming is the most common reforming method and involves the mixing of fuel and steam in the presence of a metal catalyst. This produces hydrogen and carbon monoxide, which is changed into carbon dioxide through a second reaction. Over 90% of all hydrogen is produced through reforming, resulting in a significant amount of CO2 being released, though some emissions savings is realized through the high conversion efficiency of the process. In addition, when hydrogen is burned with air, NOX is formed, due to the high nitrogen content of air. Companies like Linde, Air Liquide and others are leaders in the hydrogen generation market from “grey” sources using traditional natural gas and coal and over time expect to transition to “blue” production where CO2 is managed. Fossil Fuel Nuclear Solar Wind Hydropower Electricity Electrolysis Steam Methane Reforming Water Hydrogen Storage & Reconversion Natural Gas Grid Refineries Methanol Plants Ammonia/ Urea Plants Power Electricity & Gas Mobility Industry Farms COWEN.COM66 COWEN EQUITY RESEARCH Nikola Corporation June 17, 2020
  • 67.
    Figure 66 –Blue and Green Hydrogen Production Value Chain Source: Ballard Power Renewable hydrogen is the foundation for achieving decarbonization in difficult to otherwise electrify sectors. We can make renewable hydrogen from renewable solar electricity and renewable wind electricity. Transportation companies can decarbonize international freight and aircraft travel, long haul trucks, and trains and all of these things that some people say we cannot decarbonize with current technologies. COWEN.COM 67 COWEN EQUITY RESEARCH Nikola Corporation June 17, 2020
  • 68.
    Figure 67 –Hydrogen Incumbents Can Leverage Existing Distribution Network Source: Linde Investor Presentation COWEN.COM68 COWEN EQUITY RESEARCH Nikola Corporation June 17, 2020
  • 69.
    In October 2019,Linde, a market leader in industrial gases, made an investment in ITM Power. ITM is a British manufacturer of polymer electrolyte membrane (PEM) electrolyzers. The two companies also formed a joint venture to implement ITM’s equipment into hydrogen projects. Linde will focus on providing global green gas solutions at an industrial scale – 10MW and up – using ITM Power’s modular PEM electrolysis technology and Linde’s EPC expertise to deliver turnkey solutions to customers. Air Liquide has also entered into an agreement with Engie for several projects of green hydrogen. The bulk of hydrogen is used for refining and ammonia production and produced with natural gas according to figures from Platts and the International Energy Association. Figure 68 – Global Pure Hydrogen Demand Figure 69 – Hydrogen Production Feedstock Energy (2018) Source: Platts Analytics Webinar Presentation, March 2020 Water electrolysis is the second most common method of hydrogen production. Among the challenges that face water electrolysis is the high system cost for electrolysis systems which resulted in low penetrations of PEM electrolysis technology in the market historically. Three major types of electrolyzers are currently produced commercially:  Alkaline electrolyzers are a demonstrated water electrolysis technology at large scale, but they tend to have lower system efficiency.  Polymer electrolyte membrane (PEM) electrolyzers work at temperatures between 50°C and 95°C. PEM electrolysis is a commercial technology that could still be improved through additional R&D to drive down costs, electricity consumption and system efficiency.  Solid oxide electrolyzers are still in early commercialization stage and still need more work to scale up into commercial systems. COWEN.COM 69 COWEN EQUITY RESEARCH Nikola Corporation June 17, 2020
  • 70.
    Alkaline electrolysis isconsidered an extremely mature technology and has been marketed for decades. PEM electrolysis technology, on the other hand, has positioned itself as a competitive technology and in the past had challenges in scaling to the MW class system size. A PEM electrolyzer stack consists of repeating cells that are electrically connected in series and reactant water/product gas connected in parallel. Thick metal plates (called end plates) from both ends are added to structurally hold these cells inside the stack. Large scale green hydrogen users such as Nikola Corporation intend to use alkaline electrolyzers based on the terms of the June 2018 contract between Nikola and Norwegian electrolyzer producer NEL. The agreement calls for up to 448 stations across the US with a total capacity of 1 GW. Nikola believes that over time they may need 700 stations to cover all of the United States and Canada. Based on figures in the Nel press release, the electrolyzer count per station will average 16. The figures also suggest that the devices will be A-485s, the company’s highest-capacity units. Nel’s arrangement with Nikola calls for Nel to provide all elements of the fueling station. In addition to electrolyzers, this will include equipment for compression, storage, and dispensing. A station with 16 electrolyzers will require approximately 35.2 MW of power. We note that the NEL solution is modular so for $15-20 million can produce 8,000 kg per day, which can serve approximately 210 trucks daily and consume about 17.6 MW of electricity. Bloomberg New Energy Finance estimates that alkaline electrolyzers cost about $1,200/kWh in 2019, a drop of about 40% since 2014. At the core of each of these modules is a polymer membrane with cathode and anode catalyst layers coated on the both sides of the membrane to form what is called catalyst-coated membrane (CCM). The porous transport layer (PTL) is a layer that enhances water diffusion and water splitting reaction on the surface of the membrane in the electrolysis cells. Bipolar plates, as the name suggests, have a cathodic side and an anodic side. Their main function is to separate cells in the stack, and they have channels that facilitate the transport of water, hydrogen, and oxygen inside the stack. Figure 70 – PEM Electrolysis Offers Numerous Advantages But Challenges With Multi-MW Scale Source: NEL, Cowen and Company Benefit PEM Onsite Generation Alkaline Reformers Delivered Dynamic Operating Range o o Response Time o o o Scale o Lower Cost of Ownership o o Safety o o o Environmentally Friendly o o o Storage o o o Efficiency o COWEN.COM70 COWEN EQUITY RESEARCH Nikola Corporation June 17, 2020
  • 71.
    Water electrolysis, whichinvolves the breakdown of water into hydrogen gas and oxygen gas by passing an electric current through water, has been used to create hydrogen for over 100 years. The resultant hydrogen gas is then captured and used for industrial gas applications, hydrogen fueling applications and in the storage of renewable and surplus energy. Proton exchange membrane (PEM)-based electrochemical technology was invented at General Electric Company (GE) in the mid- 1950s for use in the U.S. space program, and the technology ultimately was utilized aboard NASA’s Gemini series of spacecraft in the 1960s. Through the 1970s and 1980s, GE and later, Hamilton Sundstrand, developed robust and reliable PEM-based water electrolysis technology for critical U.S. and U.K. submarine oxygen life support. Figure 71 – Technology Development, Low Cost Feedstock and Policy Support Needed for Low Carbon Hydrogen Production to Compete Source: Platts Analytics Webinar Presentation, March 2020 Note: costs exclude transportation, storage, and dispensing equipment Hydrogen pump prices in California today are typically in the $10 to $12/kg range. Bloomberg New Energy Finance expects that with policy support, that could fall below $4/kg by 2030. Note that the above figures from Platts exclude dispensing and storage whereas the BNEF figures below are including these costs and are true at the pump prices. We would also note that the energy cost assumptions by Platts at $65/MWh look high in our view. We see onsite electrolysis using low cost renewable power as well as including the costs of delivering the hydrogen to a pump from the steam methane approach narrowing the gap between the two technologies over the coming years. COWEN.COM 71 COWEN EQUITY RESEARCH Nikola Corporation June 17, 2020
  • 72.
    Figure 72 –Estimated Hydrogen Prices at the Pump Source: Bloomberg New Energy Finance Clearly a low cost electricity source is the driver to lower cost over time. Given the cost curve of solar and wind, we expect more developers to look to sign deals with large scale PEM electrolyzer facilities that would run at 90% or more capacity factors. We estimate that 80-85% of the cost of producing hydrogen via electrolysis stems from electricity cost assumptions. Figure 73 – Relative Cost Advantage of SMR is Correlated with Natural Gas Price, Electricity Prices and Electrolyzer Usage Source: Platts Analytics Webinar Presentation, March 2020 Note: costs exclude transportation, storage, and dispensing equipment To truly create pollution-free fuel cells, hydrogen must be produced by renewable means and will likely take many years before reaching cost competitiveness. The remaining 5-10% of hydrogen is produced through the electrolysis of water into hydrogen gas and oxygen gas. This process itself does not give off any pollution, but requires a significant amount of electricity, which is produced through the combustion of hydrocarbon fuels (creating pollution). The ultimate goal is to power the electrolysis reaction by renewable means, such as solar power or wind power. This will result in the added benefit of being able to store excess power created by the renewable sources. COWEN.COM72 COWEN EQUITY RESEARCH Nikola Corporation June 17, 2020
  • 73.
    Electrolysis is extremelyenergy intensive and will result in the hydrogen produced being capable of generating one-quarter of the electricity that was initially used to produce the hydrogen. Due to the high electric requirements of the process, it is typically 1.5- 3.0X more expensive than steam reforming, and when coupled with a renewable source of energy, such as solar power, the cost disparity is even greater. When electrolysis can be powered by renewable means, fuel cells can achieve the status as being pollution- free, but this is a while away. In the near term, hydrogen will continue to be produced primarily through steam reforming. It takes about 11.1 liters, or about 2.9 gallons of water to produce 1 kilogram of hydrogen. In most states, industrial waters costs are less than $10 per 1,000 gallons. An 8-ton electrolyzer station that consumes about 17.6MW of power is anticipated to consume approximately 8.5 million gallons of water per year. One kilogram of hydrogen contains nearly the same energy as one gallon of diesel and offers the same amount of mileage (about 7-8 miles in most applications). This means that for hydrogen to ever gain adoption as a fuel source, the total cost to the consumer must at least be at parity with the incumbent fuel source. For automotive, that means that hydrogen must cost between $3-$4/kg, approximately the cost of a gallon of gasoline in recent years. As intermittent renewables (wind and solar) gain ground, the grid will require more sources of flexibility. This term encompasses a vast array of possible resources: flexible generation, demand response, interconnection, and storage. We note that it is possible, likely through a partner, that Nikola could look to leverage their hydrogen generation stations in the power to gas market, essentially leveraging low cost electricity stored as hydrogen to then be used for power generation in the future assuming a fuel cell was on site, or at a minimum arbitraging electricity during the day. While not core to the business today, we see the energy side of the Nikola model offering long-term optionality as the network stations are built out. Utilities seem to be increasingly looking at hydrogen solutions for longer duration storage solutions, above and beyond what lithium ion can offer. Pilot projects that eOn (now Unper) and Enbridge have undertaken over the past 5 years are proving to be reference sites to showcase how hydrogen can be used at scale to absorb excess renewables output, serving to balance and smooth the grid. Under the right conditions, hydrogen can be produced in Germany using curtailed wind power overnight and produce hydrogen at less than $2.50/kg, which is competitive with steam methane reformation. COWEN.COM 73 COWEN EQUITY RESEARCH Nikola Corporation June 17, 2020
  • 74.
    Figure 74 -Hydrogen Fits Into a Complex Storage Ecosystem Source: Bloomberg New Energy Finance Hydrogen storage systems can provide storage from days to months at a time, compared to batteries which are typically limited to a few hours. Hydrogen is a means of long term electricity storage because large volumes of the gas can be stored and converted to and from power using electrolyzers and fuel cells. An electrolyzer uses electricity to split water molecules, producing hydrogen and oxygen. There are multiple applications for fuel cells and hydrogen solutions within the grid landscape for both in front of the meter and behind the meter applications. In particular, we see applications such as: Power to Fuel – Hydrogen produced from electricity that is pressurized and used directly as a fuel for fuel cell vehicles. Power to Power – Hydrogen made from electricity that is pressurized, stored and converted back into electricity via a fuel cell. Power to Gas – Production of hydrogen from curtailed renewables and cheap wholesale energy, compressing the hydrogen and then injecting it into the gas grid. Discharge duration System capacity Seconds Minutes Hours Days Weeks Months 1kW 100kW 1MW 10MW 100MW 1,000MW Lithium-ion batteries Super capacitor Compressed air energy storage Pumped hydroHydrogen 10kW Sodium-sulfur batteries Flow batteries Flywheels Electrical Mechanical Electrochemical Hydrogen-related COWEN.COM74 COWEN EQUITY RESEARCH Nikola Corporation June 17, 2020
  • 75.
    Figure 75 -Hydrogen Pathways for Grid Applications Are Numerous Source: Bloomberg New Energy Finance Power-to-Gas Market Overview Power-to-Gas technology effectively harvests electricity produced through renewable sources (i.e. wind and solar) and readily converts said electricity into a more usable form. In a Power-to-Gas system, excess electricity is converted via electrolysis into hydrogen gas. This hydrogen gas is then methanized and fed into a natural gas pipeline, where it can be transported and used at a later point in time for electricity production in a cogeneration plant. The argument for menthanization of the gas, as opposed to the straight transfer of hydrogen, is that hydrogen has a much lower volume-related energy density, two-thirds lower than that of methane. The Power-to-Gas process provides a long-term solution to the inherent fluctuations in renewable energy production and provides a functional and time-tested energy storage solution that effectively bottles the electricity produced by the wind and sun. Unlike other energy storage techniques, Power-to-Gas provides the means to both store and transport energy resulting in higher overall efficiency. Hydrogenics, now part of Cummins, is pioneering Power-to-Gas technology, however, implementation of this technology is still in its infancy. Cummins is still in the process of working with utilities to demonstrate the effectivity and scalability of its technology, setting the stage for future commercial project development. Progress has been made in Germany and Canada thus far, but we believe many other countries are evaluating the technology. Non-renewable electricity generation Utility-scale solar and wind Fuel cells / Thermal plants Distributed solar and wind Electrolytic hydrogen production Electrolytic hydrogen production Hydrogen separation Methanation Natural gas plants Gas storage Electric grid Microgrid, backup power Hydrogen markets (FCEV, industrial uses, etc.) Natural gas markets (with our without hydrogen blend) Source of oxygen Source of carbon Upstream hydrogen injection Downstream hydrogen injection Conditioning Hydrogen storage Non-renewable electricity Renewable electricity Hydrogen Hydrogen/natural gas blend Natural gas Steam methane reformation Reformer COWEN.COM 75 COWEN EQUITY RESEARCH Nikola Corporation June 17, 2020
  • 76.
    Pilot projects areincreasingly granted special access to exceed pipeline regulations for power to gas demonstrations.  Germany: 30% injection of hydrogen pilot into a microgrid outside the city of Öhringen to begin in 2021.  France: 20% blending in residential area of 100 homes and one commercial center.  United Kingdom: 20% blending in Keele University microgrid supporting 100 homes and 30 commercial buildings.  Italy: 5% blending in gas pipeline feeding two industrial factories.  Austria: 100kW PEM electrolyzer used for grid balancing and direct hydrogen pipeline injection. Outside of the Power-to-Gas market leveraging excess wind and storing the hydrogen created through electrolysis in the natural gas pipelines, there is an opportunity to participate in the biofuels market. Until 2015, the oil industry in Germany was required to put a minimum percentage of biofuels on the market (6.25% energy content of their transport fuel sales). The rules have changed in 2015 and now refiners must reduce the greenhouse gas emissions of their products by 3.5% in 2015, 4% in 2017 and 6% by 2020. In the past, the “climate friendly” attributes of biofuels did not matter in Germany as refiners just wanted gallons, regardless of how they were created. We believe the EU Fuel Quality Directive could incentivize the deployment of low-carbon hydrogen throughout the production process of conventional petroleum fuels. Not only legislation is pushing the use of “clean” hydrogen in the refining sector, but also more extensive process treatment of residues and higher diesel demand compared with traditional gasoline is increasing hydrogen demand. Hydrogen is used in a traditional refinery to hydro-treat crude oil as part of the refining process to improve the hydrogen to carbon ratio of the fuel. Should renewable hydrogen be used in this production process, we believe refineries can make solid progress in reducing their GHG footprint. Coincidently, the bulk of the refineries in Germany are in Northern Germany, close to the area where onshore and offshore wind farms are located that can be tapped cost effectively to run through electrolyzers in off-peak hours to create renewable hydrogen. History of Nikola Corporation Nikola Corporation started as Nikola Motors in 2015 in Salt Lake City, Utah with the build out of the initial development team. The company initially worked out of founder Trevor Milton’s basement and started by hiring a chief engineer, chief designer and a battery engineer. We believe tank supplier Worthington was Nikola’s first outside investor, with current CEO Mark Russell having been the COO at Worthington and during his tenure at Worthington, the company purchased Trevor Milton’s prior trucking venture called dHybrd Systems which focused on natural gas trucking and was sold in 2014. Mr. Milton briefly worked for current CEO Mark Russel at Worthington before leaving to start Nikola in 2015. Mr. Milton said in a media interview that he needed an experienced hand to help build out and run Nikola and recruited Mark Russell to be Nikola’s president last year, a title which he retains in addition to being CEO. COWEN.COM76 COWEN EQUITY RESEARCH Nikola Corporation June 17, 2020
  • 77.
    The company beganprototyping its Nikola One truck the following year before signing a development partnership with Bosch and an equipment supply agreement with NEL in 2017. After 6 months of due diligence and allocating 100 engineers to the program, Bosch became a strategic partner in early 2017 and an investor in the company in a Series B round in late 2017. Bosch also participated in a subsequent Series C round in 2018. In 2018, Nikola signed an agreement with Anheuser-Busch for 800 vehicles and expanded its relationship with NEL for the development of hydrogen fueling stations. The company went on in 2019 to unveil the alpha version of its Nikola Two truck at Nikola World and entered into a North American production alliance and European JV with CNHI/Iveco. Prior to the JV with CNH/Iveco, Nikola had signed a deal with Fitzgerald Glider Kits to build the first 5,000 Nikola trucks before the Arizona factory opens. The company has moved primary operations to Phoenix, Arizona, where it conducts the majority of its research and development as well as its initial manufacturing operations. In March of 2020 the company merged with VectoIQ (VTIQ) via a business combination and now trades publicly under the ticker NKLA. Key Risk Factors to Consider Operational Risks Production Risk – Nikola is has not yet commenced full scale production of any of the company’s battery powered for fuel cell vehicles. There is risk that production delays could not only delay revenue recognition, but lead to order cancelations if customers find alternative solutions Product Risk - The success of Nikola’s products are dependent on market acceptance, which is influenced by many factors including cost competitiveness of fuel cell products and consumers’ reluctance to trying new products. Technology Risk – There is a risk that the company’s battery or fuel cell technology is not able to compete with its competitor’s efforts on either a cost or performance basis. Strategic Risks Customer Diversification Risk – Nikola is currently engaged with several large fleet operators for its initial vehicle launches through 2023. Customer concentration could be a material risk for the company in the event the company invests in hydrogen infrastructure to accommodate a fleet operator that is not willing or unable to operate the Nikola vehicles. Regulatory Risk – There is a risk that current emission restrictions are relaxed, potentially offsetting the urgency for fleets to reduce their carbon footprint Financial Risks Currency Risk – Nikola, through the use of a JV, is seeking to enter into the European market. Currency fluctuations could have a material impact on any components that require local sourcing and could also impact the sale price. We also note there is a currency translation risk when the company reports earnings on sales originating in countries outside of the United States. COWEN.COM 77 COWEN EQUITY RESEARCH Nikola Corporation June 17, 2020
  • 78.
    Financing Risk –The company’s ability to access capital through debt financing will likely be critical for its hydrogen infrastructure buildout, absent a partner willing to fund the endeavor. Additionally, given Nikola’s intention to securitize its truck leases an adverse event in the credit markets may make it more difficult to maintain liquidity if the market become inaccessible. Valuation and Price Target We value Nikola Corporation using a blend of 2023 and 2025 multiples. Given Nikola’s rollout of stations will likely take 8 to 10 years to complete, we believe a long-term view of potential earnings power is warranted. The challenge with this approach is few companies in the hydrogen economy peer group have estimates beyond 2023. Our $79 price target is derived using a blend of 2023 and 2025 EV/Sales multiples. We use a 22x EV/Sales multiple on our 2023 revenue estimate. We believe the recurring revenue nature of Nikola’s business model due to the hydrogen fuel and service revenue deserve a premium to the peer group. Why are modeling is likely overly conservative: We note that our modeling of Nikola is entirely based off of the North American trucking opportunity and assumes all CNH/Iveco produced units in Ulm, Germany enter the U.S. market and the JV does not focus on Europe. We also are assuming no regulatory credits aide the company, no residual value of the trucks, and also no 3rd parties assist with the capital expenses of the station buildout which is anticipated to be completed toward the end of the decade. In addition, we are assuming no revenue contribution at all from the Nikola Badger pickup truck program, which management in recent Twitter, media and investor conference appearances has indicated is a program they aim to commercialize in 2022 and beyond leveraging third parties. We believe the optionality of these programs is baked into expectations of the stock today; however, given the lack of clarity on timing and scope, we are reluctant to model the program. We also note that while Nikola believes they can outsell the Ford F-series pickup truck line, which sells just under 1 million units per year, we believe sales in the 50,000 to 100,000 are more attainable after a year or two of production should the vehicle be commercialized. If the company sold 50,000 vehicles at a price of $70,000, that would add about $3.5 billion of annual revenue to our estimates. Given the desire to use 3rd party manufacturing, we don’t see margins being inline with Nikola’s trucks or Tesla in the mid-20s and likely in the low to mid-teens. COWEN.COM78 COWEN EQUITY RESEARCH Nikola Corporation June 17, 2020
  • 79.
    Figure 76 -Nikola Corporation EV/Sales Figure 77 – Nikola Corporation – EV/EBITDA Source: Thomson Reuters, Cowen and Company We see Nikola’s projected growth and future margin profile above the peer groups shown below and also note the recurring nature of fuel revenue in 2025 beyond as the installed base and fueling station network accelerates. Figure 78 – Future Transportation Peers EV/Sales Figure 79 – Hydrogen Economy Peers EV/Sales Figure 80 – Commercial Vehicle Peers EV/Sales Source: Thomson Reuters Consensus Estimates Figure 81 – Future Transportation Peers EV/EBITDA Figure 82 – Hydrogen Economy Peers EV/EBITDA Figure 83 – Commercial Vehicles EV/EBITDA Source: Thomson Reuters Consensus Estimates 88.5x 18.8x 8.2x 4.7x 3.4x 2.6x 0.0x 10.0x 20.0x 30.0x 40.0x 50.0x 60.0x 70.0x 80.0x 90.0x 100.0x 2022E 2023E 2024E 2025E 2026E 2027E 145.8x 39.9x 28.0x 18.6x 0.0x 20.0x 40.0x 60.0x 80.0x 100.0x 120.0x 140.0x 160.0x CY 2024 CY 2025 2026E 2027E 0.0x 2.0x 4.0x 6.0x 8.0x 10.0x 12.0x 2022E 2023E 2024E 2025E NIO Inc Virgin Galactic Holdings Inc Tesla Inc 0.0x 5.0x 10.0x 15.0x 20.0x 25.0x 30.0x 35.0x 40.0x 2022E 2023E 2024E 2025E Ballard Power Systems Inc ITM Power PLC Nel ASA Plug Power Inc Powercell Sweden AB (publ) 0.0x 0.2x 0.4x 0.6x 0.8x 1.0x 1.2x 1.4x 1.6x 1.8x 2022E 2023E 2024E Navistar International Corp Paccar Inc Traton SE Volvo AB 0.0x 10.0x 20.0x 30.0x 40.0x 50.0x 60.0x 70.0x 2022E 2023E 2024E 2025E NIO Inc Virgin Galactic Holdings Inc Tesla Inc 0.0x 20.0x 40.0x 60.0x 80.0x 100.0x 120.0x 140.0x 160.0x 180.0x 2022E 2023E 2024E Ballard Power Systems Inc ITM Power PLC Nel ASA Plug Power Inc Powercell Sweden AB (publ) 0.0x 2.0x 4.0x 6.0x 8.0x 10.0x 12.0x 2022E 2023E 2024E Navistar International Corp Paccar Inc Traton SE Volvo AB COWEN.COM 79 COWEN EQUITY RESEARCH Nikola Corporation June 17, 2020
  • 80.
    Charts and Exhibits Figure84 – Revenue and Growth Rate (Y/Y) Source: Cowen and Company, Company Reports Figure 85 – Gross Profit and Gross Margin Source: Cowen and Company, Company Reports 0.0% 50.0% 100.0% 150.0% 200.0% 250.0% 300.0% 350.0% 400.0% 450.0% 0.00 2000.00 4000.00 6000.00 8000.00 10000.00 12000.00 F1Q20E F2Q20E F3Q20E F4Q20E F1Q21E F2Q21E F3Q21E F4Q21E F1Q22E F2Q22E F3Q22E F4Q22E F1Q23E F2Q23E F3Q23E F4Q23E F1Q24E F2Q24E F3Q24E F4Q24E F1Q25E F2Q25E F3Q25E F4Q25E F1Q26E F2Q26E F3Q26E F4Q26E F1Q27E F2Q27E F3Q27E F4Q27E 2020E 2021E 2022E 2023E 2024E 2025E 2026E 2027E Revenue ($mn) Revenue ($ millions) Change Y/Y (%) -20.0% -15.0% -10.0% -5.0% 0.0% 5.0% 10.0% 15.0% 20.0% 25.0% 30.0% -500 0 500 1000 1500 2000 2500 3000 F1Q20E F2Q20E F3Q20E F4Q20E F1Q21E F2Q21E F3Q21E F4Q21E F1Q22E F2Q22E F3Q22E F4Q22E F1Q23E F2Q23E F3Q23E F4Q23E F1Q24E F2Q24E F3Q24E F4Q24E F1Q25E F2Q25E F3Q25E F4Q25E F1Q26E F2Q26E F3Q26E F4Q26E F1Q27E F2Q27E F3Q27E F4Q27E 2020E 2021E 2022E 2023E 2024E 2025E 2026E 2027E Margin %Gross Profit ($ mn) Gross Profit ($ millions) Gross Margin (%) COWEN.COM80 COWEN EQUITY RESEARCH Nikola Corporation June 17, 2020
  • 81.
    Figure 86 –Operating Profit and Operating Margin Source: Cowen and Company, Company Reports Figure 87 – Adjusted EBITDA and Adjusted EBITDA Margin Source: Cowen and Company, Company Reports -1200.0% -1000.0% -800.0% -600.0% -400.0% -200.0% 0.0% 200.0% -400 -200 0 200 400 600 800 1000 F1Q20E F2Q20E F3Q20E F4Q20E F1Q21E F2Q21E F3Q21E F4Q21E F1Q22E F2Q22E F3Q22E F4Q22E F1Q23E F2Q23E F3Q23E F4Q23E F1Q24E F2Q24E F3Q24E F4Q24E F1Q25E F2Q25E F3Q25E F4Q25E F1Q26E F2Q26E F3Q26E F4Q26E F1Q27E F2Q27E F3Q27E F4Q27E 2020E 2021E 2022E 2023E 2024E 2025E 2026E 2027E Margin %Operating Profit ($ mn) Operating Profit Operating Margin (%) -1000.0% -900.0% -800.0% -700.0% -600.0% -500.0% -400.0% -300.0% -200.0% -100.0% 0.0% 100.0% -400 -200 0 200 400 600 800 1000 1200 1400 1600 F1Q20E F2Q20E F3Q20E F4Q20E F1Q21E F2Q21E F3Q21E F4Q21E F1Q22E F2Q22E F3Q22E F4Q22E F1Q23E F2Q23E F3Q23E F4Q23E F1Q24E F2Q24E F3Q24E F4Q24E F1Q25E F2Q25E F3Q25E F4Q25E F1Q26E F2Q26E F3Q26E F4Q26E F1Q27E F2Q27E F3Q27E F4Q27E 2020E 2021E 2022E 2023E 2024E 2025E 2026E 2027E Margin %Adjusted EBITDA ($ mn) Adjusted EBITDA EBITDA Margin (%) COWEN.COM 81 COWEN EQUITY RESEARCH Nikola Corporation June 17, 2020
  • 82.
    Nikola Corporation Summarized IncomeStatement - December Fiscal Year (Dollar amounts in millions, except per share) Fiscal Fiscal Fiscal Fiscal Fiscal Fiscal Fiscal Fiscal Fiscal Year 1QA 2QE 3QE 4QE Year 1QE 2QE 3QE 4QE Year Year Year Year Year Year Year 2019A Mar-20 Jun-20 Sep-20 Dec-20 2020E Mar-21 Jun-21 Sep-21 Dec-21 2021E 2022E 2023E 2024E 2025E 2026E 2027E Revenue $0.48 $0.058 $0.000 $0.000 $0.000 $0.058 $0.000 $0.000 $7.500 $75.000 $82.500 $300.000 $1,413.491 $3,223.488 $5,630.958 $7,708.216 $10,321.097 % y-o-y change 179% -53% -100% -100% -100% -88% -100% 142141% 264% 371% 128% 75% 37% 34% Incremental Revenue 0.3 0.0 (0.1) 0.0 0.0 (0.4) 0.0 0.0 7.5 67.5 82.4 217.5 1,113.5 1,810.0 2,407.5 2,077.3 2,612.9 Cost of Goods Sold $0.27 $0.000 $0.000 $0.000 $0.000 $0.00 $0.000 $0.000 $8.550 $85.500 $94.05 $302.27 $1,252.58 $2,660.56 $4,250.65 $5,658.90 $7,542.69 Gross Profit (GAAP) 0.21 0.06 - - - 0.06 - - (1.05) (10.50) (11.55) (2.27) 160.91 562.93 1,380.31 2,049.31 2,778.41 Total Gross Profit Margin (GAAP) 43.8% 100.0% 100.0% -14.0% -14.0% -14.0% -0.8% 11.4% 17.5% 24.5% 26.6% 26.9% Operating Expenses Selling, General and Administrative 20.69 17.805 20.476 22.933 25.226 86.441 26.488 27.812 29.203 30.663 114.166 153.009 283.647 473.506 769.340 1,056.339 1,295.364 % of Revenues 4292.9% 30699.0% 149036.2% 389.4% 40.9% 138.4% 51.0% 20.1% 14.7% 13.7% 13.7% 12.6% Research and Development 67.51 14.269 31.738 38.086 39.990 124.082 46.388 47.084 46.142 45.681 185.296 125.349 133.903 169.375 328.022 533.393 677.782 % of Revenues 14007.1% 24601.0% 213934.6% 615.2% 60.9% 224.6% 41.8% 9.5% 5.3% 5.8% 6.9% 6.6% Total Operating Expenses (GAAP) 88.21 32.07 52.21 61.02 65.22 210.52 72.88 74.90 75.35 76.34 299.46 278.36 417.55 642.88 1,097.36 1,589.73 1,973.15 % of Revenues 18300.0% 55300.0% 362970.7% 1004.6% 101.8% 363.0% 92.8% 29.5% 19.9% 19.5% 20.6% 19.1% Operating Income (GAAP) (88.00) (32.02) (52.21) (61.02) (65.22) (210.47) (72.88) (74.90) (76.40) (86.84) (311.01) (280.63) (256.64) (79.95) 282.94 459.58 805.26 EBIT Margin -18256.2% -552 -362870.7% -1018.6% -115.8% -377.0% -93.5% -18.2% -2.5% 5.0% 6.0% 7.8% % y-o-y Change 25% 36% 163% 419% 178% 139% 128% 43% 25% 33% 48% -10% -9% -69% -454% 62% 75% EBITDA (GAAP) (104.45) (32.40) (54.11) (63.82) (66.32) (216.65) (69.58) (68.40) (64.90) (70.34) (273.21) (178.63) (84.64) 182.05 664.94 946.58 1,427.26 EBITDA Margin -21671.0% -55859% -373529.4% -865% -94% -331.2% -59.5% -6.0% 5.6% 11.8% 12.3% 13.8% % y-o-y Change 57% 36% 172% 450% 187% 107% 115% 26% 2% 6% 26% -35% -53% -315% 265% 42% 51% Other (income) expense, net 0.51 1.15 4.50 7.20 6.50 19.35 5.70 5.00 5.00 5.10 20.80 21.03 54.81 111.26 210.92 332.02 498.14 Interest expense (1.46) 0.06 0.50 1.00 1.00 2.56 1.00 1.50 1.50 1.60 5.60 9.03 36.81 93.26 192.92 314.02 480.14 Pre-Tax Income (88.51) (33.16) (56.71) (68.22) (71.72) (229.81) (78.58) (79.90) (81.40) (91.94) (331.81) (301.66) (311.45) (191.21) 72.02 127.56 307.12 Income Taxes (Credit) 0.15 0.00 - - - 0.00 - - - - - - - - - - - Effective Tax Rate -0.2% 0.0% 0.0% 0.0% 0.0% 0.0% 0.0% 0.0% 0.0% 0.0% 0.0% 0.0% 0.0% 0.0% 0.0% 0.0% 0.0% Reported Net Income (Loss) (105.47) (33.16) (56.71) (68.22) (71.72) (229.81) (78.58) (79.90) (81.40) (91.94) (331.81) (301.66) (311.45) (191.21) 72.02 127.56 307.12 EPS (GAAP) ($0.29) ($0.08) ($0.13) ($0.16) ($0.17) ($0.54) ($0.18) ($0.19) ($0.19) ($0.21) ($0.77) ($0.69) ($0.70) ($0.43) $0.16 $0.28 $0.66 Weighted Average Share Count 359.139 403.907 424.500 425.561 426.625 420.148 427.692 428.761 429.833 436.807 430.773 439.544 443.956 448.413 452.913 457.460 462.051 Adjusted EBITDA (79.441) (32.398) (54.114) (63.819) (66.316) (216.647) (69.576) (68.396) (64.895) (70.344) (273.211) (178.628) (84.642) 182.046 664.944 946.582 1,427.263 Adjusted EBITDA Margin -16481.5% -55858.6% -373529.4% -865.3% -93.8% -331.2% -59.5% -6.0% 5.6% 11.8% 12.3% 13.8% Selected Balance Sheet Items and Statistics Cash, Equivalents & ST Investments $101.4 $744.9 $906.0 $791.8 $671.0 $671.0 $522.4 $377.6 $231.1 $593.4 $593.4 $101.8 $119.2 $165.6 $270.7 $157.8 $640.9 Sequential % Change -42% 635% 22% -13% -15% 562% -22% -28% -39% 157% -12% -83% 17% 39% 63% -42% 306% Sequential Absolute Change ($73) $644 $161 ($114) ($121) $570 ($149) ($145) ($146) $362 ($78) ($492) $17 $46 $105 ($113) $483 Cash & Equivalents $101.4 $744.9 $906.0 $791.8 $671.0 $671.0 $522.4 $377.6 $231.1 $593.4 $593.4 $101.8 $119.2 $165.6 $270.7 $157.8 $640.9 Accounts Receivables $0.0 $0.4 $0.0 $0.0 $0.0 $0.0 $0.0 $0.0 $2.5 $25.0 $25.0 $30.8 $155.3 $337.9 $552.6 $709.6 $910.6 DSOs 12 30 30 30 30 0 30 30 30 30 111 38 40 38 36 34 32 Inventories $0.0 $0.0 $0.0 $0.0 $0.0 $0.0 $0.0 $0.0 $2.3 $22.8 $22.8 $23.2 $105.8 $218.0 $326.1 $416.3 $531.1 Inventory Turns 15.0 15.0 15.0 15.0 15.0 15.0 15.0 15.0 4.1 13.0 11.8 12.2 13.0 13.6 14.2 Accounts Payable $0.0 $7.6 $0.0 $0.0 $0.0 $0.0 $0.0 $0.0 $4.8 $47.5 $47.5 $48.3 $220.3 $454.1 $679.4 $867.2 $1,106.4 Estimated Cash Flows (Operating Activities Only, Does Not Include Financing etc...) Change in Accounts Receivables (Cash Dec.) (0.01) (0.43) 0.45 - - 0.02 - - (2.50) (22.50) (25.00) (5.83) (124.44) (182.65) (214.70) (156.98) (201.03) Change in Accounts Payables (Cash Dec.) (16.50) 7.55 (7.55) - - - - - 4.75 42.75 47.50 0.81 172.04 233.72 225.28 187.85 239.21 Change in Inventories (Cash Dec.) - - - - - - - - (2.28) (20.52) (22.80) (0.39) (82.58) (112.19) (108.14) (90.17) (114.82) Estimated Cash from Operating Activities (94.88) (25.34) (61.72) (64.82) (67.32) (219.20) (70.58) (69.90) (66.43) (72.21) (279.11) (193.07) (156.42) 27.68 374.47 573.26 870.48 Est. Free Cash Flow (CFO minus Capex) (95.75) (26.78) (113.82) (114.12) (120.82) (375.53) (148.58) (144.90) (146.43) (139.21) (579.11) (491.57) (554.92) (714.82) (971.03) (1,205.74) (925.52) Capital Expenditures (0.88) (1.44) (52.10) (49.30) (53.50) (156.34) (78.00) (75.00) (80.00) (67.00) (300.00) (298.50) (398.50) (742.50) (1,345.50) (1,779.00) (1,796.00) Depreciation and amortization 2.32 0.70 2.10 3.40 4.40 10.60 8.00 10.00 15.00 20.00 53.00 114.00 190.00 280.00 400.00 505.00 640.00 Source: Company data, Cowen and Company estimates COWEN.COM82 COWEN EQUITY RESEARCH Nikola Corporation June 17, 2020
  • 83.
    VALUATION METHODOLOGY ANDRISKS Valuation Methodology Sustainable Energy & Industrial Technology: Our primary inputs to valuation are earnings and earnings growth (P/E and PEG) for the next two years. In cases where GAAP net income includes large, non-cash items (e.g., SBC or intangible amortization), we may use non-GAAP EPS. For companies with an emerging business model, we may use future-year earnings discounted back. As a cross check to an earnings multiple, we may also use a DCF analysis. For situations where earnings are not visible within our forecast horizon, we may use asset values (P/Book, P/TBV). Investment Risks Sustainable Energy & Industrial Technology: Demand for Sustainable Technology may be strongly influenced by government regulations, subsidies, and mandates as well as the overall health of the global macro economy. Share prices and financial results may be sensitive to policy changes and outcomes may be difficult to predict, due to the political nature of the process. Risks To The Price Target Operational Risks Production Risk – Nikola is has not yet commenced full scale production of any of the company’s battery powered for fuel cell vehicles. There is risk that production delays could not only delay revenue recognition, but lead to order cancelations if customers find alternative solutions Product Risk - The success of Nikola’s products are dependent on market acceptance, which is influenced by many factors including cost competitiveness of fuel cell products and consumers’ reluctance to trying new products. Technology Risk – There is a risk that the company’s battery or fuel cell technology is not able to compete with its competitor’s efforts on either a cost or performance basis. Strategic Risks Customer Diversification Risk – Nikola is currently engaged with several large fleet operators for its initial vehicle launches through 2023. Customer concentration could be a material risk for the company in the event the company invests in hydrogen infrastructure to accommodate a fleet operator that is not willing or unable to operate the Nikola vehicles. Regulatory Risk – There is a risk that current emission restrictions are relaxed, potentially offsetting the urgency for fleets to reduce their carbon footprint Financial Risks Currency Risk – Nikola, through the use of a JV, is seeking to enter into the European market. Currency fluctuations could have a material impact on any components that require local sourcing and could also impact the sale price. We also note there is a currency translation risk when the company reports earnings on sales originating in countries outside of the United States. Financing Risk – The company’s ability to access capital through debt financing will likely be critical for its hydrogen infrastructure buildout, absent a partner willing to fund the endeavor. Additionally, given Nikola’s intention to securitize its truck leases an adverse event in the credit markets may make it more difficult to maintain liquidity if the market become inaccessible. COWEN.COM 83 COWEN EQUITY RESEARCH Nikola Corporation June 17, 2020
  • 84.
    ADDENDUM Stocks Mentioned InImportant Disclosures Ticker Company Name APTV Aptiv PLC HASI Hannon Armstrong NKLA Nikola Corporation SEDG SolarEdge Technologies Analyst Certification Each author of this research report hereby certifies that (i) the views expressed in the research report accurately reflect his or her personal views about any and all of the subject securities or issuers, and (ii) no part of his or her compensation was, is, or will be related, directly or indirectly, to the specific recommendations or views expressed in this report. Important Disclosures Cowen and Company, LLC and or its affiliates make a market in the stock of Nikola Corporation, Aptiv PLC, Hannon Armstrong and SolarEdge Technologies securities. Cowen and Company, LLC managed or co-managed a public offering of Nikola Corporation in the past 12 months. Cowen and Company, LLC received compensation for investment banking services from Nikola Corporation in the past 12 months. Cowen and Company, LLC and/or its affiliates expect to receive, or intend to seek, compensation for investment banking services in the next 3 months from Nikola Corporation. Nikola Corporation is or has been in the past 12 months a client of Cowen and Company, LLC; Cowen and Company, LLC has provided or is providing investment banking services during the past 12 months. Cowen and Company, LLC compensates research analysts for activities and services intended to benefit the firm's investor clients. Individual compensation determinations for research analysts, including the author(s) of this report, are based on a variety of factors, including the overall profitability of the firm and the total revenue derived from all sources, including revenues from investment banking, sales and trading or principal trading revenues. Cowen and Company, LLC does not compensate research analysts based on specific investment banking transactions or specific sales and trading or principal trading revenues. Disclaimer Our research reports are simultaneously available to all clients are on our client website. Research reports are for our clients only. Not all research reports are disseminated, e-mailed or made available to third-party aggregators. Cowen and Company, LLC is not responsible for the redistribution of research by third party aggregators. Selected research reports are available in printed form in addition to an electronic form. All published research reports can be obtained on the firm’s client website, https://cowenlibrary.bluematrix.com/client/ library.jsp. The information, opinions, estimates and forecasts are as of the date of this report and subject to change without prior notification. We seek to update our research as appropriate, but various regulations may prevent us from doing so. Research reports are published at irregular intervals as appropriate in the analyst’s judgement. Further information on subject securities may be obtained from our offices. This research report is published solely for information purposes, and is not to be construed as an offer to sell or the solicitation of an offer to buy any security in any state where such an offer or solicitation would be illegal. Other than disclosures relating to Cowen and Company, LLC, the information herein is based on sources we believe to be reliable but is not guaranteed by us and does not purport to be a complete statement or summary of the available data. Any opinions expressed herein are statements of our judgment on this date and are subject to change without notice. The opinions and recommendations herein do not take into account individual client circumstances, objectives or needs and are not intended as recommendations of investment strategy. The recipients of this report must make their own independent decisions regarding any securities subject to this research report. In some cases, securities and other financial instruments may be difficult to value or sell and reliable information about the value or risks related to the security or financial instrument may be difficult to obtain. To the extent that this report discusses any legal proceedings or issues, it has not been prepared to express or intended to express any legal conclusion, opinion or advice. Our salespeople, traders and other professionals may provide oral or written market commentary or trading strategies to our clients that reflect opinions that are contrary to the opinions expressed in our research. Our principal trading area and investing businesses may make investment decisions that are inconsistent with recommendations or views expressed in our research. Cowen and Company, LLC maintains physical, electronic and procedural information barriers to address the flow of information between and among departments within Cowen and Company, LLC in order to prevent and avoid conflicts of interest with respect to analyst recommendations. For important disclosures regarding the companies that are the subject of this research report, please contact Compliance Department, Cowen and Company, LLC, 599 Lexington Avenue, 20th Floor, New York, NY 10022. In addition, the same important disclosures, with the exception of the valuation methods and risks, are available on the Firm's disclosure website at https://cowen.bluematrix.com/sellside/Disclosures.action. Equity Research Price Targets: Cowen and Company, LLC assigns price targets on all companies covered in equity research unless noted otherwise. The equity research price target for an issuer's stock represents the value that the analyst reasonably expects the stock to reach over a performance period of twelve months. Any price targets in equity securities in this report should be considered in the context of all prior published Cowen and Company, LLC equity research reports (including the disclosures in any such equity report or on the Firm's disclosure website), which may or may not include equity research price targets, as well as developments relating to the issuer, its industry and the financial markets. For equity research price target valuation methodology and risks associated with the achievement of any given equity research price target, please see the analyst's equity research report publishing such targets. Cowen Cross-Asset Research: Due to the nature of the fixed income market, the issuers or debt securities of the issuers discussed in “Cowen Cross-Asset Research” reports do not assign ratings and price targets and may not be continuously followed. Accordingly, investors must regard such branded reports as providing stand-alone analysis and reflecting the analyst’s opinion as of the date of the report and should not expect continuing analysis or additional reports relating to such issuers or debt securities of the issuers. From time to time “Cowen Cross-Asset Research” analysts provide investment recommendations on securities that are the subject of this report. These recommendations are intended only as of the time and date of publication and only within the parameters specified in each individual report. “Cowen Cross-Asset Research” investment recommendations are made strictly on a case-by-case basis, and no recommendation is provided as part of an overarching rating system or other set of consistently applied benchmarks. The views expressed in "Cross-Asset Research" report may differ from the views offered in the firm’s equity research reports prepared for our clients. Notice to UK Investors: This publication is produced by Cowen and Company, LLC which is regulated in the United States by FINRA. It is to be communicated only to persons of a kind described in Articles 19 and 49 of the Financial Services and Markets Act 2000 (Financial Promotion) Order 2005. It must not be further transmitted to any other person without our consent. COWEN.COM84 COWEN EQUITY RESEARCH Nikola Corporation June 17, 2020
  • 85.
    Notice to EuropeanUnion Investors: Individuals producing recommendations are required to obtain certain licenses by the Financial Regulatory Authority (FINRA). You can review the author’s current licensing status and history, employment history and, if any, reported regulatory, customer dispute, criminal and other matters via “Brokercheck by FINRA” at http:// brokercheck.finra.org/. An individual’s licensing status with FINRA should not be construed as an endorsement by FINRA. General biographical information is also available for each Research Analyst at www.cowen.com. Additionally, the complete preceding 12-month recommendations history related to recommendation in this research report is available at https://cowen.bluematrix.com/sellside/ Disclosures.action Cowen and Company, LLC and/or its affiliates beneficially own .5% or more of the common equity securities of Nikola Corporation. The recommendation contained in this report was produced at June 16, 2020, 20:14 ET. and disseminated at June 17, 2020, 05:28 ET. Copyright, User Agreement and other general information related to this report © 2020 Cowen and Company, LLC. All rights reserved. Member NYSE, FINRA and SIPC. This research report is prepared for the exclusive use of Cowen clients and may not be reproduced, displayed, modified, distributed, transmitted or disclosed, in whole or in part, or in any form or manner, to others outside your organization without the express prior written consent of Cowen. Cowen research reports are distributed simultaneously to all clients eligible to receive such research reports. Any unauthorized use or disclosure is prohibited. Receipt and/or review of this research constitutes your agreement not to reproduce, display, modify, distribute, transmit, or disclose to others outside your organization. All Cowen trademarks displayed in this report are owned by Cowen and may not be used without its prior written consent. Cowen and Company, LLC. New York 646 562 1010 Boston 617 946 3700 San Francisco 415 646 7200 Chicago 312 577 2240 Cleveland 440 331 3531 Atlanta 866 544 7009 Stamford 646 616 3000 Washington, D.C. 202 868 5300 London (affiliate) 44 207 071 7500 COWEN AND COMPANY EQUITY RESEARCH RATING DEFINITIONS Outperform (1): The stock is expected to achieve a total positive return of at least 15% over the next 12 months Market Perform (2): The stock is expected to have a total return that falls between the parameters of an Outperform and Underperform over the next 12 months Underperform (3): Stock is expected to achieve a total negative return of at least 10% over the next 12 months Assumption: The expected total return calculation includes anticipated dividend yield Cowen and Company Equity Research Rating Distribution Distribution of Ratings/Investment Banking Services (IB) as of 03/31/20 Rating Count Ratings Distribution Count IB Services/Past 12 Months Buy (a) 486 63.04% 127 26.13% Hold (b) 276 35.80% 17 6.16% Sell (c) 9 1.17% 0 0.00% (a) Corresponds to "Outperform" rated stocks as defined in Cowen and Company, LLC's equity research rating definitions. (b) Corresponds to "Market Perform" as defined in Cowen and Company, LLC's equity research ratings definitions. (c) Corresponds to "Underperform" as defined in Cowen and Company, LLC's equity research ratings definitions. Cowen and Company Equity Research Rating Distribution Table does not include any company for which the equity research rating is currently suspended or any debt security followed by Cowen Credit Research and Trading. Note: "Buy", "Hold" and "Sell" are not terms that Cowen and Company, LLC uses in its ratings system and should not be construed as investment options. Rather, these ratings terms are used illustratively to comply with FINRA regulation. Aptiv PLC Rating History as of 06/15/2020 powered by: BlueMatrix 140 120 100 80 60 40 20 Jul 17 Oct 17 Jan 18 Apr 18 Jul 18 Oct 18 Jan 19 Apr 19 Jul 19 Oct 19 Jan 20 Apr 20 I:(1):$120.00 09/25/17 (1):$102.00 12/05/17 (1):$107.00 01/18/18 (1):$109.00 02/01/18 (1):$110.00 05/02/18 (1):$109.00 07/19/18 (1):$112.00 07/31/18 (1):$101.00 10/15/18 (1):$89.00 01/04/19 (1):$96.00 01/31/19 (1):$105.00 04/22/19 (1):$100.00 05/02/19 (1):$97.00 05/28/19 (1):$95.00 07/19/19 (1):$102.00 07/31/19 (1):$108.00 09/24/19 (1):$107.00 10/08/19 (1):$106.00 10/31/19 (1):$112.00 12/17/19 (1):$109.00 01/31/20 (1):$82.00 03/26/20 (1):$75.00 04/22/20 (1):$86.00 05/05/20 Closing Price Target Price COWEN.COM 85 COWEN EQUITY RESEARCH Nikola Corporation June 17, 2020
  • 86.
    Hannon Armstrong RatingHistory as of 06/15/2020 powered by: BlueMatrix 45 40 35 30 25 20 15 Jul 17 Oct 17 Jan 18 Apr 18 Jul 18 Oct 18 Jan 19 Apr 19 Jul 19 Oct 19 Jan 20 Apr 20 (1):$28.00 06/22/17 (1):$29.00 10/24/17 (1):$28.00 11/07/17 (1):$25.00 02/26/18 (1):$24.00 05/07/18 (1):$27.00 11/05/18 (1):$29.50 02/26/19 (1):$31.50 05/07/19 (1):$32.00 08/07/19 (1):$37.50 11/04/19 (1):$40.00 02/14/20 (1):$32.00 03/26/20 (1):$31.00 04/15/20 (1):$34.00 05/11/20 Closing Price Target Price Nikola Corporation Rating History as of 06/15/2020 powered by: BlueMatrix 100 80 60 40 20 0 Jul 17 Oct 17 Jan 18 Apr 18 Jul 18 Oct 18 Jan 19 Apr 19 Jul 19 Oct 19 Jan 20 Apr 20 Closing Price Target Price SolarEdge Technologies Rating History as of 06/15/2020 powered by: BlueMatrix 160 140 120 100 80 60 40 20 0 Jul 17 Oct 17 Jan 18 Apr 18 Jul 18 Oct 18 Jan 19 Apr 19 Jul 19 Oct 19 Jan 20 Apr 20 (1):$24.00 07/13/17 (1):$31.00 08/03/17 (1):$41.00 11/09/17 (1):$53.00 02/14/18 (1):$59.00 05/04/18 (1):$57.00 08/02/18 (1):$51.00 10/29/18 (1):$52.00 02/21/19 (1):$65.00 05/07/19 (1):$74.00 07/12/19 (1):$85.00 08/07/19 (1):$102.00 09/25/19 (1):$108.00 11/07/19 (1):$118.00 11/26/19 (1):$136.00 02/14/20 (1):$145.00 02/20/20 (1):$138.00 03/26/20 (1):$134.00 04/23/20 Closing Price Target Price Legend for Price Chart: I = Initiation | 1 = Outperform | 2 = Market Perform | 3 = Underperform | UR = Price Target Under Review | T = Terminated Coverage | $xx = Price Target | NA = Not Available | S=Suspended COWEN.COM86 COWEN EQUITY RESEARCH Nikola Corporation June 17, 2020
  • 87.
    POINTS OF CONTACT AnalystProfiles Jeffrey Osborne Stamford 646 562 1391 jeffrey.osborne@cowen.com Jeff Osborne is an analyst covering sustainable energy tech. He has a BS from Trinity University and an MBA from Wayne State University. Thomas Boyes New York 646 562 1378 thomas.boyes@cowen.com Thomas Boyes is an associate covering sustainable energy technology. He has a BS in finance from Saint Joseph's University. Emily Riccio New York 646 562 1383 emily.riccio@cowen.com Emily Riccio is an associate covering sustainable energy technology. She received a BA in economics from Trinity College. Reaching Cowen Main U.S. Locations New York 599 Lexington Avenue New York, NY 10022 646 562 1010 800 221 5616 Atlanta 3424 Peachtree Road NE Suite 2200 Atlanta, GA 30326 866 544 7009 Boston Two International Place Boston, MA 02110 617 946 3700 800 343 7068 Chicago 181 West Madison Street Suite 3135 Chicago, IL 60602 312 577 2240 Cleveland 20006 Detroit Road Suite 100 Rocky River, OH 44116 440 331 3531 Stamford 262 Harbor Drive Stamford, CT 06902 646 616 3000 San Francisco One Maritime Plaza, 9th Floor San Francisco, CA 94111 415 646 7200 800 858 9316 Washington, D.C. 2900 K Street, NW Suite 520 Washington, DC 20007 202 868 5300 International Location Cowen International Limited London 1 Snowden Street - 11th Floor London EC2A 2DQ United Kingdom 44 20 7071 7500 COWENRESEARCH COWEN COWEN INC. COWEN.COM 87 COWEN EQUITY RESEARCH Nikola Corporation June 17, 2020