Download as PDF, PPTX


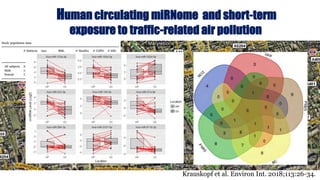
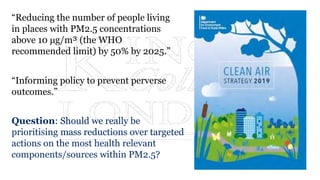

This document summarizes the key findings from numerous studies on the health effects of PM2.5 published between 2006-2019. It notes that thousands of new health studies and reviews have found that PM2.5 contributes significantly to the global burden of disease, with effects seen even below WHO guideline values. Specific topics covered include the impacts of primary combustion pollutants like diesel and biomass burning, the effects of prenatal exposures and impacts across the lifespan, and the use of alternative pollution metrics like black carbon to help disentangle health effects. The document questions whether a mass-based approach or targeted actions on specific components and sources may be most effective for improving health outcomes.


