
Recommended
Recommended
More Related Content
What's hot
What's hot (20)
Viewers also liked
Viewers also liked (14)
Similar to Knowledge Exchange mission SUSWA project 30 November – 5 December 2014, Kajiado, Kenya Hydrogeological surveying and geophysics - Tanzania 3R project babu
Similar to Knowledge Exchange mission SUSWA project 30 November – 5 December 2014, Kajiado, Kenya Hydrogeological surveying and geophysics - Tanzania 3R project babu (20)
More from SamSamWater Foundation
More from SamSamWater Foundation (7)
Recently uploaded
Recently uploaded (20)
Knowledge Exchange mission SUSWA project 30 November – 5 December 2014, Kajiado, Kenya Hydrogeological surveying and geophysics - Tanzania 3R project babu
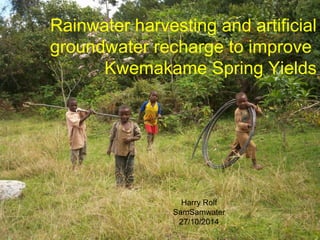
- 1. Rainwater harvesting and artificial groundwater recharge to improve Kwemakame Spring Yields Harry Rolf SamSamwater 27/10/2014
- 2. Project Location • Tanga region • Lushoto district • Kwemakame / Kwai villages
- 3. Kwemakame project history • Chamavita, Mr. Kempenaar and mama Els • 1989 scheme construction – 10 intakes – 2500 - 3500 users • 2004 ‘depletion’>Tsedaka>AquaforAll>Chamavita • 2006 practicalresearch project – Cause of depletion? – How to improve?
- 4. project history (2) • 2006 – 2010 • Monitoring • Field investigations • Analysis • 2009 understanding > strategy>pilots • 2010/2012 pilot design & construction • 2013 ‘post-pilot’ monitoring and reporting • 2014 dissemination
- 5. Partner Project Local Partners: • Village Kemakame/Kai • Chamavita (Chama cha maendaleo vijijini tanga) • Pangani Basin Water Office The Netherlands: • AquaforAll (funding) • Aquanet (funding) • PWN/SamSamWater (techn. Assistance) • SPOT Tanzania
- 6. Kwemakame/Kwai Estimated 3000 people • Kwai/Kwemamake Water Board • 9 sub-villages/hamlets each having water committee • 34 tap watercommitees Water demand 1 liter/sec Scheme constructed 1989, but the yield dropped since the initiation Present Water sources (dry season): • Dindira ‘spring’ catchment (0,35 l/sec) • Kidandi ‘spring’catchment (0,15 l/sec) Total yield Dindira 0 0.2 0.4 0.6 0.8 1 1.2 1.4 1.6 1.8 2 01/01/11 01/03/11 01/05/11 01/07/11 01/09/11 01/11/11 01/01/12 01/03/12 01/05/12 01/07/12 01/09/12 01/11/12 01/01/13 01/03/13 01/05/13 01/07/13 dischargeinl/sec tot flow monthly avg estimated demand (including animals) domestic only Kidandi sourc
- 7. Study area Water catchment is up in the mountains at Dindira
- 8. Dindira Valley 1950 – 2000 masl
- 10. Dindira shallow aquifer Impervious base 2100 m 2000 m 1950 m
- 11. Gravity spring captation Impervious base Rainfall and evapotranspiration Recharge runoff spring spring ‘spring’ wall intake
- 12. Water intakes
- 13. Water scheme ch. 6 chamber 5 intake 8 intake 9 intake 10 intake 11 chamber 2 other intakes storage tank to Kwemakame From 11 intakes to 5 collection chambers From collection chambers to storage tank From storage tank down to village distribution
- 14. Dindira main Storage tank 1850 m
- 15. 43000 LITER/DAG 17 LITER PER PERSON Distribution area 1650 m
- 16. Water point Dindira hamlet
- 17. Research methodology • Monitoring (Rainfall, evaporation, yields,…) • Field reconnaisance • Mapping • Analysis/ understanding
- 18. Monitoring Rainfall & pan evaporation
- 21. Discharge reading in collection chambers
- 22. Bucket method
- 25. Field investigations • GPS mapping • Geophysical sounding and profiling • Augering • Infiltration capacity testing • Water chemistry & temperature
- 26. GPS mapping
- 27. Geo electrical profiling (VES and Wenner)
- 31. Conductivity of black clay
- 32. Auger drilling
- 35. Analysis Wenner profile Dindira (Kwemakame) intake nr.2 sub-catchment 1940 1945 1950 1955 1960 1965 1970 1975 1980 1985 1990 -10 -7.5 -5 -2.5 0 2.5 7.5 10 12.5 17.5 20 22.5 27.5 30 32.5 37.5 40 42.5 47.5 50 52.5 57.5 60 62.5 67.5 distance from centre (m) altitude(m) 100 1000 1000 groundsurface (waypoints) ground surface (interpret) apparent res (Ωm) 3x5m apparent res (Ωm) 3x10m outcrop Aquifer properties Cumulative rainfall 0 200 400 600 800 000 200 Nov Dec Jan Feb March April May June July August Sept Oct Dindira 2007/2008 Dindira 2008/2009 Normal Rainfall (NewLocClim) Normal rainfall Lushoto Dindira 2009/2010 Rainfall analysis Kwemakame total discharge 0 10 20 30 40 50 60 jan/08 mrt/08 mei/08 jul/08 sep/08 nov/08 jan/09 mrt/09 mei/09 jul/09 sep/09 nov/09 jan/10 mrt/10 mei/10 jul/10 sep/10 rainfall(mm/day) 0 0.5 1 1.5 2 2.5 3 3.5 discharge(l/sec) rainfall (mm flow in ch 5 27/10/06 chamber 5 Rainfall discharge relationship
- 36. Reasons for depletion • Over decades: springs dried up due to deforestation. • Rapid population increase • Climate change? (no proof) • Since 1989: yield decreased because of using up groundwater storage
- 37. Reasons for depletion (2) Just too little recharge Most of the water is running off , being lost out of the area Intakes are just ‘scraping’ the recharge added in the last rain season Groundwater dropping
- 38. Key to improvement INCREASE THE AMOUNT OF WATER THAT INFILTRATES INTO THE GROUND Water is available: A lot of water in running off unutilized
- 39. runoff
- 40. Strategy options • Plant trees (yes, good solution but on the long run) • (Let it rain more) • (Pump water) • (Deeper intake wall) • (Surface water storage and treatment) • Add water in the underground: –‘artificial recharge’
- 41. Strategy to improve Artificial Recharge: – Harvest rainwater that is running of – Temporary storage – Infiltration in the underground – ‘boost’ groundwater > increase yield 3R Retention Recharge Re-use
- 42. Pilots to prove strategy Pilot 1 Rainwater harvesting and artificial groundwater recharge
- 52. runoff Existing intake nr 2 Infiltration pit filter trench storage (hillside) dam Pilot 1
- 57. Runoff catchment & diversion channel
- 58. Hillside dam
- 59. Infiltration pit
- 60. Filter trench and infiltration pit
- 61. SHIDA KUBWA Rain disaster April 2012 Dam restored and enforced summer 2012
- 62. Fillings of the dam Dec 2012 – May 2013
- 63. Run off
- 64. Run off from bedrock
- 65. Water diversion to the dam
- 66. Fillings of the reservoir
- 67. Infiltration through the reservoir bottom
- 68. Release to the infiltration pit (after 1 day settling)
- 69. Results A total amount of 2,5 million liters has been infiltrated This water is added to groundwater and slowly flows down to intake, flowing out in the dry season Some intakes were closed. By doing that, groundwater is conserved for the dry season. This has been beneficial as well.
- 70. 2013 dry season effect: The people from Kwemakame/Kwai noticed considerably more water. “we don’t know exactly what you’ve been doing up there in Dindira, but it helped a lot. We didn’t experience having so much water for many years. Even in the last dry months we had water all day long”.
- 71. Dry season yield monitoring year month yield (l/sec) 2009 Oktober 0.15 2010 November 0.42 2011 September 0.31 2012 November 0.25 ------------------------------------------------- average before the project: 0.30 2013 November 0.70 2014 29/10/2014 0.90 Observed yield of the Dindira Water Catchment at the end of the dry season •Yield increased from 0.30 to 0.80 l/sec •Kwemakame/Kwai requires is 1.0 l/sec •Kidandi source gives 0.15 • The required water is now available
- 72. CONCLUSIONS • Rainwater harvesting and infiltration by artificial recharge can significantly improve the water supply • Water conservation by closing intakes during the rain season adds a positive effect as well. • Proper maintenance and operation is a first requirement for sustainability • The community, Chamavita and Pangani Basin Water were deeply involved in this project and gained a lot of new knowledge on how to improve the ‘spring’ water catchment system. They are eager to replicate and upscale the concept to similar water schemes.
- 73. CHALLENGES AND LESSONS LEARNED • Assessment of runoff (where, how much) • Proper operation and maintenance is crucial • Re-use Silts that are trapped in the dam • Construction of earth dams on steep slopes. • To replicate this in other areas, you first need to understand the groundwater system • For this understanding hydrological monitoring is required (yields, groundwater levels, rainfall, …) • Other (technical) lessons learned. • It is extremely difficult to manage extensive
- 74. Other (technical) lessons learned. • It is extremely difficult to manage extensive hydrological monitoring without experts on the ground, who are continuously analysing and checking the quality of the data collection. • Know your runoff in the early project stages. It is important to know how much runoff water is there to catch. In our case the runoff was less than expected. Runoff tracks must be identified (and quantified) beforehand during heavy rains. • Rainfall variability is high. For quantification purposes it is essential to have multiple rain stations over the catchment, measuring not only daily totals but rainfall intensity as well. • The results show that rationing is effective, saving additional water for the dry season. In particular think of closing the highest intakes during the rain season ( starting with nr.2) • How much and how fast will the infiltration water flow out at the source/intake: a set of ‘design rules’ is required. • Proper operation and maintenance of the facility and its surroundings is required to assure that it will continue supplying.
- 75. Water quality • Indication of raised Nitrate contents by agriculture • Water source protection must be addressed • Artificial recharge preferably in the forest area, lakini….
- 76. Asante
- 77. MASWALI ?
- 86. The other pilot, pilot nr.2
- 87. runoff source pipe trench new intake storage (valley) dam Pilot 2 DESIGN
- 88. Pilot 2 area
- 90. construction
- 91. Auger drilling
- 92. Auger drilling
- 93. New intake
- 94. Auger drilling
- 97. • Unfortunately the new intake has much less water than expected • Permanent Groundwater seepage flow to the dam 5000 lita every day! • This water is treated by a SSF (Slow Sand Filter)
- 99. • Very unfortunately the new intake has much less water than expected due to bad siting (by us). • The aquifer is largely blocked by clays • In stead the water is seeping to the reservoir (4000 l/day) • Water is treated by a Slow Sand Filter
- 100. Slow sand filter
- 101. MASWALI ?