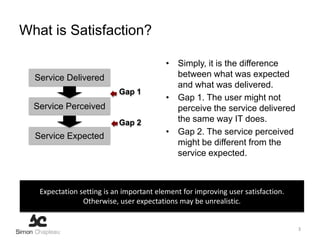
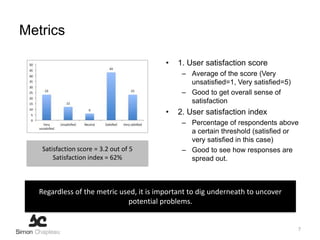
User satisfaction is defined by the difference between the perceived performance of the system or service compared to the expectations of the users. It is a subjective measure that varies depending on the users and the perception of the service by them.
2. Agenda
• What is Satisfaction
• Why is it important
• Metrics
• Strategies
2
3. What is Satisfaction?
• Simply, it is the difference
Service Delivered between what was expected
and what was delivered.
Gap 1
• Gap 1. The user might not
Service Perceived perceive the service delivered
Gap 2 the same way IT does.
Service Expected • Gap 2. The service perceived
might be different from the
service expected.
Expectation setting is an important element for improving user satisfaction.
Otherwise, user expectations may be unrealistic.
3
4. Four Factors of Satisfaction
Reliability Expectations
System Users
Features Attitude
Satisfaction
Involvement Context
Environmental Tasks
Participation State of mind
The four factors influence each others.
This is why satisfaction can become a virtuous or vicious cycle.
4
5. The IT Value Hierarchy
Self-actualization Paradigm shifting
Esteem needs Competitive differentiation
Social needs Integrated information needs
Safety needs Stability and security needs
Physiological needs Infrastructure and connectivity needs
Maslow’s Hierarchy of Needs IT Value Hierarchy
In order to provide higher-level value, the bases must exist.
A user cannot be satisfied unless services are reliable and secure.
6. Why is it Important?
Improved user Studies have shown that satisfied users tend to be
productivity more productive.
Satisfied tend to have fewer support calls, having
Reduced IT support
fewer issues and being more adept at solving it
cost
themselves.
Diminished resistance Satisfied users tend to participate more in change
to change program and accept better new applications.
User shouldn't be treated as a captive audience.
User satisfaction brings real benefits.
6
7. Metrics
• 1. User satisfaction score
– Average of the score (Very
unsatisfied=1, Very satisfied=5)
– Good to get overall sense of
satisfaction
• 2. User satisfaction index
– Percentage of respondents above
a certain threshold (satisfied or
very satisfied in this case)
Satisfaction score = 3.2 out of 5 – Good to see how responses are
Satisfaction index = 62% spread out.
Regardless of the metric used, it is important to dig underneath to uncover
potential problems.
7
8. Strategies
The Basics Intermediate Expert
Reliable service
Service mindset Reduce user anxiety
Set expectations
• 2001. Establish support • Strategy: 2010. Train IT staff • Strategy: 2020. Train end-
ticket system to improve IT service users on key applications
• 2002. Set and communicate climate (Ref 5) • Strategy: 2021. Simplify key
service level agreements • Strategy: 2011: Establish a application
(SLA). governance framework for • Strategy: 2022. Simplify key
• 2003. Establish basic IT decision-making IT assets
support processes • Strategy: 2023. Promote
• 2004. Measure and track passive participation for
user satisfaction non-participating users
8