Wireless1BlankBudget
•Download as XLS, PDF•
0 likes•257 views

This is a test

Recommended
More Related Content
Similar to Wireless1BlankBudget
Similar to Wireless1BlankBudget (20)
Recently uploaded
Recently uploaded (20)
Wireless1BlankBudget
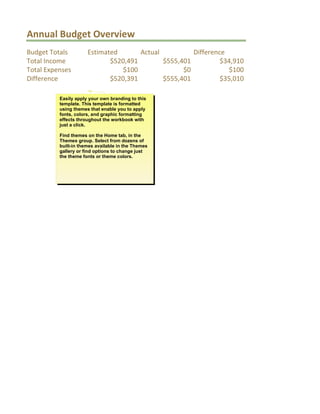
- 1. Annual Budget Overview Budget Totals Estimated Actual Difference Total Income $520,491 $555,401 $34,910 Total Expenses $100 $0 $100 Difference $520,391 $555,401 $35,010 Easily apply your own branding to this template. This template is formatted using themes that enable you to apply fonts, colors, and graphic formatting effects throughout the workbook with just a click. Find themes on the Home tab, in the Themes group. Select from dozens of built-in themes available in the Themes gallery or find options to change just the theme fonts or theme colors.
- 2. Annual Expense Report Edit your expense data on the When you enter your data, the Estimated Annual Expenses $100 updates automatically. Actual Annual Expenses $0 The table below is a PivotTabl data on the Expense Details s table and then click Refresh D Difference $100 table and the chart. Month (All) Qtr (All) Values Row Labels Estimated Total Actual Total Variance Total Personnel $0 $0 $0 Office $0 $0 $0 Salespeople $0 $0 $0 Operating $100 $0 $100 Advertising $0 $0 $0 Delivery Costs $0 $0 $0 Insurance $100 $100 Legal and Auditing $0 $0 $0 Office supplies $0 $0 $0 Utilities $0 $0 $0 (blank) $0 $0 Totals $100 $0 $100
- 3. Edit your expense data on the Expense Details sheet. When you enter your data, the report that you see here updates automatically. The table below is a PivotTable. After you update your data on the Expense Details sheet, right-click in the table and then click Refresh Data to update both the table and the chart. A PivotTable, such as the table at left, makes it easy for you to look at your data in different ways. Prior Year Total Prior Year Variance Total When you click in the table, the PivotTable Builder $0 $0 window appears, from which you can add or remove fields from the table. $0 $0 $0 $0 When you click in the PivotTable, a PivotTable tab also appears on the Ribbon above your workbook $0 $0 window, providing many options for formatting $0 $0 and editing the PivotTable. $0 $0 $0 $0 $0 $0 $0 $0 $0 $0 $0 $0 $0 $0
- 4. t, makes it ifferent ways. tTable Builder n add or ivotTable tab our workbook formatting
- 5. 01+02407/17/2011 01+024Monthly Budget - Detail Page 5 of 19 Month Qtr Category Line Item Estimated Actual July Qtr 3 Personnel Office $0 $0 July Qtr 3 Personnel Salespeople $0 $0 July Qtr 3 Operating Advertising $0 $0 July Qtr 3 Operating Delivery Costs $0 $0 July Qtr 3 Operating Legal and Auditing $0 $0 July Qtr 3 Operating Office supplies $0 $0 August Qtr 3 Personnel Office $0 $0 August Qtr 3 Personnel Salespeople $0 $0 August Qtr 3 Operating Advertising $0 $0 August Qtr 3 Operating Delivery Costs $0 $0 August Qtr 3 Operating Legal and Auditing $0 $0 August Qtr 3 Operating Office supplies $0 $0 September Qtr 3 Personnel Office $0 $0 September Qtr 3 Personnel Salespeople $0 $0 September Qtr 3 Operating Advertising $0 $0 September Qtr 3 Operating Delivery Costs $0 $0 September Qtr 3 Operating Legal and Auditing $0 $0 September Qtr 3 Operating Office supplies $0 $0 October Qtr 4 Personnel Office $0 $0 October Qtr 4 Personnel Salespeople $0 $0 October Qtr 4 Operating Advertising $0 $0 October Qtr 4 Operating Delivery Costs $0 $0 October Qtr 4 Operating Legal and Auditing $0 $0 October Qtr 4 Operating Office supplies $0 $0 November Qtr 4 Personnel Office $0 $0 November Qtr 4 Personnel Salespeople $0 $0 November Qtr 4 Operating Advertising $0 $0 November Qtr 4 Operating Delivery Costs $0 $0 November Qtr 4 Operating Legal and Auditing $0 $0 November Qtr 4 Operating Office supplies $0 $0 December Qtr 4 Personnel Office $0 $0 December Qtr 4 Personnel Salespeople $0 $0 December Qtr 4 Operating Advertising $0 $0 December Qtr 4 Operating Delivery Costs $0 $0 December Qtr 4 Operating Legal and Auditing $0 $0 December Qtr 4 Operating Office supplies $0 $0 January Qtr 1 Operating Insurance $100 $0
- 6. 01+02407/17/2011 01+024Monthly Budget - Detail Page 6 of 19
- 7. 01+02407/17/2011 01+024Monthly Budget - Detail Page 7 of 19 Variance Prior Year Prior Year Variance Actual - Prior Overview Click the arrow in $0 $0 $0 $0 any heading cell in this table for sort $0 $0 $0 $0 and filter options. $0 $0 $0 $0 $0 $0 $0 $0 $0 $0 $0 $0 $0 $0 $0 $0 $0 $0 $0 $0 $0 $0 $0 $0 $0 $0 $0 $0 Edit the data on this sh $0 $0 $0 $0 expense report and pr $0 $0 $0 $0 You can edit data in co $0 $0 $0 $0 and J are calculated au $0 $0 $0 $0 When you click in a ce $0 $0 $0 $0 list of options from wh $0 $0 $0 $0 Lookup Lists sheet in $0 $0 $0 $0 The bars shown in the $0 $0 $0 $0 formatting that update $0 $0 $0 $0 cost. $0 $0 $0 $0 $0 $0 $0 $0 $0 $0 $0 $0 $0 $0 $0 $0 $0 $0 $0 $0 $0 $0 $0 $0 $0 $0 $0 $0 $0 $0 $0 $0 $0 $0 $0 $0 $0 $0 $0 $0 $0 $0 $0 $0 $0 $0 $0 $0 $0 $0 $0 $0 $0 $0 $0 $0 $0 $0 $0 $0 $0 $0 $0 $0 $0 $0 $0 $0 $0 $0 $0 $0 $100 $0 $0 0 $0 $0 $0 0 $0 $0 $0 0 $0 $0 $0 0 $0 $0 $0 0
- 8. 01+02407/17/2011 01+024Monthly Budget - Detail Page 8 of 19 To add new items to the table, just start typing in the row directly beneath the table and the table expands automatically. The report sheets automatically recognize your additional data when the table expands.
- 9. 01+02407/17/2011 01+024Monthly Budget - Detail Page 9 of 19 arrow in ng cell in for sort options. t the data on this sheet with your own information to update the ense report and profit-loss summary sheets. u can edit data in columns A through E, and column H. Columns F, G, I, d J are calculated automatically. en you click in a cell in the Category and Line Item columns, you see a of options from which to select. You can edit those lists on the okup Lists sheet in this workbook. e bars shown in the Actual-Prior Overview column are conditional matting that updates to show the relative actual cost vs. prior year t.
- 10. 01+02407/17/2011 01+024Monthly Budget - Detail Page 10 of 19 items to the tart typing in the beneath the e table expands ly. The report matically our additional he table expands.
- 11. Annual Income Report Edit your income data on the Income Details sheet. W Projected Annual Revenue $520,491 you enter your data, the report that you see here upd automatically. Actual Annual Revenue $555,401 The table below is a PivotTable. After you update yo data on the Expense Details sheet, right-click in the and then click Refresh Data to update both the table Difference $34,910 the chart. Month (All) Qtr (All) Values Row Labels Estimated Total Actual Total Variance Total Net Sales $503,985 $539,678 $35,693 Interest Income $12,746 $11,888 ($858) Sale of Assets (Gain/Loss) $3,760 $3,835 $75 Totals $520,491 $555,401 $34,910
- 12. come data on the Income Details sheet. When our data, the report that you see here updates lly. elow is a PivotTable. After you update your Expense Details sheet, right-click in the table ick Refresh Data to update both the table and A PivotTable, such as the table at left, makes it easy for yo to look at your data in different ways. When you click in th Prior Year Total Prior Year Variance Total table, the PivotTable Builder window appears, from which $354,056 $185,622 you can add or remove fields from the table. $12,388 ($500) When you click in the PivotTable, a PivotTable tab also $3,319 $516 appears on the Ribbon above your workbook window, $369,763 $185,638 providing many options for formatting and editing the PivotTable.
- 13. ch as the table at left, makes it easy for you data in different ways. When you click in the Table Builder window appears, from which remove fields from the table. in the PivotTable, a PivotTable tab also Ribbon above your workbook window, options for formatting and editing the
- 14. 01+02407/17/2011 01+024Monthly Budget - Detail Page 14 of 19 Month Qtr Line Item Estimated Actual Variance Prior Year Prior Year Variance Actual - Prior Overview Click the arrow in January Qtr 1 Net Sales $180,000 $200,000 $20,000 $96,710 $103,290 $103,290 any heading cell in this table for sort February Qtr 1 Net Sales $18,570 $18,493 ($77) $15,992 $2,501 $2,501 and filter options. March Qtr 1 Net Sales $16,427 $16,768 $341 $9,070 $7,698 $7,698 April Qtr 2 Net Sales $18,867 $16,774 ($2,093) $16,267 $507 $507 May Qtr 2 Net Sales $17,453 $15,033 ($2,420) $16,417 ($1,384) ($1,384) June Qtr 2 Net Sales $15,904 $15,835 ($69) $15,465 $370 $370 July Qtr 3 Net Sales $15,328 $19,556 $4,228 $5,896 $13,660 $13,660 Edit the data on this sheet with your August Qtr 3 Net Sales $7,710 $5,823 ($1,887) $8,516 ($2,693) ($2,693) own information to update the income report and profit-loss summary September Qtr 3 Net Sales $7,026 $5,230 ($1,796) $5,988 ($758) ($758) sheets. October Qtr 4 Net Sales $6,700 $7,050 $350 $6,505 $545 $545 You can edit data in columns A November Qtr 4 Net Sales $80,000 $86,549 $6,549 $72,663 $13,886 $13,886 through E, and column G. Columns F, December Qtr 4 Net Sales $120,000 $132,567 $12,567 $84,567 $48,000 $48,000 H, and I are calculated automatically. January Qtr 1 Interest Income $2,000 $1,800 ($200) $1,178 $622 $622 When you click in a cell in the Line February Qtr 1 Interest Income $1,800 $1,930 $130 $1,942 ($12) ($12) Item column, you see a list of options March Qtr 1 Interest Income $810 $616 ($194) $906 ($290) ($290) from which to select. You can edit that list on the Lookup Lists sheet in this April Qtr 2 Interest Income $929 $1,075 $146 $944 $131 $131 workbook. May Qtr 2 Interest Income $862 $943 $81 $692 $251 $251 The bars shown in the Actual-Prior June Qtr 2 Interest Income $1,085 $568 ($517) $888 ($320) ($320) Overview column are conditional July Qtr 3 Interest Income $1,153 $887 ($266) $1,181 ($294) ($294) formatting that updates to show the relative actual income vs. prior year. August Qtr 3 Interest Income $546 $846 $300 $1,132 ($286) ($286) September Qtr 3 Interest Income $706 $720 $14 $1,073 ($353) ($353) October Qtr 4 Interest Income $923 $827 ($96) $1,056 ($229) ($229) November Qtr 4 Interest Income $793 $829 $36 $705 $124 $124 December Qtr 4 Interest Income $1,139 $847 ($292) $691 $156 $156 January Qtr 1 Sale of Assets (Gain/Loss) $0 $0 $0 $0 $0 $0 February Qtr 1 Sale of Assets (Gain/Loss) $800 $930 $130 $942 ($12) ($12) March Qtr 1 Sale of Assets (Gain/Loss) $0 $0 $0 $0 $0 $0 April Qtr 2 Sale of Assets (Gain/Loss) $929 $1,075 $146 $944 $131 $131 May Qtr 2 Sale of Assets (Gain/Loss) $862 $943 $81 $692 $251 $251 June Qtr 2 Sale of Assets (Gain/Loss) $0 $0 $0 $0 $0 $0 To add new items to the table, just start typing in the row directly July Qtr 3 Sale of Assets (Gain/Loss) $30 $40 $10 $50 ($10) ($10) beneath the table and the table August Qtr 3 Sale of Assets (Gain/Loss) $0 $0 $0 $0 $0 $0 expands automatically. The report sheets automatically recognize your September Qtr 3 Sale of Assets (Gain/Loss) $0 $0 $0 $0 $0 $0 additional data when the table October Qtr 4 Sale of Assets (Gain/Loss) $0 $0 $0 $0 $0 $0 expands. November Qtr 4 Sale of Assets (Gain/Loss) $0 $0 $0 $0 $0 $0 December Qtr 4 Sale of Assets (Gain/Loss) $1,139 $847 ($292) $691 $156 $156
- 15. Budget Line Item Lookup Budget Category Lookup Income Line Item Lookup Office Personnel Net Sales Store Operating Interest Income Salespeople Sale of Assets (Gain/Loss) Others Advertising Bad Debts Cash Discounts Delivery Costs Depreciation Dues and Subscriptions Employee Benefits Insurance Interest Legal and Auditing Maintenance and Repairs Office supplies Postage Rent or mortgage Sales expenses Shipping and storage Supplies Taxes Telephone Utilities
- 16. These lists populate the options that appear in the pop-up lists you see in the Expense Details and Income Details sheets. Edit the existing values as needed. To add additional values, begin typing in the cell directly beneath the last existing entry and the list will automatically expand.
- 17. DPCache Month Qtr Category Line Item January Qtr 1 Personnel Office January Qtr 1 Personnel Salespeople January Qtr 1 Operating Advertising January Qtr 1 Operating Delivery Costs January Qtr 1 Operating Legal and Auditing January Qtr 1 Operating Office supplies February Qtr 1 Personnel Office February Qtr 1 Personnel Salespeople February Qtr 1 Operating Advertising February Qtr 1 Operating Delivery Costs February Qtr 1 Operating Legal and Auditing February Qtr 1 Operating Office supplies March Qtr 1 Personnel Office March Qtr 1 Personnel Salespeople March Qtr 1 Operating Advertising March Qtr 1 Operating Delivery Costs March Qtr 1 Operating Legal and Auditing March Qtr 1 Operating Office supplies April Qtr 2 Personnel Office April Qtr 2 Personnel Salespeople April Qtr 2 Operating Advertising April Qtr 2 Operating Delivery Costs April Qtr 2 Operating Legal and Auditing April Qtr 2 Operating Office supplies May Qtr 2 Personnel Office May Qtr 2 Personnel Salespeople May Qtr 2 Operating Advertising May Qtr 2 Operating Delivery Costs May Qtr 2 Operating Legal and Auditing May Qtr 2 Operating Office supplies June Qtr 2 Personnel Office June Qtr 2 Personnel Salespeople June Qtr 2 Operating Advertising June Qtr 2 Operating Delivery Costs June Qtr 2 Operating Legal and Auditing June Qtr 2 Operating Office supplies June Qtr 2 Operating Utilities July Qtr 3 Personnel Office July Qtr 3 Personnel Salespeople July Qtr 3 Operating Advertising July Qtr 3 Operating Delivery Costs July Qtr 3 Operating Legal and Auditing Page 17
- 18. DPCache July Qtr 3 Operating Office supplies August Qtr 3 Personnel Office August Qtr 3 Personnel Salespeople August Qtr 3 Operating Advertising August Qtr 3 Operating Delivery Costs August Qtr 3 Operating Legal and Auditing August Qtr 3 Operating Office supplies September Qtr 3 Personnel Office September Qtr 3 Personnel Salespeople September Qtr 3 Operating Advertising September Qtr 3 Operating Delivery Costs September Qtr 3 Operating Legal and Auditing September Qtr 3 Operating Office supplies October Qtr 4 Personnel Office October Qtr 4 Personnel Salespeople October Qtr 4 Operating Advertising October Qtr 4 Operating Delivery Costs October Qtr 4 Operating Legal and Auditing October Qtr 4 Operating Office supplies November Qtr 4 Personnel Office November Qtr 4 Personnel Salespeople November Qtr 4 Operating Advertising November Qtr 4 Operating Delivery Costs November Qtr 4 Operating Legal and Auditing November Qtr 4 Operating Office supplies December Qtr 4 Personnel Office December Qtr 4 Personnel Salespeople December Qtr 4 Operating Advertising December Qtr 4 Operating Delivery Costs December Qtr 4 Operating Legal and Auditing December Qtr 4 Operating Office supplies January Qtr 1 Operating Insurance Page 18
- 19. DPCache_2 Month Qtr Line Item January Qtr 1 Net Sales February Qtr 1 Net Sales March Qtr 1 Net Sales April Qtr 2 Net Sales May Qtr 2 Net Sales June Qtr 2 Net Sales July Qtr 3 Net Sales August Qtr 3 Net Sales September Qtr 3 Net Sales October Qtr 4 Net Sales November Qtr 4 Net Sales December Qtr 4 Net Sales January Qtr 1 Interest Income February Qtr 1 Interest Income March Qtr 1 Interest Income April Qtr 2 Interest Income May Qtr 2 Interest Income June Qtr 2 Interest Income July Qtr 3 Interest Income August Qtr 3 Interest Income September Qtr 3 Interest Income October Qtr 4 Interest Income November Qtr 4 Interest Income December Qtr 4 Interest Income January Qtr 1 Sale of Assets (Gain/Loss) February Qtr 1 Sale of Assets (Gain/Loss) March Qtr 1 Sale of Assets (Gain/Loss) April Qtr 2 Sale of Assets (Gain/Loss) May Qtr 2 Sale of Assets (Gain/Loss) June Qtr 2 Sale of Assets (Gain/Loss) July Qtr 3 Sale of Assets (Gain/Loss) August Qtr 3 Sale of Assets (Gain/Loss) September Qtr 3 Sale of Assets (Gain/Loss) October Qtr 4 Sale of Assets (Gain/Loss) November Qtr 4 Sale of Assets (Gain/Loss) December Qtr 4 Sale of Assets (Gain/Loss) Page 19