
Recommended
Recommended
More Related Content
What's hot
What's hot (10)
Viewers also liked
Viewers also liked (7)
Similar to Stanford Presentation to GISSIG
Similar to Stanford Presentation to GISSIG (20)
Recently uploaded
Recently uploaded (20)
Stanford Presentation to GISSIG
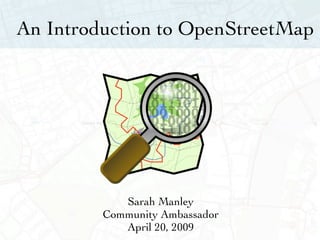
- 1. An Introduction to OpenStreetMap Sarah Manley Community Ambassador April 20, 2009
- 2. My Background 2
- 3. My Background 3
- 4. My Background 4
- 5. Why maps? “Because maps are a visual tool for sharing information with others. Because they can be produced by many people and combined together to tell stories about complex relationships. Because maps are never finished and only tell part of a story that can constantly be expanded upon. Because power exists in space, struggle exists in space and we exist in space. Because we cannot know where we are going if we do not know where we are from.” - Notes for a People’s Atlas of Chicago http://chicagoatlas.areaprojects.com/about/ 5
- 6. Perception 6
- 7. Discovery 7
- 8. Land Use 8
- 9. Navigation 9
- 10. Organization 10
- 11. Organization 11
- 12. Artistic
- 13. Artistic
- 14. Why Mapping? “ Certainly we wanted to use the mapping to help us figure out what a neighborhood was, but we also wanted to use the mapping as a kind of organizational tool, as a way of bringing the neighborhood together and helping it to see itself.” - Denis Wood, The Power of Maps 14
- 15. Artistic 15
- 16. How accessible are current maps? 16
- 17. How accessible are current maps? • Costly • Closed • Often out of date 17
- 19. How accessible are current maps? • Costly • Closed • Often out of date 19
- 20. Copyrighted 20
- 21. Norman Dennison, director of Geographers' A-Z Map Company, confirms that Lye Close is a lie, which will now be removed. quot;The idea is to put something on the map to protect copyright,quot; he says. quot;We try to put it in an area or a part of a road which would not be misleading to the ordinary person in the street. They have been put in out- of-the-way places.quot; 21
- 22. How accessible are current maps? • Costly • Closed • Often out of date 22
- 23. Google screen capture: 16 Jan 2009 23
- 24. OSM screen capture: 16 Jan 2009 24
- 25. A thought... “If you don’t make [lower-resolution mapping data] publicly available, there will be people with their cars and GPS devices, driving around with their laptops .. They will be cataloguing every lane, and enjoying it, driving 4×4s behind your farm at the dead of night. There will, if necessary, be a grass-roots remapping.” Tim Berners-Lee 25
- 26. How is OpenStreetMap different? 26
- 27. quot;OpenStreetMap is a project aimed squarely at creating and providing free geographic data such as street maps to anyone who wants them.quot; openstreetmap.org 27
- 28. So what are the benefits? • It’s Free • It’s Open • It’s as current as the contributers make it 28 28
- 29. Where can you use OSM? 29
- 30. How is OSM data being used? 30
- 31. How is OSM data being used? 31
- 32. So what are the benefits? • It’s Free • It’s Open • It’s as current as the contributers make it 32 32
- 33. How is it open? ODBL 33
- 34. So what are the benefits? • It’s Free • It’s Open • It’s as current as the contributers make it 36 34
- 35. “You could have a community capability where you took the GPS data of people driving around and started to see, oh, there’s a new road that we don’t have, a new route .. And so that data eventually should just come from the community with the right software infrastructure.” - Bill Gates 35
- 36. OSM contributors 36
- 37. 37
- 48. Public Domain Map Data TIGER Data: Topologically Integrated Geographic Encoding and Referencing system 48
- 49. Chicago
- 50. New Orleans 50
- 51. 51
- 52. London
- 53. Berlin
- 55. Almere, Holland 55
- 56. Sydney
- 57. Johannesburg
- 58. aghdad
- 59. Non-Traditional Online Maps 59
- 60. You can map what matters to you 60
- 61. Burning Man 61
- 62. Map Rendering and Cartography 62
- 63. Mapnik
- 64. Osmarender
- 65. Cycle Map
- 66. No Name
- 67. Maplint
- 68. OpenStreetBug
- 69. Map Comparison: http://tools.geofabrik.de/mc/ : Map Compare 69
- 70. How do you (and others) get involved? 70
- 71. Contribute to Potlatch- the online editor 71
- 72. You can edit from home 72
- 73. You can edit from home 73
- 74. You can edit from home 74
- 75. You can edit from home 75
- 76. You can edit from home 76
- 77. Labeling in the Map 77
- 78. How do you map with OSM? 78
- 79. Record Observations 79
- 80. Grab data off of GPS 80
- 81. Grab data off of GPS 81
- 82. JOSM= Java OpenStreetMap 82
- 83. JOSM Preferences 83
- 84. Map with your GPS 84
- 85. Map with your GPS 85
- 86. Edit the data 86
- 87. Edit the data 87
- 88. Geotagging Photos & Audio 88
- 89. Geotagging Photos & Audio 89
- 90. Upload and Render 90
- 91. How do people map? 91
- 92. Or map as a community 92
- 93. Global Events: July 10 -12, 2009: Amsterdam 71 93
- 94. Open Source Curriculum Initiative •Focused on introducing students to • community based mapping • cartography in the web 2.0 • open source data • crowd sourcing projects • integrating maps into art, humanities, and other disciplines 94
- 95. Available • http://wiki.openstreetmap.org/wiki/Education • will be posted on ccLearn, connexions, curriki • suggestions? 95
- 96. Questions? 96
- 97. Thank you Sarah Manley Bay Area Community Ambassador Sarah@cloudmade.com Next event: May 9 & 10: Santa Cruz Mapping Party wiki.openstreetmap.org 97
- 98. 98
- 99. 99
Editor's Notes
- this is then an integrated map... tah-dah! red is one day blue is another day black is the compilation Cabspotting did this for San Francisco (note for us) match this up with a map of london this has been done for every major city in the world now. to position in three dimensions, you need at least 4 transmitters the distance each transmission travels through the atmosphere (at different angles depending on where the satellite is and the direction it is traveling around the earth WAAS (wide area augmentation system) EGNOS (European system)
- this is then an integrated map... tah-dah! red is one day blue is another day black is the compilation Cabspotting did this for San Francisco (note for us) match this up with a map of london this has been done for every major city in the world now. to position in three dimensions, you need at least 4 transmitters the distance each transmission travels through the atmosphere (at different angles depending on where the satellite is and the direction it is traveling around the earth WAAS (wide area augmentation system) EGNOS (European system)
- Artistic map-- such as this---http://sf.biomapping.net/map.htm
- this is london we are zooming in we are using Google tile format this is all community sourced
- this is london we are zooming in we are using Google tile format this is all community sourced
- Talk about TIGER data (we may want a big section on tiger data. tiger data does not have one ways wtc site ferrys explain where tiger comes from why we use it how we improve it.
- this slide is great because it shows the details of the central area but then on the left you can see there are sections of town not yet done like wikipedia in the early days the bookends were finished first, then the volumes were filled out.
- all this was marked with gps, they’ve even marked each individual bus stop
- this slide is great because it shows the details of the central area but then on the left you can see there are sections of town not yet done like wikipedia in the early days the bookends were finished first, then the volumes were filled out.
- this was done by armchair mappers using potlatch, the OSM editor, this was done by folks in their own homes using Yahoo Aerial Imagery
- feel free to change this format and screen shot
- feel free to change this format and screen shot
- feel free to change this format and screen shot
- feel free to change this format and screen shot
- feel free to change this format and screen shot-- not sure again about google screen shot here
- not sure if i need to get permission from these folks
- not sure if i need to get permission from these folks