SlideShare a Scribd company logo
1 of 2
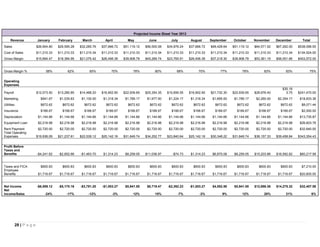
Projected Income Sheet Year 2013
Revenue

January

February

March

April

May

June

July

August

September

October

November

December

Total

Sales

$26,904.80

$29,595.28

$32,285.76

$37,666.72

$51,119.12

$56,500.08

$34,976.24

$37,666.72

$48,428.64

$51,119.12

$64,571.52

$67,262.00

$538,096.00

Cost of Sales

$11,210.33

$11,210.33

$11,210.34

$11,210.33

$11,210.33

$11,210.34

$11,210.33

$11,210.33

$11,210.34

$11,210.33

$11,210.33

$11,210.34

$134,524.00

Gross Margin

$15,694.47

$18,384.95

$21,075.42

$26,456.39

$39,908.79

$45,289.74

$23,765.91

$26,456.39

$37,218.30

$39,908.79

$53,361.19

$56,051.66

$403,572.00

58%

62%

65%

70%

78%

80%

68%

70%

77%

78%

83%

83%

75%

$12,073.50

$13,280.85

$14,488.20

$16,902.90

$22,939.65

$25,354.35

$15,695.55

$16,902.90

$21,732.30

$22,939.65

$28,976.40

$30,18
3.75

$241,470.00

Marketing

$941.67

$1,035.83

$1,130.00

$1,318.34

$1,789.17

$1,977.50

$1,224.17

$1,318.34

$1,695.00

$1,789.17

$2,260.00

$2,354.17

$18,833.36

Utilities

$672.62

$672.62

$672.62

$672.62

$672.62

$672.62

$672.62

$672.62

$672.62

$672.62

$672.62

$672.62

$8,071.44

Insurance

$166.67

$166.67

$166.67

$166.67

$166.67

$166.67

$166.67

$166.67

$166.67

$166.67

$166.67

$166.67

$2,000.00

Depreciation

$1,144.66

$1,144.66

$1,144.66

$1,144.66

$1,144.66

$1,144.66

$1,144.66

$1,144.66

$1,144.66

$1,144.66

$1,144.66

$1,144.66

$13,735.87

Equipment Loan

$2,216.98

$2,216.98

$2,216.98

$2,216.98

$2,216.98

$2,216.98

$2,216.98

$2,216.98

$2,216.98

$2,216.98

$2,216.98

$2,216.98

$26,603.76

Rent Payment
Total Operating
Expenses

$2,720.00

$2,720.00

$2,720.00

$2,720.00

$2,720.00

$2,720.00

$2,720.00

$2,720.00

$2,720.00

$2,720.00

$2,720.00

$2,720.00

$32,640.00

$19,936.09

$21,237.61

$22,539.12

$25,142.16

$31,649.74

$34,252.77

$23,840.64

$25,142.16

$30,348.22

$31,649.74

$38,157.33

$39,458.84

$343,354.43

Profit Before
Taxes and
Benefits

-$4,241.62

-$2,852.66

-$1,463.70

$1,314.23

$8,259.05

$11,036.97

-$74.73

$1,314.23

$6,870.08

$8,259.05

$15,203.86

$16,592.82

$60,217.58

$600.83

$600.83

$600.83

$600.83

$600.83

$600.83

$600.83

$600.83

$600.83

$600.83

$600.83

$600.83

$7,210.00

$1,716.67

$1,716.67

$1,716.67

$1,716.67

$1,716.67

$1,716.67

$1,716.67

$1,716.67

$1,716.67

$1,716.67

$1,716.67

$1,716.67

$20,600.00

-$6,559.12

-$5,170.16

-$3,781.20

-$1,003.27

$5,941.55

$8,719.47

-$2,392.23

-$1,003.27

$4,552.58

$5,941.55

$12,886.36

$14,275.32

$32,407.58

-24%

-17%

-12%

-3%

12%

15%

-7%

-3%

9%

12%

20%

21%

6%

Gross Margin %
Operating
Expenses
Payroll

Taxes and FICA
Employee
Benefits

Net Income
Net
Income/Sales

28 | P a g e
Projected Cash Flow Year 2013
January
Cash Received

February

March

April

May

June

July

August

September

October

November

December

$0.00

$0.00

$0.00

$0.00

$0.00

$0.00

$0.00

$0.00

$0.00

$0.00

$0.00

$0.00

Cash Sales

$26,904.80

$29,595.28

$32,285.76

$37,666.72

$51,119.12

$56,500.08

$34,976.24

$37,666.72

$48,428.64

$51,119.12

$64,571.52

$67,262.00

Subtotal Cash from Operations

$26,904.80

$29,595.28

$32,285.76

$37,666.72

$51,119.12

$56,500.08

$34,976.24

$37,666.72

$48,428.64

$51,119.12

$64,571.52

$67,262.00

Additional Cash Received
Sales Tax, VAT, HST/GST Received

$1,345.24

$1,479.76

$1,614.29

$1,883.34

$2,555.96

$2,825.00

$1,748.81

$1,883.34

$2,421.43

$2,555.96

$3,228.58

$3,363.10

$25,000.00

$0.00

$0.00

$0.00

$0.00

$0.00

$0.00

$0.00

$0.00

$0.00

$0.00

$0.00

$0.00

$0.00

$0.00

$0.00

$0.00

$0.00

$0.00

$0.00

$0.00

$0.00

$0.00

$0.00

$53,250.04

$31,075.04

$33,900.05

$39,550.06

$53,675.08

$59,325.08

$36,725.05

$39,550.06

$50,850.07

$53,675.08

$67,800.10

$70,625.10

Cash Spending

$21,108.93

$22,410.45

$23,711.97

$26,315.00

$32,822.59

$35,425.62

$25,013.49

$26,315.00

$31,521.07

$32,822.59

$39,330.17

$40,631.69

Bill Payments

$11,210.33

$11,210.33

$11,210.34

$11,210.33

$11,210.33

$11,210.34

$11,210.33

$11,210.33

$11,210.34

$11,210.33

$11,210.33

$11,210.34

Depreciation

$1,144.66

$1,144.66

$1,144.66

$1,144.66

$1,144.66

$1,144.66

$1,144.66

$1,144.66

$1,144.66

$1,144.66

$1,144.66

$1,144.66

$33,463.92

$34,765.44

$36,066.96

$38,669.99

$45,177.57

$47,780.61

$37,368.47

$38,669.99

$43,876.06

$45,177.57

$51,685.16

$52,986.68

$1,345.24

$1,479.76

$1,614.29

$1,883.34

$2,555.96

$2,825.00

$1,748.81

$1,883.34

$2,421.43

$2,555.96

$3,228.58

$3,363.10

$0.00

$0.00

$0.00

$0.00

$0.00

$0.00

$0.00

$0.00

$0.00

$0.00

$0.00

$25,000.00

New Current Borrowing
New Investment Received
Total Cash Received

Expenditures

Subtotal Spent on Operations

Additional Cash Spent
Sales Tax, VAT, HST/GST Paid Out
Other Liabilities Principal Repayment
Subtotal Cash Spent

$1,345.24

$1,479.76

$1,614.29

$1,883.34

$2,555.96

$2,825.00

$1,748.81

$1,883.34

$2,421.43

$2,555.96

$3,228.58

$28,363.10

Total Cash Spent

$34,809.16

$36,245.20

$37,681.25

$40,553.32

$47,733.53

$50,605.62

$39,117.28

$40,553.32

$46,297.50

$47,733.53

$54,913.73

$81,349.78

Net Cash Flow

$18,440.88

-$5,170.16

-$3,781.20

-$1,003.27

$5,941.55

$8,719.47

-$2,392.23

-$1,003.27

$4,552.58

$5,941.55

$12,886.36

-$10,724.68

Cash Balance

$18,440.88

$13,270.72

$9,489.52

$8,486.25

$14,427.80

$23,147.27

$20,755.04

$19,751.77

$24,304.34

$30,245.89

$43,132.26

$32,407.58

29 | P a g e

More Related Content

Similar to 2013 Projected Income & Expenses Sheet

CalculationsLost Profit and Royalty Calculations2010201120122013Un.docx
CalculationsLost Profit and Royalty Calculations2010201120122013Un.docxCalculationsLost Profit and Royalty Calculations2010201120122013Un.docx
CalculationsLost Profit and Royalty Calculations2010201120122013Un.docxhumphrieskalyn
 
Understanding Profitability in the Affiliate Space
Understanding Profitability in the Affiliate SpaceUnderstanding Profitability in the Affiliate Space
Understanding Profitability in the Affiliate SpaceAffiliate Summit
 
Financial Forecasting
Financial ForecastingFinancial Forecasting
Financial ForecastingTravonnLee
 
Quartely_Sales_With_Pivot_Table
Quartely_Sales_With_Pivot_TableQuartely_Sales_With_Pivot_Table
Quartely_Sales_With_Pivot_TableAnand Chokshi
 
Financial Review 05.31.09
Financial Review 05.31.09Financial Review 05.31.09
Financial Review 05.31.09Dan_Marengo
 
Angelica's boutique alec schlotfeldt
Angelica's boutique alec schlotfeldtAngelica's boutique alec schlotfeldt
Angelica's boutique alec schlotfeldtDebbieSchlotfeldt
 
Graphs 4444565e5545454654545
Graphs 4444565e5545454654545Graphs 4444565e5545454654545
Graphs 4444565e5545454654545blanchardschool
 
Financial Forecasting
Financial ForecastingFinancial Forecasting
Financial ForecastingJamariHodges1
 
Taganas chap 2 lab 1
Taganas chap 2 lab 1Taganas chap 2 lab 1
Taganas chap 2 lab 1taganas
 
Go chap2 lab1
Go chap2 lab1Go chap2 lab1
Go chap2 lab1jonelgo
 
Week5businessplan
Week5businessplanWeek5businessplan
Week5businessplanjeanette_
 
Swifton - The Capital Network - Financial Projections
Swifton - The Capital Network - Financial ProjectionsSwifton - The Capital Network - Financial Projections
Swifton - The Capital Network - Financial ProjectionsDavid Fogel
 

Similar to 2013 Projected Income & Expenses Sheet (20)

CalculationsLost Profit and Royalty Calculations2010201120122013Un.docx
CalculationsLost Profit and Royalty Calculations2010201120122013Un.docxCalculationsLost Profit and Royalty Calculations2010201120122013Un.docx
CalculationsLost Profit and Royalty Calculations2010201120122013Un.docx
 
Understanding Profitability in the Affiliate Space
Understanding Profitability in the Affiliate SpaceUnderstanding Profitability in the Affiliate Space
Understanding Profitability in the Affiliate Space
 
Financial Forecasting
Financial ForecastingFinancial Forecasting
Financial Forecasting
 
Quartely_Sales_With_Pivot_Table
Quartely_Sales_With_Pivot_TableQuartely_Sales_With_Pivot_Table
Quartely_Sales_With_Pivot_Table
 
Trabajo dennis y sarai
Trabajo dennis y saraiTrabajo dennis y sarai
Trabajo dennis y sarai
 
Flujo de caja empresa flashproyect
Flujo de caja empresa flashproyectFlujo de caja empresa flashproyect
Flujo de caja empresa flashproyect
 
Financial Review 05.31.09
Financial Review 05.31.09Financial Review 05.31.09
Financial Review 05.31.09
 
Angelica's boutique alec schlotfeldt
Angelica's boutique alec schlotfeldtAngelica's boutique alec schlotfeldt
Angelica's boutique alec schlotfeldt
 
Graphs 123456789 CHSZ
Graphs 123456789 CHSZGraphs 123456789 CHSZ
Graphs 123456789 CHSZ
 
Graphs 4444565e5545454654545
Graphs 4444565e5545454654545Graphs 4444565e5545454654545
Graphs 4444565e5545454654545
 
Graphs 123456789 CHSZ
Graphs 123456789 CHSZGraphs 123456789 CHSZ
Graphs 123456789 CHSZ
 
Financial Forecasting
Financial ForecastingFinancial Forecasting
Financial Forecasting
 
Taganas chap 2 lab 1
Taganas chap 2 lab 1Taganas chap 2 lab 1
Taganas chap 2 lab 1
 
Go chap2 lab1
Go chap2 lab1Go chap2 lab1
Go chap2 lab1
 
Week5businessplan
Week5businessplanWeek5businessplan
Week5businessplan
 
Graphs nnn
Graphs nnnGraphs nnn
Graphs nnn
 
Graphs 34
Graphs 34Graphs 34
Graphs 34
 
Finemore
FinemoreFinemore
Finemore
 
Profit blueprint
Profit blueprintProfit blueprint
Profit blueprint
 
Swifton - The Capital Network - Financial Projections
Swifton - The Capital Network - Financial ProjectionsSwifton - The Capital Network - Financial Projections
Swifton - The Capital Network - Financial Projections
 

More from sakurashu28

Feasibility Study- Bakery
Feasibility Study- BakeryFeasibility Study- Bakery
Feasibility Study- Bakerysakurashu28
 
Pineapple Resort Business Plan
Pineapple Resort Business PlanPineapple Resort Business Plan
Pineapple Resort Business Plansakurashu28
 
Pineapple Resort Business Plan
Pineapple Resort Business PlanPineapple Resort Business Plan
Pineapple Resort Business Plansakurashu28
 
Fairmont Hotel Financial Statements
Fairmont Hotel Financial StatementsFairmont Hotel Financial Statements
Fairmont Hotel Financial Statementssakurashu28
 
Financial Analysis Fairmont Hotel
Financial Analysis Fairmont HotelFinancial Analysis Fairmont Hotel
Financial Analysis Fairmont Hotelsakurashu28
 
Bolger Center PPT
Bolger Center PPTBolger Center PPT
Bolger Center PPTsakurashu28
 
Final decor and centerpiece proposal
Final  decor and centerpiece proposalFinal  decor and centerpiece proposal
Final decor and centerpiece proposalsakurashu28
 

More from sakurashu28 (7)

Feasibility Study- Bakery
Feasibility Study- BakeryFeasibility Study- Bakery
Feasibility Study- Bakery
 
Pineapple Resort Business Plan
Pineapple Resort Business PlanPineapple Resort Business Plan
Pineapple Resort Business Plan
 
Pineapple Resort Business Plan
Pineapple Resort Business PlanPineapple Resort Business Plan
Pineapple Resort Business Plan
 
Fairmont Hotel Financial Statements
Fairmont Hotel Financial StatementsFairmont Hotel Financial Statements
Fairmont Hotel Financial Statements
 
Financial Analysis Fairmont Hotel
Financial Analysis Fairmont HotelFinancial Analysis Fairmont Hotel
Financial Analysis Fairmont Hotel
 
Bolger Center PPT
Bolger Center PPTBolger Center PPT
Bolger Center PPT
 
Final decor and centerpiece proposal
Final  decor and centerpiece proposalFinal  decor and centerpiece proposal
Final decor and centerpiece proposal
 

2013 Projected Income & Expenses Sheet

  • 1. Projected Income Sheet Year 2013 Revenue January February March April May June July August September October November December Total Sales $26,904.80 $29,595.28 $32,285.76 $37,666.72 $51,119.12 $56,500.08 $34,976.24 $37,666.72 $48,428.64 $51,119.12 $64,571.52 $67,262.00 $538,096.00 Cost of Sales $11,210.33 $11,210.33 $11,210.34 $11,210.33 $11,210.33 $11,210.34 $11,210.33 $11,210.33 $11,210.34 $11,210.33 $11,210.33 $11,210.34 $134,524.00 Gross Margin $15,694.47 $18,384.95 $21,075.42 $26,456.39 $39,908.79 $45,289.74 $23,765.91 $26,456.39 $37,218.30 $39,908.79 $53,361.19 $56,051.66 $403,572.00 58% 62% 65% 70% 78% 80% 68% 70% 77% 78% 83% 83% 75% $12,073.50 $13,280.85 $14,488.20 $16,902.90 $22,939.65 $25,354.35 $15,695.55 $16,902.90 $21,732.30 $22,939.65 $28,976.40 $30,18 3.75 $241,470.00 Marketing $941.67 $1,035.83 $1,130.00 $1,318.34 $1,789.17 $1,977.50 $1,224.17 $1,318.34 $1,695.00 $1,789.17 $2,260.00 $2,354.17 $18,833.36 Utilities $672.62 $672.62 $672.62 $672.62 $672.62 $672.62 $672.62 $672.62 $672.62 $672.62 $672.62 $672.62 $8,071.44 Insurance $166.67 $166.67 $166.67 $166.67 $166.67 $166.67 $166.67 $166.67 $166.67 $166.67 $166.67 $166.67 $2,000.00 Depreciation $1,144.66 $1,144.66 $1,144.66 $1,144.66 $1,144.66 $1,144.66 $1,144.66 $1,144.66 $1,144.66 $1,144.66 $1,144.66 $1,144.66 $13,735.87 Equipment Loan $2,216.98 $2,216.98 $2,216.98 $2,216.98 $2,216.98 $2,216.98 $2,216.98 $2,216.98 $2,216.98 $2,216.98 $2,216.98 $2,216.98 $26,603.76 Rent Payment Total Operating Expenses $2,720.00 $2,720.00 $2,720.00 $2,720.00 $2,720.00 $2,720.00 $2,720.00 $2,720.00 $2,720.00 $2,720.00 $2,720.00 $2,720.00 $32,640.00 $19,936.09 $21,237.61 $22,539.12 $25,142.16 $31,649.74 $34,252.77 $23,840.64 $25,142.16 $30,348.22 $31,649.74 $38,157.33 $39,458.84 $343,354.43 Profit Before Taxes and Benefits -$4,241.62 -$2,852.66 -$1,463.70 $1,314.23 $8,259.05 $11,036.97 -$74.73 $1,314.23 $6,870.08 $8,259.05 $15,203.86 $16,592.82 $60,217.58 $600.83 $600.83 $600.83 $600.83 $600.83 $600.83 $600.83 $600.83 $600.83 $600.83 $600.83 $600.83 $7,210.00 $1,716.67 $1,716.67 $1,716.67 $1,716.67 $1,716.67 $1,716.67 $1,716.67 $1,716.67 $1,716.67 $1,716.67 $1,716.67 $1,716.67 $20,600.00 -$6,559.12 -$5,170.16 -$3,781.20 -$1,003.27 $5,941.55 $8,719.47 -$2,392.23 -$1,003.27 $4,552.58 $5,941.55 $12,886.36 $14,275.32 $32,407.58 -24% -17% -12% -3% 12% 15% -7% -3% 9% 12% 20% 21% 6% Gross Margin % Operating Expenses Payroll Taxes and FICA Employee Benefits Net Income Net Income/Sales 28 | P a g e
  • 2. Projected Cash Flow Year 2013 January Cash Received February March April May June July August September October November December $0.00 $0.00 $0.00 $0.00 $0.00 $0.00 $0.00 $0.00 $0.00 $0.00 $0.00 $0.00 Cash Sales $26,904.80 $29,595.28 $32,285.76 $37,666.72 $51,119.12 $56,500.08 $34,976.24 $37,666.72 $48,428.64 $51,119.12 $64,571.52 $67,262.00 Subtotal Cash from Operations $26,904.80 $29,595.28 $32,285.76 $37,666.72 $51,119.12 $56,500.08 $34,976.24 $37,666.72 $48,428.64 $51,119.12 $64,571.52 $67,262.00 Additional Cash Received Sales Tax, VAT, HST/GST Received $1,345.24 $1,479.76 $1,614.29 $1,883.34 $2,555.96 $2,825.00 $1,748.81 $1,883.34 $2,421.43 $2,555.96 $3,228.58 $3,363.10 $25,000.00 $0.00 $0.00 $0.00 $0.00 $0.00 $0.00 $0.00 $0.00 $0.00 $0.00 $0.00 $0.00 $0.00 $0.00 $0.00 $0.00 $0.00 $0.00 $0.00 $0.00 $0.00 $0.00 $0.00 $53,250.04 $31,075.04 $33,900.05 $39,550.06 $53,675.08 $59,325.08 $36,725.05 $39,550.06 $50,850.07 $53,675.08 $67,800.10 $70,625.10 Cash Spending $21,108.93 $22,410.45 $23,711.97 $26,315.00 $32,822.59 $35,425.62 $25,013.49 $26,315.00 $31,521.07 $32,822.59 $39,330.17 $40,631.69 Bill Payments $11,210.33 $11,210.33 $11,210.34 $11,210.33 $11,210.33 $11,210.34 $11,210.33 $11,210.33 $11,210.34 $11,210.33 $11,210.33 $11,210.34 Depreciation $1,144.66 $1,144.66 $1,144.66 $1,144.66 $1,144.66 $1,144.66 $1,144.66 $1,144.66 $1,144.66 $1,144.66 $1,144.66 $1,144.66 $33,463.92 $34,765.44 $36,066.96 $38,669.99 $45,177.57 $47,780.61 $37,368.47 $38,669.99 $43,876.06 $45,177.57 $51,685.16 $52,986.68 $1,345.24 $1,479.76 $1,614.29 $1,883.34 $2,555.96 $2,825.00 $1,748.81 $1,883.34 $2,421.43 $2,555.96 $3,228.58 $3,363.10 $0.00 $0.00 $0.00 $0.00 $0.00 $0.00 $0.00 $0.00 $0.00 $0.00 $0.00 $25,000.00 New Current Borrowing New Investment Received Total Cash Received Expenditures Subtotal Spent on Operations Additional Cash Spent Sales Tax, VAT, HST/GST Paid Out Other Liabilities Principal Repayment Subtotal Cash Spent $1,345.24 $1,479.76 $1,614.29 $1,883.34 $2,555.96 $2,825.00 $1,748.81 $1,883.34 $2,421.43 $2,555.96 $3,228.58 $28,363.10 Total Cash Spent $34,809.16 $36,245.20 $37,681.25 $40,553.32 $47,733.53 $50,605.62 $39,117.28 $40,553.32 $46,297.50 $47,733.53 $54,913.73 $81,349.78 Net Cash Flow $18,440.88 -$5,170.16 -$3,781.20 -$1,003.27 $5,941.55 $8,719.47 -$2,392.23 -$1,003.27 $4,552.58 $5,941.55 $12,886.36 -$10,724.68 Cash Balance $18,440.88 $13,270.72 $9,489.52 $8,486.25 $14,427.80 $23,147.27 $20,755.04 $19,751.77 $24,304.34 $30,245.89 $43,132.26 $32,407.58 29 | P a g e