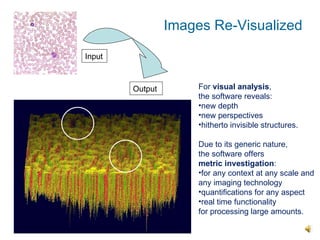
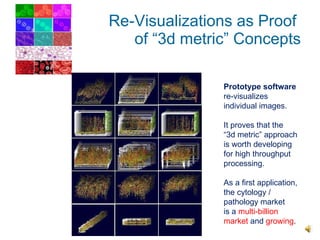
“ Software Lenses” A New Instrument of Investigation  to Analyze Single Images and Process High Throughput
The human mind is a poor instrument  for processing large series of images.  “ Software Lenses” combine visual analysis algorithms with semi-automatic image contexts  and innovative “ image metrics ”. The Problem and the Solution
Image metrics  are interpreted  by expert users  to  study short series find averages  and determine  reference values. Embedding Human Expertise Output Input
Reference values   are used  by less skilled users  to select particular images  between specific ranges for varying visualization parameters and metric variables.  Supporting Decisions Association Output Type of Images Patterns Shape Size Lower Limit Upper Limit Project Series Metrics 1 Metrics 2 Select Criterion 1 Select Criterion 2 Cytology Average  Dye Colour Average  Cell Size Dye Colour Cell Size Volvox cells 0.111 11 0.1234 0.15 Stem cells 0.222 22 0.2345 0.26 Sickle cells 0.333 33 0.3456 0.37 Blood cells 0.444 44 0.4567 0.48 Red blood cells 0.555 55 0.5678 0.59
Output For  visual analysis ,  the software reveals: new depth new perspectives hitherto invisible structures. Due to its generic nature,  the software offers  metric investigation : for any context at any scale and any imaging technology quantifications for any aspect real time functionality  for processing large amounts. Input Images Re-Visualized
Re-Visualizations as Proof  of “3d metric” Concepts Prototype software  re-visualizes individual images. It proves that the  “3d metric” approach is worth developing for high throughput processing. As a first application, the cytology / pathology market  is a  multi-billion market  and  growing .

Software Lenses

  • 1.
    “ Software Lenses”A New Instrument of Investigation to Analyze Single Images and Process High Throughput
  • 2.
    The human mindis a poor instrument for processing large series of images. “ Software Lenses” combine visual analysis algorithms with semi-automatic image contexts and innovative “ image metrics ”. The Problem and the Solution
  • 3.
    Image metrics are interpreted by expert users to study short series find averages and determine reference values. Embedding Human Expertise Output Input
  • 4.
    Reference values are used by less skilled users to select particular images between specific ranges for varying visualization parameters and metric variables. Supporting Decisions Association Output Type of Images Patterns Shape Size Lower Limit Upper Limit Project Series Metrics 1 Metrics 2 Select Criterion 1 Select Criterion 2 Cytology Average Dye Colour Average Cell Size Dye Colour Cell Size Volvox cells 0.111 11 0.1234 0.15 Stem cells 0.222 22 0.2345 0.26 Sickle cells 0.333 33 0.3456 0.37 Blood cells 0.444 44 0.4567 0.48 Red blood cells 0.555 55 0.5678 0.59
  • 5.
    Output For visual analysis , the software reveals: new depth new perspectives hitherto invisible structures. Due to its generic nature, the software offers metric investigation : for any context at any scale and any imaging technology quantifications for any aspect real time functionality for processing large amounts. Input Images Re-Visualized
  • 6.
    Re-Visualizations as Proof of “3d metric” Concepts Prototype software re-visualizes individual images. It proves that the “3d metric” approach is worth developing for high throughput processing. As a first application, the cytology / pathology market is a multi-billion market and growing .