Commodity technical analysis for 2nd week september 2013
•
1 like•559 views

Gold and silver futures posted the biggest weekly drops since June on speculation that the Federal Reserve will cut fiscal stimulus next week, while talks started on a plan for Syria to surrender its chemical weapons.

Recommended
Recommended
More Related Content
What's hot
What's hot (20)
Viewers also liked
Viewers also liked (13)
Similar to Commodity technical analysis for 2nd week september 2013
Similar to Commodity technical analysis for 2nd week september 2013 (20)
More from RR Finance
More from RR Finance (8)
Recently uploaded
Recently uploaded (20)
Commodity technical analysis for 2nd week september 2013
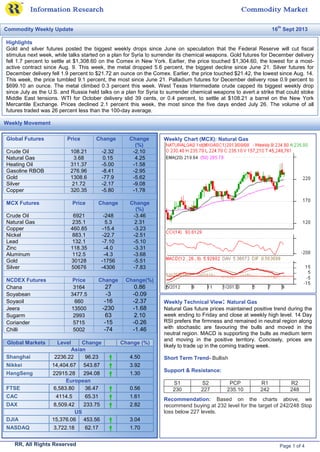
- 1. Equity Global Futures Price Change Change (%) Crude Oil 108.21 -2.32 -2.10 Natural Gas 3.68 0.15 4.25 Heating Oil 311.37 -5.00 -1.58 Gasoline RBOB 276.96 -8.41 -2.95 Gold 1308.6 -77.9 -5.62 Silver 21.72 -2.17 -9.08 Copper 320.35 -5.80 -1.78 MCX Futures Price Change Change (%) Crude Oil 6921 -248 -3.46 Natural Gas 235.1 5.3 2.31 Copper 460.85 -15.4 -3.23 Nickel 883.1 -22.7 -2.51 Lead 132.1 -7.10 -5.10 Zinc 118.35 -4.0 -3.31 Aluminum 112.5 -4.3 -3.68 Gold 30128 -1756 -5.51 Silver 50676 -4306 -7.83 NCDEX Futures Price Change Change(%) Chana 3164 27 0.86 Soyabean 3477.5 -3 -0.09 Soyaoil 660 -16 -2.37 Jeera 13500 -230 -1.68 Sugarm 2993 63 2.10 Coriander 5715 -15 -0.26 Chilli 5002 -74 -1.46 Global Markets Level Change Change (%) Asian Shanghai 2236.22 96.23 4.50 Nikkei 14,404.67 543.87 3.92 HangSeng 22915.28 294.08 1.30 European FTSE 6,583.80 36.47 0.56 CAC 4114.5 65.31 1.61 DAX 8,509.42 233.75 2.82 US DJIA 15,376.06 453.56 3.04 NASDAQ 3,722.18 62.17 1.70 Weekly Chart (MCX): Natural Gas x Highlights Gold and silver futures posted the biggest weekly drops since June on speculation that the Federal Reserve will cut fiscal stimulus next week, while talks started on a plan for Syria to surrender its chemical weapons. Gold futures for December delivery fell 1.7 percent to settle at $1,308.60 on the Comex in New York. Earlier, the price touched $1,304.60, the lowest for a most- active contract since Aug. 9. This week, the metal dropped 5.6 percent, the biggest decline since June 21. Silver futures for December delivery fell 1.9 percent to $21.72 an ounce on the Comex. Earlier, the price touched $21.42, the lowest since Aug. 14. This week, the price tumbled 9.1 percent, the most since June 21. Palladium futures for December delivery rose 0.9 percent to $699.10 an ounce. The metal climbed 0.3 percent this week. West Texas Intermediate crude capped its biggest weekly drop since July as the U.S. and Russia held talks on a plan for Syria to surrender chemical weapons to avert a strike that could stoke Middle East tensions. WTI for October delivery slid 39 cents, or 0.4 percent, to settle at $108.21 a barrel on the New York Mercantile Exchange. Prices declined 2.1 percent this week, the most since the five days ended July 26. The volume of all futures traded was 26 percent less than the 100-day average. Commodity Weekly Update 16 th Sept 2013 Weekly Movement Weekly Technical View: Natural Gas Natural Gas future prices maintained positive trend during the week ending to Friday and close at weekly high level. 14 Day RSI prefers the firmness and remained in neutral region along with stochastic are favouring the bulls and moved in the neutral region. MACD is supporting the bulls as medium term and moving in the positive territory. Concisely, prices are likely to trade up in the coming trading week. Short Term Trend- Bullish Support & Resistance: S1 S2 PCP R1 R2 230 227 235.10 242 248 Recommendation: Based on the charts above, we recommend buying at 232 level for the target of 242/248 Stop loss below 227 levels. RR, All Rights Reserved Page 1 of 4
- 2. • Asian currencies had their best week in two months, led by India’s rupee, after U.S. jobs data tempered speculation the Federal Reserve will cut stimulus that’s buoyed emerging markets. Elsewhere in Asia, South Korea’s won strengthened 0.6 percent this week to 1,086.88 and China’s yuan was little changed at 6.1188. Indonesia’s rupiah dropped for a fifth week, falling 2.1 percent to 11,410 and Vietnam’s dong climbed 0.2 percent to 21,115. Payrolls in the world’s largest economy climbed less than economists projected in August and gains for the previous two months were revised down, a Sept. 6 report showed, ahead of a Fed meeting that will discuss the $85 billion monthly debt-purchase program. President Barack Obama has delayed a decision on military strikes against Syria to pursue a Russian offer to get the regime to give up its chemical weapons. • The rupee, which touched a record low of 68.845 per dollar on Aug. 28, completed its best week since October 2009 after Reserve Bank of India Governor Raghuram Rajan, who took office on Sept. 4, announced plans to strengthen the financial industry and boost dollar supply. India’s factory output climbed 2.6 percent in July from a year earlier after a revised 1.8 percent decline in June, a report showed Sept. 12. • Consumer confidence in the U.S. declined in September to the lowest level since April, indicating household spending may take time to pick up. The Thomson Reuters/University of Michigan preliminary index of consumer sentiment this month fell to 76.8 from August 82.1. A separate report from the Commerce Department showed retail sales rose less than forecast in August. The 0.2 percent increase was the smallest in four months and followed a revised 0.4 percent July gain that was bigger than previously estimated, the report said. • Wholesale prices in the U.S. rose more than forecast in August, reflecting higher costs for food and some fuels. The 0.3 percent increase in the producer price index followed no change in the prior month, a Labor Department report showed in Washington. Particular Actual Previous Unit Government Bond 10Y 8.50 8.60 Percent Currency 63.50 65.71 Percent Stock Market 19781.88 18979.76 Percent Interbank Rate 12.02 11.26 Percent GDP Growth Rate 1.30 0.80 Percent GDP 1841.70 1872.90 Billion USD GDP per capita 1106.80 1085.73 USD GDP per capita PPP 3340.60 3277.01 USD GDP Annual Growth Rate 4.40 4.80 Percent Inflation Rate 5.79 4.86 Percent Producer Prices 175.40 172.70 Index Points Consumer Price Index (CPI) 235 231 Index Points Export Prices 223 196 Index Points GDP Deflator 159.30 146.50 Index Points Import Prices 243 215 Index Points Money Supply M2 19349.17 19247.67 INR BIL Money Supply M3 87696.97 87567.88 INR BIL Weekly Chart (MCX): Copper Weekly Technical View: Copper On last week Copper closed at weekly low level and still looking weak. We recommend sell Copper for medium term with stop loss of 476. The immediate support appears around 454 levels breaching which the metal can reach 445 levels. Metals has strong resistance at 476 levels. Technical indicators on daily chart has generated fresh sell signal and indicate continues of downward movement for next week. Short Term Trend- Bearish Support & Resistance: S1 S2 PCP R1 R2 454 445 461 468 476 Recommendation: Based on the charts above, we recommend sell around 468 levels for the target of 454/445 and put Stop loss above 476 on closing basis levels. India - National Statistical Data Economic Round-Up RR, All rights reserved Page 2 of 3
- 3. For Further Details/Clarifications please contact: RR Information & Investment Research Pvt. Ltd. 47, MM Road Jhandewalan New Delhi-110055 (INDIA) Tel: 011-23636362/63 research@rrfcl.com RR Research Products and Services: Online Equity Calls during Market Hours (9:00 AM to 3:30 PM) Online Commodity Calls during Market Hours (10:00 AM to 11:30 PM) Online Currency Calls during Market Hours (10:00 AM to 5:00 PM) Daily Morning Reports Equity Morning Update Debt Morning Update Commodity Morning Update Currency Morning Update Mid Session Market Daily Market Review Weekly Reports Equity Weekly Report Debt Weekly Report Commodity Weekly Report Currency Weekly Report Fundamental Research Global Market Analysis Economic Analysis Industry Analysis Company Research & Valuations Result Updates News Updates Events Updates IPO / FPO Analysis Mutual Fund Analysis Insurance Analysis Investment Monitor – The complete monthly magazine design for Indian investors Join us on face book: http://www.facebook.com/pages/RR-Research/209182015782971 RR, All rights reserved Page 3 of 3
- 4. Disclaimer: Kindly read the Risk Disclosure Documents carefully before investing in Equity Shares, Derivatives or other instruments traded on the Stock Exchanges. RR would include RR Financial Consultants Ltd. and its subsidiaries, group companies, employees and affiliates. The information contained herein is strictly confidential and meant solely for the selected recipient and may not be altered in any way, transmitted to, copied or distributed, in part or in whole, to any other person or to the media or reproduced in any form, without prior written consent of RR. The information contained herein is obtained from public sources and sources believed to be reliable, but independent verification has not been made nor is its accuracy or completeness guaranteed. RR or their employees may have or may not have an outstanding buy or sell position or holding or interest in the products mentioned herein. The contents and the information herein is solely for informational purpose and may not be used or considered as an offer document or solicitation of offer to buy or sell or subscribe for securities or other financial and insurance products and instruments. Nothing in this report constitutes investment, legal, accounting and/or tax advice or a representation that any investment or strategy is suitable or appropriate to recipients specific circumstances. The securities and products discussed and opinions expressed in this report may not be suitable for all investors, who must make their own investment decisions, based on their own investment objectives, financial positions and needs. Please note that fixed deposits, bonds, debentures are loans/lending instruments and the investor must satisfy himself/herself on the financial health of the company/bank/institution before making any investment. RR and/or its affiliates take no guarantee of soundness of any company or scheme. RR has/will make available all required information to the prospective investor if asked for in respect of any scheme/fixed deposit/bond/loan/debenture. RR is only acting as a broker/distributor and is not representing any company in any manner except to distribute its schemes. Mutual Fund Investments are subject to market risks, read the offer document carefully before investing. Any recipient herein may not take the content in substitution for the exercise of independent judgment. The recipient should independently evaluate the investment risks of any scheme of a mutual fund. RR and its affiliates accept no liability for any loss or damage of any kind arising out of the use of any information contained herein. Past performance is not necessarily a guide to future performance. Actual results may differ materially from those set forth in projections. RR may have issued other reports that are inconsistent with and reach different conclusion from the information presented in this report. The information herein is not directed or intended for distribution to, or use by, any person or entity who is a citizen or resident of or located in any locality, state, country or other jurisdiction, where such distribution, publication, availability or use would be contrary to law, regulation or which would subject RR and its affiliates to any registration or licensing requirement within such jurisdiction. The securities and products described herein may or may not be eligible for sale in all jurisdictions or to certain category of investors. Persons in whose possession this document may come are required to inform them of and to observe such restriction(s). The display, description or references to any products, services, publications or links herein shall not constitute an endorsement by RR. Insurance is a subject matter of solicitation. Kindly also note all the risk disclosure documents carefully before investing in Equity Shares, IPO’s, Mutual Fund Schemes, Insurance Schemes, Fixed Deposit schemes, Debt offers, Hybrid Instruments, or other instruments traded on Stock Exchanges or otherwise. Prospective investors can get all details and information from the sites of SEBI, IRDA, AMFI or respective Mutual Fund Companies, Insurance Companies, Rating Agencies, Stock Exchanges and individual corporate websites. Prospective investors are advised to fully satisfy themselves before making any investment decision NSE - INB 231219636, INF 231219636 BSE - INB 011219632, NCDEX Membership No: 00635 | MCX Membership No: 28850 | SEBI Registration No: MCX-SX: INE261219636 SEBI Registration No: NSE Currency: INE231219636 About RR RR is first generation business set up in 1986. Shri. Rajat Prasad, a professional qualified Chartered Accountant, is the main founder. He is the architect of its growth and in the last decade has steered the group to be a diverse and respected financial and Insurance Services Organization with nationwide presence with offices in more than 100 cities and a team of 800 Employees. RR has the presence in all metro cities and towns across the length and breadth of the country. RR is headquartered in New Delhi, Capital of India with regional offices in Mumbai, Ahmedabad, Baroda, Jaipur, Chandigarh, Lucknow, Calcutta, Bangalore, Chennai, Noida and Dehradun. It has Associate offices in other cities and Locations totalling 600 locations & 100 cities. It has agent presence in over 500 cities across the country. RR is the only Company in India which provides research based seamless service to its customers through own offices, franchisees and agents. About RR Research RR Research provides unbiased and independent research in Equity, Commodity, Currency, Fixed Income, Debt Market, Mutual Funds, Insurance. The research team consists of more than 10 analysts, most of which are CAs and MBAs from premier business school with experience ranging from 0 to 10 years. The team is equipped with state of the art analysis tools, software. The research team is engaged in almost every activities of the capital market. In the fundament research front, the team is involved in Economic Analysis, Sectoral Analysis, Company Coverage and Updates. In the trading front, dedicated technical team is employed to provide online technical calls, trading tips, derivative strategies to clients. The team is online during the market hours and anyone through our website can chat live with analysts and can solve any investment related query. The team has extensive network of industry contacts and regularly attending analyst meets/ conference calls to get insight of the company. On regular basis, the team shares its view with leading electronic & print media houses. RR, All rights reserved Page 4 of 3