Markets for you - 22ndSep2015
•
0 likes•220 views

Find out the latest news of Indian Market

Recommended
Recommended
More Related Content
What's hot
What's hot (20)
Similar to Markets for you - 22ndSep2015
Similar to Markets for you - 22ndSep2015 (20)
Recently uploaded
Recently uploaded (20)
Markets for you - 22ndSep2015
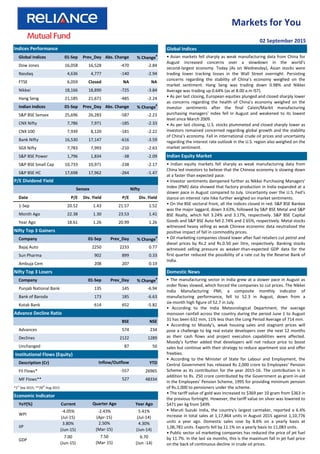
- 1. Global Indices Global Indices 01-Sep Prev_Day Abs. Change % Change # Dow Jones 16,058 16,528 -470 -2.84 Nasdaq 4,636 4,777 -140 -2.94 FTSE 6,059 Closed NA NA Nikkei 18,166 18,890 -725 -3.84 Hang Seng 21,185 21,671 -485 -2.24 Indian Indices 01-Sep Prev_Day Abs. Change % Change # S&P BSE Sensex 25,696 26,283 -587 -2.23 CNX Nifty 7,786 7,971 -185 -2.33 CNX 100 7,939 8,120 -181 -2.22 Bank Nifty 16,530 17,147 -616 -3.59 SGX Nifty 7,783 7,993 -210 -2.63 S&P BSE Power 1,796 1,834 -38 -2.09 S&P BSE Small Cap 10,733 10,971 -238 -2.17 S&P BSE HC 17,698 17,962 -264 -1.47 Date P/E Div. Yield P/E Div. Yield 1-Sep 20.52 1.43 21.57 1.52 Month Ago 22.38 1.30 23.53 1.41 Year Ago 18.61 1.26 20.99 1.26 Nifty Top 3 Gainers Company 01-Sep Prev_Day % Change # Bajaj Auto 2250 2233 0.77 Sun Pharma 902 899 0.33 Ambuja Cem 208 207 0.19 Nifty Top 3 Losers Domestic News Company 01-Sep Prev_Day % Change# Punjab National Bank 135 145 -6.94 Bank of Baroda 173 185 -6.63 Kotak Bank 614 652 -5.82 Advance Decline Ratio BSE NSE Advances 574 234 Declines 2122 1289 Unchanged 87 50 Institutional Flows (Equity) Description (Cr) YTD FII Flows* 26965 MF Flows** 48334 *1st Sep 2015; **28th Aug 2015 Economic Indicator YoY(%) Current Year Ago WPI -4.05% (Jul-15) 5.41% (Jul-14) IIP 3.80% (Jun-15) 4.30% (Jun-14) GDP 7.00 (Jun-15) 6.70 (Jun -14) 02 September 2015 Indian Equity Market Indices Performance P/E Dividend Yield Sensex Nifty -2.43% (Apr-15) 2.50% (Mar-15) 7.50 (Mar-15) Quarter Ago Inflow/Outflow 527 -557 Markets for You • Indian equity markets fell sharply as weak manufacturing data from China led investors to believe that the Chinese economy is slowing down at a faster than expected pace. • Investor sentiments dampened further as Nikkei Purchasing Managers' Index (PMI) data showed that factory production in India expanded at a slower pace in August compared to July. Uncertainty over the U.S. Fed’s stance on interest rate hike further weighed on market sentiments. • On the BSE sectoral front, all the indices closed in red. S&P BSE Bankex was the major laggard, down 3.63%, followed by S&P BSE Metal and S&P BSE Realty, which fell 3.24% and 3.17%, respectively. S&P BSE Capital Goods and S&P BSE Auto fell 2.74% and 2.65%, respectively. Metal stocks witnessed heavy selling as weak Chinese economic data neutralized the positive impact of fall in commodity prices. • Oil marketing companies closed lower after fuel retailers cut petrol and diesel prices by Rs.2 and Rs.0.50 per litre, respectively. Banking stocks witnessed selling pressure as weaker-than-expected GDP data for the first quarter reduced the possibility of a rate cut by the Reserve Bank of India. • The manufacturing sector in India grew at a slower pace in August as order flows slowed, which forced the companies to cut prices. The Nikkei India Manufacturing PMI, a composite monthly indicator of manufacturing performance, fell to 52.3 in August, down from a six-month high figure of 52.7 in July. • According to the India Meteorological Department, the average monsoon rainfall across the country during the period June 1 to August 31 has been 632 mm, 11% less than the Long Period Average of 714 mm. • According to Moody’s, weak housing sales and stagnant prices will pose a challenge to big real estate developers over the next 12 months as their cash flows and project execution capabilities were affected. Moody’s further added that developers will not reduce price to boost sales but continue with their strategy to reduce apartment size and offer freebies. • According to the Minister of State for Labour and Employment, the Central Government has released Rs 2,000 crore to Employees' Pension Scheme as its contribution for the year 2015-16. The contribution is in addition to Rs. 250 crore contributed by the Government as grant-in-aid in the Employees' Pension Scheme, 1995 for providing minimum pension of Rs.1,000 to pensioners under the scheme. • The tariff value of gold was increased to $369 per 10 gram from $363 in the previous fortnight. However, the tariff value on silver was lowered to $471 per kg from $499. • Maruti Suzuki India, the country's largest carmaker, reported a 6.4% increase in total sales at 1,17,864 units in August 2015 against 1,10,776 units a year ago. Domestic sales rose by 8.6% on a yearly basis at 1,06,781 units. Exports fell by 11.1% on a yearly basis to 11,083 units. • Public sector oil marketing companies has reduced the price of jet fuel by 11.7%. In the last six months, this is the maximum fall in jet fuel price on the back of continuous decline in crude oil prices. • Asian markets fell sharply as weak manufacturing data from China for August increased concerns over a slowdown in the world's second-largest economy. Today (As on Wednesday), Asian stocks were trading lower tracking losses in the Wall Street overnight. Persisting concerns regarding the stability of China’s economy weighed on the market sentiment. Hang Seng was trading down 0.98% and Nikkei Average was trading up 0.64% (as at 8.00 a.m IST). • As per last closing, European equities plunged and closed sharply lower as concerns regarding the health of China’s economy weighed on the investor sentiments after the final Caixin/Markit manufacturing purchasing managers' index fell in August and weakened to its lowest level since March 2009. • As per last closing, U.S. stocks plummeted and closed sharply lower as investors remained concerned regarding global growth and the stability of China’s economy. Fall in international crude oil prices and uncertainty regarding the interest rate outlook in the U.S. region also weighed on the market sentiment.
- 2. FII Derivative Trade Statistics 01-Sep (Rs Cr) Buy Sell Open Int. Index Futures 2845.26 2306.69 19091.50 Index Options 11540.04 10139.12 69526.82 Stock Futures 3442.33 2783.49 44300.26 Stock Options 1317.15 1261.53 1161.18 Total 19144.78 16490.83 134079.76 01-Sep Prev_Day Change Put Call Ratio (OI) 1.03 1.02 0.01 Indian Debt Market Put Call Ratio(Vol) 0.93 1.06 -0.13 31-Aug Wk. Ago Mth. Ago Year Ago Call Rate 7.10% 6.92% 7.09% 7.57% CBLO 7.22% 7.21% 7.05% 7.74% Repo 7.25% 7.25% 7.25% 8.00% Reverse Repo 6.25% 6.25% 6.25% 7.00% 91 Day T-Bill 7.15% 7.25% 7.30% 8.59% 364 Day T-Bill 7.50% 7.52% 7.57% 8.65% 10 Year Gilt 7.75% 7.81% 7.81% 8.55% G-Sec Vol. (Rs.Cr) 46919 53284 32118 14127 Currency Market Update 1 Month CP Rate 7.53% 7.53% 7.53% 8.59% 3 Month CP Rate 7.81% 7.80% 7.91% 9.03% 5 Year Corp Bond 8.35% 8.38% 8.45% 9.34% 1 Month CD Rate 7.42% 7.31% 7.34% 8.71% 3 Month CD Rate 7.50% 7.51% 7.55% 8.76% 1 Year CD Rate 7.84% 7.85% 7.94% 9.10% Commodity Market Update Currency 01-Sep Prev_Day Change USD/INR 66.26 66.31 -0.05 GBP/INR 101.99 102.31 -0.32 EURO/INR 74.79 74.50 0.29 International News JPY/INR 0.55 0.55 0.00 Currency 01-Sep Wk Ago Mth. Ago Year Ago NYMEX Crude($/bl) 45.38 39.15 47.11 97.86 Brent Crude($/bl) 48.50 41.56 53.64 101.10 Gold( $/oz) 1139.70 1140 1095 1287 Gold(Rs./10 gm) 26718 26700 24592 27761 Source: ICRON Research Mutual Fund Investments are subject to market risks, read all scheme related documents carefully. “The information herein is meant only for general reading purposes and contains all factual and statistical information pertaining to Industry and markets which have been obtained from independent third-party sources and which are deemed to be reliable. The information provided cannot be considered as guidelines, recommendations or as a professional guide for the readers. It may be noted that since RCAM has not independently verified the accuracy or authenticity of such information or data, or for that matter the reasonableness of the assumptions upon which such data and information has been processed or arrived at; RCAM does not in any manner assures the accuracy or authenticity of such data and information. Some of the statements & assertions contained in these materials may reflect RCAM’s views or opinions, which in turn may have been formed on the basis of such data or information. The Sponsor, the Investment Manager, the Trustee or any of their respective directors, employees, affiliates or representatives do not assume any responsibility for, or warrant the accuracy, completeness, adequacy and reliability of such data or information. Whilst no action has been solicited based upon the information provided herein, due care has been taken to ensure that the facts are accurate and opinions given are fair and reasonable, to the extent possible. This information is not intended to be an offer or solicitation for the purchase or sale of any financial product or instrument. Recipients of this information should rely on information/data arising out of their own investigations. Before making any investments, the readers are advised to seek independent professional advice, verify the contents in order to arrive at an informed investment decision. None of the Sponsor, the Investment Manager, the Trustee, their respective directors, employees, affiliates or representatives shall be liable in any way for any direct, indirect, special, incidental, consequential, punitive or exemplary damages, including on account of lost profits arising from the information contained in this material. Derivative Statistics- Nifty Options 02 September 2015 Disclaimer: Derivatives Market Debt Watch Currency Market Commodity Prices Markets for You • Nifty September 2015 Futures were at 7798.80 points, a premium of 12.95 points against the spot closing 7785.85 points. The turnover on NSE’s Futures and Options segment rose from Rs. 1,43,869.18 crore on August 31 to Rs. 2,05,275.20 crore on September 1. • The Put-Call ratio stood at 1.00, compared to the previous session’s close of 0.89. • The Nifty Put-Call ratio stood at 1.02, compared to the previous session’s close of 1.03. • The open interest on Nifty Futures stood at 23.07 million compared to the previous session’s close of 22.88 million. • Bond yields fell as slower-than-expected India’s GDP growth data for the June quarter increased hopes that the Central Bank would soon resume monetary easing. • The yield on the 10-year benchmark bond, 7.72% GS 2025, fell 3 bps to close at 7.75%, from the previous close of 7.78%. The paper moved in the range of 7.75% to 7.79% earlier during the trading session. • Banks borrowed Rs. 1,350 crore under the RBI’s Marginal Standing facility on August 31 compared to Rs. 200 crore borrowed on August 28. • The Central Bank proposed a new method for banks to price their loans, i.e., marginal cost of funds. The move is targeted to align base lending rates with the RBI’s monetary policy revisions. The proposed method was found to be more sensitive to change in policy rate, the RBI said. The regulator has proposed that the norms be accepted by April 1, 2016. • The rupee strengthened against the dollar following selling of the greenback by banks on behalf of corporates and exporters. The greenback weakened further as the possibility of a rate hike by the U.S. Federal Reserve in the near term reduced. The rupee rose to 66.22 per dollar against the previous close of 66.48. • The euro extended its gains for the second day against the dollar, tracking fall in global equity markets. The euro was trading at $1.1272 compared to the previous close of $1.1211. • Gold prices rose over fresh concerns about Chinese economic slowdown and uncertainty over the U.S. Fed’s stance on interest rate. • Brent crude prices rose after the latest commentary from OPEC suggested that the group may talk to other producers about curbing oil output. • The final Caixin/Markit PMI of China fell to 47.3 (flash score of 47.1) in August from 47.8 in July. The sector has been in a contraction mode for six consecutive months. Total new orders and export business declined at faster pace in July. The Services PMI fell to 51.5 from 53.8 in July. • Final data from Markit Economics showed that Euro zone manufacturing PMI fell to 52.3 (against preliminary data of 52.4) from 52.4 in July. Output growth accelerated in Germany and Spain, while activity contracted further in France and Greece. • According to Markit/BME, Germany's manufacturing Purchasing Managers’ Index (PMI) rose to 53.3 (initial score was 53.2) in August from 51.8 a month ago. The index recorded its fastest rise in 16 months in August, final data showed.