SlideShare a Scribd company logo
1 of 322
MONITORING
FUTURE
NATIONAL SURVEY RESULTS
ON DRUG USE
1975–2016
2016
Overview
the
Sponsored by The National Institute on Drug Abuse at The
National Institutes of Health
Key Findings on Adolescent Drug Use
Lloyd D. Johnston
Patrick M. O’Malley
Richard A. Miech
Jerald G. Bachman
John E. Schulenberg
MONITORING THE FUTURE
NATIONAL SURVEY
RESULTS ON
DRUG USE
2016 Overview
Key Findings on Adolescent
Drug Use
by
Lloyd D. Johnston, Ph.D.
Patrick M. O’Malley, Ph.D.
Richard A. Miech, Ph.D.
Jerald G. Bachman, Ph.D.
John E. Schulenberg, Ph.D.
The University of Michigan
Institute for Social Research
Sponsored by:
The National Institute on Drug Abuse
National Institutes of Health
This publication was written by the principal
investigators and staff of the Monitoring the Future
project at the Institute for Social Research, the
University of Michigan, under Research Grant R01 DA
001411 from the National Institute on Drug Abuse.
The findings and conclusions in this report are those of
the authors and do not necessarily represent the views
of the sponsor.
Public Domain Notice
All material appearing in this volume is in the public
domain and may be reproduced or copied, whether in
print or non-print media including derivatives, without
permission from the authors. If you plan to modify the
material, please contact the Monitoring the Future
Project at [email protected] for verification of
accuracy. Citation of the source is appreciated,
including at least the following: Monitoring the Future,
Institute for Social Research, The University of
Michigan.
Recommended Citation
Johnston, L. D., O’Malley, P. M., Miech, R. A.,
Bachman, J. G., & Schulenberg, J. E. (2017). Monitoring
the Future national survey results on drug use,
1975-2016: Overview, key findings on adolescent drug
use. Ann Arbor: Institute for Social Research, The
University of Michigan.
Institute for Social Research
The University of Michigan
Ann Arbor, Michigan
Printed January 2017
http://creativecommons.org/licenses/by/4.0/
https://creativecommons.org/licenses/by/4.0/
Contents
Click on any item below (in blue) to go directly to that page.
Introduction
...............................................................................................
.................................1
Study Design and Methods
...............................................................................................
.........3
Summary of Key Findings
...............................................................................................
..........5
Specific Results by Drug
Any Illicit Drug
...............................................................................................
.............9
Marijuana
...............................................................................................
....................11
Synthetic Marijuana
...............................................................................................
....13
Inhalants
...............................................................................................
......................15
LSD
...............................................................................................
.............................17
Cocaine
...............................................................................................
.......................19
Crack
...............................................................................................
...........................21
Amphetamines and Other Stimulant Drugs
...............................................................23
Methamphetamine and Crystal Methamphetamine (Ice)
..........................................25
Heroin
...............................................................................................
.........................27
Other Narcotic Drugs, Including OxyContin and Vicodin
........................................29
Tranquilizers
...............................................................................................
...............31
Sedatives (Barbiturates)
............................................................................................3
3
MDMA (Ecstasy, Molly) and Other “Club Drugs”
..................................................35
Alcohol
...............................................................................................
........................37
Cigarettes
........................................................................................ .......
....................39
Smokeless Tobacco
...............................................................................................
.....41
Vaping
.............................................................................................. .
.........................43
Small Cigars, Cigarillos, Large Cigars, and Tobacco Using a
Hookah .....................45
Steroids
...............................................................................................
.......................47
Subgroup Differences
...............................................................................................
...............49
Lessons Learned
...............................................................................................
........................52
Tables
1. Trends in Lifetime Prevalence of Use of Various Drugs for
Grades 8, 10, and 12 Combined
.................................................................................54
2. Trends in Annual Prevalence of Use of Various Drugs for
Grades 8, 10, and 12 Combined
.................................................................................56
3. Trends in 30‐Day Prevalence of Use of Various Drugs for
Grades 8, 10, and 12 Combined
.................................................................................58
4. Trends in Daily Prevalence of Use of Selected Drugs for
Grades 8, 10, and 12 Combined
.................................................................................60
5. Trends in Lifetime Prevalence of Use of Various Drugs in
Grades 8, 10, and 12
...............................................................................................
...62
6. Trends in Annual Prevalence of Use of Various Drugs in
Grades 8, 10, and 12
...............................................................................................
...68
7. Trends in 30‐day Prevalence of Use of Various Drugs in
Grades 8, 10, and 12
...............................................................................................
...76
8. Trends in 30‐Day Prevalence of Daily Use of Various Drugs
in
Grades 8, 10, and 12
...............................................................................................
...82
9. Trends in Harmfulness of Drugs as Perceived by 8th Graders
..................................87
10. Trends in Harmfulness of Drugs as Perceived by 10th
Graders ................................90
11. Trends in Harmfulness of Drugs as Perceived by 12th
Graders ................................93
12. Trends in Disapproval of Drug Use in Grade 8
.........................................................97
13. Trends in Disapproval of Drug Use in Grade 10
..................................................... 100
14. Trends in Disapproval of Drug Use in Grade 12
..................................................... 103
15. Trends in Availability of Drugs as Perceived by 8th Graders
................................. 107
16. Trends in Availability of Drugs as Perceived by 10th
Graders ............................... 109
17. Trends in Availability of Drugs as Perceived by 12th
Graders ............................... 111
Introduction
Monitoring the Future (MTF) is a long-term study of
American adolescents, college students, and adult high
school graduates through age 55. It has been conducted
annually by the University of Michigan’s Institute for
Social Research since its inception in 1975 and is
supported under a series of investigator-initiated,
competitive research grants from the National Institute
on Drug Abuse.
The need for a study such as MTF is clear. Substance
use by American young people has proven to be a
rapidly changing phenomenon, requiring frequent
assessments and reassessments. Since the mid-1960s,
when it burgeoned in the general youth population,
illicit drug use has remained a major concern for the
nation. Smoking, drinking, and illicit drug use are
leading causes of morbidity and mortality during
adolescence as well as later in life. How vigorously the
nation responds to teenage substance use, how
accurately it identifies the emerging substance abuse
problems, and how well it comes to understand the
effectiveness of policy and intervention efforts largely
depend on the ongoing collection of valid and reliable
data. MTF is uniquely designed to generate such data
in order to provide an accurate picture of what is
happening in this domain and why, and the study has
served that function well for the past 42 years. Policy
discussions in the scientific literature and media, in
government, education, public health institutions, and
elsewhere have been informed by the ready availability
of extensive and consistently accurate information
from the study relating to a large and ever-growing
number of substances. Similarly, the work of
organizations and agencies providing prevention and
treatment services is informed by MTF.
The 2016 MTF survey involved about 45,500 students
in 8th-, 10th-, and 12th grades enrolled in 372 secondary
schools nationwide. The first published results based
on the 2016 survey are presented in this report. Recent
trends in the use of licit and illicit drugs are
emphasized, as well as trends in the levels of perceived
risk and personal disapproval associated with each
drug. This project has shown these beliefs and attitudes
to be particularly important in explaining trends in use.
1Prevalence refers to the proportion or percentage of the
sample reporting use of
the given substance on one or more occasions in a given time
interval—e.g.,
lifetime, past 12 months, or past 30 days. For most drugs, the
prevalence of daily
use refers to reported use on 20 or more occasions in the past 30
days, except for
cigarettes and smokeless tobacco, for which actual daily use is
measured, and for
binge drinking, defined as having 5+ drinks on at least one
occasion in the prior
two weeks. E-cigarettes and some tobacco products are
measured on number of
days used in past 30 days.
In addition, trends in the perceived availability of each
drug are presented, which at times have proven
important to explaining changes in usage levels for
some drugs.
A synopsis of the design and methods used in the study
and an overview of the key results from the 2016
survey follow this introductory section. We then
provide a separate section for each individual drug
class, including figures that show trends in the overall
proportions of students at each grade level (a) using the
drug, (b) seeing a “great risk” associated with its use
(perceived risk), (c) disapproving of its use
(disapproval), and (d) saying that it would be “fairly
easy” or “very easy” to get if they wanted to (perceived
availability). For 12th graders, annual data are available
since 1975 and for 8th and 10th graders since 1991, the
first year they were included in the study.
The tables at the end of this report provide the statistics
underlying the figures; in addition, they present data on
lifetime, annual, 30-day, and (for selected drugs) daily
prevalence.1 For the sake of brevity, we present these
prevalence statistics here in tabular form only for the
1991–2016 interval, but statistics on 12th graders going
back to 1975 are available in other MTF publications.
For each prevalence period, the tables indicate which
one-year changes from 2015 to 2016 are statistically
significant. (In the text below, ‘s’ indicates p≤.05, ‘ss’
indicates p≤.01, ‘sss’ indicates p≤.001, and ‘ns’
indicates not statistically significant). The graphic
depictions of multiyear trends often reveal gradual
change that may not reach significance in a given one-
year interval but nevertheless may be shown to be real
over a longer time frame.
An extensive analysis of the study’s findings on
secondary school students may be found in Volume I,
the second publication in this series, published at the
end of May each year.2 Volume I contains a more
detailed description of the study’s methodology, as
well as chapters on grade of initiation, attitudes toward
drugs, the social milieu, and a summary of other
publications from the study that year (mostly journal
articles). Volume I also contains an appendix
2The most recent publication of Volume I is Miech, R. A.,
Johnston, L. D.,
O’Malley, P. M., Bachman, J. G., & Schulenberg, J. E. (2016).
Monitoring the
Future national survey results on drug use, 1975–2015: Volume
I, Secondary
school students. Ann Arbor: Institute for Social Research, The
University of
Michigan, 636 pp. Available at:
http://monitoringthefuture.org/pubs/monographs/mtf-
vol1_2015.pdf
1
report because the follow-up data from those populations
become available later in the year. Those findings will be
covered in Volume II, the third monograph in this annual
series, published at the end of July each year.3
Two annual MTF Occasional Papers are published each
year in conjunction with Volumes I and II, providing
trends in use for various demographic subgroups.4
A fourth monograph, HIV/AIDS Risk and Protective
Behaviors Among Young Adults, dealing with national
trends in HIV/AIDS-related risk and protective behaviors
among young adults 21 to 40 years old, was added to the
series beginning in 2010.5 It is published in October of
each year. From 2005 to 2009, these findings were
reported as part of Volume II.
For the publication years prior to 2010, the volumes in
these annual series are available from the NIDA Drug
Publications Research Dissemination Center (877-
NIDA-NIH, drugpubs.drugabuse.gov) and can also be
found on the MTF website. Beginning with the 2010
publication date, the volumes are available at the MTF
website immediately upon publication. Further
information on the study, including its latest press
releases, a listing of all publications, and freely accessible
reports may also be found at
www.monitoringthefuture.org.
3The most recent publication of Volume II is Johnston, L. D.,
O’Malley, P. M.,
Bachman, J. G., Schulenberg, J. E. , and Miech, R. A. (2016).
Monitoring the
Future national survey results on drug use, 1975–2015: Volume
II, College
students & adults ages 19–55. Ann Arbor: Institute for Social
Research, The
University of Michigan, 427 pp. Available at:
http://www.monitoringthefuture.org/pubs/monographs/mtf-
vol2_2015.pdf
4Johnston, L. D., O'Malley, P. M., Bachman, J. G.,
Schulenberg, J. E., & Miech,
R. A. (2016). Demographic subgroup trends among adolescents
in the use of
various licit and illicit drugs 1975-2015 (Monitoring the Future
Occasional Paper
No. 86). Ann Arbor, MI: Institute for Social Research,
University of Michigan,
552 pp. Available at:
http://monitoringthefuture.org/pubs/occpapers/mtf-occ86.pdf
Johnston, L. D., O'Malley, P. M., Bachman, J. G., Schulenberg,
J. E., & Miech,
R. A. (2016). Demographic subgroup trends among young adults
in the use of
various licit and illicit drugs 1989-2015 (Monitoring the Future
Occasional Paper
No. 87). Ann Arbor, MI: Institute for Social Research,
University of Michigan,
109 pp. Available at:
http://monitoringthefuture.org/pubs/occpapers/mtf-occ87.pdf
5The most recent publication in the HIV/AIDS monograp series
is Johnston, L.
D., O’Malley, P. M., Bachman, J. G., Schulenberg, J. E.,
Patrick, M. E., & Miech,
R. A. (2016). HIV/AIDS: Risk and protective behaviors among
adults ages 21-
40 in the U.S., 2004–2015. Ann Arbor: Institute for Social
Research, The
University of Michigan, 123 pp. Available at:
http://monitoringthefuture.org/pubs/monographs/mtf-hiv-
aids_2015.pdf
2
drugpubs.drugabuse.gov
www.monitoringthefuture.org
Study Design and Methods
Monitoring the Future’s main data collection involves a
series of large, annual surveys of nationally representative
samples of public and private secondary school students
throughout the coterminous United States. Every year
since 1975, such samples of 12th graders have been
surveyed. In 1991, the study was expanded to include
comparable, independent national samples of 8th and 10th
graders. The year 2016 marked the 42nd survey of 12th
graders and the 26th survey of 8th and 10th graders.
Sample Sizes
In 2016 about 45,500 students in 372 secondary schools
participated in the study, with sample sizes in 8th, 10th, and
12th grades of about 17,600, 15,200, and 12,600,
respectively. The number of cases upon which a
particular statistic is based may be less than the total
sample size. Multiple questionnaire forms are distributed
randomly at each grade level to increase coverage of
attitudinal and behavioral domains relevant to substance
use. To reduce burden on the respondents, not all
questions are contained in all forms. The tables here
contain notes on the number of forms used for each
statistic if less than the total sample is used.
Field Procedures
University of Michigan staff members administer the
questionnaires to students, usually in the student
classroom during a regular class period. Participation is
voluntary. Parents are notified well in advance of the
survey administration and are provided the opportunity to
decline their child’s participation. Questionnaires are self-
completed and are formatted for optical scanning.
Procedures are kept consistent over time.
In 8th and 10th grades the questionnaires are completely
anonymous, and in 12th grade they are confidential (name
and address information is gathered separately from the
12th grade questionnaire to permit the longitudinal follow-
up surveys of random subsamples of participants after
high school). Extensive procedures are followed to
protect the confidentiality of the participants and their
data. All procedures are reviewed and approved on an
annual basis by the University of Michigan’s Institutional
Review Board (IRB) for compliance with federal
guidelines for the treatment of human subjects.
Measures
A standard set of three questions is used to determine
usage levels for most of the drugs. For example, we ask,
“On how many occasions (if any) have you used
marijuana… (a)…in your lifetime? (b)…during the last
12 months? (c)…during the last 30 days?” Each of the
three questions is answered on the same answer scale: 0,
1–2, 3–5, 6–9, 10–19, 20–39, and 40 or more occasions.
For the psychotherapeutic drugs (amphetamines,
sedatives [barbiturates], tranquilizers, and narcotics other
than heroin), respondents are instructed to include only
use “…on your own—that is, without a doctor telling you
to take them.” A similar qualification is used in the
question on use of anabolic steroids, OxyContin, Vicodin,
and several other drugs.
For cigarettes, respondents are asked two questions about
use. First, they are asked, “Have you ever smoked
cigarettes?” The answer categories are “never,” “once or
twice,” “occasionally but not regularly,” “regularly in the
past,” and “regularly now.” The second question asks,
“How frequently have you smoked cigarettes during the
past 30 days?” The answer categories are “not at all,”
“less than one cigarette per day,” “one to five cigarettes
per day,” and about one-half, one, one and one half, and
two packs or more per day.
Smokeless tobacco questions parallel those for cigarettes.
There are also questions recently added about electronic
vaporizers, e-cigarettes, small cigars, and a number of
other tobacco products. In general, their use is asked on a
prevalence/frequency scale for either the last 12 months
or the last 30 days.
Alcohol use is measured using the three questions
illustrated above for marijuana. A parallel set of three
questions asks about the frequency of being drunk. Binge
drinking is assessed with the question, “How many times
(if any) have you had five or more drinks in a row” over
the past two weeks? Extreme binge, now also called high-
intensity, drinking among 12th graders is assessed with
similar questions about consuming ten or more and fifteen
or more drinks in a row.
In general, we try to keep measures consistent across
time. When a change is warranted, we usually splice the
older and newer measures for at least one year to permit
an assessment of the effect of the change.
Perceived risk is measured by the question, “How much
do you think people risk harming themselves (physically
or in other ways), if they…” try or use a drug—for
example, “…try marijuana once or twice.” The answer
categories are “no risk,” “slight risk,” “moderate risk,”
“great risk,” and “can’t say, drug unfamiliar.” Parallel
questions refer to using marijuana “occasionally” and
“regularly.”
3
Disapproval is measured by the question “Do YOU
disapprove of people doing each of the following?”
followed by “trying marijuana once or twice,” for
example. Answer categories are “don’t disapprove,”
“disapprove,” and “strongly disapprove.” In the 8th- and
10th-grade questionnaires, a fourth category—“can’t say,
drug unfamiliar”—is provided and included in the
calculation of percentages.
Perceived availability is measured by the question “How
difficult do you think it would be for you to get each of
the following types of drugs, if you wanted some?”
Answer categories are “probably impossible,” “very
difficult,” “fairly difficult,” “fairly easy,” and “very easy.”
For 8th and 10th graders, an additional answer category—
“can’t say, drug unfamiliar”—is provided and included in
the calculation of percentages.
4
Summary of Key Findings
Before delving into the 2016 findings, a note about three
kinds of trends we reference: Monitoring the Future
(MTF) is designed to detect age effects, secular trends
(sometimes referred to as period effects), and cohort
effects in substance use and related attitudes and beliefs.
Age effects (similar changes at similar ages seen across
multiple class cohorts) are common during adolescence,
and we typically find that use, as well as positive attitudes
and beliefs about use, increase across 8th, 10th, and 12th
grades. When changes over time in substance use and
related attitudes and beliefs are parallel across the three
grades, they reflect secular trends, which are also
common.
Cohort effects pertain to differences in substance use and
related attitudes and behaviors among those born at
different times that are maintained as the birth cohorts age
(or in this case, as class-in-school cohorts, which are
strongly correlated with age). Such cohort effects
sometimes drive changes in substance use prevalence at
the population level. For example, much of the decline in
the prevalence of U.S. cigarette smoking has its roots in
youth cohorts that did not take up smoking and then
continued to abstain from smoking as they aged into
adulthood. As subsequent youth cohorts continued to
avoid smoking and then grew older, these cohorts
contributed to a decline in the overall population
prevalence of smoking. Cohort effects can also act in the
opposite direction, with newer cohorts taking up a
substance and continuing to use it as they get older. One
important contribution of the MTF study has been the
specification of cohort effects that emerged starting in the
early 1990s, when an increase in youth substance use
occurred for many drugs.
MTF allows detection of cohort effects at an early age
through comparison of substance use prevalence of 8th,
10th, and 12th graders relative to each other. Often 8th grade
substance use is a bellwether, and year-to-year changes
that are unique to 8th grade can signify an emerging
increase or decrease in substance use at later grade levels
with some time lag.
The analyses and associated tables that follow present
substance use trends for all three grades separately, as
well as trends in key attitudes, beliefs, and perceived
availability. In a number of cases we provide insight into
the age and cohort effects and secular trends that underlie
trends in use and in key attitudes and beliefs.
An additional set of tables provides an overview of drug
6 The few exceptions were annual use of bath salts among 8th
graders only, annual
use of over-the-counter cough and cold medicines to get high
among 8th graders,
use trends for the three grades combined (Tables 1–4).
This information gives a summary of the general nature
of secular trends over the last several years, though it
obscures any cohort effects that may be occurring. Also,
for simultaneous trends that are in the same direction and
magnitude across all three grades, these combined
analyses provide greater statistical power to detect secular
trends that are statistically significant.
Declines in Use of a Number of Drugs in 2016
Perhaps the most striking finding in 2016 is that across the
broad spectrum of drugs (more than 50 classes and
subclasses) most decreased and hardly any exhibited a
statistically significant increase.6
In many cases these decreases in use were continuing the
declines seen in 2014 and 2015. Cigarettes and alcohol
continued to show significant declines, reaching their
lowest levels in the history of the study. With regard to
illicit drugs, annual prevalence declined in the three
grades combined for the use of any illicit drug, any illicit
drug other than marijuana, synthetic marijuana,
MDMA(ecstasy, Molly), cocaine, crack, amphetamines,
Adderall specifically, methamphetamine, heroin,
Rohypnol, some psychotherapeutic drugs used without
medical supervision (Vicodin, tranquilizers), and
steroids.
The decline in annual prevalence of using any illicit drug
is largely due to the fact that the annual prevalence of
marijuana, which tends to drive the overall index,
showed a decline in the two lower grades in 2016. (The
2.4 percentage point decline to 9.4% in 8th grade was
highly significant; the 1.5 percentage point decline in 10th
grade to 23.9% was not.). Among 12th graders, however,
the annual prevalence of marijuana has held quite steady
for several years, increasing by a non-significant 0.7% to
35.6% in 2016. For the three grades combined, annual
prevalence of marijuana showed a significant decline of
1.1 percentage points in 2016.
Although use of marijuana declined (or in the case of the
12th graders held steady) in 2016 marijuana attitudes
among students continued to move toward greater
acceptance. This fact is contradictory to the association
that has existed between perceived risk and actual use for
many years, in which they usually move in opposite
directions with a one-year lag between a change in
perceived risk and a change in annual prevalence. (This is
a topic we will address in future publications.) Perceived
risk of smoking marijuana regularly declined only slightly
and 30-day use of heroin with a needle among 10th graders; and
none of those
changes were large or part of a pattern of continuing increase.
5
further in 2016 in two of the grades, following a sharp
decline in all three grades in recent years. In all three
grades, the percentage seeing great risk of smoking
marijuana regularly is at or near the lowest point ever
recorded in the study—58%, 44%, and 31% in grades 8,
10, and 12, respectively. Disapproval of smoking
marijuana regularly was unchanged in 8th grade (at 82%)
and 10th grade (at 74% ) in 2016, but declined non-
significantly in 12th grade (to 69%). Although the 2016
levels are at or near historic lows, they still indicate
relatively high levels of disapproval of smoking
marijuana regularly. Indeed the decline in disapproval or
regular marijuana use since about 2008 has been
considerably less than the decline in perceived risk.
Reported availability of marijuana continued a longer-
term decline among 8th and 10th graders in 2016.
Use of any illicit drug other than marijuana declined
slightly in all three grades, significantly so in 8th grade.
Annual prevalence in 2016 is 5%, 10%, and 14% in 8th,
10th, and 12th grades, respectively—the lowest levels
since all three grades were included in the study in 1991.
Additional drugs with declining annual prevalence
include synthetic marijuana (which in 2011 was the
second most widely used drug after marijuana), MDMA
(ecstasy, Molly), inhalants, heroin, cocaine, crack,
amphetamines, and steroids. Methamphetamine use
declined significantly at 10th grade but remained
unchanged in the other two grades.
The psychotherapeutic drugs warrant special attention,
given that they now make up a significantly larger part of
the overall U.S. drug problem than was true 10–15 years
ago. This is in part because of increases in nonmedical use
of many prescription drugs over that period, and in part
because use of a number of street drugs has declined
substantially since the mid- to late-1990s. It seems likely
that young people are less concerned about the dangers of
using these prescription drugs outside of medical regimen
because they are widely used for legitimate purposes.
(Indeed, the low levels of perceived risk for sedatives and
amphetamines observed among 12th graders illustrate this
point.) Also, prescription psychotherapeutic drugs are
now being advertised directly to the consumer, which
implies that they are both widely used and safe.
Fortunately, the use of most of these drugs has either
leveled or begun to decline in the past few years. The
proportion of 12th graders misusing any of these
prescription drugs (i.e., amphetamines, sedatives,
tranquilizers, or narcotics other than heroin) in the prior
year continued to decline in 2016 (-1.0%, not significant)
to 12%, down from a high of 17% in 2005. Amphetamine
use without a doctor’s orders—which generally has been
the second most widely used class of illicit drugs after
marijuana—continued a gradual decline in 2016 in all
grades, though the one-year declines did not reach
statistical significance. Use of narcotics other than heroin
without a doctor’s orders (reported only for 12th grade)
also continued a gradual decline begun after 2009, when
annual prevalence was 9.2%; it was 4.8% after a non-
significant decline of 0.6 percentage points in 2016.
Given the epidemic of narcotics use in older populations
along with concurrent rise in medical emergencies and
deaths, it is particularly good news that young people are
moving away from the use of these drugs.
Illicit Drugs Holding Steady in 2016
The use of a number of drugs showed little or no change
from 2015 to 2016. These include hallucinogens, LSD
specifically, hallucinogens other than LSD, salvia,
tranquilizers, heroin use without a needle, crystal
methamphetamine, and the club drugs GHB, rohypnol,
and ketamine.
Illicit Drugs Showing Any Increase in 2016
The use of so-called “bath salts” (synthetic stimulant
cathinones) rose significantly (but just by 0.5% to 0.9%)
among 8th graders in 2016 but remained unchanged in the
upper grades. Similarly, cough and cold medicines used
to get high (which usually contain dextromethorphan)
rose significantly among 8th graders to an annual
prevalence of 2.6%, but not among the upper grades.
Tobacco and Alcohol Use
As in 2015, cigarette smoking and alcohol use have
continued their long declines and are now at the lowest
levels in the history of the survey. Thirty-day prevalence
of cigarette use reached a peak in 1996 at grades 8 and 10,
capping a rapid climb from the 1991 levels (when data
were first gathered on these grades). Between 1996 and
2016, current smoking fell dramatically in these grades,
by 87% and 84%, respectively. For 12th graders, peak 30-
day prevalence occurred in 1997 at 37% and has shown a
more modest decline since then. It is at 11% in 2016—a
seven-tenths decline since the peak—with a continuing
decline in smoking prevalence in 2016. A similar decline
is statistically significant at 8th and 10th grades. Because of
the strong cohort effect that we have consistently
observed for cigarette smoking, we have predicted use at
12th grade to continue to show declines, as the lighter-
using cohorts of 8th and 10th graders become 12th graders.
Initiation of cigarette use also continues its long-term and
extremely important decline. Lifetime prevalence
declined between 2015 and 2016 in all three grades: to
10% in 8th grade (-3.5, sss), to 18% in 10th grade (-2.4, s),
and to 29% in 12th grade (-2.8, s). The fact that fewer
young people now initiate cigarette smoking is an
important reason for the large declines in their current use.
The proportion of students who have ever tried cigarettes
6
has fallen from peak levels reached in 1996 or 1997 by
roughly three quarters, two thirds, and one half in the three
grades, respectively.
Overall increases in perceived risk and disapproval
appear to have contributed to the downturn in cigarette
use. Perceived risk of smoking one or more packs of
cigarettes per day increased substantially and steadily in
all grades from 1995 through 2004, with 62%, 68%, and
74% of 8th, 10th, and 12th graders seeing great risk in 2004.
Since then, changes have been small and uneven, and the
corresponding figures in 2016 are only slightly changed,
at 61%, 72%, and 77%. Disapproval of smoking one or
more packs of cigarettes per day has increased somewhat
steadily in all three grades since 1996 and has reached
very high levels. In 2016 disapproval stands at 88%, 89%,
and 85% in grades 8, 10, and 12, respectively.
It seems likely that some of the attitudinal change
surrounding cigarettes is attributable to the considerable
adverse publicity aimed at the tobacco industry in the
1990s, as well as a reduction in cigarette advertising and
an increase in antismoking campaigns reaching youth.
Various other attitudes toward smoking became more
unfavorable during that interval as well, though most have
since leveled off. For example, among 8th graders, the
proportions saying that they “prefer to date people who
don’t smoke” rose from 71% in 1996 to 81% by 2004,
where it remained through 2016. Similar changes
occurred in 10th and 12th grades. Thus, at the present time,
smoking is likely to make an adolescent less attractive to
the great majority of potential romantic age-mates.
Likewise, most of the other negative connotations of
smoking and smokers have leveled off in the past few
years after rising previously. In addition to changes in
attitudes and beliefs about smoking, price almost surely
also played an important role in the decline in use.
Cigarette prices rose appreciably in the late 1990s and
early 2000s as cigarette companies tried to cover the costs
of the 1998 Master Settlement Agreement, and as many
states increased excise taxes on cigarettes. A significant
increase in the federal tobacco tax passed in 2009 may
have contributed to the continuation of the decline in use
since then.
Cigarillos. One consequence of the rise in cigarette prices
is that it may have shifted some adolescents to less
expensive alternatives, like cigarillos (little or small
cigars), which are taxed at a lower rate than cigarettes.
Taking into account this form of smoking of tobacco
raises the 30-day prevalence of students smoking
tobacco—by about three-fourths among 8th and 10th
graders and by more than half among 12th graders—over
what it would be if just cigarette smoking were counted.
It does appear, however, that the prevalence of using
small cigars is also in decline, with 16% of 12th graders in
2016 reporting any past-year use, down substantially
from 23% in 2010. Of note is the fact that the majority of
users of small cigars in each grade smoke flavored ones.
Annual prevalence of smoking tobacco using a Hookah
(water pipe) had been increasing steadily until 2014
among 12th graders (8th and 10th graders are not asked
about this practice), reaching 23% in 2014; but use
declined non-significantly by three percentage points to
20% in 2015 and declined significantly (by 6.9
percentage points) to reach 13% in 2016.
Smokeless tobacco. From the mid-1990s to the early
2000s, smokeless tobacco use declined substantially, but
a rebound in use developed from the mid-2000s through
2010. Since 2010, prevalence levels have declined
modestly in all three grades. Perceived risk and
disapproval appear to have played important roles in the
earlier decline in smokeless tobacco use. In all three
grades, perceived risk and disapproval rose fairly steadily
from 1995 through 2004, accompanying the declines in
use. However, there was not much change between 2004
and 2010, suggesting that other factors may have led to
the increases in smokeless tobacco use during that time
interval. : perhaps including increased promotion of these
products, a proliferation of types of smokeless tobacco
products available, and increased restrictions on places
where cigarette smoking is permitted. The decline in
smokeless tobacco use since 2010 (including a significant
decline among 12th graders in 2015 and 10th graders in
2016) may be attributable, at least in part, to the 2009
increase in federal taxes on tobacco. Perceived risk has
not changed appreciably since 2010 at any grade level.
Alcohol remains the substance most widely used by
today’s teenagers. Despite recent declines, six out of
every ten students (61%) have consumed alcohol (more
than just a few sips) by the end of high school, and about
a quarter (23%) have done so by 8th grade. In fact, nearly
half (46%) of 12th graders and one in eleven (9%) 8th
graders in 2016 reported having been drunk at least once
in their life.
Alcohol use began a substantial decline in the 1980s. To
some degree, alcohol trends have tended to parallel the
trends in illicit drug use. These include a modest increase
in binge drinking (defined as having five or more drinks
in a row at least once in the past two weeks) in the early
to mid-1990s, though it was a proportionally smaller
increase than was seen for cigarettes and most of the illicit
drugs. Fortunately, binge drinking rates leveled off in the
early 2000s, just about when the illicit drug rates began to
turn around, and in 2002, a drop in drinking and
drunkenness resumed in all grades. Gradual declines
continued into 2016, which marked the lowest levels for
7
alcohol use and drunkenness ever recorded by the survey
in the three grades combined. All three grades showed
further decline in 2016. The declines in the percentage
reporting having been drunk at least once are quite
substantial, down from the peak year since 1991 by about
70%, 50%, and 30% for grades 8, 10, and 12.
Vaping
Vaping involves the inhalation of vapors (sometimes
including nicotine) using devices such as e-cigarettes,
“mods,” and e-pens. Thirty-day prevalence of vaping fell
significantly in each grade in 2016. It declined by 1.8
percentage points in 8th grade, by 3.3 percentage points in
10th grade, and by 3.8 percentage points in 12th grade, to
levels of 6%, 11%, and 13% in the respective grades.
This marks the first reversal of vaping prevalence, which
grew rapidly from near zero prevalence in 2011 to one of
the most common forms of adolescent substance use.
Despite the decline in 2016 the prevalence of vaping
remains substantially higher than the use of any other
tobacco product, including cigarettes. Whether teen
vaping has peaked or only paused is an issue that MTF
will be able to determine in the coming years.
The percentage of students who associated vaping with
“great risk” increased slightly as vaping prevalence
declined. E-cigarettes are the most commonly used
vaping device, and from 2015 to 2016 the percentage of
adolescents who believe that regular e-cigarette use poses
a great risk of harm increased from 16% to 18% in 12th
grade, from 17% to 19% in 10th grade, and from 19% to
21% in 8th grade. Even after these increases, e-cigarettes
have some of the lowest levels of perceived risk of any
substance.
One reason for low levels of perceived risk may be that
the majority of users say that they vape only flavoring not
nicotine, on their most recent occasion of use. This is
consistent with the fact that only a very few of them (from
5% to 10% of users) say they are using e-cigarettes to help
them quit regular cigarette use. The most common reason
given for use is “to see what it’s like,” while the second
most common reason given is “because it tastes good.”
8
Any Illicit Drug
MTF routinely reports three different indexes of illicit
drug use—any illicit drug,7 any illicit drug other than
marijuana, and any illicit drug including inhalants. In
this section we discuss only the first two; the statistics
for all three may be found in Tables 5–7.
In order to make direct comparisons over time, we have
kept the definitions and measurement of these indexes
constant. The levels of prevalence of each of the
indexes could be somewhat affected by the inclusion
of newer substances. Typically, the effects would be
minimal, primarily because most individuals using
newer ones are also using the more prevalent drugs
included in the indexes. The major exception has been
inhalants, the use of which is quite prevalent in the
lower grades, so in 1991 a special index that includes
inhalants was added.
Trends in Use
In the late 20th century, U.S. adolescents reached
extraordinarily high levels of illicit drug use by U.S. as
well as international standards. The trends in lifetime
use of any illicit drug are shown in the first (upper left)
panel on the facing page.8 In 1975, when MTF began,
the majority of young people (55%) had used an illicit
drug by the time they left high school. This figure rose
to two thirds (66%) in 1981 before a long and gradual
decline to 41% by 1992—the low point. After 1992—
in what we have called the “relapse phase” in the drug
epidemic—the proportion rose considerably to a recent
high point of 55% in 1999; it then declined gradually
to 47% in 2009, and has remained between 48% and
50% since 2011.
Trends for annual, as opposed to lifetime, prevalence
are shown in the second (upper right) panel. They are
quite parallel to those for lifetime prevalence, but at a
lower level. Among 8th graders, a gradual and
continuing falloff occurred after 1996. Peak rates since
1991 were reached in 1997 in the two upper grades and
declined little for several years. Between 2001 and
2007 all three grades showed declines, but the annual
use rates in all three grades rose some through 2012. In
2016, 8th and 10th grades showed some decline,while
7Footnote ‘a’ to Tables 5 through 8 provides the exact
definition of any illicit
drug.
8This is the only set of figures in this Overview presenting
lifetime use statistics.
Lifetime statistics for all drugs may be found in Table 5.
annual prevalence among 12th grader showed
essentially no change.
Because marijuana is much more prevalent than any
other illicit drug, trends in its use tend to drive the index
of any illicit drug use. Thus we also report an index that
excludes marijuana and shows the proportions of
students who use any of the other illicit drugs. The
proportions who have used any illicit drug other than
marijuana in their lifetimes are shown in the third
panel (lower left). In 1975 over one third (36%) of 12th
graders had tried some illicit drug other than marijuana.
This figure rose to 43% by 1981, then declined for over
a decade to a low of 25% in 1992. An increase followed
in the 1990s as the use of a number of drugs rose
steadily, and it reached 30% by 1997. (In 2001 it was
31%, but this apparent upward shift in the estimate was
an artifact due to a change in the question wording for
“other hallucinogens” and tranquilizers.9) Lifetime
prevalence among 12th graders then fell slightly to 24%
by 2009, before dropping to 21% by 2016. The fourth
(lower right) panel presents the annual prevalence data
for any illicit drug other than marijuana, which shows
a pattern of change over the past few years similar to
the index of any illicit drug use, but with much less
pronounced change since 1991. It dropped fairly
steadily and gradually in all three grades in recent years
but leveled in 2013 before dropping to 14%.among 12th
graders by 2016. In fact, prevalence declined in all
three grades in 2016—significantly so in 8th grade.
Overall, these data reveal that while use of individual
drugs (other than marijuana) may fluctuate widely, the
proportion using any of them is much more stable. In
other words, the proportion of students prone to using
such drugs and willing to cross the normative barriers
to such use changes more gradually. The usage rate for
each individual drug, on the other hand, reflects many
more rapidly changing determinants specific to that
drug, such as how widely its psychoactive potential is
recognized, how favorable the reports of its supposed
benefits are, how risky its use is seen to be, how
acceptable it is in the peer group, how accessible it is,
and so on.
9The term psychedelics was replaced with hallucinogens, and
shrooms was added
to the list of examples, resulting in somewhat more respondents
indicating use of
this class of drugs. For tranquilizers, Xanax was added to the
list of examples
given, slightly raising the reported prevalence of use.
9
Any Illicit Drug and Any Illicit Drug Other than Marijuana:
Trends in Lifetime and Annual Use
Grades 8, 10, 12
Source. The Monitoring the Future study, the University of
Michigan.
*In 2001, a revised set of questions on other hallucinogen use
and tranquilizer use were introduced. In 2013, a revised set of
questions
on amphetamine use was introduced. Data for any illicit drug
other than marijuana were affected by these changes.
Use
% who used any illicit drug in lifetime
Use
% who used any illicit drug in last 12 months
Use
% who used any illicit drug other than
marijuana in lifetime*
Use
% who used any illicit drug other than
marijuana in last 12 months*
P
E
R
C
E
N
T
0
20
40
60
80
100
YEAR
'74 '76 '78 '80 '82 '84 '86 '88 '90 '92 '94 '96 '98 '00 '02 '04 '06
'08 '10 '12 '14 '16
8th Grade
10th Grade
12th Grade
P
E
R
C
E
N
T
0
20
40
60
80
100
YEAR
'74 '76 '78 '80 '82 '84 '86 '88 '90 '92 '94 '96 '98 '00 '02 '04 '06
'08 '10 '12 '14 '16
P
E
R
C
E
N
T
0
20
40
60
80
100
YEAR
'74 '76 '78 '80 '82 '84 '86 '88 '90 '92 '94 '96 '98 '00 '02 '04 '06
'08 '10 '12 '14 '16
P
E
R
C
E
N
T
0
20
40
60
80
100
YEAR
'74 '76 '78 '80 '82 '84 '86 '88 '90 '92 '94 '96 '98 '00 '02 '04 '06
'08 '10 '12 '14 '16
10
Marijuana
Marijuana has been the most widely used illicit drug
throughout MTF’s 42-year history. It can be taken
orally, mixed with food or drink, and smoked,
including in a concentrated form as hashish—the use
of which is much more common in Europe.10 The great
majority of recreational use in the U.S. involves
smoking it in rolled cigarettes (“joints”), in pipes or
water pipes (“bongs”), in hollowed-out cigars
(“blunts”), or more recently in a vaporizer. Newer
methods also include smoking or eating different forms
of resin extracts like hash oil, honey oil, or shatter—a
solid form.
Trends in Use
Annual marijuana prevalence peaked among 12th
graders in 1979 at 51%, following a rise that began
during the 1960s. Then use declined fairly steadily for
13 years, bottoming at 22% in 1992—a decline of more
than half. The 1990s, however, saw a resurgence of
use. After a considerable increase (one that actually
began among 8th graders a year earlier than among 10th
and 12th graders), annual prevalence rates peaked in
1996 at 8th grade and in 1997 at 10th and 12th grades.
After these peak years, use declined among all three
grades through 2007 or 2008. After these declines, an
upturn occurred in use in all three grades, lasting for
three years in the lower grades and longer in grade 12.
Annual marijuana prevalence among 8th graders
increased in use from 2007 to 2010, decreased slightly
from 2010 to 2012, and then declined significantly in
2016. Among 10th graders, use increased somewhat
from 2008 to 2013 and then declined after that. Among
12th graders, use increased from 2006 to 2011 and then
held level through 2016. As shown in Table 8, daily use
increased in all three grades after 2007, reaching peaks
in 2011 (at 1.3% in 8th), 2013 (at 4.0% in 10th), and
2011 (at 6.6% in 12th), before declining slightly since.
Daily prevalence rates in 2016 were 0.7%, 2.5%, and
6.0%, respectively, with one in seventeen 12th graders
smoking daily.
Perceived Risk
The proportion of students seeing great risk from
smoking marijuana regularly fell during the rise in use
in the 1970s and again during the subsequent rise in use
in the 1990s. Indeed, for 10th and 12th grades, perceived
risk declined a year before use rose in the upturn of the
1990s, making perceived risk a leading indicator of
10Compared with Europe, American teens have high rates of
illicit drug use
http://monitoringthefuture.org/pressreleases/16ESPADpr.pdf
change in use. (The same may have happened for 8th
grade as well, but we lack data starting early enough to
know.) The decline in perceived risk halted in 1996 in
8th and 10th grades; the increases in use in 10th and 12th
grades ended a year or two later, again making
perceived risk a leading indicator of trends in use. From
1996 to 2000, perceived risk held fairly steady, and the
decline in use in the upper grades stalled. After some
decline prior to 2002, perceived risk increased a bit in
all grades through 2004 as use decreased. Since 2004
in 8th grade, 2005 in 12th grade, and 2008 in 10th grade,
perceived risk has fallen substantially, presaging some
resurgence in marijuana use lasting three to five years;
but no increase in perceived risk preceded the recent
leveling of use. Rather, perceived risk has continued a
steep decline since the mid-2000s without a
concomitant further rise in overall use. Disapproval
and availability may be constraining factors offsetting
the effects of risk. Recent, sharp declines in the use of
“gateway drugs”—in particular cigarette smoking,
with which marijuana use has been highly correlated—
may also be playing a role
Disapproval
Personal disapproval of trying marijuana has declined
some since 2007 or 2008 in all three grades, but still
remains quite high with 82%, 74%, and 69% in 8th,
10th, and 12th grades still saying that they disapprove of
regular use. Disapproval fell considerably among 8th
graders between 1991 and 1996 and among 10th and
12th graders between 1992 and 1997—by 17, 21, and
19 percentage points, respectively, over those intervals
of increasing use and declining perceived risk. As is
often the case, perceived risk fell before disapproval.
Since 2008 there has been some decline in disapproval.
Availability
Since the MTF study began in 1975, between 80% and
90% of 12th graders each year have said that they could
get marijuana fairly easily or very easily if they wanted
some, with that figure standing at 81% in 2016.
Marijuana has been considerably less readily available
to 8th graders, with 35% in 2016 reporting it to be fairly
or very easy to get. Availability is intermediate for the
10th graders, with 64% reporting easy access in 2016.
Availability has declined appreciably, especially
among the younger adolescents, but marijuana remains
readily available to most 12th graders.
11
Marijuana: Trends in Annual Use, Risk, Disapproval, and
Availability
Grades 8, 10, 12
Source. The Monitoring the Future study, the University of
Michigan.
Use
% who used in last 12 months
Risk
% seeing "great risk" in using regularly
Disapproval
% disapproving of using regularly
Availability
% saying "fairly easy" or "very easy" to get
P
E
R
C
E
N
T
0
20
40
60
80
100
YEAR
'74 '76 '78 '80 '82 '84 '86 '88 '90 '92 '94 '96 '98 '00 '02 '04 '06
'08 '10 '12 '14 '16
8th Grade
10th Grade
12th Grade
P
E
R
C
E
N
T
0
20
40
60
80
100
YEAR
'74 '76 '78 '80 '82 '84 '86 '88 '90 '92 '94 '96 '98 '00 '02 '04 '06
'08 '10 '12 '14 '16
P
E
R
C
E
N
T
0
20
40
60
80
100
YEAR
'74 '76 '78 '80 '82 '84 '86 '88 '90 '92 '94 '96 '98 '00 '02 '04 '06
'08 '10 '12 '14 '16
P
E
R
C
E
N
T
0
20
40
60
80
100
YEAR
'74 '76 '78 '80 '82 '84 '86 '88 '90 '92 '94 '96 '98 '00 '02 '04 '06
'08 '10 '12 '14 '16
12
Synthetic Marijuana
Synthetic marijuana has generally been sold over the
counter under such labels as Spice and K-2. It usually
contains some herbal materials that have been sprayed
with one or more of the designer chemicals that fall into
the cannabinoid family. Until March 2011, these drugs
were not scheduled by the Drug Enforcement
Administration (DEA), so they were readily and
legally available on the Internet and in convenience
stores, head shops, gas stations, etc. However, the DEA
scheduled some of the most widely used chemicals
beginning March 1, 2011, making their possession and
sale no longer legal; subsequent laws have expanded
the list of banned chemicals, but producers keep
tweaking the chemical formula to avoid legal control.
These drugs can be dangerous both because the active
ingredients keep changing and because those
ingredients have never undergone testing to determine
their effects on humans.
Trends in Use
MTF first addressed the use of synthetic marijuana in
its 2011 survey by asking 12th graders about their use
in the prior 12 months (which would have covered a
considerable period of time prior to the drugs being
scheduled). Annual prevalence was found to be 11.4%,
making synthetic marijuana the second most widely
used class of illicit drug after marijuana itself among
12th graders at that time. Despite the DEA’s
intervention, use among 12th graders remained
unchanged in 2012 at 11.3%, which suggests either that
compliance with the new scheduling had been limited
or that producers of these products succeeded in
continuing to change their chemical formulas to avoid
using the ingredients that had been scheduled. In 2012,
for the first time, 8th and 10th graders were asked about
their use of synthetic marijuana; their annual
prevalence rates were 4.4% and 8.8%, respectively.
Use in all 3 grades dropped in 2013, and the decline
was sharp and significant among 12th graders, while the
declines were significant for both 10th and 12th graders
in 2014 and continued through 2016, with significant
declines in both 10th and 12th grades. Annual
prevalence in 2016 was down to 2.7%, 3.3%, and 3.5%
for the three grades, reflecting a dramatic drop in use.
Perceived Risk
All three grades were asked whether they associated
great risk with trying synthetic marijuana once or
twice. As can be seen on the facing page, the level of
perceived risk for experimental use was quite low in
2012 (between 24% and 25%) but has risen some,
particularly among 12th graders, to 36% in 2016.
(Likely the pecent would be higher if those answering
“Can’t say, Drug unfamiliar” were excluded.) The
availability of these drugs over the counter probably
has had the effect of communicating to teens that they
must be safe, though they are not.
Disapproval and Availability have not been measured
for this class of drugs.
13
Synthetic Marijuana: Trends in Annual Use and Risk
Grades 8, 10, 12
Source. The Monitoring the Future study, the University of
Michigan.
Use
% who used in last 12 months
Risk
% seeing "great risk" in using once or twice
Disapproval
% disapproving of using once or twice
Availability
% saying "fairly easy" or "very easy" to get
P
E
R
C
E
N
T
0
4
8
12
16
20
YEAR
'74 '76 '78 '80 '82 '84 '86 '88 '90 '92 '94 '96 '98 '00 '02 '04 '06
'08 '10 '12 '14 '16
8th Grade
10th Grade
12th Grade
P
E
R
C
E
N
T
0
20
40
60
80
100
YEAR
'74 '76 '78 '80 '82 '84 '86 '88 '90 '92 '94 '96 '98 '00 '02 '04 '06
'08 '10 '12 '14 '16
P
E
R
C
E
N
T
0
20
40
60
80
100
YEAR
'74 '76 '78 '80 '82 '84 '86 '88 '90 '92 '94 '96 '98 '00 '02 '04 '06
'08 '10 '12 '14 '16
(no data)
P
E
R
C
E
N
T
0
20
40
60
80
100
YEAR
'74 '76 '78 '80 '82 '84 '86 '88 '90 '92 '94 '96 '98 '00 '02 '04 '06
'08 '10 '12 '14 '16
(no data)
14
Inhalants
Inhalants are any gases or fumes that can be inhaled for
the purpose of getting high. These include many
household products—the sale and possession of which
is legal—including glue, nail polish remover, gasoline,
solvents, butane, and propellants used in certain
commercial products such as whipped cream
dispensers. Unlike nearly all other classes of drugs,
their use is most common among younger adolescents
and tends to decline as youth grow older. The use of
inhalants at an early age may reflect the fact that many
inhalants are cheap, readily available (often in the
home), and legal to buy and possess. The decline in use
with age likely reflects their coming to be seen as
“kids’ drugs,” in addition to the fact that a number of
other drugs become available to older adolescents, who
are also more able to afford them.
Trends in Use
Inhalant use (excluding the use of nitrite inhalants) by
12th graders rose gradually from 1976 to 1987, which
was somewhat unusual because most other forms of
illicit drug use were in decline during the 1980s. Use of
inhalants rose among 8th and 10th graders from 1991,
when those grades were first included in the study,
through 1995; it rose among 12th graders from 1992 to
1995. All grades then exhibited a fairly steady and
substantial decline in use through 2001 or 2002. After
2001 the grades diverged somewhat in their trends: 8th
graders showed a significant increase in use for two
years, followed by a decline from 2004 to 2013, and a
leveling in 2014, before resuming the decline in 2015
and 2016; 10th graders showed an increase after 2003
but a considerable decline since 2007; and 12th graders
showed a brief increase from 2003 to 2005 but also a
considerable decline since then. For the three grades
combined, annual use declined significantly in both
2012 and 2013, held steady in 2014 and then declined
further in 2015 and 2016.
Perceived Risk
Only 8th and 10th graders have been asked questions
about the degree of risk they associate with inhalant
use. Relatively low proportions think that there is a
“great risk” in using an inhalant once or twice.
However, significant increases in this belief were
observed between 1995 and 1996 in both 8th and 10th
grades, probably due to an anti-inhalant advertising
initiative launched by The Partnership for a Drug-Free
America. That increase in perceived risk marked the
beginning of a long and important decline in inhalant
use, when no other drugs showed a turnaround in use.
However, the degree of risk associated with inhalant
use declined steadily between 2001 and 2008 among
both 8th and 10th graders, perhaps explaining the
increase in use in 2003 among 8th graders and in 2004
in the upper grades. The hazards of inhalant use were
communicated during the mid-1990s, but generational
forgetting of those hazards has likely taken place as
replacement cohorts who were too young to get that
earlier message now comprise the nation’s adolescents.
The decline in perceived risk is worrisome, though
perceived risk has not changed much since about 2008.
In this case, the decline in perceived risk (between
2001 and 2008) did not translate into a large surge in
use, but it may leave future class cohorts at risk for a
resurgence of inhalant use.
Disapproval
Over 80% of 8th and 10th grade students say that they
would disapprove of even trying an inhalant. (The
question was not asked of 12th graders.) There was a
very gradual upward drift in this attitude among 8th and
10th graders from 1995 through about 2001, with a
gradual falloff since then in both grades. For 8th graders
there has been some decline in disapproval of trying
inhalants since 2012. Since 2013 it has dropped among
10th graders as well, including significant declines in
2015 and a continuing decline in 2016.
Availability
Respondents have not been asked about the availability
of inhalants, because we assume that these products are
universally available to young people in these age
ranges.
15
Inhalants: Trends in Annual Use, Risk, and Disapproval
Grades 8, 10, 12
Source. The Monitoring the Future study, the University of
Michigan.
Use
% who used in last 12 months
Risk
% seeing "great risk" in using once or twice
Disapproval
% disapproving of using once or twice
Availability
% saying "fairly easy" or "very easy" to get
P
E
R
C
E
N
T
0
6
12
18
24
30
YEAR
'74 '76 '78 '80 '82 '84 '86 '88 '90 '92 '94 '96 '98 '00 '02 '04 '06
'08 '10 '12 '14 '16
8th Grade
10th Grade
12th Grade
P
E
R
C
E
N
T
0
20
40
60
80
100
YEAR
'74 '76 '78 '80 '82 '84 '86 '88 '90 '92 '94 '96 '98 '00 '02 '04 '06
'08 '10 '12 '14 '16
P
E
R
C
E
N
T
0
20
40
60
80
100
YEAR
'74 '76 '78 '80 '82 '84 '86 '88 '90 '92 '94 '96 '98 '00 '02 '04 '06
'08 '10 '12 '14 '16
P
E
R
C
E
N
T
0
20
40
60
80
100
YEAR
'74 '76 '78 '80 '82 '84 '86 '88 '90 '92 '94 '96 '98 '00 '02 '04 '06
'08 '10 '12 '14 '16
(no data)
16
LSD
For some years, LSD was the most widely used drug
within the larger class of hallucinogens. This was no
longer true for some following years, due to sharp
decreases in its use combined with an increasing use of
psilocybin. (Statistics on overall hallucinogen use and
on use of hallucinogens other than LSD are shown in
the tables at the end of this report.) Now overall
hallucinogen use and use of hallucinogens other than
LSD are about equivalent due to a drop in the use of
the other hallucinogens.
Trends in Use
Annual prevalence of LSD use among 12th graders has
been below 10% since MTF began. Use declined some
for the first 10 years among 12th graders, likely
continuing a decline that had begun before 1975. Use
was fairly level in the latter half of the 1980s but, as
was true for a number of other drugs, rose in all three
grades between 1991 and 1996. Between 1996 and
2006 or so, use declined in all three grades, with
particularly sharp declines between 2001 and 2003.
Since then use has remained at very low levels
although there has been a slight increase in the upper
grades since 2013.
Perceived Risk
We think it likely that perceived risk for LSD use
increased during the early 1970s, before MTF began,
as concerns grew about possible neurological and
genetic effects (most of which were never scientifically
confirmed) as well as “bad trips” and “flashbacks.”
However, there was some decline in perceived risk in
the late 1970s, after which it remained fairly level
among 12th graders through most of the 1980s. A
substantial decline occurred in all grades in the early
1990s as use rose. Since about 2000, perceived risk
declined steadily and substantially among 8th graders
until 2007, when it leveled; it declined considerably
among 10th graders before leveling around 2002,
dropping through 2007, and then leveling after that.
Among 12th graders, perceived risk has held fairly
steady after 2002, at least until 2014 when some
decline began. The decline in the lower grades suggests
that younger teens may be less knowledgeable about
this drug’s effects than their predecessors—through
what we have called “generational forgetting”—
making them vulnerable to a resurgence in use. (The
percentages who respond “can’t say, drug unfamiliar”
to questions about LSD have risen in recent years,
consistent with the notion of “generational
forgetting.”)
The decline of LSD use in recent years, despite a fall in
perceived risk, suggests that some factors other than a
change in underlying attitudes and beliefs were
contributing to the downturn—prior to 2001 some
displacement by ecstasy may have been a factor, while
more recently a decline in availability (discussed
below) likely is a factor.
Disapproval
Disapproval of LSD use was quite high among 12th
graders through most of the 1980s but began to decline
after 1991 along with perceived risk. All three grades
exhibited a decline in disapproval through 1996, with
disapproval of experimentation dropping 11
percentage points between 1991 and 1996 among 12th
graders. After 1996 a slight increase in disapproval
emerged among 12th graders, accompanied by a
leveling among 10th graders and some further decline
among 8th graders. Since 2001, disapproval of LSD use
has diverged among the three grades, declining
considerably among 8th graders, declining less among
10th graders, and increasing significantly among 12th
graders. Note, however, that the percentages of 8th and
10th graders who respond with “can’t say, drug
unfamiliar” increased through 2008; thus the base for
disapproval has shrunk, suggesting that the real decline
of disapproval among the younger students is less than
it appears here. There has been rather little change in
disapproval over the past eight years (or more years in
the case of 12th graders.)
Availability
Reported availability of LSD by 12th graders fell
considerably from 1975 to 1979, declined a bit further
until 1986, and then began a substantial rise, reaching
a peak in 1995. LSD availability also rose somewhat
among 8th and 10th graders in the early 1990s, reaching
a peak in 1995 or 1996. Since those peak years, there
has been considerable falloff in availability in all three
grades, quite possibly in part because fewer students
have LSD-using friends from whom they could gain
access. There was also very likely a decrease in supply
due to the closing of a major LSD-producing lab by the
Drug Enforcement Administration in 2000. It is clear
that attitudinal changes cannot explain the recent
declines in use.
17
LSD: Trends in Annual Use, Risk, Disapproval, and Availability
Grades 8, 10, 12
Source. The Monitoring the Future study, the University of
Michigan.
Use
% who used in last 12 months
Risk
% seeing "great risk" in using once or twice
Disapproval
% disapproving of using once or twice
Availability
% saying "fairly easy" or "very easy" to get
P
E
R
C
E
N
T
0
6
12
18
24
30
YEAR
'74 '76 '78 '80 '82 '84 '86 '88 '90 '92 '94 '96 '98 '00 '02 '04 '06
'08 '10 '12 '14 '16
8th Grade
10th Grade
12th Grade
P
E
R
C
E
N
T
0
20
40
60
80
100
YEAR
'74 '76 '78 '80 '82 '84 '86 '88 '90 '92 '94 '96 '98 '00 '02 '04 '06
'08 '10 '12 '14 '16
P
E
R
C
E
N
T
0
20
40
60
80
100
YEAR
'74 '76 '78 '80 '82 '84 '86 '88 '90 '92 '94 '96 '98 '00 '02 '04 '06
'08 '10 '12 '14 '16
P
E
R
C
E
N
T
0
20
40
60
80
100
YEAR
'74 '76 '78 '80 '82 '84 '86 '88 '90 '92 '94 '96 '98 '00 '02 '04 '06
'08 '10 '12 '14 '16
18
Cocaine
Cocaine was used almost exclusively in powder form
for some years, though “freebasing” emerged for a
while. The early 1980s brought the advent of crack
cocaine. Our original questions did not distinguish
among different forms of cocaine or modes of
administration. Since 1987, though, we have asked
separate questions about the use of crack and “cocaine
other than crack,” which has consisted almost entirely
of powder cocaine use. Data on cocaine use in general
(i. e., all forms of cocaine) are presented in the figures
in this section, and results for crack alone are presented
in the next section.
Trends in Use
There have been some important changes in the levels
of overall cocaine use over the life of MTF. Use among
12th graders originally burgeoned in the late 1970s and
remained fairly stable through the first half of the 1980s
before starting a precipitous decline after 1986. Annual
prevalence among 12th graders dropped by about three
quarters between 1986 and 1992. Between 1992 and
1999, use reversed course again during the relapse
phase of the overall drug epidemic and doubled before
declining by 2000. Use also rose among 8th and 10th
graders after 1992 before reaching peak levels in 1998
and 1999. Over the last sixteen years, use has declined
in all three grades; annual 12th-grade use stands at a
historic low of just 2.3% in 2016, with use by 8th and
10th graders still lower, at 0.8% and 1.3%.
Perceived Risk
Questions about the dangers of cocaine in general
(without specifying any particular form of cocaine)
have been asked only of 12th graders. The results tell a
fascinating story. They show that perceived risk for
experimental use fell in the latter half of the 1970s
(when use was rising), stayed level in the first half of
the 1980s (when use was level), and then jumped very
sharply in a single year (by 14 percentage points
between 1986 and 1987), just when the substantial
decline in use began. The year 1986 was marked by a
national media frenzy over crack cocaine and also by
the widely publicized cocaine-related death of Len
Bias, a National Basketball Association first-round
draft pick. Bias’ death was originally reported as
resulting from his first experience with cocaine.
Though that was later proven to be incorrect, the
11Among 12th graders trends in perceived risk in Table 8 show
a particularly sharp
rise from 34% in 1986 to 48% in 1987 for trying cocaine once
or twice.
message had already “taken.” We believe that this
event helped to persuade many young people that use
of cocaine at any level is dangerous, no matter how
healthy the individual.11 Perceived risk continued to
rise through 1991 as the fall in use continued.
Perceived risk declined modestly from 1991 to 2000,
and use rose from 1992–2000. Perceived risk has
leveled in recent years at far higher levels than existed
prior to 1987, and there was a gradual upward drift for
about six years in grades 8 and 10, before leveling. For
the 12th graders perceived risk also increased for about
six years before leveling after 2013. There is as yet little
evidence of generational forgetting of cocaine’s risks.
For 12th graders, survey questions on both risk and
disapproval referred to cocaine in general, until 1986.
After that they referred to cocaine powder and crack
separately, as did the questions asked of 8th and 10th
graders. The question change seemed to matter rather
little in the results.
Disapproval
Disapproval of cocaine use by 12th graders followed a
cross-time pattern similar to that for perceived risk,
although its seven-percentage-point jump in 1987 was
not quite as pronounced. Some decline from 1991 to
1997 was followed by a period of stability. Subsequent
years showed a gradual increase in disapproval in all
three grades. This upward drift ended in recent years,
but disapproval of even trying cocaine remains very
high and is above 85% in all grades in 2016.
Availability
The proportion of 12th graders saying that it would be
“fairly easy” or “very easy” for them to get cocaine if
they wanted some was 33% in 1977, rose to 48% by
1980 as use rose, and held fairly level through 1982; it
increased steadily to 59% by 1989 (in a period of
rapidly declining use). Perceived availability then fell
back to about 47% by 1994. Since around 1997,
perceived availability of cocaine has fallen
considerably in all three grades. Among 12th graders it
stood at 29% in 2016—about half of its peak level in
1989. Note that the pattern of change does not map well
onto the pattern of actual use, suggesting that changes
in overall availability have not been a major
determinant of use—particularly during the sharp
decline in use in the late 1980s.
19
Cocaine (including Crack): Trends in Annual Use, Risk,
Disapproval, and Availability
Grades 8, 10, 12
Source. The Monitoring the Future study, the University of
Michigan.
*Prior to 1991, data reported here is based on questions on use
of cocaine in general. Starting in 1991,
data based on questions on use of cocaine powder specifically.
Use
% who used in last 12 months
Risk*
% seeing "great risk" in using once or twice
Disapproval*
% disapproving of using once or twice
Availability*
% saying "fairly easy" or "very easy" to get
P
E
R
C
E
N
T
0
4
8
12
16
20
YEAR
'74 '76 '78 '80 '82 '84 '86 '88 '90 '92 '94 '96 '98 '00 '02 '04 '06
'08 '10 '12 '14 '16
8th Grade
10th Grade
12th Grade
P
E
R
C
E
N
T
0
20
40
60
80
100
YEAR
'74 '76 '78 '80 '82 '84 '86 '88 '90 '92 '94 '96 '98 '00 '02 '04 '06
'08 '10 '12 '14 '16
P
E
R
C
E
N
T
0
20
40
60
80
100
YEAR
'74 '76 '78 '80 '82 '84 '86 '88 '90 '92 '94 '96 '98 '00 '02 '04 '06
'08 '10 '12 '14 '16
P
E
R
C
E
N
T
0
20
40
60
80
100
YEAR
'74 '76 '78 '80 '82 '84 '86 '88 '90 '92 '94 '96 '98 '00 '02 '04 '06
'08 '10 '12 '14 '16
20
Crack
Several indirect indicators suggest that crack use grew
rapidly in the period 1983–1986, beginning before we
had direct measures of its use. In 1986 a single usage
question was included in one of the five 12th-grade
questionnaire forms, asking those who indicated any
cocaine use in the prior 12 months if they had used
crack. The results from that question represent the first
data point in the first panel on the facing page. After
that, three questions about crack use covering the usual
three prevalence periods were introduced into several
questionnaire forms.
Trends in Use
Clearly crack use rose rapidly in the early 1980s,
judging by the 4% annual prevalence reached in 1986;
but after 1986 there was a precipitous drop in crack use
among 12th graders; the drop continued through 1991.
After 1991 for 8th and 10th graders (when data were first
available) and after 1993 for 12th graders, all three
grades showed a slow, steady increase in use through
1998 during the relapse phase of the overall drug
epidemic. Since 1999, annual prevalence dropped by
about 75% in 8th grade, 82% in 10th grade, and 70% in
12th grade. Today use of crack is at historic lows in all
three grades. As with many drugs, the decline at 12th
grade lagged behind those in the lower grades due to a
cohort effect.
Perceived Risk
By the time we added questions about the perceived
risk of using crack in 1987, crack was already seen by
12th graders as one of the most dangerous illicit drugs:
57% saw a great risk in even trying it. This compared
to 54% for heroin, for example. Perceived risk for
crack rose still higher through 1990, reaching 64% of
12th graders who said they thought there was a great
risk in taking crack once or twice. (Use was dropping
during that interval.) After 1990 some falloff in
perceived risk began, well before crack use began to
increase in 1994, making perceived risk again a leading
indicator. Between 1991 and 1998 there was a
considerable falloff in this belief in grades 8 and 10, as
use rose steadily. Perceived risk leveled in 2000 in
grades 8 and 12 and a year later in grade 10. We think
that the declines in perceived risk for crack and cocaine
during the 1990s may well reflect an example of
generational forgetting wherein the class cohorts that
were in adolescence when the adverse consequences
were most obvious (i.e., in the mid-1980s) were
replaced by cohorts who were less knowledgeable
about the dangers. By 2016 perceived risk for crack
had leveled in all three grades.
Disapproval
Disapproval of crack use was not assessed until 1990,
when it was at a very high level, with 92% of 12th
graders saying that they disapproved of even trying it.
Disapproval of crack use declined slightly but steadily
in all three grades from 1991 through about 1997. After
1997, disapproval in all three grades rose back to high
levels by 2012 before beginning a slight decline.
Availability
Crack availability did not change dramatically in the
early years for which data are available. It began a
sustained decline after 1995 among 8th graders, after
1999 among 10th graders, and after 2000 among 12th
graders. Since 2000, availability has declined
considerably, particularly in the upper grades.
NOTE: The distinction between crack cocaine and
other forms of cocaine (mostly powder) was made
several years after the study’s inception. The figures on
the facing page begin their trend lines when these
distinctions were introduced. Figures are not presented
here for the “other forms of cocaine” measures, simply
because the trend curves look extremely similar to
those for crack. (All statistics are contained in the tables
presented later.) Although the trends are very similar,
the absolute levels of use, risk, etc., are somewhat
different. Usage levels tend to be higher for cocaine
powder compared to crack, and the levels of perceived
risk a bit lower, while disapproval has been close for
the two different forms of cocaine and relative
availability has varied (Tables 15 through 17).
21
Crack: Trends in Annual Use, Risk, Disapproval, and
Availability
Grades 8, 10, 12
Source. The Monitoring the Future study, the University of
Michigan.
Use
% who used in last 12 months
Risk
% seeing "great risk" in using once or twice
Disapproval
% disapproving of using once or twice
Availability
% saying "fairly easy" or "very easy" to get
P
E
R
C
E
N
T
0
2
4
6
8
10
YEAR
'74 '76 '78 '80 '82 '84 '86 '88 '90 '92 '94 '96 '98 '00 '02 '04 '06
'08 '10 '12 '14 '16
8th Grade
10th Grade
12th Grade
P
E
R
C
E
N
T
0
20
40
60
80
100
YEAR
'74 '76 '78 '80 '82 '84 '86 '88 '90 '92 '94 '96 '98 '00 '02 '04 '06
'08 '10 '12 '14 '16
P
E
R
C
E
N
T
0
20
40
60
80
100
YEAR
'74 '76 '78 '80 '82 '84 '86 '88 '90 '92 '94 '96 '98 '00 '02 '04 '06
'08 '10 '12 '14 '16
P
E
R
C
E
N
T
0
20
40
60
80
100
YEAR
'74 '76 '78 '80 '82 '84 '86 '88 '90 '92 '94 '96 '98 '00 '02 '04 '06
'08 '10 '12 '14 '16
22
Amphetamines and Other Stimulant Drugs
Amphetamines, a class of psychotherapeutic stim-
ulants, had a relatively high prevalence of use in the
youth population for many years. The behavior
reported here excludes any use under medical
supervision. Amphetamines are controlled sub-
stances—they are not legally bought or sold without a
doctor’s prescription—but some are diverted from
legitimate channels, and some are manufactured and/or
imported illegally. There are other controlled
stimulants that are also included, like Ritalin which is
used to treat ADHD, as is Adderall, the most prevalent
of the amphetamines.
Trends in Use
The use of these stimulants rose in the last half of the
1970s, reaching a peak in annual prevalence of 26% in
1981 (likely exaggerated due to commonly used “look-
alikes”)—two years after marijuana use peaked. From
1981 to 1992, 12th graders reported a steady and very
substantial decline in their use, reaching 7%.
As with many other illicit drugs, these stimulants made
a comeback in the 1990s. Use peaked in the lower two
grades by 1996. Since then, use declined steadily in 8th
grade and sporadically in 10th grade. Only after 2002
did it begin to decline in 12th grade. The decline paused
in 2008 for 8th graders and 2009/2010 for 12th graders,
and then resumed. The 12th-grade decline began in
2003 but reversed from 2009 to 2013. In 2013 the
amphetamines/stimulants prevalence question text was
changed in half of the questionnaire forms. The 2013
report used data from the changed forms only, to be
comparable to the 2014 measure. In 2014 the
remaining forms were changed; the 2014 and
subsequent data presented here are for all the forms.
From 2009 to 2013 use rose in the upper grades, likely
due to use intended to assist with academic
performance. Since 2013 there has been a downward
drift in annual prevalence but a steeper decline in 30-
day prevalence (significant in the upper grades).
See Table 6 for the trends in annual use of two specific
amphetamines—Ritalin and Adderall. Since it was first
measured in 2001, Ritalin use has declined by 70% to
80% in all three grades. Adderall use declined in the
lower grades since it was first measured in 2009; but
annual prevalence increased significantly in 12th grade
between 2009 (5.4%) and 2013 (7.4%) where it
remained in 2015 before falling to 6.2% in 2016.
Perceived Risk
Only 12th graders are asked about the amount of risk
they associate with amphetamine/stimulant use. For a
few years, changes in perceived risk were not
correlated with changes in usage levels (at the
aggregate level). Specifically, in the interval 1981–
1986, risk was quite stable even though use fell
considerably, likely as a result of some displacement
by increasing cocaine use. There was, however, a
decrease in risk during the period 1975–1981 (when
use was rising), some increase in perceived risk in
1986–1991 (when use was falling), and some decline
in perceived risk from 1991 to 1995 (in advance of use
rising again). Perceived risk has generally been rising
in recent years, very likely contributing to the decline
in use that occurred among 12th graders after 2002; it
appears to have leveled after 2007. In 2011 the
examples of specific amphetamines provided in the
text of the questions on perceived risk, disapproval, and
availability were updated with the inclusion of
Adderall and Ritalin. This led to some discontinuities
in the trend lines in 2011. (Levels of perceived risk and
disapproval lowered as a result.) Based on the revised
question, some decline has occurred since 2013.
Disapproval
Disapproval of amphetamine/stimulant use is asked in
12th grade only. Relatively high proportions of 12th
graders have disapproved of even trying
amphetamines/stimulants throughout the life of the
study. Disapproval did not change in the late 1970s
despite an increase in use. From 1981 to 1992,
disapproval rose gradually and substantially from 71%
to 87% as perceived risk rose and use declined. In the
mid-1990s disapproval declined along with perceived
risk, but it increased fairly steadily from 1996 through
2009 before leveling. There has been a slight falloff
since 2013.
Availability
In 1975, amphetamines/stimulants had a high level of
reported availability. The level fell by about 10
percentage points by 1977, drifted up a bit through
1980, jumped sharply in 1981, and then began a long,
gradual decline through 1991. There was a modest
increase in availability at all three grade levels in the
early 1990s as use rose, followed by a long-term
decline which continued through 2016.
23
Amphetamines: Trends in Annual Use, Risk, Disapproval, and
Availability
Grades 8, 10, 12
Source. The Monitoring the Future study, the University of
Michigan.
*In 2013 the question text was changed on two of the
questionnaire forms for 8th and 10th graders and four of the
questionnaire forms
for 12th graders, and changed on the remaining forms in 2014.
Beginning in 2013, data presented here include only the
changed forms.
**In 2011 the list of examples was changed from uppers, pep
pills, bennies, speed to uppers, speed, Adderall, Ritalin, etc.
These changes likely explain the discontinuity in the 2011
results.
Use*
% who used in last 12 months
Risk**
% seeing "great risk" in using once or twice
Disapproval**
% disapproving of using once or twice
Availability**
% saying "fairly easy" or "very easy" to get
P
E
R
C
E
N
T
0
10
20
30
40
50
YEAR
'74 '76 '78 '80 '82 '84 '86 '88 '90 '92 '94 '96 '98 '00 '02 '04 '06
'08 '10 '12 '14 '16
8th Grade
10th Grade
12th Grade
P
E
R
C
E
N
T
0
20
40
60
80
100
YEAR
'74 '76 '78 '80 '82 '84 '86 '88 '90 '92 '94 '96 '98 '00 '02 '04 '06
'08 '10 '12 '14 '16
P
E
R
C
E
N
T
0
20
40
60
80
100
YEAR
'74 '76 '78 '80 '82 '84 '86 '88 '90 '92 '94 '96 '98 '00 '02 '04 '06
'08 '10 '12 '14 '16
P
E
R
C
E
N
T
0
20
40
60
80
100
YEAR
'74 '76 '78 '80 '82 '84 '86 '88 '90 '92 '94 '96 '98 '00 '02 '04 '06
'08 '10 '12 '14 '16
24
Methamphetamine and Crystal Methamphetamine (Ice)
One subclass of amphetamines is called meth-
amphetamine (“speed”). This subclass has been around
for a long time and gave rise to the phrase “speed kills”
in the 1960s. Probably because of the reputation it got
at that time as a particularly dangerous drug, it was not
popular for some years, so we did not include a full set
of questions about its use in MTF’s early
questionnaires. One form of methamphetamine, crystal
methamphetamine or “ice,” grew in popularity in the
1980s. It comes in crystallized form, as the name
implies, and the chunks can be heated and the fumes
inhaled, much like crack cocaine.
Trends in Use
For most of the life of the study, the only question
about methamphetamine use has been contained in
one of the six 12th-grade questionnaire forms.
Respondents who indicated using any type of
amphetamines in the prior 12 months were asked in a
sequel question to indicate on a pre-specified list the
types they had used during that period.
Methamphetamine was one type on the list, and data
exist on its use since 1976. (The rates are not graphed
here until 1990.) In 1976, annual prevalence using this
measure was 1.9%; it then roughly doubled to 3.7% by
1981 (the peak year), before declining for over a
decade all the way down to 0.4% by 1992. Use then
rose again in the mid-1990s, as did use of a number of
drugs, reaching 1.3% by 1998. In other words, it has
followed a cross-time trajectory fairly similar to that for
amphetamines as a whole. No questions have yet been
added to the study on perceived risk, disapproval, or
availability with regard to overall methamphetamine
use.
In 1990, in the 12th-grade questionnaires only, we
introduced our usual set of three questions for crystal
methamphetamine, measuring lifetime, annual, and
30-day use. Among 12th graders in 1990, 1.3%
indicated any use in the prior year; use climbed to 3.0%
by 1998, and has generally been declining since then,
reaching an all-time low of 0.5% in 2015 and then
0.8% in 2016. This variable is charted on the first panel
of the facing page.
Responding to the growing concern about meth-
amphetamine use in general—not just crystal
methamphetamine use—we added a full set of three
questions about the use of any methamphetamine to the
1999 questionnaires for all three grade levels. These
questions yield a somewhat higher annual prevalence
for 12th graders: 4.3% in 2000, compared to the sum of
the methamphetamine and crystal methamphetamine
answers in the other, branching question format, which
totaled 2.8%. It would appear, then, that the long-term
method we had been using for tracking
methamphetamine use probably yielded an
understatement of the absolute prevalence level,
perhaps because some proportion of
methamphetamine users did not correctly categorize
themselves initially as amphetamine users (even
though methamphetamine was given as one of the
examples of amphetamines). We think it likely that the
shape of the trend curve was not distorted, however.
The newer questions for methamphetamine (not
graphed here) show annual prevalence rates in 2016 of
0.4% for both 8th and 10th graders, and 0.6% for 12th
graders. In every grade, 2016 prevalence is at the
lowest level ever recorded by the survey. The 2016
levels for all three grades are down considerably from
the first measurement taken in 1999, when they were
3.2%, 4.6%, and 4.7% (see Table 6). So, despite
growing public concern about the methamphetamine
problem in the United States, use actually has shown a
fairly steady and substantial decline since 1999, at least
among secondary school students. (A similar decline in
methamphetamine use did not begin to appear among
college students and young adults generally until after
2004, likely reflecting a cohort effect. See Volume II in
this series for data on adults through age 55.)
Other Measures
Data on perceived risk and availability for crystal
methamphetamine, specifically, may be found on the
facing page.
Clearly, the perceived risk of crystal
methamphetamine use has risen considerably since
2003, very likely explaining much of the decline in use
since then. Perceived risk then leveled after 2013.
Perceived availability generally has been falling in all
three grades since 2006, perhaps in part because there
are many fewer crystal methamphetamine users from
whom to gain access.
25
Crystal Methamphetamine (Ice): Trends in Annual Use, Risk,
and Availability
Grades 8, 10, 12
Source. The Monitoring the Future study, the University of
Michigan.
Use
% who used in last 12 months
Risk
% seeing "great risk" in using once or twice
Disapproval
% disapproving of using once or twice
Availability
% saying "fairly easy" or "very easy" to get
P
E
R
C
E
N
T
0
2
4
6
8
10
YEAR
'74 '76 '78 '80 '82 '84 '86 '88 '90 '92 '94 '96 '98 '00 '02 '04 '06
'08 '10 '12 '14 '16
8th Grade
10th Grade
12th Grade
P
E
R
C
E
N
T
0
20
40
60
80
100
YEAR
'74 '76 '78 '80 '82 '84 '86 '88 '90 '92 '94 '96 '98 '00 '02 '04 '06
'08 '10 '12 '14 '16
P
E
R
C
E
N
T
0
20
40
60
80
100
YEAR
'74 '76 '78 '80 '82 '84 '86 '88 '90 '92 '94 '96 '98 '00 '02 '04 '06
'08 '10 '12 '14 '16
(no data)
P
E
R
C
E
N
T
0
20
40
60
80
100
YEAR
'74 '76 '78 '80 '82 '84 '86 '88 '90 '92 '94 '96 '98 '00 '02 '04 '06
'08 '10 '12 '14 '16
26
Heroin
For many decades, heroin—a derivative of opium—was
administered primarily by injection into a vein. However,
in the 1990s the purity of available heroin reached very
high levels, making other modes of administration (e.g.,
snorting, smoking) practical alternatives. Thus, in 1995
we introduced questions that asked separately about using
heroin with and without a needle to determine whether
non-injection use explained the upsurge in heroin use we
observed. The usage statistics presented on the facing
page are based on heroin use by any method, but data on
the two specific types of administration are provided in
the tables at the end of this report.
Trends in Use
The annual prevalence of heroin use among 12th graders
fell by half between 1975 and 1979, from 1.0% to 0.5%.
The rate then held amazingly steady until 1994. Use rose
in the mid- and late-1990s, along with the use of most
drugs; it reached peak levels in 1996 among 8th graders
(1.6%), in 1997 among 10th graders (1.4%), and in 2000
among 12th graders (1.5%), suggesting a cohort effect.
Following those peak levels, use declined, with annual
prevalence in all three grades fluctuating between 0.7%
and 0.9% from 2005 through 2010. Since then, annual
prevalence in the three grades combined has declined,
from 0.8% to 0.3% in 2016. In 2016, use reached its
lowest levels since 1991 in all three grades (0.3% in each).
Because the questions about use with and without a
needle were not introduced until the 1995 survey, they did
not encompass much of the period of increasing heroin
use. Responses to the new questions showed that, by then,
about equal proportions of all 8th-grade users were taking
heroin by each method of ingestion and some—nearly a
third of users—were using both means. At 10th grade, a
somewhat higher proportion of all users took heroin
without a needle, and at 12th grade, the proportion was
higher still. Much of the increase in overall heroin use
after 1995 occurred in the proportions using it without
injecting, which we strongly suspect was true in the
immediately preceding period of increase as well.
Likewise, much of the decrease since the recent peak
levels has been due to decreasing use of heroin without a
needle. In 2012, there were significant decreases in use of
heroin without a needle for 8th and 12th graders, and very
slight declines since then in 8th and 10th grades.
Use with a needle has fallen considerably in all three
grades since the mid-1990s; annual prevalence in 2016
stood at 0.2%, 0.3%, and 0.3%, respectively, including
significant declines in 8th and 10th grades from the 2014 to
2015 prevalence levels, but no further change in 2016.
The proportional declines were greatest in the lower
grades. While a heroin epidemic continues among adults,
our data—as well as those from NSDUH—suggest that
use has grown primarily among young adults and not
among adolescents.
Perceived Risk
Students have long seen heroin to be one of the most
dangerous drugs, which helps to account for both the
consistently high level of personal disapproval of use (see
below) and the quite low prevalence of use. Nevertheless,
perceived risk levels have changed some over the years.
Between 1975 and 1986, perceived risk gradually
declined, even though use dropped and then stabilized in
that interval. Then there was a big spike in 1987 (when
perceived risk for cocaine also jumped dramatically),
where it held for four years. In 1992, perceived risk
dropped to a lower plateau again, presaging an increase in
use a year or two later. Perceived risk rose in the latter half
of the 1990s, and use leveled off and then declined. Risk
at 12th grade is still rising, but has been level for some time
at 8th and 10th grades. Perceived risk of use without a
needle rose in 8th and 10th grades between 1995 and 1997,
foretelling an end to the increase in that form of use. Note
that perceived risk has served as a leading indicator of use
for this drug as well as a number of others. During the
2000s, perceived risk was relatively stable.
Disapproval
There has been little fluctuation in the very high levels of
disapproval of heroin use over the years, though it did rise
gradually between 2000 and 2010. The small changes that
have occurred have been generally consistent with
changes in perceived risk and use.
Availability
The proportion of 12th-grade students saying they could
get heroin fairly easily if they wanted some remained
around 20% through the mid-1980s. It then increased
considerably from 1986 to 1992 before stabilizing at
about 35% from 1992 through 1998. From the mid- to
late-1990s through 2014, perceived availability of heroin
declined gradually but substantially in all three grades
before leveling in 2014 or 2015.
2727
Heroin : Trends in Annual Use, Risk, Disapproval, and
Availability
Grades 8, 10, 12
Source. The Monitoring the Future study, the University of
Michigan.
*Prior to 1995, the questions asked about heroin use in general.
Since 1995, the questions have asked about heroin use without
a needle.
Use
% who used in last 12 months
Risk*
% seeing "great risk" in using once or twice
Disapproval*
% disapproving of using once or twice
Availability
% saying "fairly easy" or "very easy" to get
P
E
R
C
E
N
T
0
1
2
3
4
5
YEAR
'74 '76 '78 '80 '82 '84 '86 '88 '90 '92 '94 '96 '98 '00 '02 '04 '06
'08 '10 '12 '14 '16
8th Grade
10th Grade
12th Grade
P
E
R
C
E
N
T
0
20
40
60
80
100
YEAR
'74 '76 '78 '80 '82 '84 '86 '88 '90 '92 '94 '96 '98 '00 '02 '04 '06
'08 '10 '12 '14 '16
P
E
R
C
E
N
T
0
20
40
60
80
100
YEAR
'74 '76 '78 '80 '82 '84 '86 '88 '90 '92 '94 '96 '98 '00 '02 '04 '06
'08 '10 '12 '14 '16
P
E
R
C
E
N
T
0
20
40
60
80
100
YEAR
'74 '76 '78 '80 '82 '84 '86 '88 '90 '92 '94 '96 '98 '00 '02 '04 '06
'08 '10 '12 '14 '16
28
Other Narcotic Drugs, Including OxyContin and Vicodin
There are a number of narcotic drugs other than heroin—
all controlled substances. Many are analgesics that can be
prescribed by physicians and dentists for pain. Like
heroin, many are derived from opium, but there are also a
number of synthetic analogues in use today, with
OxyContin and Vicodin being two of the major ones.
Throughout the life of the MTF study, we have asked
about the use of any narcotic drug other than heroin
without specifying which one. Examples of drugs in the
class are provided in the question stem. In one of the six
12th-grade questionnaire forms, however, respondents
indicating that they had used any narcotic in the past 12
months were then asked to check which of a fairly long
list of such drugs they used. Table E-4 in Appendix E of
Volume I of this annual monograph series provides trends
in their annual prevalence data. In the late 1970s, opium
and codeine were among the narcotics most widely used.
In recent years Vicodin, codeine, Percocet, OxyContin,
and hydrocodone have been the most prevalent.
Trends in Use
Use is reported for 12th graders only, because we
considered the data from 8th and 10th graders to be of
questionable validity. As shown in the first panel of the
facing page, 12th graders’ use of narcotics other than
heroin generally trended down from about 1977 through
1992, dropping considerably. After 1992 use rose rather
steeply as all forms of substance use were increasing, with
annual prevalence nearly tripling from 3.3% in 1992 to
9.5% in 2004, before leveling through about 2009. Since
then, use has been declining, particularly since 2009.
In 2002, the question was revised to add Vicodin,
OxyContin, and Percocet to the examples given, which
clearly had the effect of increasing reported prevalence,
as may be seen in the first panel on the facing page. So the
extent of the increase over the full time span likely is
exaggerated, although probably not by much, because
these drugs came onto the scene later, during the rise.
They simply were not being fully reported until the late
1990s. Narcotics had become one of the most widely used
classes of illicit drugs by 2004, when annual prevalence
reached 9.5%.
Use rates for two narcotics of recent interest—OxyContin
and Vicodin—are presented in the second and third
panels on the facing page, in a departure from the usual
arrangement. There are no data for disapproval and only
limited data on perceived risk (since 2012) for the two
drugs, showing low and stable risk levels.
OxyContin use increased some in all grades from 2002
(when it was first measured) through roughly 2009,
though the trend lines have been irregular. Since 2009 or
2010, the prevalence rate has dropped in all grades.
Annual prevalence in 2016 was 0.9%, 2.1%, and 3.4% in
grades 8, 10, and 12, respectively. Use of Vicodin, on the
other hand, remained fairly steady at somewhat higher
levels from 2002—the first year it was measured—until
2009, after which it declined substantially in all grades. In
2016, annual prevalence rates continued to decline and
were 0.8%, 1.7%, and 2.9% for 8th, 10th and 12th graders
respectively.
Availability
Questions were asked about the availability of narcotics
other than heroin, taken as a class. Perceived availability
increased gradually among 12th graders for more than a
decade (from 1978 through 1989), even as reported use
was dropping. Perceived availability then rose further for
another decade (from 1991 through 2001) as use rose
quite sharply before leveling by about 2000 and then
declining after 2006. In contrast, perceived availability
had declined among 8th and 10th graders since the late
1990s. (In all three grades, a change in question wording
in 2010 to include OxyContin and Vicodin as examples
presumably accounts for the jump in reported availability
that year.) Availability has declined further in all three
grades since 2010.
29
http://www.monitoringthefuture.org/pubs/monographs/mtf-
vol1_2015.pdf
Narcotics other than Heroin and OxyContin and Vicodin
Specifically:
Trends in Annual Use and Availability
Grades 8, 10, 12
Source. The Monitoring the Future study, the University of
Michigan.
*Beginning in 2002, a revised set of questions on other
narcotics use was introduced in which Talwin, laudanum, and
paregoric
were replaced as examples given with Vicodin, OxyContin, and
Percocet.
**In 2010 the list of examples was changed from methadone,
opium to Vicodin, OxyContin, Percocet, etc.
MONITORING     FUTURENATIONAL SURVEY RESULTS ON DRUG U.docx

More Related Content

Similar to MONITORING FUTURENATIONAL SURVEY RESULTS ON DRUG U.docx

Rx15 tt tues_200_1_thau_2gorman
Rx15 tt tues_200_1_thau_2gormanRx15 tt tues_200_1_thau_2gorman
Rx15 tt tues_200_1_thau_2gormanOPUNITE
 
Drug abuse a public health concern
Drug abuse a  public health concernDrug abuse a  public health concern
Drug abuse a public health concernIshtiaque Khan
 
Smoking, drinking and drug use by young people in England [2017 update]
Smoking, drinking and drug use by young people in England [2017 update]Smoking, drinking and drug use by young people in England [2017 update]
Smoking, drinking and drug use by young people in England [2017 update]Mentor
 
Back to school talking to your kids about cannabis
Back to school  talking to your kids about cannabisBack to school  talking to your kids about cannabis
Back to school talking to your kids about cannabisBenjamin Gelassen, MBA
 
Preventing teen abuse of prescriptions and over the
Preventing teen abuse of prescriptions and over thePreventing teen abuse of prescriptions and over the
Preventing teen abuse of prescriptions and over theraynaandyailka
 
P.I.C: Harm Reduction Campaign
P.I.C: Harm Reduction CampaignP.I.C: Harm Reduction Campaign
P.I.C: Harm Reduction CampaignMelinda Garcia
 
CDC 2018-Evidence-Based-Strategies For Preventing Opioid Overdose
CDC 2018-Evidence-Based-Strategies For Preventing Opioid OverdoseCDC 2018-Evidence-Based-Strategies For Preventing Opioid Overdose
CDC 2018-Evidence-Based-Strategies For Preventing Opioid OverdoseCassondra Turner McArthur
 
Impact of substance abuse on.pdf
Impact of substance abuse on.pdfImpact of substance abuse on.pdf
Impact of substance abuse on.pdfstudywriters
 
KnowTheTruth PublicRelations Plan
KnowTheTruth PublicRelations PlanKnowTheTruth PublicRelations Plan
KnowTheTruth PublicRelations PlanAmy Sue Hendrickson
 
EVERFI: Understanding the Impact of State Marijuana Laws on Campus Prevention
EVERFI: Understanding the Impact of State Marijuana Laws on Campus PreventionEVERFI: Understanding the Impact of State Marijuana Laws on Campus Prevention
EVERFI: Understanding the Impact of State Marijuana Laws on Campus PreventionMichele Collu
 
Hi dear,can you help me to finish this assignment with good qual
Hi dear,can you help me to finish this assignment with good qualHi dear,can you help me to finish this assignment with good qual
Hi dear,can you help me to finish this assignment with good qualmealsdeidre
 
Query Letter week 1
Query Letter week 1Query Letter week 1
Query Letter week 1Connie Butts
 
Evaluation of NDLEA Radio Campaign Influence on Drug Abuse among Youths in On...
Evaluation of NDLEA Radio Campaign Influence on Drug Abuse among Youths in On...Evaluation of NDLEA Radio Campaign Influence on Drug Abuse among Youths in On...
Evaluation of NDLEA Radio Campaign Influence on Drug Abuse among Youths in On...inventionjournals
 
Health 2019 research on drugs abuse 2
Health 2019 research on drugs abuse 2Health 2019 research on drugs abuse 2
Health 2019 research on drugs abuse 2AntiNarkoba.com
 
Heal th 2019 research on drugs abuse 2
Heal th 2019 research on drugs abuse 2Heal th 2019 research on drugs abuse 2
Heal th 2019 research on drugs abuse 2AntiNarkoba.com
 
1Joseph Role of Opioid Education for the YouthEsther Jos
1Joseph Role of Opioid Education for the YouthEsther Jos1Joseph Role of Opioid Education for the YouthEsther Jos
1Joseph Role of Opioid Education for the YouthEsther Joscargillfilberto
 
College Student Perceptions of Marijuana 2015
College Student Perceptions of Marijuana 2015College Student Perceptions of Marijuana 2015
College Student Perceptions of Marijuana 2015SarahMartin33
 

Similar to MONITORING FUTURENATIONAL SURVEY RESULTS ON DRUG U.docx (20)

Rx15 tt tues_200_1_thau_2gorman
Rx15 tt tues_200_1_thau_2gormanRx15 tt tues_200_1_thau_2gorman
Rx15 tt tues_200_1_thau_2gorman
 
Drug abuse a public health concern
Drug abuse a  public health concernDrug abuse a  public health concern
Drug abuse a public health concern
 
Smoking, drinking and drug use by young people in England [2017 update]
Smoking, drinking and drug use by young people in England [2017 update]Smoking, drinking and drug use by young people in England [2017 update]
Smoking, drinking and drug use by young people in England [2017 update]
 
Back to school talking to your kids about cannabis
Back to school  talking to your kids about cannabisBack to school  talking to your kids about cannabis
Back to school talking to your kids about cannabis
 
Preventing teen abuse of prescriptions and over the
Preventing teen abuse of prescriptions and over thePreventing teen abuse of prescriptions and over the
Preventing teen abuse of prescriptions and over the
 
P.I.C: Harm Reduction Campaign
P.I.C: Harm Reduction CampaignP.I.C: Harm Reduction Campaign
P.I.C: Harm Reduction Campaign
 
CDC 2018-Evidence-Based-Strategies For Preventing Opioid Overdose
CDC 2018-Evidence-Based-Strategies For Preventing Opioid OverdoseCDC 2018-Evidence-Based-Strategies For Preventing Opioid Overdose
CDC 2018-Evidence-Based-Strategies For Preventing Opioid Overdose
 
sjphfall13pdfFINAL1
sjphfall13pdfFINAL1sjphfall13pdfFINAL1
sjphfall13pdfFINAL1
 
Impact of substance abuse on.pdf
Impact of substance abuse on.pdfImpact of substance abuse on.pdf
Impact of substance abuse on.pdf
 
KnowTheTruth PublicRelations Plan
KnowTheTruth PublicRelations PlanKnowTheTruth PublicRelations Plan
KnowTheTruth PublicRelations Plan
 
EVERFI: Understanding the Impact of State Marijuana Laws on Campus Prevention
EVERFI: Understanding the Impact of State Marijuana Laws on Campus PreventionEVERFI: Understanding the Impact of State Marijuana Laws on Campus Prevention
EVERFI: Understanding the Impact of State Marijuana Laws on Campus Prevention
 
Hi dear,can you help me to finish this assignment with good qual
Hi dear,can you help me to finish this assignment with good qualHi dear,can you help me to finish this assignment with good qual
Hi dear,can you help me to finish this assignment with good qual
 
Query Letter week 1
Query Letter week 1Query Letter week 1
Query Letter week 1
 
Smoking and kids
Smoking and kidsSmoking and kids
Smoking and kids
 
Antidrug campaign
Antidrug campaignAntidrug campaign
Antidrug campaign
 
Evaluation of NDLEA Radio Campaign Influence on Drug Abuse among Youths in On...
Evaluation of NDLEA Radio Campaign Influence on Drug Abuse among Youths in On...Evaluation of NDLEA Radio Campaign Influence on Drug Abuse among Youths in On...
Evaluation of NDLEA Radio Campaign Influence on Drug Abuse among Youths in On...
 
Health 2019 research on drugs abuse 2
Health 2019 research on drugs abuse 2Health 2019 research on drugs abuse 2
Health 2019 research on drugs abuse 2
 
Heal th 2019 research on drugs abuse 2
Heal th 2019 research on drugs abuse 2Heal th 2019 research on drugs abuse 2
Heal th 2019 research on drugs abuse 2
 
1Joseph Role of Opioid Education for the YouthEsther Jos
1Joseph Role of Opioid Education for the YouthEsther Jos1Joseph Role of Opioid Education for the YouthEsther Jos
1Joseph Role of Opioid Education for the YouthEsther Jos
 
College Student Perceptions of Marijuana 2015
College Student Perceptions of Marijuana 2015College Student Perceptions of Marijuana 2015
College Student Perceptions of Marijuana 2015
 

More from roushhsiu

Most women experience their closest friendships with those of th.docx
Most women experience their closest friendships with those of th.docxMost women experience their closest friendships with those of th.docx
Most women experience their closest friendships with those of th.docxroushhsiu
 
Morgan and Dunn JD have hired you to assist with a case involvin.docx
Morgan and Dunn JD have hired you to assist with a case involvin.docxMorgan and Dunn JD have hired you to assist with a case involvin.docx
Morgan and Dunn JD have hired you to assist with a case involvin.docxroushhsiu
 
Mortality rates vary between the Hispanic community and the gene.docx
Mortality rates vary between the Hispanic community and the gene.docxMortality rates vary between the Hispanic community and the gene.docx
Mortality rates vary between the Hispanic community and the gene.docxroushhsiu
 
Moreno Industries has adopted the following production budget for th.docx
Moreno Industries has adopted the following production budget for th.docxMoreno Industries has adopted the following production budget for th.docx
Moreno Industries has adopted the following production budget for th.docxroushhsiu
 
Most people have a blend of leadership styles that they use. Some le.docx
Most people have a blend of leadership styles that they use. Some le.docxMost people have a blend of leadership styles that they use. Some le.docx
Most people have a blend of leadership styles that they use. Some le.docxroushhsiu
 
Moral rights as opposed to legal rights are not dependent on a polit.docx
Moral rights as opposed to legal rights are not dependent on a polit.docxMoral rights as opposed to legal rights are not dependent on a polit.docx
Moral rights as opposed to legal rights are not dependent on a polit.docxroushhsiu
 
Montasari, R., & Hill, R. (2019). Next-Generation Digital Forens.docx
Montasari, R., & Hill, R. (2019). Next-Generation Digital Forens.docxMontasari, R., & Hill, R. (2019). Next-Generation Digital Forens.docx
Montasari, R., & Hill, R. (2019). Next-Generation Digital Forens.docxroushhsiu
 
Module Outcome  You will be able to describe the historical force.docx
Module Outcome  You will be able to describe the historical force.docxModule Outcome  You will be able to describe the historical force.docx
Module Outcome  You will be able to describe the historical force.docxroushhsiu
 
Molière believed that the duty of comedy is to correct human vices b.docx
Molière believed that the duty of comedy is to correct human vices b.docxMolière believed that the duty of comedy is to correct human vices b.docx
Molière believed that the duty of comedy is to correct human vices b.docxroushhsiu
 
Module One Making Budgetary DecisionsDirectionsBased on the i.docx
Module One Making Budgetary DecisionsDirectionsBased on the i.docxModule One Making Budgetary DecisionsDirectionsBased on the i.docx
Module One Making Budgetary DecisionsDirectionsBased on the i.docxroushhsiu
 
Monitoring Data and Quality ImprovementAnswer one of two que.docx
Monitoring Data and Quality ImprovementAnswer one of two que.docxMonitoring Data and Quality ImprovementAnswer one of two que.docx
Monitoring Data and Quality ImprovementAnswer one of two que.docxroushhsiu
 
Monitoring Global Supply Chains† Jodi L. Short Prof.docx
Monitoring Global Supply Chains†   Jodi L. Short Prof.docxMonitoring Global Supply Chains†   Jodi L. Short Prof.docx
Monitoring Global Supply Chains† Jodi L. Short Prof.docxroushhsiu
 
Morality Relativism & the Concerns it RaisesI want to g.docx
Morality Relativism & the Concerns it RaisesI want to g.docxMorality Relativism & the Concerns it RaisesI want to g.docx
Morality Relativism & the Concerns it RaisesI want to g.docxroushhsiu
 
Module 9 content You will perform a history of a cardiac pro.docx
Module 9 content You will perform a history of a cardiac pro.docxModule 9 content You will perform a history of a cardiac pro.docx
Module 9 content You will perform a history of a cardiac pro.docxroushhsiu
 
Module Assessment 4 TANM ApplicationsBUS2 190Last name, Fir.docx
Module Assessment 4 TANM ApplicationsBUS2 190Last name, Fir.docxModule Assessment 4 TANM ApplicationsBUS2 190Last name, Fir.docx
Module Assessment 4 TANM ApplicationsBUS2 190Last name, Fir.docxroushhsiu
 
Module Assignment Clinical Decision Support SystemsLearning Outcome.docx
Module Assignment Clinical Decision Support SystemsLearning Outcome.docxModule Assignment Clinical Decision Support SystemsLearning Outcome.docx
Module Assignment Clinical Decision Support SystemsLearning Outcome.docxroushhsiu
 
MONTCLAIR UNIVERSITYLAWS 362 LEGAL WRITING MIDTERM.docx
MONTCLAIR UNIVERSITYLAWS 362  LEGAL WRITING   MIDTERM.docxMONTCLAIR UNIVERSITYLAWS 362  LEGAL WRITING   MIDTERM.docx
MONTCLAIR UNIVERSITYLAWS 362 LEGAL WRITING MIDTERM.docxroushhsiu
 
MODULE 8You will perform a history of a respiratory problem th.docx
MODULE 8You will perform a history of a respiratory problem th.docxMODULE 8You will perform a history of a respiratory problem th.docx
MODULE 8You will perform a history of a respiratory problem th.docxroushhsiu
 
Most organizations, including hospitals, adopt both Mission and Visi.docx
Most organizations, including hospitals, adopt both Mission and Visi.docxMost organizations, including hospitals, adopt both Mission and Visi.docx
Most organizations, including hospitals, adopt both Mission and Visi.docxroushhsiu
 
More like this Abstract TranslateFull Text Translate.docx
More like this Abstract TranslateFull Text Translate.docxMore like this Abstract TranslateFull Text Translate.docx
More like this Abstract TranslateFull Text Translate.docxroushhsiu
 

More from roushhsiu (20)

Most women experience their closest friendships with those of th.docx
Most women experience their closest friendships with those of th.docxMost women experience their closest friendships with those of th.docx
Most women experience their closest friendships with those of th.docx
 
Morgan and Dunn JD have hired you to assist with a case involvin.docx
Morgan and Dunn JD have hired you to assist with a case involvin.docxMorgan and Dunn JD have hired you to assist with a case involvin.docx
Morgan and Dunn JD have hired you to assist with a case involvin.docx
 
Mortality rates vary between the Hispanic community and the gene.docx
Mortality rates vary between the Hispanic community and the gene.docxMortality rates vary between the Hispanic community and the gene.docx
Mortality rates vary between the Hispanic community and the gene.docx
 
Moreno Industries has adopted the following production budget for th.docx
Moreno Industries has adopted the following production budget for th.docxMoreno Industries has adopted the following production budget for th.docx
Moreno Industries has adopted the following production budget for th.docx
 
Most people have a blend of leadership styles that they use. Some le.docx
Most people have a blend of leadership styles that they use. Some le.docxMost people have a blend of leadership styles that they use. Some le.docx
Most people have a blend of leadership styles that they use. Some le.docx
 
Moral rights as opposed to legal rights are not dependent on a polit.docx
Moral rights as opposed to legal rights are not dependent on a polit.docxMoral rights as opposed to legal rights are not dependent on a polit.docx
Moral rights as opposed to legal rights are not dependent on a polit.docx
 
Montasari, R., & Hill, R. (2019). Next-Generation Digital Forens.docx
Montasari, R., & Hill, R. (2019). Next-Generation Digital Forens.docxMontasari, R., & Hill, R. (2019). Next-Generation Digital Forens.docx
Montasari, R., & Hill, R. (2019). Next-Generation Digital Forens.docx
 
Module Outcome  You will be able to describe the historical force.docx
Module Outcome  You will be able to describe the historical force.docxModule Outcome  You will be able to describe the historical force.docx
Module Outcome  You will be able to describe the historical force.docx
 
Molière believed that the duty of comedy is to correct human vices b.docx
Molière believed that the duty of comedy is to correct human vices b.docxMolière believed that the duty of comedy is to correct human vices b.docx
Molière believed that the duty of comedy is to correct human vices b.docx
 
Module One Making Budgetary DecisionsDirectionsBased on the i.docx
Module One Making Budgetary DecisionsDirectionsBased on the i.docxModule One Making Budgetary DecisionsDirectionsBased on the i.docx
Module One Making Budgetary DecisionsDirectionsBased on the i.docx
 
Monitoring Data and Quality ImprovementAnswer one of two que.docx
Monitoring Data and Quality ImprovementAnswer one of two que.docxMonitoring Data and Quality ImprovementAnswer one of two que.docx
Monitoring Data and Quality ImprovementAnswer one of two que.docx
 
Monitoring Global Supply Chains† Jodi L. Short Prof.docx
Monitoring Global Supply Chains†   Jodi L. Short Prof.docxMonitoring Global Supply Chains†   Jodi L. Short Prof.docx
Monitoring Global Supply Chains† Jodi L. Short Prof.docx
 
Morality Relativism & the Concerns it RaisesI want to g.docx
Morality Relativism & the Concerns it RaisesI want to g.docxMorality Relativism & the Concerns it RaisesI want to g.docx
Morality Relativism & the Concerns it RaisesI want to g.docx
 
Module 9 content You will perform a history of a cardiac pro.docx
Module 9 content You will perform a history of a cardiac pro.docxModule 9 content You will perform a history of a cardiac pro.docx
Module 9 content You will perform a history of a cardiac pro.docx
 
Module Assessment 4 TANM ApplicationsBUS2 190Last name, Fir.docx
Module Assessment 4 TANM ApplicationsBUS2 190Last name, Fir.docxModule Assessment 4 TANM ApplicationsBUS2 190Last name, Fir.docx
Module Assessment 4 TANM ApplicationsBUS2 190Last name, Fir.docx
 
Module Assignment Clinical Decision Support SystemsLearning Outcome.docx
Module Assignment Clinical Decision Support SystemsLearning Outcome.docxModule Assignment Clinical Decision Support SystemsLearning Outcome.docx
Module Assignment Clinical Decision Support SystemsLearning Outcome.docx
 
MONTCLAIR UNIVERSITYLAWS 362 LEGAL WRITING MIDTERM.docx
MONTCLAIR UNIVERSITYLAWS 362  LEGAL WRITING   MIDTERM.docxMONTCLAIR UNIVERSITYLAWS 362  LEGAL WRITING   MIDTERM.docx
MONTCLAIR UNIVERSITYLAWS 362 LEGAL WRITING MIDTERM.docx
 
MODULE 8You will perform a history of a respiratory problem th.docx
MODULE 8You will perform a history of a respiratory problem th.docxMODULE 8You will perform a history of a respiratory problem th.docx
MODULE 8You will perform a history of a respiratory problem th.docx
 
Most organizations, including hospitals, adopt both Mission and Visi.docx
Most organizations, including hospitals, adopt both Mission and Visi.docxMost organizations, including hospitals, adopt both Mission and Visi.docx
Most organizations, including hospitals, adopt both Mission and Visi.docx
 
More like this Abstract TranslateFull Text Translate.docx
More like this Abstract TranslateFull Text Translate.docxMore like this Abstract TranslateFull Text Translate.docx
More like this Abstract TranslateFull Text Translate.docx
 

Recently uploaded

mini mental status format.docx
mini    mental       status     format.docxmini    mental       status     format.docx
mini mental status format.docxPoojaSen20
 
Q4-W6-Restating Informational Text Grade 3
Q4-W6-Restating Informational Text Grade 3Q4-W6-Restating Informational Text Grade 3
Q4-W6-Restating Informational Text Grade 3JemimahLaneBuaron
 
“Oh GOSH! Reflecting on Hackteria's Collaborative Practices in a Global Do-It...
“Oh GOSH! Reflecting on Hackteria's Collaborative Practices in a Global Do-It...“Oh GOSH! Reflecting on Hackteria's Collaborative Practices in a Global Do-It...
“Oh GOSH! Reflecting on Hackteria's Collaborative Practices in a Global Do-It...Marc Dusseiller Dusjagr
 
Organic Name Reactions for the students and aspirants of Chemistry12th.pptx
Organic Name Reactions  for the students and aspirants of Chemistry12th.pptxOrganic Name Reactions  for the students and aspirants of Chemistry12th.pptx
Organic Name Reactions for the students and aspirants of Chemistry12th.pptxVS Mahajan Coaching Centre
 
PSYCHIATRIC History collection FORMAT.pptx
PSYCHIATRIC   History collection FORMAT.pptxPSYCHIATRIC   History collection FORMAT.pptx
PSYCHIATRIC History collection FORMAT.pptxPoojaSen20
 
The Most Excellent Way | 1 Corinthians 13
The Most Excellent Way | 1 Corinthians 13The Most Excellent Way | 1 Corinthians 13
The Most Excellent Way | 1 Corinthians 13Steve Thomason
 
Solving Puzzles Benefits Everyone (English).pptx
Solving Puzzles Benefits Everyone (English).pptxSolving Puzzles Benefits Everyone (English).pptx
Solving Puzzles Benefits Everyone (English).pptxOH TEIK BIN
 
microwave assisted reaction. General introduction
microwave assisted reaction. General introductionmicrowave assisted reaction. General introduction
microwave assisted reaction. General introductionMaksud Ahmed
 
Presentation by Andreas Schleicher Tackling the School Absenteeism Crisis 30 ...
Presentation by Andreas Schleicher Tackling the School Absenteeism Crisis 30 ...Presentation by Andreas Schleicher Tackling the School Absenteeism Crisis 30 ...
Presentation by Andreas Schleicher Tackling the School Absenteeism Crisis 30 ...EduSkills OECD
 
APM Welcome, APM North West Network Conference, Synergies Across Sectors
APM Welcome, APM North West Network Conference, Synergies Across SectorsAPM Welcome, APM North West Network Conference, Synergies Across Sectors
APM Welcome, APM North West Network Conference, Synergies Across SectorsAssociation for Project Management
 
POINT- BIOCHEMISTRY SEM 2 ENZYMES UNIT 5.pptx
POINT- BIOCHEMISTRY SEM 2 ENZYMES UNIT 5.pptxPOINT- BIOCHEMISTRY SEM 2 ENZYMES UNIT 5.pptx
POINT- BIOCHEMISTRY SEM 2 ENZYMES UNIT 5.pptxSayali Powar
 
SOCIAL AND HISTORICAL CONTEXT - LFTVD.pptx
SOCIAL AND HISTORICAL CONTEXT - LFTVD.pptxSOCIAL AND HISTORICAL CONTEXT - LFTVD.pptx
SOCIAL AND HISTORICAL CONTEXT - LFTVD.pptxiammrhaywood
 
Science 7 - LAND and SEA BREEZE and its Characteristics
Science 7 - LAND and SEA BREEZE and its CharacteristicsScience 7 - LAND and SEA BREEZE and its Characteristics
Science 7 - LAND and SEA BREEZE and its CharacteristicsKarinaGenton
 
18-04-UA_REPORT_MEDIALITERAСY_INDEX-DM_23-1-final-eng.pdf
18-04-UA_REPORT_MEDIALITERAСY_INDEX-DM_23-1-final-eng.pdf18-04-UA_REPORT_MEDIALITERAСY_INDEX-DM_23-1-final-eng.pdf
18-04-UA_REPORT_MEDIALITERAСY_INDEX-DM_23-1-final-eng.pdfssuser54595a
 
Micromeritics - Fundamental and Derived Properties of Powders
Micromeritics - Fundamental and Derived Properties of PowdersMicromeritics - Fundamental and Derived Properties of Powders
Micromeritics - Fundamental and Derived Properties of PowdersChitralekhaTherkar
 
URLs and Routing in the Odoo 17 Website App
URLs and Routing in the Odoo 17 Website AppURLs and Routing in the Odoo 17 Website App
URLs and Routing in the Odoo 17 Website AppCeline George
 
Separation of Lanthanides/ Lanthanides and Actinides
Separation of Lanthanides/ Lanthanides and ActinidesSeparation of Lanthanides/ Lanthanides and Actinides
Separation of Lanthanides/ Lanthanides and ActinidesFatimaKhan178732
 

Recently uploaded (20)

mini mental status format.docx
mini    mental       status     format.docxmini    mental       status     format.docx
mini mental status format.docx
 
Q4-W6-Restating Informational Text Grade 3
Q4-W6-Restating Informational Text Grade 3Q4-W6-Restating Informational Text Grade 3
Q4-W6-Restating Informational Text Grade 3
 
“Oh GOSH! Reflecting on Hackteria's Collaborative Practices in a Global Do-It...
“Oh GOSH! Reflecting on Hackteria's Collaborative Practices in a Global Do-It...“Oh GOSH! Reflecting on Hackteria's Collaborative Practices in a Global Do-It...
“Oh GOSH! Reflecting on Hackteria's Collaborative Practices in a Global Do-It...
 
Organic Name Reactions for the students and aspirants of Chemistry12th.pptx
Organic Name Reactions  for the students and aspirants of Chemistry12th.pptxOrganic Name Reactions  for the students and aspirants of Chemistry12th.pptx
Organic Name Reactions for the students and aspirants of Chemistry12th.pptx
 
PSYCHIATRIC History collection FORMAT.pptx
PSYCHIATRIC   History collection FORMAT.pptxPSYCHIATRIC   History collection FORMAT.pptx
PSYCHIATRIC History collection FORMAT.pptx
 
The Most Excellent Way | 1 Corinthians 13
The Most Excellent Way | 1 Corinthians 13The Most Excellent Way | 1 Corinthians 13
The Most Excellent Way | 1 Corinthians 13
 
Model Call Girl in Bikash Puri Delhi reach out to us at 🔝9953056974🔝
Model Call Girl in Bikash Puri  Delhi reach out to us at 🔝9953056974🔝Model Call Girl in Bikash Puri  Delhi reach out to us at 🔝9953056974🔝
Model Call Girl in Bikash Puri Delhi reach out to us at 🔝9953056974🔝
 
Solving Puzzles Benefits Everyone (English).pptx
Solving Puzzles Benefits Everyone (English).pptxSolving Puzzles Benefits Everyone (English).pptx
Solving Puzzles Benefits Everyone (English).pptx
 
microwave assisted reaction. General introduction
microwave assisted reaction. General introductionmicrowave assisted reaction. General introduction
microwave assisted reaction. General introduction
 
Código Creativo y Arte de Software | Unidad 1
Código Creativo y Arte de Software | Unidad 1Código Creativo y Arte de Software | Unidad 1
Código Creativo y Arte de Software | Unidad 1
 
Presentation by Andreas Schleicher Tackling the School Absenteeism Crisis 30 ...
Presentation by Andreas Schleicher Tackling the School Absenteeism Crisis 30 ...Presentation by Andreas Schleicher Tackling the School Absenteeism Crisis 30 ...
Presentation by Andreas Schleicher Tackling the School Absenteeism Crisis 30 ...
 
APM Welcome, APM North West Network Conference, Synergies Across Sectors
APM Welcome, APM North West Network Conference, Synergies Across SectorsAPM Welcome, APM North West Network Conference, Synergies Across Sectors
APM Welcome, APM North West Network Conference, Synergies Across Sectors
 
POINT- BIOCHEMISTRY SEM 2 ENZYMES UNIT 5.pptx
POINT- BIOCHEMISTRY SEM 2 ENZYMES UNIT 5.pptxPOINT- BIOCHEMISTRY SEM 2 ENZYMES UNIT 5.pptx
POINT- BIOCHEMISTRY SEM 2 ENZYMES UNIT 5.pptx
 
SOCIAL AND HISTORICAL CONTEXT - LFTVD.pptx
SOCIAL AND HISTORICAL CONTEXT - LFTVD.pptxSOCIAL AND HISTORICAL CONTEXT - LFTVD.pptx
SOCIAL AND HISTORICAL CONTEXT - LFTVD.pptx
 
Science 7 - LAND and SEA BREEZE and its Characteristics
Science 7 - LAND and SEA BREEZE and its CharacteristicsScience 7 - LAND and SEA BREEZE and its Characteristics
Science 7 - LAND and SEA BREEZE and its Characteristics
 
18-04-UA_REPORT_MEDIALITERAСY_INDEX-DM_23-1-final-eng.pdf
18-04-UA_REPORT_MEDIALITERAСY_INDEX-DM_23-1-final-eng.pdf18-04-UA_REPORT_MEDIALITERAСY_INDEX-DM_23-1-final-eng.pdf
18-04-UA_REPORT_MEDIALITERAСY_INDEX-DM_23-1-final-eng.pdf
 
Micromeritics - Fundamental and Derived Properties of Powders
Micromeritics - Fundamental and Derived Properties of PowdersMicromeritics - Fundamental and Derived Properties of Powders
Micromeritics - Fundamental and Derived Properties of Powders
 
URLs and Routing in the Odoo 17 Website App
URLs and Routing in the Odoo 17 Website AppURLs and Routing in the Odoo 17 Website App
URLs and Routing in the Odoo 17 Website App
 
TataKelola dan KamSiber Kecerdasan Buatan v022.pdf
TataKelola dan KamSiber Kecerdasan Buatan v022.pdfTataKelola dan KamSiber Kecerdasan Buatan v022.pdf
TataKelola dan KamSiber Kecerdasan Buatan v022.pdf
 
Separation of Lanthanides/ Lanthanides and Actinides
Separation of Lanthanides/ Lanthanides and ActinidesSeparation of Lanthanides/ Lanthanides and Actinides
Separation of Lanthanides/ Lanthanides and Actinides
 

MONITORING FUTURENATIONAL SURVEY RESULTS ON DRUG U.docx

  • 1. MONITORING FUTURE NATIONAL SURVEY RESULTS ON DRUG USE 1975–2016 2016 Overview the Sponsored by The National Institute on Drug Abuse at The National Institutes of Health Key Findings on Adolescent Drug Use Lloyd D. Johnston Patrick M. O’Malley Richard A. Miech Jerald G. Bachman John E. Schulenberg MONITORING THE FUTURE NATIONAL SURVEY RESULTS ON
  • 2. DRUG USE 2016 Overview Key Findings on Adolescent Drug Use by Lloyd D. Johnston, Ph.D. Patrick M. O’Malley, Ph.D. Richard A. Miech, Ph.D. Jerald G. Bachman, Ph.D. John E. Schulenberg, Ph.D. The University of Michigan Institute for Social Research Sponsored by: The National Institute on Drug Abuse National Institutes of Health This publication was written by the principal investigators and staff of the Monitoring the Future project at the Institute for Social Research, the University of Michigan, under Research Grant R01 DA 001411 from the National Institute on Drug Abuse. The findings and conclusions in this report are those of the authors and do not necessarily represent the views of the sponsor.
  • 3. Public Domain Notice All material appearing in this volume is in the public domain and may be reproduced or copied, whether in print or non-print media including derivatives, without permission from the authors. If you plan to modify the material, please contact the Monitoring the Future Project at [email protected] for verification of accuracy. Citation of the source is appreciated, including at least the following: Monitoring the Future, Institute for Social Research, The University of Michigan. Recommended Citation Johnston, L. D., O’Malley, P. M., Miech, R. A., Bachman, J. G., & Schulenberg, J. E. (2017). Monitoring the Future national survey results on drug use, 1975-2016: Overview, key findings on adolescent drug use. Ann Arbor: Institute for Social Research, The University of Michigan. Institute for Social Research The University of Michigan Ann Arbor, Michigan Printed January 2017 http://creativecommons.org/licenses/by/4.0/ https://creativecommons.org/licenses/by/4.0/ Contents Click on any item below (in blue) to go directly to that page.
  • 4. Introduction ............................................................................................... .................................1 Study Design and Methods ............................................................................................... .........3 Summary of Key Findings ............................................................................................... ..........5 Specific Results by Drug Any Illicit Drug ............................................................................................... .............9 Marijuana ............................................................................................... ....................11 Synthetic Marijuana ............................................................................................... ....13 Inhalants ............................................................................................... ......................15 LSD ............................................................................................... .............................17 Cocaine
  • 5. ............................................................................................... .......................19 Crack ............................................................................................... ...........................21 Amphetamines and Other Stimulant Drugs ...............................................................23 Methamphetamine and Crystal Methamphetamine (Ice) ..........................................25 Heroin ............................................................................................... .........................27 Other Narcotic Drugs, Including OxyContin and Vicodin ........................................29 Tranquilizers ............................................................................................... ...............31 Sedatives (Barbiturates) ............................................................................................3 3 MDMA (Ecstasy, Molly) and Other “Club Drugs” ..................................................35 Alcohol ............................................................................................... ........................37 Cigarettes
  • 6. ........................................................................................ ....... ....................39 Smokeless Tobacco ............................................................................................... .....41 Vaping .............................................................................................. . .........................43 Small Cigars, Cigarillos, Large Cigars, and Tobacco Using a Hookah .....................45 Steroids ............................................................................................... .......................47 Subgroup Differences ............................................................................................... ...............49 Lessons Learned ............................................................................................... ........................52 Tables 1. Trends in Lifetime Prevalence of Use of Various Drugs for Grades 8, 10, and 12 Combined .................................................................................54 2. Trends in Annual Prevalence of Use of Various Drugs for Grades 8, 10, and 12 Combined
  • 7. .................................................................................56 3. Trends in 30‐Day Prevalence of Use of Various Drugs for Grades 8, 10, and 12 Combined .................................................................................58 4. Trends in Daily Prevalence of Use of Selected Drugs for Grades 8, 10, and 12 Combined .................................................................................60 5. Trends in Lifetime Prevalence of Use of Various Drugs in Grades 8, 10, and 12 ............................................................................................... ...62 6. Trends in Annual Prevalence of Use of Various Drugs in Grades 8, 10, and 12 ............................................................................................... ...68 7. Trends in 30‐day Prevalence of Use of Various Drugs in Grades 8, 10, and 12 ............................................................................................... ...76 8. Trends in 30‐Day Prevalence of Daily Use of Various Drugs in Grades 8, 10, and 12
  • 8. ............................................................................................... ...82 9. Trends in Harmfulness of Drugs as Perceived by 8th Graders ..................................87 10. Trends in Harmfulness of Drugs as Perceived by 10th Graders ................................90 11. Trends in Harmfulness of Drugs as Perceived by 12th Graders ................................93 12. Trends in Disapproval of Drug Use in Grade 8 .........................................................97 13. Trends in Disapproval of Drug Use in Grade 10 ..................................................... 100 14. Trends in Disapproval of Drug Use in Grade 12 ..................................................... 103 15. Trends in Availability of Drugs as Perceived by 8th Graders ................................. 107 16. Trends in Availability of Drugs as Perceived by 10th Graders ............................... 109 17. Trends in Availability of Drugs as Perceived by 12th Graders ............................... 111 Introduction Monitoring the Future (MTF) is a long-term study of American adolescents, college students, and adult high
  • 9. school graduates through age 55. It has been conducted annually by the University of Michigan’s Institute for Social Research since its inception in 1975 and is supported under a series of investigator-initiated, competitive research grants from the National Institute on Drug Abuse. The need for a study such as MTF is clear. Substance use by American young people has proven to be a rapidly changing phenomenon, requiring frequent assessments and reassessments. Since the mid-1960s, when it burgeoned in the general youth population, illicit drug use has remained a major concern for the nation. Smoking, drinking, and illicit drug use are leading causes of morbidity and mortality during adolescence as well as later in life. How vigorously the nation responds to teenage substance use, how accurately it identifies the emerging substance abuse problems, and how well it comes to understand the effectiveness of policy and intervention efforts largely depend on the ongoing collection of valid and reliable data. MTF is uniquely designed to generate such data in order to provide an accurate picture of what is happening in this domain and why, and the study has served that function well for the past 42 years. Policy discussions in the scientific literature and media, in government, education, public health institutions, and elsewhere have been informed by the ready availability of extensive and consistently accurate information from the study relating to a large and ever-growing number of substances. Similarly, the work of organizations and agencies providing prevention and treatment services is informed by MTF. The 2016 MTF survey involved about 45,500 students in 8th-, 10th-, and 12th grades enrolled in 372 secondary
  • 10. schools nationwide. The first published results based on the 2016 survey are presented in this report. Recent trends in the use of licit and illicit drugs are emphasized, as well as trends in the levels of perceived risk and personal disapproval associated with each drug. This project has shown these beliefs and attitudes to be particularly important in explaining trends in use. 1Prevalence refers to the proportion or percentage of the sample reporting use of the given substance on one or more occasions in a given time interval—e.g., lifetime, past 12 months, or past 30 days. For most drugs, the prevalence of daily use refers to reported use on 20 or more occasions in the past 30 days, except for cigarettes and smokeless tobacco, for which actual daily use is measured, and for binge drinking, defined as having 5+ drinks on at least one occasion in the prior two weeks. E-cigarettes and some tobacco products are measured on number of days used in past 30 days. In addition, trends in the perceived availability of each drug are presented, which at times have proven important to explaining changes in usage levels for some drugs. A synopsis of the design and methods used in the study and an overview of the key results from the 2016 survey follow this introductory section. We then provide a separate section for each individual drug class, including figures that show trends in the overall proportions of students at each grade level (a) using the drug, (b) seeing a “great risk” associated with its use
  • 11. (perceived risk), (c) disapproving of its use (disapproval), and (d) saying that it would be “fairly easy” or “very easy” to get if they wanted to (perceived availability). For 12th graders, annual data are available since 1975 and for 8th and 10th graders since 1991, the first year they were included in the study. The tables at the end of this report provide the statistics underlying the figures; in addition, they present data on lifetime, annual, 30-day, and (for selected drugs) daily prevalence.1 For the sake of brevity, we present these prevalence statistics here in tabular form only for the 1991–2016 interval, but statistics on 12th graders going back to 1975 are available in other MTF publications. For each prevalence period, the tables indicate which one-year changes from 2015 to 2016 are statistically significant. (In the text below, ‘s’ indicates p≤.05, ‘ss’ indicates p≤.01, ‘sss’ indicates p≤.001, and ‘ns’ indicates not statistically significant). The graphic depictions of multiyear trends often reveal gradual change that may not reach significance in a given one- year interval but nevertheless may be shown to be real over a longer time frame. An extensive analysis of the study’s findings on secondary school students may be found in Volume I, the second publication in this series, published at the end of May each year.2 Volume I contains a more detailed description of the study’s methodology, as well as chapters on grade of initiation, attitudes toward drugs, the social milieu, and a summary of other publications from the study that year (mostly journal articles). Volume I also contains an appendix 2The most recent publication of Volume I is Miech, R. A., Johnston, L. D.,
  • 12. O’Malley, P. M., Bachman, J. G., & Schulenberg, J. E. (2016). Monitoring the Future national survey results on drug use, 1975–2015: Volume I, Secondary school students. Ann Arbor: Institute for Social Research, The University of Michigan, 636 pp. Available at: http://monitoringthefuture.org/pubs/monographs/mtf- vol1_2015.pdf 1 report because the follow-up data from those populations become available later in the year. Those findings will be covered in Volume II, the third monograph in this annual series, published at the end of July each year.3 Two annual MTF Occasional Papers are published each year in conjunction with Volumes I and II, providing trends in use for various demographic subgroups.4 A fourth monograph, HIV/AIDS Risk and Protective Behaviors Among Young Adults, dealing with national trends in HIV/AIDS-related risk and protective behaviors among young adults 21 to 40 years old, was added to the series beginning in 2010.5 It is published in October of each year. From 2005 to 2009, these findings were reported as part of Volume II. For the publication years prior to 2010, the volumes in these annual series are available from the NIDA Drug Publications Research Dissemination Center (877- NIDA-NIH, drugpubs.drugabuse.gov) and can also be
  • 13. found on the MTF website. Beginning with the 2010 publication date, the volumes are available at the MTF website immediately upon publication. Further information on the study, including its latest press releases, a listing of all publications, and freely accessible reports may also be found at www.monitoringthefuture.org. 3The most recent publication of Volume II is Johnston, L. D., O’Malley, P. M., Bachman, J. G., Schulenberg, J. E. , and Miech, R. A. (2016). Monitoring the Future national survey results on drug use, 1975–2015: Volume II, College students & adults ages 19–55. Ann Arbor: Institute for Social Research, The University of Michigan, 427 pp. Available at: http://www.monitoringthefuture.org/pubs/monographs/mtf- vol2_2015.pdf 4Johnston, L. D., O'Malley, P. M., Bachman, J. G., Schulenberg, J. E., & Miech, R. A. (2016). Demographic subgroup trends among adolescents in the use of various licit and illicit drugs 1975-2015 (Monitoring the Future Occasional Paper No. 86). Ann Arbor, MI: Institute for Social Research, University of Michigan, 552 pp. Available at: http://monitoringthefuture.org/pubs/occpapers/mtf-occ86.pdf Johnston, L. D., O'Malley, P. M., Bachman, J. G., Schulenberg, J. E., & Miech, R. A. (2016). Demographic subgroup trends among young adults in the use of various licit and illicit drugs 1989-2015 (Monitoring the Future
  • 14. Occasional Paper No. 87). Ann Arbor, MI: Institute for Social Research, University of Michigan, 109 pp. Available at: http://monitoringthefuture.org/pubs/occpapers/mtf-occ87.pdf 5The most recent publication in the HIV/AIDS monograp series is Johnston, L. D., O’Malley, P. M., Bachman, J. G., Schulenberg, J. E., Patrick, M. E., & Miech, R. A. (2016). HIV/AIDS: Risk and protective behaviors among adults ages 21- 40 in the U.S., 2004–2015. Ann Arbor: Institute for Social Research, The University of Michigan, 123 pp. Available at: http://monitoringthefuture.org/pubs/monographs/mtf-hiv- aids_2015.pdf 2 drugpubs.drugabuse.gov www.monitoringthefuture.org Study Design and Methods Monitoring the Future’s main data collection involves a series of large, annual surveys of nationally representative samples of public and private secondary school students throughout the coterminous United States. Every year since 1975, such samples of 12th graders have been surveyed. In 1991, the study was expanded to include comparable, independent national samples of 8th and 10th graders. The year 2016 marked the 42nd survey of 12th graders and the 26th survey of 8th and 10th graders.
  • 15. Sample Sizes In 2016 about 45,500 students in 372 secondary schools participated in the study, with sample sizes in 8th, 10th, and 12th grades of about 17,600, 15,200, and 12,600, respectively. The number of cases upon which a particular statistic is based may be less than the total sample size. Multiple questionnaire forms are distributed randomly at each grade level to increase coverage of attitudinal and behavioral domains relevant to substance use. To reduce burden on the respondents, not all questions are contained in all forms. The tables here contain notes on the number of forms used for each statistic if less than the total sample is used. Field Procedures University of Michigan staff members administer the questionnaires to students, usually in the student classroom during a regular class period. Participation is voluntary. Parents are notified well in advance of the survey administration and are provided the opportunity to decline their child’s participation. Questionnaires are self- completed and are formatted for optical scanning. Procedures are kept consistent over time. In 8th and 10th grades the questionnaires are completely anonymous, and in 12th grade they are confidential (name and address information is gathered separately from the 12th grade questionnaire to permit the longitudinal follow- up surveys of random subsamples of participants after high school). Extensive procedures are followed to protect the confidentiality of the participants and their data. All procedures are reviewed and approved on an annual basis by the University of Michigan’s Institutional Review Board (IRB) for compliance with federal guidelines for the treatment of human subjects.
  • 16. Measures A standard set of three questions is used to determine usage levels for most of the drugs. For example, we ask, “On how many occasions (if any) have you used marijuana… (a)…in your lifetime? (b)…during the last 12 months? (c)…during the last 30 days?” Each of the three questions is answered on the same answer scale: 0, 1–2, 3–5, 6–9, 10–19, 20–39, and 40 or more occasions. For the psychotherapeutic drugs (amphetamines, sedatives [barbiturates], tranquilizers, and narcotics other than heroin), respondents are instructed to include only use “…on your own—that is, without a doctor telling you to take them.” A similar qualification is used in the question on use of anabolic steroids, OxyContin, Vicodin, and several other drugs. For cigarettes, respondents are asked two questions about use. First, they are asked, “Have you ever smoked cigarettes?” The answer categories are “never,” “once or twice,” “occasionally but not regularly,” “regularly in the past,” and “regularly now.” The second question asks, “How frequently have you smoked cigarettes during the past 30 days?” The answer categories are “not at all,” “less than one cigarette per day,” “one to five cigarettes per day,” and about one-half, one, one and one half, and two packs or more per day. Smokeless tobacco questions parallel those for cigarettes. There are also questions recently added about electronic vaporizers, e-cigarettes, small cigars, and a number of other tobacco products. In general, their use is asked on a prevalence/frequency scale for either the last 12 months or the last 30 days.
  • 17. Alcohol use is measured using the three questions illustrated above for marijuana. A parallel set of three questions asks about the frequency of being drunk. Binge drinking is assessed with the question, “How many times (if any) have you had five or more drinks in a row” over the past two weeks? Extreme binge, now also called high- intensity, drinking among 12th graders is assessed with similar questions about consuming ten or more and fifteen or more drinks in a row. In general, we try to keep measures consistent across time. When a change is warranted, we usually splice the older and newer measures for at least one year to permit an assessment of the effect of the change. Perceived risk is measured by the question, “How much do you think people risk harming themselves (physically or in other ways), if they…” try or use a drug—for example, “…try marijuana once or twice.” The answer categories are “no risk,” “slight risk,” “moderate risk,” “great risk,” and “can’t say, drug unfamiliar.” Parallel questions refer to using marijuana “occasionally” and “regularly.” 3 Disapproval is measured by the question “Do YOU disapprove of people doing each of the following?” followed by “trying marijuana once or twice,” for example. Answer categories are “don’t disapprove,” “disapprove,” and “strongly disapprove.” In the 8th- and 10th-grade questionnaires, a fourth category—“can’t say, drug unfamiliar”—is provided and included in the calculation of percentages.
  • 18. Perceived availability is measured by the question “How difficult do you think it would be for you to get each of the following types of drugs, if you wanted some?” Answer categories are “probably impossible,” “very difficult,” “fairly difficult,” “fairly easy,” and “very easy.” For 8th and 10th graders, an additional answer category— “can’t say, drug unfamiliar”—is provided and included in the calculation of percentages. 4 Summary of Key Findings Before delving into the 2016 findings, a note about three kinds of trends we reference: Monitoring the Future (MTF) is designed to detect age effects, secular trends (sometimes referred to as period effects), and cohort effects in substance use and related attitudes and beliefs. Age effects (similar changes at similar ages seen across multiple class cohorts) are common during adolescence, and we typically find that use, as well as positive attitudes and beliefs about use, increase across 8th, 10th, and 12th grades. When changes over time in substance use and related attitudes and beliefs are parallel across the three grades, they reflect secular trends, which are also common. Cohort effects pertain to differences in substance use and related attitudes and behaviors among those born at different times that are maintained as the birth cohorts age (or in this case, as class-in-school cohorts, which are strongly correlated with age). Such cohort effects sometimes drive changes in substance use prevalence at
  • 19. the population level. For example, much of the decline in the prevalence of U.S. cigarette smoking has its roots in youth cohorts that did not take up smoking and then continued to abstain from smoking as they aged into adulthood. As subsequent youth cohorts continued to avoid smoking and then grew older, these cohorts contributed to a decline in the overall population prevalence of smoking. Cohort effects can also act in the opposite direction, with newer cohorts taking up a substance and continuing to use it as they get older. One important contribution of the MTF study has been the specification of cohort effects that emerged starting in the early 1990s, when an increase in youth substance use occurred for many drugs. MTF allows detection of cohort effects at an early age through comparison of substance use prevalence of 8th, 10th, and 12th graders relative to each other. Often 8th grade substance use is a bellwether, and year-to-year changes that are unique to 8th grade can signify an emerging increase or decrease in substance use at later grade levels with some time lag. The analyses and associated tables that follow present substance use trends for all three grades separately, as well as trends in key attitudes, beliefs, and perceived availability. In a number of cases we provide insight into the age and cohort effects and secular trends that underlie trends in use and in key attitudes and beliefs. An additional set of tables provides an overview of drug 6 The few exceptions were annual use of bath salts among 8th graders only, annual use of over-the-counter cough and cold medicines to get high
  • 20. among 8th graders, use trends for the three grades combined (Tables 1–4). This information gives a summary of the general nature of secular trends over the last several years, though it obscures any cohort effects that may be occurring. Also, for simultaneous trends that are in the same direction and magnitude across all three grades, these combined analyses provide greater statistical power to detect secular trends that are statistically significant. Declines in Use of a Number of Drugs in 2016 Perhaps the most striking finding in 2016 is that across the broad spectrum of drugs (more than 50 classes and subclasses) most decreased and hardly any exhibited a statistically significant increase.6 In many cases these decreases in use were continuing the declines seen in 2014 and 2015. Cigarettes and alcohol continued to show significant declines, reaching their lowest levels in the history of the study. With regard to illicit drugs, annual prevalence declined in the three grades combined for the use of any illicit drug, any illicit drug other than marijuana, synthetic marijuana, MDMA(ecstasy, Molly), cocaine, crack, amphetamines, Adderall specifically, methamphetamine, heroin, Rohypnol, some psychotherapeutic drugs used without medical supervision (Vicodin, tranquilizers), and steroids. The decline in annual prevalence of using any illicit drug is largely due to the fact that the annual prevalence of marijuana, which tends to drive the overall index, showed a decline in the two lower grades in 2016. (The 2.4 percentage point decline to 9.4% in 8th grade was highly significant; the 1.5 percentage point decline in 10th
  • 21. grade to 23.9% was not.). Among 12th graders, however, the annual prevalence of marijuana has held quite steady for several years, increasing by a non-significant 0.7% to 35.6% in 2016. For the three grades combined, annual prevalence of marijuana showed a significant decline of 1.1 percentage points in 2016. Although use of marijuana declined (or in the case of the 12th graders held steady) in 2016 marijuana attitudes among students continued to move toward greater acceptance. This fact is contradictory to the association that has existed between perceived risk and actual use for many years, in which they usually move in opposite directions with a one-year lag between a change in perceived risk and a change in annual prevalence. (This is a topic we will address in future publications.) Perceived risk of smoking marijuana regularly declined only slightly and 30-day use of heroin with a needle among 10th graders; and none of those changes were large or part of a pattern of continuing increase. 5 further in 2016 in two of the grades, following a sharp decline in all three grades in recent years. In all three grades, the percentage seeing great risk of smoking marijuana regularly is at or near the lowest point ever recorded in the study—58%, 44%, and 31% in grades 8, 10, and 12, respectively. Disapproval of smoking marijuana regularly was unchanged in 8th grade (at 82%) and 10th grade (at 74% ) in 2016, but declined non- significantly in 12th grade (to 69%). Although the 2016 levels are at or near historic lows, they still indicate
  • 22. relatively high levels of disapproval of smoking marijuana regularly. Indeed the decline in disapproval or regular marijuana use since about 2008 has been considerably less than the decline in perceived risk. Reported availability of marijuana continued a longer- term decline among 8th and 10th graders in 2016. Use of any illicit drug other than marijuana declined slightly in all three grades, significantly so in 8th grade. Annual prevalence in 2016 is 5%, 10%, and 14% in 8th, 10th, and 12th grades, respectively—the lowest levels since all three grades were included in the study in 1991. Additional drugs with declining annual prevalence include synthetic marijuana (which in 2011 was the second most widely used drug after marijuana), MDMA (ecstasy, Molly), inhalants, heroin, cocaine, crack, amphetamines, and steroids. Methamphetamine use declined significantly at 10th grade but remained unchanged in the other two grades. The psychotherapeutic drugs warrant special attention, given that they now make up a significantly larger part of the overall U.S. drug problem than was true 10–15 years ago. This is in part because of increases in nonmedical use of many prescription drugs over that period, and in part because use of a number of street drugs has declined substantially since the mid- to late-1990s. It seems likely that young people are less concerned about the dangers of using these prescription drugs outside of medical regimen because they are widely used for legitimate purposes. (Indeed, the low levels of perceived risk for sedatives and amphetamines observed among 12th graders illustrate this point.) Also, prescription psychotherapeutic drugs are now being advertised directly to the consumer, which implies that they are both widely used and safe.
  • 23. Fortunately, the use of most of these drugs has either leveled or begun to decline in the past few years. The proportion of 12th graders misusing any of these prescription drugs (i.e., amphetamines, sedatives, tranquilizers, or narcotics other than heroin) in the prior year continued to decline in 2016 (-1.0%, not significant) to 12%, down from a high of 17% in 2005. Amphetamine use without a doctor’s orders—which generally has been the second most widely used class of illicit drugs after marijuana—continued a gradual decline in 2016 in all grades, though the one-year declines did not reach statistical significance. Use of narcotics other than heroin without a doctor’s orders (reported only for 12th grade) also continued a gradual decline begun after 2009, when annual prevalence was 9.2%; it was 4.8% after a non- significant decline of 0.6 percentage points in 2016. Given the epidemic of narcotics use in older populations along with concurrent rise in medical emergencies and deaths, it is particularly good news that young people are moving away from the use of these drugs. Illicit Drugs Holding Steady in 2016 The use of a number of drugs showed little or no change from 2015 to 2016. These include hallucinogens, LSD specifically, hallucinogens other than LSD, salvia, tranquilizers, heroin use without a needle, crystal methamphetamine, and the club drugs GHB, rohypnol, and ketamine. Illicit Drugs Showing Any Increase in 2016 The use of so-called “bath salts” (synthetic stimulant cathinones) rose significantly (but just by 0.5% to 0.9%) among 8th graders in 2016 but remained unchanged in the upper grades. Similarly, cough and cold medicines used
  • 24. to get high (which usually contain dextromethorphan) rose significantly among 8th graders to an annual prevalence of 2.6%, but not among the upper grades. Tobacco and Alcohol Use As in 2015, cigarette smoking and alcohol use have continued their long declines and are now at the lowest levels in the history of the survey. Thirty-day prevalence of cigarette use reached a peak in 1996 at grades 8 and 10, capping a rapid climb from the 1991 levels (when data were first gathered on these grades). Between 1996 and 2016, current smoking fell dramatically in these grades, by 87% and 84%, respectively. For 12th graders, peak 30- day prevalence occurred in 1997 at 37% and has shown a more modest decline since then. It is at 11% in 2016—a seven-tenths decline since the peak—with a continuing decline in smoking prevalence in 2016. A similar decline is statistically significant at 8th and 10th grades. Because of the strong cohort effect that we have consistently observed for cigarette smoking, we have predicted use at 12th grade to continue to show declines, as the lighter- using cohorts of 8th and 10th graders become 12th graders. Initiation of cigarette use also continues its long-term and extremely important decline. Lifetime prevalence declined between 2015 and 2016 in all three grades: to 10% in 8th grade (-3.5, sss), to 18% in 10th grade (-2.4, s), and to 29% in 12th grade (-2.8, s). The fact that fewer young people now initiate cigarette smoking is an important reason for the large declines in their current use. The proportion of students who have ever tried cigarettes 6
  • 25. has fallen from peak levels reached in 1996 or 1997 by roughly three quarters, two thirds, and one half in the three grades, respectively. Overall increases in perceived risk and disapproval appear to have contributed to the downturn in cigarette use. Perceived risk of smoking one or more packs of cigarettes per day increased substantially and steadily in all grades from 1995 through 2004, with 62%, 68%, and 74% of 8th, 10th, and 12th graders seeing great risk in 2004. Since then, changes have been small and uneven, and the corresponding figures in 2016 are only slightly changed, at 61%, 72%, and 77%. Disapproval of smoking one or more packs of cigarettes per day has increased somewhat steadily in all three grades since 1996 and has reached very high levels. In 2016 disapproval stands at 88%, 89%, and 85% in grades 8, 10, and 12, respectively. It seems likely that some of the attitudinal change surrounding cigarettes is attributable to the considerable adverse publicity aimed at the tobacco industry in the 1990s, as well as a reduction in cigarette advertising and an increase in antismoking campaigns reaching youth. Various other attitudes toward smoking became more unfavorable during that interval as well, though most have since leveled off. For example, among 8th graders, the proportions saying that they “prefer to date people who don’t smoke” rose from 71% in 1996 to 81% by 2004, where it remained through 2016. Similar changes occurred in 10th and 12th grades. Thus, at the present time, smoking is likely to make an adolescent less attractive to the great majority of potential romantic age-mates. Likewise, most of the other negative connotations of smoking and smokers have leveled off in the past few years after rising previously. In addition to changes in
  • 26. attitudes and beliefs about smoking, price almost surely also played an important role in the decline in use. Cigarette prices rose appreciably in the late 1990s and early 2000s as cigarette companies tried to cover the costs of the 1998 Master Settlement Agreement, and as many states increased excise taxes on cigarettes. A significant increase in the federal tobacco tax passed in 2009 may have contributed to the continuation of the decline in use since then. Cigarillos. One consequence of the rise in cigarette prices is that it may have shifted some adolescents to less expensive alternatives, like cigarillos (little or small cigars), which are taxed at a lower rate than cigarettes. Taking into account this form of smoking of tobacco raises the 30-day prevalence of students smoking tobacco—by about three-fourths among 8th and 10th graders and by more than half among 12th graders—over what it would be if just cigarette smoking were counted. It does appear, however, that the prevalence of using small cigars is also in decline, with 16% of 12th graders in 2016 reporting any past-year use, down substantially from 23% in 2010. Of note is the fact that the majority of users of small cigars in each grade smoke flavored ones. Annual prevalence of smoking tobacco using a Hookah (water pipe) had been increasing steadily until 2014 among 12th graders (8th and 10th graders are not asked about this practice), reaching 23% in 2014; but use declined non-significantly by three percentage points to 20% in 2015 and declined significantly (by 6.9 percentage points) to reach 13% in 2016. Smokeless tobacco. From the mid-1990s to the early 2000s, smokeless tobacco use declined substantially, but
  • 27. a rebound in use developed from the mid-2000s through 2010. Since 2010, prevalence levels have declined modestly in all three grades. Perceived risk and disapproval appear to have played important roles in the earlier decline in smokeless tobacco use. In all three grades, perceived risk and disapproval rose fairly steadily from 1995 through 2004, accompanying the declines in use. However, there was not much change between 2004 and 2010, suggesting that other factors may have led to the increases in smokeless tobacco use during that time interval. : perhaps including increased promotion of these products, a proliferation of types of smokeless tobacco products available, and increased restrictions on places where cigarette smoking is permitted. The decline in smokeless tobacco use since 2010 (including a significant decline among 12th graders in 2015 and 10th graders in 2016) may be attributable, at least in part, to the 2009 increase in federal taxes on tobacco. Perceived risk has not changed appreciably since 2010 at any grade level. Alcohol remains the substance most widely used by today’s teenagers. Despite recent declines, six out of every ten students (61%) have consumed alcohol (more than just a few sips) by the end of high school, and about a quarter (23%) have done so by 8th grade. In fact, nearly half (46%) of 12th graders and one in eleven (9%) 8th graders in 2016 reported having been drunk at least once in their life. Alcohol use began a substantial decline in the 1980s. To some degree, alcohol trends have tended to parallel the trends in illicit drug use. These include a modest increase in binge drinking (defined as having five or more drinks in a row at least once in the past two weeks) in the early to mid-1990s, though it was a proportionally smaller increase than was seen for cigarettes and most of the illicit
  • 28. drugs. Fortunately, binge drinking rates leveled off in the early 2000s, just about when the illicit drug rates began to turn around, and in 2002, a drop in drinking and drunkenness resumed in all grades. Gradual declines continued into 2016, which marked the lowest levels for 7 alcohol use and drunkenness ever recorded by the survey in the three grades combined. All three grades showed further decline in 2016. The declines in the percentage reporting having been drunk at least once are quite substantial, down from the peak year since 1991 by about 70%, 50%, and 30% for grades 8, 10, and 12. Vaping Vaping involves the inhalation of vapors (sometimes including nicotine) using devices such as e-cigarettes, “mods,” and e-pens. Thirty-day prevalence of vaping fell significantly in each grade in 2016. It declined by 1.8 percentage points in 8th grade, by 3.3 percentage points in 10th grade, and by 3.8 percentage points in 12th grade, to levels of 6%, 11%, and 13% in the respective grades. This marks the first reversal of vaping prevalence, which grew rapidly from near zero prevalence in 2011 to one of the most common forms of adolescent substance use. Despite the decline in 2016 the prevalence of vaping remains substantially higher than the use of any other tobacco product, including cigarettes. Whether teen vaping has peaked or only paused is an issue that MTF will be able to determine in the coming years.
  • 29. The percentage of students who associated vaping with “great risk” increased slightly as vaping prevalence declined. E-cigarettes are the most commonly used vaping device, and from 2015 to 2016 the percentage of adolescents who believe that regular e-cigarette use poses a great risk of harm increased from 16% to 18% in 12th grade, from 17% to 19% in 10th grade, and from 19% to 21% in 8th grade. Even after these increases, e-cigarettes have some of the lowest levels of perceived risk of any substance. One reason for low levels of perceived risk may be that the majority of users say that they vape only flavoring not nicotine, on their most recent occasion of use. This is consistent with the fact that only a very few of them (from 5% to 10% of users) say they are using e-cigarettes to help them quit regular cigarette use. The most common reason given for use is “to see what it’s like,” while the second most common reason given is “because it tastes good.” 8 Any Illicit Drug MTF routinely reports three different indexes of illicit drug use—any illicit drug,7 any illicit drug other than marijuana, and any illicit drug including inhalants. In this section we discuss only the first two; the statistics for all three may be found in Tables 5–7. In order to make direct comparisons over time, we have kept the definitions and measurement of these indexes constant. The levels of prevalence of each of the indexes could be somewhat affected by the inclusion
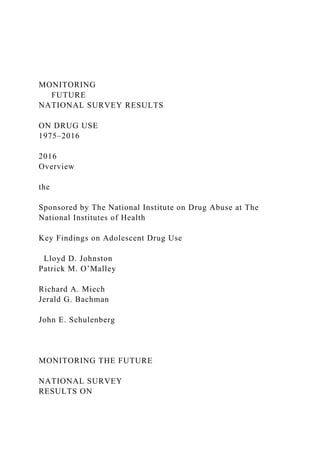
  • 30. of newer substances. Typically, the effects would be minimal, primarily because most individuals using newer ones are also using the more prevalent drugs included in the indexes. The major exception has been inhalants, the use of which is quite prevalent in the lower grades, so in 1991 a special index that includes inhalants was added. Trends in Use In the late 20th century, U.S. adolescents reached extraordinarily high levels of illicit drug use by U.S. as well as international standards. The trends in lifetime use of any illicit drug are shown in the first (upper left) panel on the facing page.8 In 1975, when MTF began, the majority of young people (55%) had used an illicit drug by the time they left high school. This figure rose to two thirds (66%) in 1981 before a long and gradual decline to 41% by 1992—the low point. After 1992— in what we have called the “relapse phase” in the drug epidemic—the proportion rose considerably to a recent high point of 55% in 1999; it then declined gradually to 47% in 2009, and has remained between 48% and 50% since 2011. Trends for annual, as opposed to lifetime, prevalence are shown in the second (upper right) panel. They are quite parallel to those for lifetime prevalence, but at a lower level. Among 8th graders, a gradual and continuing falloff occurred after 1996. Peak rates since 1991 were reached in 1997 in the two upper grades and declined little for several years. Between 2001 and 2007 all three grades showed declines, but the annual use rates in all three grades rose some through 2012. In 2016, 8th and 10th grades showed some decline,while
  • 31. 7Footnote ‘a’ to Tables 5 through 8 provides the exact definition of any illicit drug. 8This is the only set of figures in this Overview presenting lifetime use statistics. Lifetime statistics for all drugs may be found in Table 5. annual prevalence among 12th grader showed essentially no change. Because marijuana is much more prevalent than any other illicit drug, trends in its use tend to drive the index of any illicit drug use. Thus we also report an index that excludes marijuana and shows the proportions of students who use any of the other illicit drugs. The proportions who have used any illicit drug other than marijuana in their lifetimes are shown in the third panel (lower left). In 1975 over one third (36%) of 12th graders had tried some illicit drug other than marijuana. This figure rose to 43% by 1981, then declined for over a decade to a low of 25% in 1992. An increase followed in the 1990s as the use of a number of drugs rose steadily, and it reached 30% by 1997. (In 2001 it was 31%, but this apparent upward shift in the estimate was an artifact due to a change in the question wording for “other hallucinogens” and tranquilizers.9) Lifetime prevalence among 12th graders then fell slightly to 24% by 2009, before dropping to 21% by 2016. The fourth (lower right) panel presents the annual prevalence data for any illicit drug other than marijuana, which shows a pattern of change over the past few years similar to the index of any illicit drug use, but with much less pronounced change since 1991. It dropped fairly steadily and gradually in all three grades in recent years but leveled in 2013 before dropping to 14%.among 12th
  • 32. graders by 2016. In fact, prevalence declined in all three grades in 2016—significantly so in 8th grade. Overall, these data reveal that while use of individual drugs (other than marijuana) may fluctuate widely, the proportion using any of them is much more stable. In other words, the proportion of students prone to using such drugs and willing to cross the normative barriers to such use changes more gradually. The usage rate for each individual drug, on the other hand, reflects many more rapidly changing determinants specific to that drug, such as how widely its psychoactive potential is recognized, how favorable the reports of its supposed benefits are, how risky its use is seen to be, how acceptable it is in the peer group, how accessible it is, and so on. 9The term psychedelics was replaced with hallucinogens, and shrooms was added to the list of examples, resulting in somewhat more respondents indicating use of this class of drugs. For tranquilizers, Xanax was added to the list of examples given, slightly raising the reported prevalence of use. 9 Any Illicit Drug and Any Illicit Drug Other than Marijuana: Trends in Lifetime and Annual Use Grades 8, 10, 12 Source. The Monitoring the Future study, the University of Michigan.
  • 33. *In 2001, a revised set of questions on other hallucinogen use and tranquilizer use were introduced. In 2013, a revised set of questions on amphetamine use was introduced. Data for any illicit drug other than marijuana were affected by these changes. Use % who used any illicit drug in lifetime Use % who used any illicit drug in last 12 months Use % who used any illicit drug other than marijuana in lifetime* Use % who used any illicit drug other than marijuana in last 12 months* P E R C E N T 0 20
  • 34. 40 60 80 100 YEAR '74 '76 '78 '80 '82 '84 '86 '88 '90 '92 '94 '96 '98 '00 '02 '04 '06 '08 '10 '12 '14 '16 8th Grade 10th Grade 12th Grade P E R C E N T 0 20 40 60
  • 35. 80 100 YEAR '74 '76 '78 '80 '82 '84 '86 '88 '90 '92 '94 '96 '98 '00 '02 '04 '06 '08 '10 '12 '14 '16 P E R C E N T 0 20 40 60 80 100 YEAR '74 '76 '78 '80 '82 '84 '86 '88 '90 '92 '94 '96 '98 '00 '02 '04 '06
  • 36. '08 '10 '12 '14 '16 P E R C E N T 0 20 40 60 80 100 YEAR '74 '76 '78 '80 '82 '84 '86 '88 '90 '92 '94 '96 '98 '00 '02 '04 '06 '08 '10 '12 '14 '16 10 Marijuana
  • 37. Marijuana has been the most widely used illicit drug throughout MTF’s 42-year history. It can be taken orally, mixed with food or drink, and smoked, including in a concentrated form as hashish—the use of which is much more common in Europe.10 The great majority of recreational use in the U.S. involves smoking it in rolled cigarettes (“joints”), in pipes or water pipes (“bongs”), in hollowed-out cigars (“blunts”), or more recently in a vaporizer. Newer methods also include smoking or eating different forms of resin extracts like hash oil, honey oil, or shatter—a solid form. Trends in Use Annual marijuana prevalence peaked among 12th graders in 1979 at 51%, following a rise that began during the 1960s. Then use declined fairly steadily for 13 years, bottoming at 22% in 1992—a decline of more than half. The 1990s, however, saw a resurgence of use. After a considerable increase (one that actually began among 8th graders a year earlier than among 10th and 12th graders), annual prevalence rates peaked in 1996 at 8th grade and in 1997 at 10th and 12th grades. After these peak years, use declined among all three grades through 2007 or 2008. After these declines, an upturn occurred in use in all three grades, lasting for three years in the lower grades and longer in grade 12. Annual marijuana prevalence among 8th graders increased in use from 2007 to 2010, decreased slightly from 2010 to 2012, and then declined significantly in 2016. Among 10th graders, use increased somewhat from 2008 to 2013 and then declined after that. Among 12th graders, use increased from 2006 to 2011 and then held level through 2016. As shown in Table 8, daily use increased in all three grades after 2007, reaching peaks in 2011 (at 1.3% in 8th), 2013 (at 4.0% in 10th), and
  • 38. 2011 (at 6.6% in 12th), before declining slightly since. Daily prevalence rates in 2016 were 0.7%, 2.5%, and 6.0%, respectively, with one in seventeen 12th graders smoking daily. Perceived Risk The proportion of students seeing great risk from smoking marijuana regularly fell during the rise in use in the 1970s and again during the subsequent rise in use in the 1990s. Indeed, for 10th and 12th grades, perceived risk declined a year before use rose in the upturn of the 1990s, making perceived risk a leading indicator of 10Compared with Europe, American teens have high rates of illicit drug use http://monitoringthefuture.org/pressreleases/16ESPADpr.pdf change in use. (The same may have happened for 8th grade as well, but we lack data starting early enough to know.) The decline in perceived risk halted in 1996 in 8th and 10th grades; the increases in use in 10th and 12th grades ended a year or two later, again making perceived risk a leading indicator of trends in use. From 1996 to 2000, perceived risk held fairly steady, and the decline in use in the upper grades stalled. After some decline prior to 2002, perceived risk increased a bit in all grades through 2004 as use decreased. Since 2004 in 8th grade, 2005 in 12th grade, and 2008 in 10th grade, perceived risk has fallen substantially, presaging some resurgence in marijuana use lasting three to five years; but no increase in perceived risk preceded the recent leveling of use. Rather, perceived risk has continued a steep decline since the mid-2000s without a concomitant further rise in overall use. Disapproval and availability may be constraining factors offsetting
  • 39. the effects of risk. Recent, sharp declines in the use of “gateway drugs”—in particular cigarette smoking, with which marijuana use has been highly correlated— may also be playing a role Disapproval Personal disapproval of trying marijuana has declined some since 2007 or 2008 in all three grades, but still remains quite high with 82%, 74%, and 69% in 8th, 10th, and 12th grades still saying that they disapprove of regular use. Disapproval fell considerably among 8th graders between 1991 and 1996 and among 10th and 12th graders between 1992 and 1997—by 17, 21, and 19 percentage points, respectively, over those intervals of increasing use and declining perceived risk. As is often the case, perceived risk fell before disapproval. Since 2008 there has been some decline in disapproval. Availability Since the MTF study began in 1975, between 80% and 90% of 12th graders each year have said that they could get marijuana fairly easily or very easily if they wanted some, with that figure standing at 81% in 2016. Marijuana has been considerably less readily available to 8th graders, with 35% in 2016 reporting it to be fairly or very easy to get. Availability is intermediate for the 10th graders, with 64% reporting easy access in 2016. Availability has declined appreciably, especially among the younger adolescents, but marijuana remains readily available to most 12th graders. 11 Marijuana: Trends in Annual Use, Risk, Disapproval, and
  • 40. Availability Grades 8, 10, 12 Source. The Monitoring the Future study, the University of Michigan. Use % who used in last 12 months Risk % seeing "great risk" in using regularly Disapproval % disapproving of using regularly Availability % saying "fairly easy" or "very easy" to get P E R C E N T 0 20 40 60
  • 41. 80 100 YEAR '74 '76 '78 '80 '82 '84 '86 '88 '90 '92 '94 '96 '98 '00 '02 '04 '06 '08 '10 '12 '14 '16 8th Grade 10th Grade 12th Grade P E R C E N T 0 20 40 60 80 100
  • 42. YEAR '74 '76 '78 '80 '82 '84 '86 '88 '90 '92 '94 '96 '98 '00 '02 '04 '06 '08 '10 '12 '14 '16 P E R C E N T 0 20 40 60 80 100 YEAR '74 '76 '78 '80 '82 '84 '86 '88 '90 '92 '94 '96 '98 '00 '02 '04 '06 '08 '10 '12 '14 '16 P E
  • 43. R C E N T 0 20 40 60 80 100 YEAR '74 '76 '78 '80 '82 '84 '86 '88 '90 '92 '94 '96 '98 '00 '02 '04 '06 '08 '10 '12 '14 '16 12 Synthetic Marijuana Synthetic marijuana has generally been sold over the counter under such labels as Spice and K-2. It usually contains some herbal materials that have been sprayed with one or more of the designer chemicals that fall into
  • 44. the cannabinoid family. Until March 2011, these drugs were not scheduled by the Drug Enforcement Administration (DEA), so they were readily and legally available on the Internet and in convenience stores, head shops, gas stations, etc. However, the DEA scheduled some of the most widely used chemicals beginning March 1, 2011, making their possession and sale no longer legal; subsequent laws have expanded the list of banned chemicals, but producers keep tweaking the chemical formula to avoid legal control. These drugs can be dangerous both because the active ingredients keep changing and because those ingredients have never undergone testing to determine their effects on humans. Trends in Use MTF first addressed the use of synthetic marijuana in its 2011 survey by asking 12th graders about their use in the prior 12 months (which would have covered a considerable period of time prior to the drugs being scheduled). Annual prevalence was found to be 11.4%, making synthetic marijuana the second most widely used class of illicit drug after marijuana itself among 12th graders at that time. Despite the DEA’s intervention, use among 12th graders remained unchanged in 2012 at 11.3%, which suggests either that compliance with the new scheduling had been limited or that producers of these products succeeded in continuing to change their chemical formulas to avoid using the ingredients that had been scheduled. In 2012, for the first time, 8th and 10th graders were asked about their use of synthetic marijuana; their annual prevalence rates were 4.4% and 8.8%, respectively. Use in all 3 grades dropped in 2013, and the decline was sharp and significant among 12th graders, while the
  • 45. declines were significant for both 10th and 12th graders in 2014 and continued through 2016, with significant declines in both 10th and 12th grades. Annual prevalence in 2016 was down to 2.7%, 3.3%, and 3.5% for the three grades, reflecting a dramatic drop in use. Perceived Risk All three grades were asked whether they associated great risk with trying synthetic marijuana once or twice. As can be seen on the facing page, the level of perceived risk for experimental use was quite low in 2012 (between 24% and 25%) but has risen some, particularly among 12th graders, to 36% in 2016. (Likely the pecent would be higher if those answering “Can’t say, Drug unfamiliar” were excluded.) The availability of these drugs over the counter probably has had the effect of communicating to teens that they must be safe, though they are not. Disapproval and Availability have not been measured for this class of drugs. 13 Synthetic Marijuana: Trends in Annual Use and Risk Grades 8, 10, 12 Source. The Monitoring the Future study, the University of Michigan. Use % who used in last 12 months Risk
  • 46. % seeing "great risk" in using once or twice Disapproval % disapproving of using once or twice Availability % saying "fairly easy" or "very easy" to get P E R C E N T 0 4 8 12 16 20 YEAR '74 '76 '78 '80 '82 '84 '86 '88 '90 '92 '94 '96 '98 '00 '02 '04 '06 '08 '10 '12 '14 '16
  • 47. 8th Grade 10th Grade 12th Grade P E R C E N T 0 20 40 60 80 100 YEAR '74 '76 '78 '80 '82 '84 '86 '88 '90 '92 '94 '96 '98 '00 '02 '04 '06 '08 '10 '12 '14 '16 P E R
  • 48. C E N T 0 20 40 60 80 100 YEAR '74 '76 '78 '80 '82 '84 '86 '88 '90 '92 '94 '96 '98 '00 '02 '04 '06 '08 '10 '12 '14 '16 (no data) P E R C E N T
  • 49. 0 20 40 60 80 100 YEAR '74 '76 '78 '80 '82 '84 '86 '88 '90 '92 '94 '96 '98 '00 '02 '04 '06 '08 '10 '12 '14 '16 (no data) 14 Inhalants Inhalants are any gases or fumes that can be inhaled for the purpose of getting high. These include many household products—the sale and possession of which is legal—including glue, nail polish remover, gasoline, solvents, butane, and propellants used in certain commercial products such as whipped cream dispensers. Unlike nearly all other classes of drugs, their use is most common among younger adolescents and tends to decline as youth grow older. The use of inhalants at an early age may reflect the fact that many
  • 50. inhalants are cheap, readily available (often in the home), and legal to buy and possess. The decline in use with age likely reflects their coming to be seen as “kids’ drugs,” in addition to the fact that a number of other drugs become available to older adolescents, who are also more able to afford them. Trends in Use Inhalant use (excluding the use of nitrite inhalants) by 12th graders rose gradually from 1976 to 1987, which was somewhat unusual because most other forms of illicit drug use were in decline during the 1980s. Use of inhalants rose among 8th and 10th graders from 1991, when those grades were first included in the study, through 1995; it rose among 12th graders from 1992 to 1995. All grades then exhibited a fairly steady and substantial decline in use through 2001 or 2002. After 2001 the grades diverged somewhat in their trends: 8th graders showed a significant increase in use for two years, followed by a decline from 2004 to 2013, and a leveling in 2014, before resuming the decline in 2015 and 2016; 10th graders showed an increase after 2003 but a considerable decline since 2007; and 12th graders showed a brief increase from 2003 to 2005 but also a considerable decline since then. For the three grades combined, annual use declined significantly in both 2012 and 2013, held steady in 2014 and then declined further in 2015 and 2016. Perceived Risk Only 8th and 10th graders have been asked questions about the degree of risk they associate with inhalant use. Relatively low proportions think that there is a “great risk” in using an inhalant once or twice. However, significant increases in this belief were
  • 51. observed between 1995 and 1996 in both 8th and 10th grades, probably due to an anti-inhalant advertising initiative launched by The Partnership for a Drug-Free America. That increase in perceived risk marked the beginning of a long and important decline in inhalant use, when no other drugs showed a turnaround in use. However, the degree of risk associated with inhalant use declined steadily between 2001 and 2008 among both 8th and 10th graders, perhaps explaining the increase in use in 2003 among 8th graders and in 2004 in the upper grades. The hazards of inhalant use were communicated during the mid-1990s, but generational forgetting of those hazards has likely taken place as replacement cohorts who were too young to get that earlier message now comprise the nation’s adolescents. The decline in perceived risk is worrisome, though perceived risk has not changed much since about 2008. In this case, the decline in perceived risk (between 2001 and 2008) did not translate into a large surge in use, but it may leave future class cohorts at risk for a resurgence of inhalant use. Disapproval Over 80% of 8th and 10th grade students say that they would disapprove of even trying an inhalant. (The question was not asked of 12th graders.) There was a very gradual upward drift in this attitude among 8th and 10th graders from 1995 through about 2001, with a gradual falloff since then in both grades. For 8th graders there has been some decline in disapproval of trying inhalants since 2012. Since 2013 it has dropped among 10th graders as well, including significant declines in 2015 and a continuing decline in 2016. Availability Respondents have not been asked about the availability
  • 52. of inhalants, because we assume that these products are universally available to young people in these age ranges. 15 Inhalants: Trends in Annual Use, Risk, and Disapproval Grades 8, 10, 12 Source. The Monitoring the Future study, the University of Michigan. Use % who used in last 12 months Risk % seeing "great risk" in using once or twice Disapproval % disapproving of using once or twice Availability % saying "fairly easy" or "very easy" to get P E R C E N T
  • 53. 0 6 12 18 24 30 YEAR '74 '76 '78 '80 '82 '84 '86 '88 '90 '92 '94 '96 '98 '00 '02 '04 '06 '08 '10 '12 '14 '16 8th Grade 10th Grade 12th Grade P E R C E N T 0 20
  • 54. 40 60 80 100 YEAR '74 '76 '78 '80 '82 '84 '86 '88 '90 '92 '94 '96 '98 '00 '02 '04 '06 '08 '10 '12 '14 '16 P E R C E N T 0 20 40 60 80 100
  • 55. YEAR '74 '76 '78 '80 '82 '84 '86 '88 '90 '92 '94 '96 '98 '00 '02 '04 '06 '08 '10 '12 '14 '16 P E R C E N T 0 20 40 60 80 100 YEAR '74 '76 '78 '80 '82 '84 '86 '88 '90 '92 '94 '96 '98 '00 '02 '04 '06 '08 '10 '12 '14 '16 (no data)
  • 56. 16 LSD For some years, LSD was the most widely used drug within the larger class of hallucinogens. This was no longer true for some following years, due to sharp decreases in its use combined with an increasing use of psilocybin. (Statistics on overall hallucinogen use and on use of hallucinogens other than LSD are shown in the tables at the end of this report.) Now overall hallucinogen use and use of hallucinogens other than LSD are about equivalent due to a drop in the use of the other hallucinogens. Trends in Use Annual prevalence of LSD use among 12th graders has been below 10% since MTF began. Use declined some for the first 10 years among 12th graders, likely continuing a decline that had begun before 1975. Use was fairly level in the latter half of the 1980s but, as was true for a number of other drugs, rose in all three grades between 1991 and 1996. Between 1996 and 2006 or so, use declined in all three grades, with particularly sharp declines between 2001 and 2003. Since then use has remained at very low levels although there has been a slight increase in the upper grades since 2013. Perceived Risk We think it likely that perceived risk for LSD use increased during the early 1970s, before MTF began, as concerns grew about possible neurological and genetic effects (most of which were never scientifically
  • 57. confirmed) as well as “bad trips” and “flashbacks.” However, there was some decline in perceived risk in the late 1970s, after which it remained fairly level among 12th graders through most of the 1980s. A substantial decline occurred in all grades in the early 1990s as use rose. Since about 2000, perceived risk declined steadily and substantially among 8th graders until 2007, when it leveled; it declined considerably among 10th graders before leveling around 2002, dropping through 2007, and then leveling after that. Among 12th graders, perceived risk has held fairly steady after 2002, at least until 2014 when some decline began. The decline in the lower grades suggests that younger teens may be less knowledgeable about this drug’s effects than their predecessors—through what we have called “generational forgetting”— making them vulnerable to a resurgence in use. (The percentages who respond “can’t say, drug unfamiliar” to questions about LSD have risen in recent years, consistent with the notion of “generational forgetting.”) The decline of LSD use in recent years, despite a fall in perceived risk, suggests that some factors other than a change in underlying attitudes and beliefs were contributing to the downturn—prior to 2001 some displacement by ecstasy may have been a factor, while more recently a decline in availability (discussed below) likely is a factor. Disapproval Disapproval of LSD use was quite high among 12th graders through most of the 1980s but began to decline after 1991 along with perceived risk. All three grades exhibited a decline in disapproval through 1996, with
  • 58. disapproval of experimentation dropping 11 percentage points between 1991 and 1996 among 12th graders. After 1996 a slight increase in disapproval emerged among 12th graders, accompanied by a leveling among 10th graders and some further decline among 8th graders. Since 2001, disapproval of LSD use has diverged among the three grades, declining considerably among 8th graders, declining less among 10th graders, and increasing significantly among 12th graders. Note, however, that the percentages of 8th and 10th graders who respond with “can’t say, drug unfamiliar” increased through 2008; thus the base for disapproval has shrunk, suggesting that the real decline of disapproval among the younger students is less than it appears here. There has been rather little change in disapproval over the past eight years (or more years in the case of 12th graders.) Availability Reported availability of LSD by 12th graders fell considerably from 1975 to 1979, declined a bit further until 1986, and then began a substantial rise, reaching a peak in 1995. LSD availability also rose somewhat among 8th and 10th graders in the early 1990s, reaching a peak in 1995 or 1996. Since those peak years, there has been considerable falloff in availability in all three grades, quite possibly in part because fewer students have LSD-using friends from whom they could gain access. There was also very likely a decrease in supply due to the closing of a major LSD-producing lab by the Drug Enforcement Administration in 2000. It is clear that attitudinal changes cannot explain the recent declines in use. 17
  • 59. LSD: Trends in Annual Use, Risk, Disapproval, and Availability Grades 8, 10, 12 Source. The Monitoring the Future study, the University of Michigan. Use % who used in last 12 months Risk % seeing "great risk" in using once or twice Disapproval % disapproving of using once or twice Availability % saying "fairly easy" or "very easy" to get P E R C E N T 0 6
  • 60. 12 18 24 30 YEAR '74 '76 '78 '80 '82 '84 '86 '88 '90 '92 '94 '96 '98 '00 '02 '04 '06 '08 '10 '12 '14 '16 8th Grade 10th Grade 12th Grade P E R C E N T 0 20 40 60
  • 61. 80 100 YEAR '74 '76 '78 '80 '82 '84 '86 '88 '90 '92 '94 '96 '98 '00 '02 '04 '06 '08 '10 '12 '14 '16 P E R C E N T 0 20 40 60 80 100 YEAR '74 '76 '78 '80 '82 '84 '86 '88 '90 '92 '94 '96 '98 '00 '02 '04 '06 '08 '10 '12 '14 '16
  • 62. P E R C E N T 0 20 40 60 80 100 YEAR '74 '76 '78 '80 '82 '84 '86 '88 '90 '92 '94 '96 '98 '00 '02 '04 '06 '08 '10 '12 '14 '16 18 Cocaine Cocaine was used almost exclusively in powder form
  • 63. for some years, though “freebasing” emerged for a while. The early 1980s brought the advent of crack cocaine. Our original questions did not distinguish among different forms of cocaine or modes of administration. Since 1987, though, we have asked separate questions about the use of crack and “cocaine other than crack,” which has consisted almost entirely of powder cocaine use. Data on cocaine use in general (i. e., all forms of cocaine) are presented in the figures in this section, and results for crack alone are presented in the next section. Trends in Use There have been some important changes in the levels of overall cocaine use over the life of MTF. Use among 12th graders originally burgeoned in the late 1970s and remained fairly stable through the first half of the 1980s before starting a precipitous decline after 1986. Annual prevalence among 12th graders dropped by about three quarters between 1986 and 1992. Between 1992 and 1999, use reversed course again during the relapse phase of the overall drug epidemic and doubled before declining by 2000. Use also rose among 8th and 10th graders after 1992 before reaching peak levels in 1998 and 1999. Over the last sixteen years, use has declined in all three grades; annual 12th-grade use stands at a historic low of just 2.3% in 2016, with use by 8th and 10th graders still lower, at 0.8% and 1.3%. Perceived Risk Questions about the dangers of cocaine in general (without specifying any particular form of cocaine) have been asked only of 12th graders. The results tell a fascinating story. They show that perceived risk for experimental use fell in the latter half of the 1970s (when use was rising), stayed level in the first half of
  • 64. the 1980s (when use was level), and then jumped very sharply in a single year (by 14 percentage points between 1986 and 1987), just when the substantial decline in use began. The year 1986 was marked by a national media frenzy over crack cocaine and also by the widely publicized cocaine-related death of Len Bias, a National Basketball Association first-round draft pick. Bias’ death was originally reported as resulting from his first experience with cocaine. Though that was later proven to be incorrect, the 11Among 12th graders trends in perceived risk in Table 8 show a particularly sharp rise from 34% in 1986 to 48% in 1987 for trying cocaine once or twice. message had already “taken.” We believe that this event helped to persuade many young people that use of cocaine at any level is dangerous, no matter how healthy the individual.11 Perceived risk continued to rise through 1991 as the fall in use continued. Perceived risk declined modestly from 1991 to 2000, and use rose from 1992–2000. Perceived risk has leveled in recent years at far higher levels than existed prior to 1987, and there was a gradual upward drift for about six years in grades 8 and 10, before leveling. For the 12th graders perceived risk also increased for about six years before leveling after 2013. There is as yet little evidence of generational forgetting of cocaine’s risks. For 12th graders, survey questions on both risk and disapproval referred to cocaine in general, until 1986. After that they referred to cocaine powder and crack separately, as did the questions asked of 8th and 10th graders. The question change seemed to matter rather little in the results.
  • 65. Disapproval Disapproval of cocaine use by 12th graders followed a cross-time pattern similar to that for perceived risk, although its seven-percentage-point jump in 1987 was not quite as pronounced. Some decline from 1991 to 1997 was followed by a period of stability. Subsequent years showed a gradual increase in disapproval in all three grades. This upward drift ended in recent years, but disapproval of even trying cocaine remains very high and is above 85% in all grades in 2016. Availability The proportion of 12th graders saying that it would be “fairly easy” or “very easy” for them to get cocaine if they wanted some was 33% in 1977, rose to 48% by 1980 as use rose, and held fairly level through 1982; it increased steadily to 59% by 1989 (in a period of rapidly declining use). Perceived availability then fell back to about 47% by 1994. Since around 1997, perceived availability of cocaine has fallen considerably in all three grades. Among 12th graders it stood at 29% in 2016—about half of its peak level in 1989. Note that the pattern of change does not map well onto the pattern of actual use, suggesting that changes in overall availability have not been a major determinant of use—particularly during the sharp decline in use in the late 1980s. 19 Cocaine (including Crack): Trends in Annual Use, Risk, Disapproval, and Availability
  • 66. Grades 8, 10, 12 Source. The Monitoring the Future study, the University of Michigan. *Prior to 1991, data reported here is based on questions on use of cocaine in general. Starting in 1991, data based on questions on use of cocaine powder specifically. Use % who used in last 12 months Risk* % seeing "great risk" in using once or twice Disapproval* % disapproving of using once or twice Availability* % saying "fairly easy" or "very easy" to get P E R C E N T 0 4 8
  • 67. 12 16 20 YEAR '74 '76 '78 '80 '82 '84 '86 '88 '90 '92 '94 '96 '98 '00 '02 '04 '06 '08 '10 '12 '14 '16 8th Grade 10th Grade 12th Grade P E R C E N T 0 20 40 60 80
  • 68. 100 YEAR '74 '76 '78 '80 '82 '84 '86 '88 '90 '92 '94 '96 '98 '00 '02 '04 '06 '08 '10 '12 '14 '16 P E R C E N T 0 20 40 60 80 100 YEAR '74 '76 '78 '80 '82 '84 '86 '88 '90 '92 '94 '96 '98 '00 '02 '04 '06 '08 '10 '12 '14 '16
  • 69. P E R C E N T 0 20 40 60 80 100 YEAR '74 '76 '78 '80 '82 '84 '86 '88 '90 '92 '94 '96 '98 '00 '02 '04 '06 '08 '10 '12 '14 '16 20 Crack Several indirect indicators suggest that crack use grew rapidly in the period 1983–1986, beginning before we
  • 70. had direct measures of its use. In 1986 a single usage question was included in one of the five 12th-grade questionnaire forms, asking those who indicated any cocaine use in the prior 12 months if they had used crack. The results from that question represent the first data point in the first panel on the facing page. After that, three questions about crack use covering the usual three prevalence periods were introduced into several questionnaire forms. Trends in Use Clearly crack use rose rapidly in the early 1980s, judging by the 4% annual prevalence reached in 1986; but after 1986 there was a precipitous drop in crack use among 12th graders; the drop continued through 1991. After 1991 for 8th and 10th graders (when data were first available) and after 1993 for 12th graders, all three grades showed a slow, steady increase in use through 1998 during the relapse phase of the overall drug epidemic. Since 1999, annual prevalence dropped by about 75% in 8th grade, 82% in 10th grade, and 70% in 12th grade. Today use of crack is at historic lows in all three grades. As with many drugs, the decline at 12th grade lagged behind those in the lower grades due to a cohort effect. Perceived Risk By the time we added questions about the perceived risk of using crack in 1987, crack was already seen by 12th graders as one of the most dangerous illicit drugs: 57% saw a great risk in even trying it. This compared to 54% for heroin, for example. Perceived risk for crack rose still higher through 1990, reaching 64% of 12th graders who said they thought there was a great risk in taking crack once or twice. (Use was dropping during that interval.) After 1990 some falloff in
  • 71. perceived risk began, well before crack use began to increase in 1994, making perceived risk again a leading indicator. Between 1991 and 1998 there was a considerable falloff in this belief in grades 8 and 10, as use rose steadily. Perceived risk leveled in 2000 in grades 8 and 12 and a year later in grade 10. We think that the declines in perceived risk for crack and cocaine during the 1990s may well reflect an example of generational forgetting wherein the class cohorts that were in adolescence when the adverse consequences were most obvious (i.e., in the mid-1980s) were replaced by cohorts who were less knowledgeable about the dangers. By 2016 perceived risk for crack had leveled in all three grades. Disapproval Disapproval of crack use was not assessed until 1990, when it was at a very high level, with 92% of 12th graders saying that they disapproved of even trying it. Disapproval of crack use declined slightly but steadily in all three grades from 1991 through about 1997. After 1997, disapproval in all three grades rose back to high levels by 2012 before beginning a slight decline. Availability Crack availability did not change dramatically in the early years for which data are available. It began a sustained decline after 1995 among 8th graders, after 1999 among 10th graders, and after 2000 among 12th graders. Since 2000, availability has declined considerably, particularly in the upper grades. NOTE: The distinction between crack cocaine and other forms of cocaine (mostly powder) was made several years after the study’s inception. The figures on
  • 72. the facing page begin their trend lines when these distinctions were introduced. Figures are not presented here for the “other forms of cocaine” measures, simply because the trend curves look extremely similar to those for crack. (All statistics are contained in the tables presented later.) Although the trends are very similar, the absolute levels of use, risk, etc., are somewhat different. Usage levels tend to be higher for cocaine powder compared to crack, and the levels of perceived risk a bit lower, while disapproval has been close for the two different forms of cocaine and relative availability has varied (Tables 15 through 17). 21 Crack: Trends in Annual Use, Risk, Disapproval, and Availability Grades 8, 10, 12 Source. The Monitoring the Future study, the University of Michigan. Use % who used in last 12 months Risk % seeing "great risk" in using once or twice Disapproval % disapproving of using once or twice Availability % saying "fairly easy" or "very easy" to get
  • 73. P E R C E N T 0 2 4 6 8 10 YEAR '74 '76 '78 '80 '82 '84 '86 '88 '90 '92 '94 '96 '98 '00 '02 '04 '06 '08 '10 '12 '14 '16 8th Grade 10th Grade 12th Grade P E
  • 74. R C E N T 0 20 40 60 80 100 YEAR '74 '76 '78 '80 '82 '84 '86 '88 '90 '92 '94 '96 '98 '00 '02 '04 '06 '08 '10 '12 '14 '16 P E R C E N T
  • 75. 0 20 40 60 80 100 YEAR '74 '76 '78 '80 '82 '84 '86 '88 '90 '92 '94 '96 '98 '00 '02 '04 '06 '08 '10 '12 '14 '16 P E R C E N T 0 20 40 60
  • 76. 80 100 YEAR '74 '76 '78 '80 '82 '84 '86 '88 '90 '92 '94 '96 '98 '00 '02 '04 '06 '08 '10 '12 '14 '16 22 Amphetamines and Other Stimulant Drugs Amphetamines, a class of psychotherapeutic stim- ulants, had a relatively high prevalence of use in the youth population for many years. The behavior reported here excludes any use under medical supervision. Amphetamines are controlled sub- stances—they are not legally bought or sold without a doctor’s prescription—but some are diverted from legitimate channels, and some are manufactured and/or imported illegally. There are other controlled stimulants that are also included, like Ritalin which is used to treat ADHD, as is Adderall, the most prevalent of the amphetamines. Trends in Use The use of these stimulants rose in the last half of the 1970s, reaching a peak in annual prevalence of 26% in 1981 (likely exaggerated due to commonly used “look- alikes”)—two years after marijuana use peaked. From 1981 to 1992, 12th graders reported a steady and very substantial decline in their use, reaching 7%.
  • 77. As with many other illicit drugs, these stimulants made a comeback in the 1990s. Use peaked in the lower two grades by 1996. Since then, use declined steadily in 8th grade and sporadically in 10th grade. Only after 2002 did it begin to decline in 12th grade. The decline paused in 2008 for 8th graders and 2009/2010 for 12th graders, and then resumed. The 12th-grade decline began in 2003 but reversed from 2009 to 2013. In 2013 the amphetamines/stimulants prevalence question text was changed in half of the questionnaire forms. The 2013 report used data from the changed forms only, to be comparable to the 2014 measure. In 2014 the remaining forms were changed; the 2014 and subsequent data presented here are for all the forms. From 2009 to 2013 use rose in the upper grades, likely due to use intended to assist with academic performance. Since 2013 there has been a downward drift in annual prevalence but a steeper decline in 30- day prevalence (significant in the upper grades). See Table 6 for the trends in annual use of two specific amphetamines—Ritalin and Adderall. Since it was first measured in 2001, Ritalin use has declined by 70% to 80% in all three grades. Adderall use declined in the lower grades since it was first measured in 2009; but annual prevalence increased significantly in 12th grade between 2009 (5.4%) and 2013 (7.4%) where it remained in 2015 before falling to 6.2% in 2016. Perceived Risk Only 12th graders are asked about the amount of risk they associate with amphetamine/stimulant use. For a few years, changes in perceived risk were not correlated with changes in usage levels (at the aggregate level). Specifically, in the interval 1981– 1986, risk was quite stable even though use fell
  • 78. considerably, likely as a result of some displacement by increasing cocaine use. There was, however, a decrease in risk during the period 1975–1981 (when use was rising), some increase in perceived risk in 1986–1991 (when use was falling), and some decline in perceived risk from 1991 to 1995 (in advance of use rising again). Perceived risk has generally been rising in recent years, very likely contributing to the decline in use that occurred among 12th graders after 2002; it appears to have leveled after 2007. In 2011 the examples of specific amphetamines provided in the text of the questions on perceived risk, disapproval, and availability were updated with the inclusion of Adderall and Ritalin. This led to some discontinuities in the trend lines in 2011. (Levels of perceived risk and disapproval lowered as a result.) Based on the revised question, some decline has occurred since 2013. Disapproval Disapproval of amphetamine/stimulant use is asked in 12th grade only. Relatively high proportions of 12th graders have disapproved of even trying amphetamines/stimulants throughout the life of the study. Disapproval did not change in the late 1970s despite an increase in use. From 1981 to 1992, disapproval rose gradually and substantially from 71% to 87% as perceived risk rose and use declined. In the mid-1990s disapproval declined along with perceived risk, but it increased fairly steadily from 1996 through 2009 before leveling. There has been a slight falloff since 2013. Availability In 1975, amphetamines/stimulants had a high level of reported availability. The level fell by about 10 percentage points by 1977, drifted up a bit through
  • 79. 1980, jumped sharply in 1981, and then began a long, gradual decline through 1991. There was a modest increase in availability at all three grade levels in the early 1990s as use rose, followed by a long-term decline which continued through 2016. 23 Amphetamines: Trends in Annual Use, Risk, Disapproval, and Availability Grades 8, 10, 12 Source. The Monitoring the Future study, the University of Michigan. *In 2013 the question text was changed on two of the questionnaire forms for 8th and 10th graders and four of the questionnaire forms for 12th graders, and changed on the remaining forms in 2014. Beginning in 2013, data presented here include only the changed forms. **In 2011 the list of examples was changed from uppers, pep pills, bennies, speed to uppers, speed, Adderall, Ritalin, etc. These changes likely explain the discontinuity in the 2011 results. Use* % who used in last 12 months Risk** % seeing "great risk" in using once or twice Disapproval** % disapproving of using once or twice
  • 80. Availability** % saying "fairly easy" or "very easy" to get P E R C E N T 0 10 20 30 40 50 YEAR '74 '76 '78 '80 '82 '84 '86 '88 '90 '92 '94 '96 '98 '00 '02 '04 '06 '08 '10 '12 '14 '16 8th Grade 10th Grade 12th Grade P
  • 81. E R C E N T 0 20 40 60 80 100 YEAR '74 '76 '78 '80 '82 '84 '86 '88 '90 '92 '94 '96 '98 '00 '02 '04 '06 '08 '10 '12 '14 '16 P E R C E N
  • 82. T 0 20 40 60 80 100 YEAR '74 '76 '78 '80 '82 '84 '86 '88 '90 '92 '94 '96 '98 '00 '02 '04 '06 '08 '10 '12 '14 '16 P E R C E N T 0 20 40
  • 83. 60 80 100 YEAR '74 '76 '78 '80 '82 '84 '86 '88 '90 '92 '94 '96 '98 '00 '02 '04 '06 '08 '10 '12 '14 '16 24 Methamphetamine and Crystal Methamphetamine (Ice) One subclass of amphetamines is called meth- amphetamine (“speed”). This subclass has been around for a long time and gave rise to the phrase “speed kills” in the 1960s. Probably because of the reputation it got at that time as a particularly dangerous drug, it was not popular for some years, so we did not include a full set of questions about its use in MTF’s early questionnaires. One form of methamphetamine, crystal methamphetamine or “ice,” grew in popularity in the 1980s. It comes in crystallized form, as the name implies, and the chunks can be heated and the fumes inhaled, much like crack cocaine. Trends in Use For most of the life of the study, the only question about methamphetamine use has been contained in one of the six 12th-grade questionnaire forms. Respondents who indicated using any type of amphetamines in the prior 12 months were asked in a
  • 84. sequel question to indicate on a pre-specified list the types they had used during that period. Methamphetamine was one type on the list, and data exist on its use since 1976. (The rates are not graphed here until 1990.) In 1976, annual prevalence using this measure was 1.9%; it then roughly doubled to 3.7% by 1981 (the peak year), before declining for over a decade all the way down to 0.4% by 1992. Use then rose again in the mid-1990s, as did use of a number of drugs, reaching 1.3% by 1998. In other words, it has followed a cross-time trajectory fairly similar to that for amphetamines as a whole. No questions have yet been added to the study on perceived risk, disapproval, or availability with regard to overall methamphetamine use. In 1990, in the 12th-grade questionnaires only, we introduced our usual set of three questions for crystal methamphetamine, measuring lifetime, annual, and 30-day use. Among 12th graders in 1990, 1.3% indicated any use in the prior year; use climbed to 3.0% by 1998, and has generally been declining since then, reaching an all-time low of 0.5% in 2015 and then 0.8% in 2016. This variable is charted on the first panel of the facing page. Responding to the growing concern about meth- amphetamine use in general—not just crystal methamphetamine use—we added a full set of three questions about the use of any methamphetamine to the 1999 questionnaires for all three grade levels. These questions yield a somewhat higher annual prevalence for 12th graders: 4.3% in 2000, compared to the sum of the methamphetamine and crystal methamphetamine answers in the other, branching question format, which
  • 85. totaled 2.8%. It would appear, then, that the long-term method we had been using for tracking methamphetamine use probably yielded an understatement of the absolute prevalence level, perhaps because some proportion of methamphetamine users did not correctly categorize themselves initially as amphetamine users (even though methamphetamine was given as one of the examples of amphetamines). We think it likely that the shape of the trend curve was not distorted, however. The newer questions for methamphetamine (not graphed here) show annual prevalence rates in 2016 of 0.4% for both 8th and 10th graders, and 0.6% for 12th graders. In every grade, 2016 prevalence is at the lowest level ever recorded by the survey. The 2016 levels for all three grades are down considerably from the first measurement taken in 1999, when they were 3.2%, 4.6%, and 4.7% (see Table 6). So, despite growing public concern about the methamphetamine problem in the United States, use actually has shown a fairly steady and substantial decline since 1999, at least among secondary school students. (A similar decline in methamphetamine use did not begin to appear among college students and young adults generally until after 2004, likely reflecting a cohort effect. See Volume II in this series for data on adults through age 55.) Other Measures Data on perceived risk and availability for crystal methamphetamine, specifically, may be found on the facing page. Clearly, the perceived risk of crystal methamphetamine use has risen considerably since 2003, very likely explaining much of the decline in use
  • 86. since then. Perceived risk then leveled after 2013. Perceived availability generally has been falling in all three grades since 2006, perhaps in part because there are many fewer crystal methamphetamine users from whom to gain access. 25 Crystal Methamphetamine (Ice): Trends in Annual Use, Risk, and Availability Grades 8, 10, 12 Source. The Monitoring the Future study, the University of Michigan. Use % who used in last 12 months Risk % seeing "great risk" in using once or twice Disapproval % disapproving of using once or twice Availability % saying "fairly easy" or "very easy" to get P E R C E
  • 87. N T 0 2 4 6 8 10 YEAR '74 '76 '78 '80 '82 '84 '86 '88 '90 '92 '94 '96 '98 '00 '02 '04 '06 '08 '10 '12 '14 '16 8th Grade 10th Grade 12th Grade P E R C E N T
  • 88. 0 20 40 60 80 100 YEAR '74 '76 '78 '80 '82 '84 '86 '88 '90 '92 '94 '96 '98 '00 '02 '04 '06 '08 '10 '12 '14 '16 P E R C E N T 0 20 40 60
  • 89. 80 100 YEAR '74 '76 '78 '80 '82 '84 '86 '88 '90 '92 '94 '96 '98 '00 '02 '04 '06 '08 '10 '12 '14 '16 (no data) P E R C E N T 0 20 40 60 80 100 YEAR
  • 90. '74 '76 '78 '80 '82 '84 '86 '88 '90 '92 '94 '96 '98 '00 '02 '04 '06 '08 '10 '12 '14 '16 26 Heroin For many decades, heroin—a derivative of opium—was administered primarily by injection into a vein. However, in the 1990s the purity of available heroin reached very high levels, making other modes of administration (e.g., snorting, smoking) practical alternatives. Thus, in 1995 we introduced questions that asked separately about using heroin with and without a needle to determine whether non-injection use explained the upsurge in heroin use we observed. The usage statistics presented on the facing page are based on heroin use by any method, but data on the two specific types of administration are provided in the tables at the end of this report. Trends in Use The annual prevalence of heroin use among 12th graders fell by half between 1975 and 1979, from 1.0% to 0.5%. The rate then held amazingly steady until 1994. Use rose in the mid- and late-1990s, along with the use of most drugs; it reached peak levels in 1996 among 8th graders (1.6%), in 1997 among 10th graders (1.4%), and in 2000 among 12th graders (1.5%), suggesting a cohort effect. Following those peak levels, use declined, with annual prevalence in all three grades fluctuating between 0.7% and 0.9% from 2005 through 2010. Since then, annual prevalence in the three grades combined has declined, from 0.8% to 0.3% in 2016. In 2016, use reached its lowest levels since 1991 in all three grades (0.3% in each).
  • 91. Because the questions about use with and without a needle were not introduced until the 1995 survey, they did not encompass much of the period of increasing heroin use. Responses to the new questions showed that, by then, about equal proportions of all 8th-grade users were taking heroin by each method of ingestion and some—nearly a third of users—were using both means. At 10th grade, a somewhat higher proportion of all users took heroin without a needle, and at 12th grade, the proportion was higher still. Much of the increase in overall heroin use after 1995 occurred in the proportions using it without injecting, which we strongly suspect was true in the immediately preceding period of increase as well. Likewise, much of the decrease since the recent peak levels has been due to decreasing use of heroin without a needle. In 2012, there were significant decreases in use of heroin without a needle for 8th and 12th graders, and very slight declines since then in 8th and 10th grades. Use with a needle has fallen considerably in all three grades since the mid-1990s; annual prevalence in 2016 stood at 0.2%, 0.3%, and 0.3%, respectively, including significant declines in 8th and 10th grades from the 2014 to 2015 prevalence levels, but no further change in 2016. The proportional declines were greatest in the lower grades. While a heroin epidemic continues among adults, our data—as well as those from NSDUH—suggest that use has grown primarily among young adults and not among adolescents. Perceived Risk Students have long seen heroin to be one of the most dangerous drugs, which helps to account for both the consistently high level of personal disapproval of use (see
  • 92. below) and the quite low prevalence of use. Nevertheless, perceived risk levels have changed some over the years. Between 1975 and 1986, perceived risk gradually declined, even though use dropped and then stabilized in that interval. Then there was a big spike in 1987 (when perceived risk for cocaine also jumped dramatically), where it held for four years. In 1992, perceived risk dropped to a lower plateau again, presaging an increase in use a year or two later. Perceived risk rose in the latter half of the 1990s, and use leveled off and then declined. Risk at 12th grade is still rising, but has been level for some time at 8th and 10th grades. Perceived risk of use without a needle rose in 8th and 10th grades between 1995 and 1997, foretelling an end to the increase in that form of use. Note that perceived risk has served as a leading indicator of use for this drug as well as a number of others. During the 2000s, perceived risk was relatively stable. Disapproval There has been little fluctuation in the very high levels of disapproval of heroin use over the years, though it did rise gradually between 2000 and 2010. The small changes that have occurred have been generally consistent with changes in perceived risk and use. Availability The proportion of 12th-grade students saying they could get heroin fairly easily if they wanted some remained around 20% through the mid-1980s. It then increased considerably from 1986 to 1992 before stabilizing at about 35% from 1992 through 1998. From the mid- to late-1990s through 2014, perceived availability of heroin declined gradually but substantially in all three grades before leveling in 2014 or 2015. 2727
  • 93. Heroin : Trends in Annual Use, Risk, Disapproval, and Availability Grades 8, 10, 12 Source. The Monitoring the Future study, the University of Michigan. *Prior to 1995, the questions asked about heroin use in general. Since 1995, the questions have asked about heroin use without a needle. Use % who used in last 12 months Risk* % seeing "great risk" in using once or twice Disapproval* % disapproving of using once or twice Availability % saying "fairly easy" or "very easy" to get P E R C E N T
  • 94. 0 1 2 3 4 5 YEAR '74 '76 '78 '80 '82 '84 '86 '88 '90 '92 '94 '96 '98 '00 '02 '04 '06 '08 '10 '12 '14 '16 8th Grade 10th Grade 12th Grade P E R C E N T 0 20
  • 95. 40 60 80 100 YEAR '74 '76 '78 '80 '82 '84 '86 '88 '90 '92 '94 '96 '98 '00 '02 '04 '06 '08 '10 '12 '14 '16 P E R C E N T 0 20 40 60 80 100
  • 96. YEAR '74 '76 '78 '80 '82 '84 '86 '88 '90 '92 '94 '96 '98 '00 '02 '04 '06 '08 '10 '12 '14 '16 P E R C E N T 0 20 40 60 80 100 YEAR '74 '76 '78 '80 '82 '84 '86 '88 '90 '92 '94 '96 '98 '00 '02 '04 '06 '08 '10 '12 '14 '16 28
  • 97. Other Narcotic Drugs, Including OxyContin and Vicodin There are a number of narcotic drugs other than heroin— all controlled substances. Many are analgesics that can be prescribed by physicians and dentists for pain. Like heroin, many are derived from opium, but there are also a number of synthetic analogues in use today, with OxyContin and Vicodin being two of the major ones. Throughout the life of the MTF study, we have asked about the use of any narcotic drug other than heroin without specifying which one. Examples of drugs in the class are provided in the question stem. In one of the six 12th-grade questionnaire forms, however, respondents indicating that they had used any narcotic in the past 12 months were then asked to check which of a fairly long list of such drugs they used. Table E-4 in Appendix E of Volume I of this annual monograph series provides trends in their annual prevalence data. In the late 1970s, opium and codeine were among the narcotics most widely used. In recent years Vicodin, codeine, Percocet, OxyContin, and hydrocodone have been the most prevalent. Trends in Use Use is reported for 12th graders only, because we considered the data from 8th and 10th graders to be of questionable validity. As shown in the first panel of the facing page, 12th graders’ use of narcotics other than heroin generally trended down from about 1977 through 1992, dropping considerably. After 1992 use rose rather steeply as all forms of substance use were increasing, with annual prevalence nearly tripling from 3.3% in 1992 to 9.5% in 2004, before leveling through about 2009. Since then, use has been declining, particularly since 2009.
  • 98. In 2002, the question was revised to add Vicodin, OxyContin, and Percocet to the examples given, which clearly had the effect of increasing reported prevalence, as may be seen in the first panel on the facing page. So the extent of the increase over the full time span likely is exaggerated, although probably not by much, because these drugs came onto the scene later, during the rise. They simply were not being fully reported until the late 1990s. Narcotics had become one of the most widely used classes of illicit drugs by 2004, when annual prevalence reached 9.5%. Use rates for two narcotics of recent interest—OxyContin and Vicodin—are presented in the second and third panels on the facing page, in a departure from the usual arrangement. There are no data for disapproval and only limited data on perceived risk (since 2012) for the two drugs, showing low and stable risk levels. OxyContin use increased some in all grades from 2002 (when it was first measured) through roughly 2009, though the trend lines have been irregular. Since 2009 or 2010, the prevalence rate has dropped in all grades. Annual prevalence in 2016 was 0.9%, 2.1%, and 3.4% in grades 8, 10, and 12, respectively. Use of Vicodin, on the other hand, remained fairly steady at somewhat higher levels from 2002—the first year it was measured—until 2009, after which it declined substantially in all grades. In 2016, annual prevalence rates continued to decline and were 0.8%, 1.7%, and 2.9% for 8th, 10th and 12th graders respectively. Availability Questions were asked about the availability of narcotics
  • 99. other than heroin, taken as a class. Perceived availability increased gradually among 12th graders for more than a decade (from 1978 through 1989), even as reported use was dropping. Perceived availability then rose further for another decade (from 1991 through 2001) as use rose quite sharply before leveling by about 2000 and then declining after 2006. In contrast, perceived availability had declined among 8th and 10th graders since the late 1990s. (In all three grades, a change in question wording in 2010 to include OxyContin and Vicodin as examples presumably accounts for the jump in reported availability that year.) Availability has declined further in all three grades since 2010. 29 http://www.monitoringthefuture.org/pubs/monographs/mtf- vol1_2015.pdf Narcotics other than Heroin and OxyContin and Vicodin Specifically: Trends in Annual Use and Availability Grades 8, 10, 12 Source. The Monitoring the Future study, the University of Michigan. *Beginning in 2002, a revised set of questions on other narcotics use was introduced in which Talwin, laudanum, and paregoric were replaced as examples given with Vicodin, OxyContin, and Percocet. **In 2010 the list of examples was changed from methadone, opium to Vicodin, OxyContin, Percocet, etc.