This document analyzes tax increment financing (TIF) debt in the United States between 2000-2013. It finds that TIF debt issuance grew steadily until peaking in 2006, but then declined sharply during and after the Great Recession. Total TIF debt issued was over $37 billion, with about 75% issued before the recession. California was historically the largest issuer of TIF debt but eliminated redevelopment agencies in 2011. The recession significantly limited how local governments structured and sold TIF debt due to constrained capital markets and increased risk aversion by investors.
N a tio n a l Tax J o u rn a l, S e p te m b e r2 0 1 4 , 6 7 .docx
1. N a tio n a l Tax J o u rn a l, S e p te m b e r2 0 1 4 , 6 7 (3), 6
7 5 - 6 9 6
TA X IN C R E M E N T D E B T F IN A N C E A N D
T H E G R E A T R E C E S S IO N
Martin J. Luby and Tima Moldogaziev
This paper explores U.S. local government debt finance
activities related to Tax
Increment Financing (T1F) between 2000 and 2013. We gather
comprehensive data
about debt that is serviced through TIF, document changes in
several variables
related to the amount, use, and structural features o f such debt,
and evaluate the
impact o f the Great Recession on these variables. Our results
indicate that the
Great Recession limited how local governments could sell and
structure TIF debt.
We suggest that these limitations were the result o f the limited
capital available
during and immediately after thefinancial crisis, structural
changes in the financial
industry caused by the financial crisis, and increased risk
aversion by investors.
Keywords: Tax Increment Financing (TIF), property tax,
economic development,
Great Recession
JEL Codes: H71
2. I. INTRODUCTION
By design, tax increment financing (TIF) involves a delay
between the redevelopment costs paid and the project benefits
received. Because o f the mismatch between the
time o f incurring development costs and the receipt o f benefits
o f greater property or
sales tax revenues associated with economic development, TIF
naturally lends itself to
the use o f debt finance. Over the last several decades, many
local governments have used
debt instruments to securitize future tax revenues in order to
pay for current costs related
to the economic development o f the TIF district (Johnson,
1999). Such securitization
often involves the selling o f securities in the U.S. municipal
bond market. However,
the financial crisis o f 2007-2008 greatly affected the use and
structure o f the municipal
securities market (Johnson, Luby, and Moldogaziev, 2014). In
addition, the financial
crisis deflated the value o f one o f the primary repayment
pledges o f these TIF securities
M a rtin J. Luby: School o f P ublic Service, DePaul U
niversity, and In s titu te fo r G o v e rn m e n t and P ublic
Affairs,
U niversity o f Illinois, C hicago, IL, USA (m lu b y l @
depau!.edu)
T im a M o ld o g a z ie v : S chool o f P u b lic & In te rn a tio
n a l Affairs, U n iv e rs ity o f G eorgia, A th e n s, GA, USA
(tim atm @ u g a .ed u )
3. 676 National Tax Journal
in most areas o f the United States, namely the local property
tax base. For example,
the city o f Louisville, Kentucky recently nearly defaulted on its
2006 TIF bonds sold
to finance the KFC Yum! Center. TIF property tax revenues in
2012 amounted to $3.5
million with the expectation just a few years earlier that the TIF
district would generate
$8.2 million to pay the principal and interest payments on the
bonds in 2012 (Boyd,
2013). It is likely that the Great Recession’s impact on property
values significantly
contributed to the shortfall between expected and realized TIF
revenues in Louisville.
Given the extensive use o f municipal securities to finance TIF
capital projects over
the last several decades and the changes in the municipal
securities market and local
property tax base as a result o f the recent financial crisis, this
paper explores the use of
TIF debt finance before and after the Great Recession (i.e.,
during the period 2000-2013).
We gather data about debt that is serviced through TIF and
document changes in sev-
eral variables related to the amount, use and structural features
of such debt, focusing
our analysis on the impact the Great Recession had on these
variables. We also offer a
brief discussion on the possible future o f TIF debt finance in
the post-Great Recession
world.
4. II. TIF DEBT FINANCE MECHANICS
Before presenting data on the entire TIF industry from 2000-
2013, this section o f the
paper briefly details the purpose and mechanics o f TIF debt
finance. Local governments
generally use TIF debt finance, which often entails the sale of
municipal securities, for
three reasons (Johnson, 1999). First, as mentioned above, the
sale o f municipal securi-
ties allows the local government to quickly raise a large amount
o f financial resources
for TIF redevelopment projects. In the absence o f municipal
bonds, the local govern-
ment would have to rely on loans from banks and/or developers
or to significantly
decelerate the pace o f the redevelopment projects to be in line
with annual increases
in the tax base. In addition, municipal securities are generally
tax-exempt so the local
government receives the benefit o f lower cost financing with
municipal securities vis-
a-vis bank or developer loans. Second, TIF debt allows
municipalities to circumvent
constitutional or statutory debt restrictions, since TIF bonds are
generally not subject to
general obligation bond debt limitations or public referendum
requirements (Johnson,
1999; Briffault, 2010). Thus, local governments can access
redevelopment resources
without seeking legislative and/or public approval. Finally, TIF
provides local govern-
ments an opportunity to raise off-balance sheet capital financing
since the issuer o f TIF
bonds, generally a redevelopment agency, is usually not
considered part of the general
5. government. This serves to preserve the local government’s
borrowing capacity for
future capital projects. In essence, the basic pros and cons o f
pay-as-you-go financing
versus pay-as-you-use financing are present in the decision to
use TIF debt finance.
Local governments sell TIF bonds in the national municipal
bond market. The prevail-
ing feature o f this market is tax exemption. That is, the interest
on municipal securities
is generally exempt from federal income taxation. However,
federal tax regulations
specify that in order to qualify for such tax exemption, at least
95 percent o f the TIF
bond proceeds must be used for redevelopment purposes in a
“blighted” area, the issuer
T a x I n c r e m e n t D e b t F in a n c e a n d t h e G r e a t
R e c e s s io n 677
must have a redevelopment plan, and the pledge o f repayment
must be from general
taxes o f the government or from incremental taxes associated
with the project (Johnson,
1999). If these conditions are not met, the local government will
incur higher interest
costs as it will have to sell the debt on a taxable rather than tax-
exempt basis. As it
relates to amortization structure, local governments sell the debt
with a bond structure
that approximates the expected size o f the future incremental
tax revenues associated
with the redevelopment. That is, the local government amortizes
6. the TIF bonds over a
time period during which incremental revenues are expected to
be sufficient to pay the
principal and interest payments on the debt.
In the parlance o f the municipal bond market, TIF bonds
essentially represent a hybrid
general obligation/revenue bond credit structure (Geheb, 2009).
TIF debt appears to be
general obligation in nature in that ad-valorem property taxes
often secure repayment
on the bonds. However, TIF debt also carries a revenue bond
feature in that there is a
specific, identifiable revenue repayment source (i.e., the
incremental tax revenues) that
would not exist in the absence o f the redevelopment project.
Moreover, redevelopment
agencies, rather than the general government, are often the
issuer o f the TIF debt just as
other types o f government authorities are often issuers of
revenue bonds. This hybrid
structure has raised some constitutional issues related to the
level o f responsibility that
the general government has in “making whole” TIF bond
investors in the event o f a
default (Geheb, 2009). In the past, local governments have sold
much (although not all)
o f their TIF debt using a revenue bond structure (Johnson,
1999).
III. T H E T IF M U N IC IPA L SECURITIES MARKET, 2 0 0
0 -2 0 1 3
In this section o f the paper we discuss the data — the trends,
use, and structure of
TIF debt securities issued between January 1,2000 and
7. December 3 1 ,2 0 1 3 — with an
emphasis on the impact o f the Great Recession. This covers
several years before and
after the financial crisis of 2007-2008, including the years
before and after the Great
Recession. The database includes a list o f all TIF debt
securities sold during this time
period ( N= 2,478) as well as a spectrum o f features o f these
bond transactions. The data
for this descriptive analysis come from the Securities Data
Corporation (SDC).' This is
a fee-for-service database company that collects information on
all municipal securities
sales. Our review considers TIF market trends, the issuers and
uses o f TIF securities,
and the structure o f TIF securities. As such, the analysis
provides a complete picture of
the TIF municipal securities market over the last 14 years for
the period January 2000
through December 2013. We assess the distribution o f TIF
securities issuance data for
goodness-of-fit using Pearson’s and log-likelihood Chi-squared
tests o f independence,
which test the likelihood o f whether the observed annual
distributions for variables of
interest in this study are due to chance or whether there are
significant shifts in their
annual distributions during the period under examination. The
tests compare the observed
distributions in the data to the expected distributions based on
the assumption that the
variables are independent. While these tests do not provide
evidence o f the direction o f
These data are available at http://thomsonreuters.com/sdc-
platinum/.
8. 678 N ational Tax Journal
association between the variables o f interest, in our case, they
provide evidence on the
probability o f independence between each o f our variables o f
interest and annual TIF
bond issuance activity in 39 U.S. states and the District o f
Columbia.
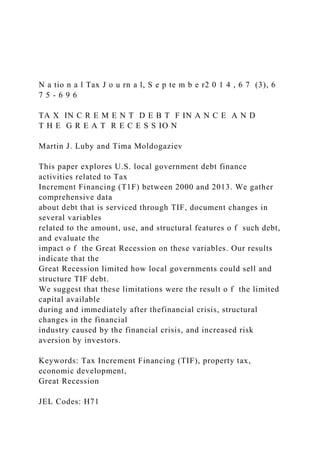
A. TIF M arket Trends
In the period, almost $37.6 billion in 2,478 separate TIF issues
were sold in the
municipal bond market. As seen Figure 1, the least TIF
issuance, both in terms o f
monetary volume and the number o f individual issues, was in
calendar year 2012. Only
65 TIF issues for a combined volume o f $449 million were
recorded in the municipal
market during that year. The largest volume o f TIF securities is
observed in 2006 with
almost $5 billion sold in 238 individual issues. Overall trends
show that TIF issuance
Figure 1
TIF Issuance Volume (SMillion) and Frequency in 39 U.S.
States and
the District o f Columbia, 2000-2013
6,000 300
5,000 250
9. = 4,000 200
3,000 150
~ 2,000 100
1,000 50
Year
SSSS! Frequency of TIF Issues ■ Grand Total
Source: Securities D ata C orpo ra tio n
T a x I n c r e m e n t D e b t F in a n c e a n d t h e G r e a t
R e c e s s io n 679
volume grew from under $2 billion in 2000 and 2001, to about
$2.7 billion in 2002, to
more than $4.8 billion in 2003, before declining to about $3.4
billion in 2004. In the
three years immediately before the Great Recession, years 2005,
2006, and 2007, TIF
issuance remained significantly above $4 billion. We find that
about 75 percent of all
TIF-related securities, more than $28 billion, were issued before
the Great Recession.
TIF volume, however, dropped dramatically during and after the
Great Recession.
Thus, in 2008 TIF issuance volume fell almost by half to about
$2.1 billion from the
pre-recession year’s level o f $4.2 billion. TIF volumes further
10. fell to about $1.5 billion
in 2009, climbed back to $ 1.8 and $2 billion in 2010 and 2011,
respectively, but shrunk
to less than half a billion in 2012. The TIF volume in 2013
appears to be about $1.5
billion. Only $9.5 billion was issued in TIF securities since the
Great Recession from
2008-2013. Consequently, it appears that there was a significant
decrease in TIF debt
activity in the municipal securities market since the Great
Recession. The volume o f
TIF bond sales decreased by 49 percent between 2007 and 2008
with every subsequent
year lower than the 2008 level, which suggests the detrimental
impact the financial crisis
may have had on the size o f the TIF bond market. Indeed, the
measures o f association
between the number o f TIF bond issues and the year o f
issuance provide evidence of
statistically significant changes in issuance trends in our sample
period. For the period
o f January 1, 2000 to December 31, 2013, Pearson’s Chi-
squared and log-likelihood
Chi-squared statistics are 818.1 and 730.1, respectively.
The State o f California has been the “market leader” in TIF
securities, except in 2012.
The dramatic decline in 2012 was a result of California’s
dissolution of its redevelopment
authorities in late 2011, which prohibited California local
governments from issuing any
new TIF bonds (Lefcoe and Swenson, 2014). California was a
pioneer in the use o f TIF
debt finance and was perennially the largest seller o f TIF bonds
prior to the elimination
in its redevelopment agencies. The steep drop between 2011 and
11. 2012 in the volume and
number of TIF transactions reflects this statutory change. In
2013 California returned as
the largest issuer o f TIF securities with 21 separate TIF issues
for a combined value of
$618 million. However, these municipal securities represented
refinancing o f existing
TIF securities, which were allowed under Assembly Bill 1484.
Refinancing of outstand-
ing TIF securities was allowable as long as the amount o f the
refinancing bond issue
was not greater than the amount o f refinanced bonds, and the
refinancing bond interest
costs were less than refinanced bond interest costs.2 In the
period under study, California
municipalities are directly responsible for over $25 billion in
TIF securities, which is
roughly about two-thirds o f the entire TIF activity in the
municipal securities market. A
total o f 59 municipal issuers from California appear to have
delivered at least $ 100 mil-
lion o f TIF securities each to the market, with the San Jose
City Redevelopment Agency
leading the way with almost $2.5 billion in 20 separate TIF
issues.
The data indicate a similar impact o f the Great Recession on
overall TIF debt finance
activity even if California is removed from the database. As
shown in Figure 2, the largest
2 County of Los Angeles Redevelopment Refunding Authority,
Tax Allocation Revenue Refunding Bonds,
Series 2013DEF, Official Statement, available at
http://emma.msrb.org/ER733654-ER569382-ER970689.pdf.
12. 680 N ational Tax Journal
F ig u re 2
TIF Issuance V olum e ($M illion) and Frequency 38 U.S. States
(Excluding
California) and th e D istrict o f C olum bia, 2000-2013
1,800
1,600
~ 1,400
C0
1 1,200
CD
§ 1,000
8 800 c
CO
I 600
LL
H 400
200
0
Year
Frequency of TIF Issues ■Grand Total
13. 180
160
140
120 |
=3
c r
<D
100 £
0)o
80 |
Uiu>
60 tfc I-
40
20
0
S o u rce : S e c u ritie s D a ta C o r p o r a tio n
and smallest volumes o f non-Califomia TIF issuance were in
2005 and 2012, respectively,
with a sharp decline in TIF transactions and volume between
2007 and 2008 and a steady
decline thereafter with an uptick in transaction frequency in
2013. Even after omitting
California issuers, the measures o f association between the
number o f TIF bond issues
and the year o f issuance provide evidence o f statistically
14. significant changes in issuance
trends in our sample period. For the period from 2000-2013,
Pearson’s Chi-squared
and log-likelihood Chi-squared statistics are 658.0 and 600.8,
respectively. Aside from
California, there are five states that have issued more than $ 1
billion each in TIF securi-
ties during the period under review. These states are Colorado,
Missouri, Minnesota,
Illinois, and Texas. In Figure 3, we depict aggregate annual
volumes in these top-five
TIF issuing states for 2000-2013. Though overall Colorado
leads the top-five list with
about $1.6 billion, its municipalities are the least frequent
market participants with only
41 separate TIF issues. Its biggest aggregate TIF issues o f $296
million and $266 million
Tax Increm ent Debt Finance and the Great Recession 681
682 N a tio n a l T a x J o u r n a l
are in 2004 and 2008, respectively. On the other hand,
Minnesota municipalities are the
most frequent TIF issuers with 410 separate TIF securities for a
combined volume of
$1.4 billion. Texas, Illinois, and Missouri appear to fall in
between Colorado and Min-
nesota in terms o f their transaction frequencies in the TIF
market.
B. Is s u e rs a n d U se s o f T IF S e c u r itie s
15. Not coincidentally, issuers from California dominate the TIF
market in the period.
O f the 10 largest issuers o f TIF securities (a combined volume
o f over $8 billion or
over 20 percent o f the entire industry in the period), eight are
in California. By far the
largest issuer o f TIFs in the US was the San Jose
Redevelopment Agency with almost
$2.5 billion in TIF securities (Table 1). The San Francisco City
& County Redevelop-
ment Agency issued over $1.1 billion during the same period.
Three remaining major
issuers in California were the Oakland Redevelopment Agency,
the San Diego Rede-
velopment Agency, and the Riverside County Public Finance
Authority — all with
TIF volumes exceeding $600 million. These top-5 issuers in
California accounted for
about 8 percent o f all TIFs in the state in 2001 and about 40
percent in 2009, with their
shares in other years falling somewhere between these extremes.
Nevertheless, despite
the continued activity in the TIF market by San Francisco City
& County-, Oakland-,
and San Diego Redevelopment Agencies since the Great
Recession, it is evident that
most o f the TIF activity for these top-5 California issuers
occurred before the Great
Recession.
As shown in Table 2, apart from California jurisdictions, the
Denver Urban Renewal
Authority is the largest issuer o f TIFs by volume in our sample.
It issued more than
$800 million in TIFs (or more than half o f all TIF securities
16. issued by Colorado
municipalities), with $171 million sold as recently as 2013.
Atlanta and Chicago are
next with $657 million (more than 96 percent o f TIF securities
in Georgia) and $476
million (over 37 percent o f the entire TIF issues in Illinois),
respectively. Minneapolis
and the Unified Government o f Wyandotte County & Kansas
City have sold $344 mil-
lion and $270 million in TIF securities each. These latter two
issuers accounted for a
significant fraction o f TIF securities from their states; about 26
percent for Minneapolis
and over 76 percent for Wyandotte County/Kansas City. The
Unified Government of
Wyandotte County & Kansas City has not returned to the TIF
market since 2005, how-
ever. When combined, these top-5 non-California issuers o f
TIF securities accounted
for about 2 percent o f all non-California issues in 2012, but
about 40 percent in
2000.
We classify the over thirty categories o f TIF debt uses
identified in the data into seven
broad categories. As Table 3 shows, general purpose/public
improvements are by far
the biggest share o f the TIF market in our sample with about
$20 billion in proceeds
(or about 53 percent o f all TIF volumes). Almost 80 percent o f
general purpose/public
improvements TIF securities were issued before the Great
Recession, however. Eco-
nomic development and industrial development TIFs are next in
volume. Over $13.5
billion were issued for these uses as TIF obligations. TIF
17. proceeds for these three major
T a x I n c r e m e n t D e b t F in a n c e a n d t h e G r e a t
R e c e s s io n 683
684 National Tax Journal
Tax Increm ent D ebt Finance and the Great Recession 685
686 N a tio n a l Tax J o u rn a l
uses accounted on average for 89 percent o f all TIF securities
in the m unicipal market.
The TIF m arket has thus been predom inantly a m arket for
general purpose/public
im provem ent and econom ic and industrial developm ent
projects.
The remaining annual volumes (on average roughly 11 percent o
f all TIF debt proceeds)
are used for transportation, housing, education and health, and
utilities, w ith housing,
both single and multifamily structures, adding up to more than
$2 billion. Transportation
uses, such as overland infrastructure, airports, and seaports,
accounted for more than
$1.6 billion o f TIF proceeds. Education TIFs, and to a lesser
extent healthcare related
18. uses, absorbed about $330 m illion o f debt proceeds. A very
small fraction o f the TIF
m arket ($ 184 m illion in our sample) is related to water,
sewer, and gas purposes, electric
and public pow er purposes, solid waste and recycling uses, as
well as hybrids o f these.
The economic development category generally shows a steady
decline in issuance
volume for the period from 2000 to the Great Recession period.
Increases in the general
purpose/public improvement category initially offset this
decline, but eventually decline
between 2007 and 2008. After 2008, the economic development
category increases while
the general purpose/public improvement category continues to
fall. W hile these category
names are somewhat generic (especially “general purpose/public
improvement”) and one
must use caution when drawing conclusions, the decline in
economic development TIF
bonds and the increase in general purpose/public improvement
TIF bonds suggests that
local governments no longer use TIF only for economic
development but also to finance
general governmental purposes. The uptick in economic
development bonds after 2009
and the decline in general purpose bonds may be the result o f
demands by municipal
bond investors for more specific details on the development
projects being financed rather
than loaning money for “general purpose projects” that are
financed by incremental tax
revenues. However, this conclusion is speculative and warrants
further systematic analysis.
19. A nother w ay to explore the use o f TIF proceeds is to look at
trends in the tax status
o f TIF securities. As stipulated in federal tax statute, typically
at least 95 percent o f the
use o f proceeds m ust be pledged for redevelopm ent purposes
in a “blighted” area to
attain tax exemption. Thus, analyzing the com position o f
bonds sold tax-exem pt versus
taxable m ay provide m ore insight into the purposes that local
governm ents have used
TIF debt, that is, w hether local governments have expanded
their use o f TIF debt finance
tools to fund redevelopm ent in non-blighted areas or not.
Figure 4 illustrates the volume
and percentage o f TIF bonds sold on a taxable basis. For m ost
years betw een 2000 and
2014, local governm ents consistently sold their TIF debt on a
tax-exem pt basis about
80 percent o f the tim e w ith the heaviest use o f taxable TIFs
in 2010, 2011, and 2013.
However, the overall volum es o f taxable bonds dropped dram
atically since the Great
Recession (i.e., taxable bond volum es in each year post-
recession w ere less than h a lf o f
the immediately pre-recession year levels). Private activity TIFs
generally are sponsored
by corporate sponsors and are alm ost always taxable securities.
However, during the
tim e period analyzed, only $347 m illion o f TIF issues (less
than 1 percent o f the entire
TIF market) were directly linked to corporate supporters as seen
in Figure 5. M ost o f
these were tied to pre-G reat R ecession years when private
funds w ere still relatively
abundant. Our data show that the frequencies o f issues for
taxable and corporate-backed
20. TIFs have decreased significantly, w ith P earson’s Chi-squared
and log-likelihood Chi-
squared statistics at 57.0 and 56.6 com pared to 17.8 and 17.6
respectively.
T ax I n c r e m e n t D e b t F in a n c e a n d t h e G r e a t
R e c e s s io n 687
C. Structure of TIF Securities
The overall volume o f TIFs has decreased since the Great
Recession and so did
average bond issue sizes. Mean bond sizes peaked in 2005-2007
and decreased
significantly by 2012 as reported in Figure 6. However, Figure
6 shows a larger
average bond size in 2013. Another typical measure o f bond
structure, length o f
maturity, is generally positively related to risk, with investors
demanding a higher
risk premium for longer term investments or generally deciding
to avoid longer-term
investments altogether in extreme circumstances. In this
context, one might expect
to see the average final maturity decline in the years after the
Great Recession as
TIF bonds became riskier in light of the financial crisis and its
effect on property
values. The results in Figure 7 show a decline in 2009, an
increase back to pre-recession
levels in 2010 and 2011, and then a significant decline in 2012
and 2013. However,
one needs to be careful in drawing any definitive conclusions
from final maturity data
21. without looking at times-to-call measures. As the measure o f
average years to call in
Figures 4 -7
Percentage o f Total TIF Issuance Volume and Select TIF
Features,
39 US States and the District o f Columbia, 2000-2013
30
25
P 20
CD
o 15
10o<D
CD
8 5
001
Figure 4 Taxable TIFs
i
1 :
ilI I
O CM ^ CD CO OO O O O O t-
O O O O O O
CM CM CM CM CM CM
Figure 5 Corporate Backed TIFs
120
22. C
O 100
80
<D
N
CO 60
0
=3
CD
(f)
40
LL
H
20
0 _ 1 - hi__
Figure 6 Average TIF Bond Issue Size
o CM CD 0 0 O CMo O O O Oo O O O O O O
CM CM CM CM CM CM CM
Figure 7 Average TIF Bond Final Maturity
O CM M - CD CO O CM
O O O O O
O O O O O O O
CM CM CM CM CM CM CM
23. 688 N a t io n a l T a x J o u r n a l
Figure 8 suggests, there was indeed a shortening o f time-to-call
that would fit such ex-
ante evaluations o f the market risk by the issuers o f TIF
securities.
The coupon interest rate sets the periodic interest payments on
local governments’
TIF bonds. In higher interest rate environments, coupon interest
rates are generally
higher and in lower interest rate environments, they are
generally lower. However, the
coupon interest rate is not the same as the yield that investors
will receive (issuers will
pay) because it does not take into account call provisions or the
price of the securities.
In Figure 9 the average highest coupon increases after 2007, and
moves downward in
2012. This is especially interesting because interest rates
generally declined after 2007
as a result o f the financial crisis, as the Federal Reserve Bank
cut its benchmark interest
rate several times and continued to maintain low interest rates
well into 2014. If there
was not an interest rate risk premium that investors were
building into TIF bond inter-
est rates, we would expect to see the average highest coupon
rate decline after 2007 in
line with the general decline in interest rates. In fact, the
average highest coupon rate is
materially larger in the four years after the financial crisis
(2008-2011) than the three
years previous to the financial crisis when interest rates were
generally higher. This lends
some support to the notion that TIF bond investors may have
24. viewed such securities
as relatively risky and thus demanded higher interest rates after
the Great Recession.
Many local governments sell their TIF debt as revenue bonds
with repayment solely
payable from the incremental tax revenues generated in the TIF
district (Johnson,
1999). However, some local governments sell TIF debt using a
general obligation bond
structure whereby repayment is ultimately backed by the full
faith and credit of the
general taxing body. Due to this more robust repayment pledge,
investors generally
view general obligation bonds as less risky than revenue bonds.
One might expect that
local governments would increase the sale o f TIF debt using a
general obligation bond
structure rather than a revenue bond structure in the years
during and after the Great
Recession. In Figure 10, we observe that immediately before the
Great Recession the
share o f general obligation TIF securities was between 2 and 5
percent, and the by early
2000s it was between 7 and 11 percent. Since the financial
crisis, however, the share of
general obligation TIFs increased to as high as 27 percent. It
appears that TIF issuers
are relying on their full faith and credit in more debt issues
after the recession than
on issues before the recession. We see statistically significant
changes in the number
o f general obligations TIFs in the market, with corresponding
Pearson’s Chi-squared
and log-likelihood Chi-squared statistics at 53.8 and 53.4. O f
course by pledging their
25. general obligation credit for TIFs, municipal issuers are
reducing their debt issuing
capacity for non-TIF issues.
The method by which local governments sell their bonds —
negotiated or competi-
tive — is an indicator o f whether local governments are using
financial intermediaries
to resolve information asymmetries. In a negotiated bond sale, a
local government
works directly with a pre-selected underwriter to pre-market
and market their bonds
tailoring the bond structure to market conditions and investor
demands. In a competi-
tive sale, local governments sell their bonds to an underwriter
or group o f underwriters
via an open auction with the lowest bidder receiving the bonds.
Among other things,
T a x I n c r e m e n t D e b t F in a n c e a n d t h e G r e a t
R e c e s s io n 689
previous research has shown that the additional certification
provided by underwriters
in a negotiated bond sale can be advantageous (i.e., it can lead
to lower interest costs
compared to competitive sales) when there is significant
volatility in the bond markets
(Leonard, 1994; Kriz, 2003; Peng and Brucato, 2003). The
financial crisis o f 2007-2008
created more volatility in the capital markets than in any other
period in decades. With
such volatility, all else equal, we might expect an upward spike
in negotiated sales of
26. TIF bonds. The TIF market was dominated by negotiated sales
even before the crisis,
but significantly more deals relied on negotiated sales since
then. As shown in Figure
11, since 2009 at least 87 percent o f TIF securities have been
sold in negotiated deals,
except for the anomalous year 2012 when California withdrew
from the TIF market.
This shift is statistically significant as the Pearson’s Chi-
squared and log-likelihood
Chi-squared statistics are equal to 53.9 and 52.9.
Figures 8 -1 1
Percentage of Total TIF Issuance Volume and Select TIF
Features,
39 US States and the District o f Columbia, 2000-2013 (c o n tin
u e d )
F ig u r e 8 A v e ra g e Y e a rs to C a ll
O CM ^ CD CO
O O O O O
O O O O O O O
CM CM CM CM CM CM CM
F ig u r e 9 A v e ra g e H ig h e s t C o u p o n
Y
e
a
rs
t
o
28. CM CM CM CM CM CM
0 F ig u r e 10 G e n e r a l O b lig a t io n T I F s
o
| 30
(/)
2 2 5
LL
H 20
CD
o 15
o 10
CD
O) d
CD O
O CM NT CD CO O CM
O O O O O
O O O O O O O
CM CM CM CM CM CM CM
I n i i . i m r
CD=3(/)0)
0
OH
M—
o
0
O)
CD
29. 0
Q_
F ig u r e 11 N e g o t ia t e d T IF s
O CM CD 00 O CM
O O O O O
O O O O O O O
CM CM CM CM CM CM CM
690 N ational Tax Journal
Prior research has also shown that the use o f financial advisors
on a municipal
security transaction can help deal with information
asymmetries. These financial
intermediaries help certify the true value o f the municipal
security and thus reduce the
borrowing costs of issuers (Johnson, 1994; Vijayakumar and
Daniels, 2006). Based on
this certification theory, we would expect the use o f financial
advisors on municipal
TIF securities to increase after the 2007-2008 financial crisis in
order to alleviate the
information asymmetries that increased at this time. Figure 12
shows the percent of
total TIF bonds that were sold without the use o f a financial
advisor. The share o f TIF
bonds issued without a financial advisor declined significantly
between 2007 and 2009
and stayed low throughout the entire post Great Recession
period, as compared to the
much higher shares observed in the pre-recession period. It
appears the local govern-
30. ments sought out this additional market certification more
frequently after 2007-2008
in light of the uncertainty created by the financial crisis. This
conclusion is supported
by highly significant Pearson’s Chi-squared and log-likelihood
Chi-squared statistics
of 78.6 and 84.2.
With more volatility in the capital markets and the collapse o f
credit enhancement
tools for TIF finance, better credit quality became important in
the post-recession years.
Figure 13 tracks the percentage o f TIF bond issues rated by at
least one o f the three
major credit rating agencies (Moody’s, Standard and Poor’s, or
Fitch) from 2000-2012.
Through their assignment o f credit ratings, these agencies are
financial intermediaries
that attempt to relieve the information asymmetries between the
issuer o f bonds and
investors especially with respect to the likelihood o f default.
Local governments seek
credit ratings to relieve these informational asymmetries as a
means o f reducing their
borrowing costs. Our results show that there was a general
upward trend in the extent
Figures 1 2 -1 3
Percentage o f Total TIF Issuance V olum e and Select TIF
Features,
39 US States and th e D istrict o f C olum bia, 2000-20 13
(continued)
00
§ 45
31. 1 40
LJL 35
H 30
3 25
t 20
° 15
2 10
m 5
Figure 12 TIFs without FA
0
Q_ O CM ^ CO CO O CMO O O O O t- t-
o o o o o o o
CM CM CM CM CM CM CM
Figure 13 TIFs without Rating
o CM CD 00 O CM
o O O O O
o O O O O O O
CM CM CM CM CM CM CM
Tax In c re m e n t D e b t F in a n c e a n d th e G re a t
Recession 691
to which local governments sought credit ratings on TIF bond
sales, which accelerated
after the financial crisis. In the years immediately before the
Great Recession, about
50 percent o f TIF transactions were rated. In the years
immediately after the Great
Recession, almost 75 percent o f TIF bond transactions received
32. credit ratings. This
upward trend is statistically supported by highly significant
Pearson’s Chi-squared
and log-likelihood Chi-squared statistics o f 62.2 and 59.0. This
is likely a combina-
tion o f local governments seeking additional certification o f
the value o f their TIF
bonds from a third party financial intermediary in the context of
the greater financial
uncertainty during these years and low credit quality issuers
staying out o f the market
altogether.
One o f the major calamities in the municipal market during the
Great Recession
was a collapse o f the bond insurance industry. O f the nine
active bond insurance firms
before the crisis, only two survived the crisis (Moldogaziev,
2013; Johnson, Luby,
and Moldogaziev, 2014). Prior to the financial crisis, almost 60
percent o f all new
long-term municipal securities were insured by monoline bond
insurers such as FSA,
AMBAC, and MBIA (Moldogaziev, 2013). As reported in
Tables 4A (2000-2007) and
4B (2008-2013), we find that there is a general increase in the
use o f insurance from
2000-2007 with 54 percent o f all TIF bonds insured in 2007.
However, there was dra-
matic decline in insured TIF bonds starting in 2008 (only 28
percent insured), which
continued through 2012. In 2013, the share o f insured TIFs
increased to 34 percent;
nevertheless, it is unlikely that bond insurance penetration in
the market will achieve
pre-crisis levels. Thus, while we would have expected to see an
33. increase in insured TIF
bonds after the Great Recession as a means of mitigating
investor concerns about bond
default, such credit enhancement is not as widely and cheaply
available in the capital
market as it used to be prior to the Great Recession. As the
relationship between the
frequency o f insured TIF securities and the year o f issuance
suggests (Tables 4A and
4B), there has been a statistically significant shift in the
distribution o f insured securi-
ties in the market; the Pearson’s Chi-squared and log-likelihood
Chi-squared statistics
are 317.9 and 381.0 respectively.
Another dramatic shift in the municipal market was the collapse
of the variable rate
bond market (Luby, 2012). State and local governments
generally have the ability to
sell their debt on a fixed interest rate basis where the interest
costs are set at issuance
or on a variable rate basis where interest rates fluctuate over the
term o f the issue. With
variable rate debt, state and local governments generally rely on
credit enhancement
devices such as bank letters o f credit and liquidity facilities to
successfully market the
bonds over the life o f the issue. Such credit enhancement
became very scarce during
and immediately after the financial crisis, which led to a
significant upward spike in
interest costs on these variable rate securities. This phenomenon
is shown in our data
in Tables 4 A and 4B. It is clear that the volume o f variable
rate TIF securities shrunk
dramatically after the Great Recession. More than 70 percent o f
34. all variable rate TIFs,
or $1.9 billion in our sample, were issued in 2000-2007. This
shift appears to be statisti-
cally significant, with Pearson’s Chi-squared and log-likelihood
Chi-squared statistics
of 27.7 and 33.4, respectively.
692 N ational Tax Journal
T a x I n c r e m e n t D e b t F in a n c e a n d t h e G r e a t
R e c e s s io n 693
694 N atio na l Tax Journal
As mentioned above, variable rate bonds and short-term
securities, in addition to
bond insurance, would also often be accompanied by letters o f
credit and/or liquidity
facilities. Though fluctuating before and after the Great
Recession, the volume o f TIFs
using these two forms o f credit enhancements fell after the
crisis. As shown in Tables
4A and 4B, the largest volume o f letter o f credit and/or
liquidity facility supported
securities was issued in 2005, but they have been largely under-
used in recent years. In
this case as well, the shift in letter of credit and/or liquidity
letter enhanced securities
is statistically significant. Our estimated Pearson’s Chi-squared
statistic is 25.4, while
35. the log-likelihood Chi-squared statistic is 25.6.
IV. D IS C U S S IO N
The Great Recession clearly affected TIF debt finance activity
by U.S. local govern-
ments. The volume and number o f TIF municipal securities
declined dramatically after
2007. This decline was seen across all states in both the number
o f annual transactions
and bond volume. Annual TIF bond issuance is now less than
half its size (as measured
by annual number o f transactions and volume) since its peak in
the mid to late 2000s. In
addition, the average transaction size o f TIF bond issues has
decreased since the Great
Recession. This decline in TIF debt activity is most likely the
result o f California, the
largest issuer o f TIF bonds, slowing down its issuance activity
after the recession and
ultimately exiting the market, but may also be a result o f other
issuers using less TIF
debt finance to fund their redevelopment projects given the
actual or projected decline
in growth o f property tax increments in many parts o f the
country.
It appears the type o f projects that TIF debt used to finance has
also changed since
the Great Recession. Economic development TIF projects rather
than general-purpose
TIF projects now constitute the great majority o f TIF debt
issued since the Great
Recession. In addition, the post-Great Recession period has
witnessed a total decline
in corporate-sponsored private-activity TIF bonds. Our findings
36. provide evidence that
bond investors may be demanding more specificity in their
investments. There is also
evidence o f a lack o f available private capital for government
development projects.
The TIF debt market experienced significant changes after the
Great Recession with
respect to the pricing, structure and sale process o f these
securities. Coupon interest rates
increased and call maturities declined, reflective o f a general
increase in the perceived
riskiness o f TIF securities. Local governments increased their
use o f general obligation
bond structures and independent financial advisors while more
often seeking credit rat-
ings on their TIF transactions as a way o f mitigating the
perceived increased riskiness
o f their municipal securities. Such actions to reduce
information asymmetries were
especially necessary as other risk mitigation tactics, such as
seeking third-party credit
enhancement, were not available to these local governments as
the monoline municipal
bond insurance market collapsed as a result o f the financial
crisis.
Given our findings regarding the impact o f the Great Recession
impact on TIF debt
finance, can we speculate how this financial market will look in
the future? Clearly,
local governments will continue to sell TIF securities as shown
by their continued issu-
37. T a x I n c r e m e n t D e b t F in a n c e a n d t h e G r e a t
R e c e s s io n 695
ance even during the recent global financial crisis. The market
is likely to be smaller
compared to its historical high since California local
governments will be prohibited
from selling TIF securities except for refinancing purposes. For
example, the year 2012
witnessed an even more dramatic drop than the years
immediately after the 2007-2008
financial crisis, as this was the first full year o f California’s
TIF debt prohibition. The
overall TIF municipal securities market may also be smaller if
the cost o f borrowing
using TIF debt finance stays higher than other modes o f
financing since such additional
interest costs will make redevelopment projects less feasible.
It is also likely that the structure and types o f projects financed
by TIF debt will
change. Local governments appeared to attempt to strengthen
the general credit char-
acteristics of their TIF securities after the financial crisis. Such
attempts will continue
and could take the form o f additional revenue pledges for bond
repayment other than
the tax increment, general obligation pledges for repayment in
addition to the increment,
greater use and size o f debt service reserve funds, and higher
debt service coverage
ratios (i.e., the minimum ratio o f expected tax increment
revenues to debt service).
Various market strategies related to financial intermediaries
may also flourish, includ-
ing the use o f financial advisors and more reputable
38. underwriters and the procurement
o f multiple credit ratings, to enhance the perceived credit o f
TIF debt. From the bond
investor perspective, local governments probably should expect
greater due diligence
of the credit characteristics o f their TIF securities, demand for
more “seasoned” TIF
districts, and greater scrutiny of feasibility analyses related to
the TIF district. All o f
these strategies and demands emanate from the desire o f the
investor community for
better and more carefully crafted TIF bond credits in an era o f
greater risk aversion
with respect to the general credit o f local governments.
V. CONCLUSION
Local governments have increasingly relied on the use o f debt
finance to raise
upfront redevelopment resources in their TIF districts. While
the Great Recession
certainly “changed the face” o f TIF debt finance, other factors
such as the collapse o f
the monoline bond insurance industry and the dissolution o f
TIF districts in California
contributed to the present state o f TIF debt finance. With local
governments in Cali-
fornia mostly exiting the TIF municipal securities market and
investors likely taking a
cautious view o f the issuers that remain in market, the future o
f TIF debt finance in the
United States is uncertain. However, as long as many local
government officials con-
tinue to believe that TIF is one o f their only economic
development tools, the financial
market should remain active, albeit taking on a significantly
39. different size and market
structure.
DISCLOSURES
The authors have no financial arrangements that might give rise
to conflicts of interest
with respect to the research reported in this paper.
696 National Tax Journal
REFERENCES
Boyd, Terry, 2013. “Insufficient Funds: Arena Debt Document
Reveals Struggle to Pay KFC
Yum! Center Bonds.” INSIDER Louisville, July 24,
http://insiderlouisville.com/news/arena-story/.
Briffault, Richard, 2010. “The Most Popular Tool: Tax
Increment Financing and the Political
Economy o f Local Government.” The University o f Chicago
Law Review 11 (1), 65-95.
Geheb, Philip J.F., 2009. “Tax Increment Financing Bonds as ‘D
ebt’ Under State Constitutional
Debt Limitations.” The Urban Lawyer 41 (4), 725-754.
Johnson, Craig L., 1994. “An Empirical Investigation o f the
Pricing o f Financial Advisor Ser-
vices.” Municipal Finance Journal 15 (3), 36-52.
Johnson, Craig L., 1999. “Tax Increment Debt Finance: An
Analysis o f the Mainstreaming o f a
Fringe Sector.” Public Budgeting & Finance 19(1), 47-67.
40. Johnson, Craig L, Martin J. Luby, and Tima M. Moldogaziev,
2014. State and Local Financial
Instruments: Policy Changes and Management. Edward Elgar
Publishing, Northampton, MA.
Kriz, Kenneth A., 2003. “Comparative Costs o f Negotiated
versus Competitive Bond Sales: New
Evidence from State General Obligation Bonds.” Quarterly
Review o f Economics and Finance
4 3 (2), 191-211.
Lefcoe, George, and Charles W. Swenson, 2014.
“Redevelopment in California: The Demise
o f TIF-Funded Redevelopment in California and Its
Aftermath.” National Tax Journal 67 (3),
719-744.
Leonard, Paul, 1994. “Negotiated Versus Competitive Bond
Sales: A Review o f the Literature.”
Municipal Finance Journal 15 (2), 12-36.
Luby, Martin J., 2012. “The Use o f Financial Derivatives in
State and Local Government Bond
Refinancings: Playing with Fire or Prudent Debt Management?”
Journal o f Public Budgeting,
Accounting & Financial Management 24 (1), 1-31.
Moldogaziev, Tima, 2013. “The Collapse o f the Municipal
Bond Insurance Market: How Did We
Get Here and Is There Life for the Monoline Industry beyond
the Great Recession?” Journal o f
Public Budgeting, Accounting, & Financial M a n a g e m e n ts
(1), 199-233.
Peng, Jun, and Peter Brucato, Jr., 2003. “Another Look at the
41. Effect o f Method o f Sale on the
Interest Costs in the Municipal Bond Market - A Certification
Model.” Public Budgeting &
Finance 23 (1), 73-95.
Vijayakumar, Jayaraman, and Kenneth N. Daniels, 2006. “The
Role and Impact o f Financial Advi-
sors in the Market for Municipal Bonds.” Journal o f Financial
Services Research 30 (1), 43-68.
Copyright of National Tax Journal is the property of National
Tax Association and its content
may not be copied or emailed to multiple sites or posted to a
listserv without the copyright
holder's express written permission. However, users may print,
download, or email articles for
individual use.