SlideShare a Scribd company logo
1 of 34
MS Project - Lesson #1B - Basics of Project Scheduling - Part
2Objectives - MS Project 2010
· Creating a summary task
· Working with subtasks
· Establishing task dependencies
· Specify lead and lag times
A project task list can be as few as 10 or as many as several
hundred tasks. With a large project, it can become difficult to
locate a specific task. Using MS Project, you can organize the
task list by creating a hierarchical structure. This process of
structuring a task list is known as outlining. Outlining is used
to organize common tasks into groups within the task list. The
groups can represent phases of the project.
In this lab, we will first use outlining to group the tasks of our
project into phases. We will create a main summary task to
represent the entire project and then several levels of summary
tasks below the main summary task to represent the phases of
the project.
Creating an Outline
1. Log onto Windows. Open MS Project.
2. Open your project file that you created in Lesson 1, Part A
(MyLab1a_XXX.mpp, where XXX are your initials.)
3. Save this file, using Save As, as MyLab1b_XXX.mpp, where
XXX are your initials.
Creating a hierarchical outline organizes the project tasks list
into groups of tasks. Each group of tasks is preceded by a
summary task, which describes the tasks within each group.
The outline of a project generally begins with a main summary
task. The main summary task is a brief description of the
project and all tasks are subordinate to the main summary task.
This main summary task is also helpful in generation of
summary reports and cumulative totals in budgeting and
resource management.
4. Click in the task namefield for task 1, Inventory current
equipment.
5. Right click and select Insert Task. A new blank task row is
inserted above and the task list is renumbered.
6. Type in (Student's Name) New System, where you enter your
first and last name for student name. For example, if you are
John Smith, your task will read John Smith's New System. Got
it?
7. Do not worry about duration.
8. Since this is our main summary task, we need to indent all
the other tasks to indicate that they are subtasks or subordinate
tasks.
9. We need to select all the tasks below our summary task (from
Inventory Equipment up to and including Project Meeting). One
way to do this is to click in the task name field for task 2,
Inventory Equipment. Click and drag so that all the task names
are selected. (Similar to Excel). (You can also click in task 2
name field, hold down the shift key and then click in the last
task name field.)
10. On the Task tab, you should see the following icons:
This is the Schedule Ribbon. The left arrow outdents a task to a
higher level; the right arrow indents a task lower level task,
thus creating a summary task above.
11. Press the Indent button (the right arrow). The selected tasks
are indented one level within the outline. Also notice the
duration for your main summary task. How did it come up with
7 days? In addition, notice the change in the Gantt chart in
representation of the summary task!
12. Press Crtl+Home. The cursor moves to the first task, your
main summary task, and is bold indicating that it is a summary
task. Your screen should like Figure 1.
Figure 1
The image above is of the Workbreakdown Structure as
currently designed. There are 15 total tasks. The main summary
task is task 1, and the recurring Project Meeting task is task 15.
Note: You can also automatically create a top level summary
task, from the Gantt Chart Tools, Format tab. In the Show/Hide
group, select the Project Summary task check box. The project
title is inserted from the title box on the summary tab of the
Project Properties dialog box. Since we are entering different
information for our project main summary task name, we will
not be practicing this procedure. Also, when this method is
used, the automatic outline numbering format is changed, which
we will get to in a few more steps.
We now want to create additional summary tasks below our
main summary task, perhaps to represent logical phases of the
project.
1. Select the task name field for task 2, Inventory Current
Equipment.
2. Right click and select Insert Task.
3. In the new Task 2 row, type Proposal Creation. (Again leave
the default 1-day duration).
4. Select tasks 3 through 7 (Inventory Equipment to Research
Products and Services).
5. Indent the tasks. These tasks are now subtasks to the
summary task of Proposal Creation. When you insert tasks, you
will also need to widen the Task Name Column.
Your project should now look like figure 2.
Figure 2
In the image above, the new summary task, "Proposal Creation"
is indented one time beneath, the main summary task. The next
five tasks are indented one time under "Proposal Creation".
Hint: You can also indent tasks using the mouse. Position the
mouse over the task name. The pointer changes to a two-way
arrow. Drag the task one level to the right.
6. On your own create three more summary tasks or phases
subordinate to the main summary task:
· Vendor Selection, which will include the subtasks of Issue
RFP's, Evaluate Bids and Award Contract.
· Implement System, which will include the subtasks of
Purchase Equipment, Install Wiring, Install Hardware, Install
Software and Test System.
· Leave Project Meeting where it is. We will treat this as
subtask to the entire project.
You will have to make use of the Outdent (Left Arrow) button
to move your new summary tasks to the left. Make sure,
however, you do not outdent too much! Compare your result
with figure 3 and make any necessary correction before
continuing the lab!
Figure 3
In the image above, the WBS is now created with one main
summary task, four summary tasks and then the work packages
beneath each of the summaries.
7. If all looks good, save your file.
Hiding and Showing the Outline
By hiding and showing subtasks in the outline, you can display
only the information needed. Not only does this cut down on
the printing, but allows you to focus on any specific area of the
project.
The outline structure can be hidden or displayed using the
outline buttons on the Formatting toolbar (as previously
discussed) or by using the symbols next to each summary task.
The (+) symbol indicates all the subtasks of the summary task
are hidden and the (-) symbol indicates that all subtasks are
shown.
8. Select your main summary task ((Your name) New System).
Press the (-) symbol on the outlining toolbar to show only the
main summary task. The main summary task should be the only
task now listed.
9. Press the (+) symbol. Notice all the summary tasks and their
subtasks now reappear.
10. Click on the - symbol next to the summary task, Proposal
Creation. All the subtasks below Proposal Creation should now
disappear. Click the + symbol next to the summary task,
Proposal Creation. The subtasks for this summary task should
now reappear.
Viewing Outline Numbers
MS Project automatically assigns an outline number to each task
when you outline the schedule. (Do not confuse this with the
task number, which appears in the first column of your entry
table). The outline numbers are similar to a Work Breakdown
Structure (WBS).
11. Click in main summary task name ("Your Name New
Project). Select the Gantt Chart Tools Format Tab.
12. On the Show/Hide group, select the Outline Number check
box
13. The outline numbers are now displayed in each task name
field. (Once again, you may need to widen the Task Name
column.
14. Leave the numbers displayed for now.
Note: if you ever move a task (previously discussed in prior
lab), MS Project will automatically renumber the outline for
you. At this point, your screen should look like figure 4.
Figure 4
In the image above, the outline numbers are added to the task
name column. Task 1 is "1". The summary tasks beneath are
Proposal creation, "1.1", Vendor Selection "1.2", Implement
System, "1.3" and Project Meeting, "1.4". The work packages
beneath each summary task continues the numbering. For
example, Under Vendor Selection (1.1) the individual tasks are
numbered 1.1.1, 1.1.2, 1.1.3, etc.
Establishing Task Dependencies
When a task list is first developed, the tasks are listed one after
another, and the only consideration is the approximate logical
order or sequence in which they should occur. Right now, our
project looks like several isolated tasks that all start at the same
time and finish according to each task's duration. In reality, a
project is a series of related tasks and these relationships are
called dependencies. There are four types of dependencies:
Finish-to-Start (FS)
The finish of one task marks the start of another. This will be
the default when we link since it is the most common.
Start-to-Start (SS)
The start of one task marks the start of another. In other words,
both tasks may start at the same time. This is what our Gantt
Chart is currently showing.
Finish-to-Finish (FF)
The finish of one task marks the finish of another. In other
words, both tasks may finish at the same time.
Start-to-Finish (SF)
The start of one task marks the finish of another task. This is
the most uncommon dependency.
When a task is initially entered into MS Project, it is scheduled
to begin on the project start date. By linking tasks, you
establish a dependency that determines the sequence of tasks.
MS Project then schedules the tasks by setting the start and
finish dates of each task. The Gantt bars in the Gantt chart
view are then moved to the appropriate date on the timescale
and link lines are drawn to display the dependency.
1. Select all the tasks in your project by clicking on the task
name for the first task (Task #1) your main summary task, and
then dragging the cursor down to the last task, Project Meeting.
2. On the Task toolbar, in the Schedule ribbon press the Link
Tasks button.
3. Each task is now linked in a finish-to-start dependency. Your
screen should look similar to figure 5.
Link Line
Figure 5
In the image above, arrows link the connected tasks.
You need to notice several things at this point:
· The duration of your main summary task and your summary
tasks has now changed. Do you know why?
· The duration of your main summary task may read ####. This
means the number is too big for the size of the column, similar
to an Excel spreadsheet. Widen the column so the number will
appear by positioning your cursor to the right edge of the
column header for Duration. The cursor will turn to a double
horizontal arrow. Double click. You should see 44.25 days.
· On the Gantt chart, scroll to the end of the project and notice
how the summary tasks are linked.
· Also notice there is no link to the recurring task of Project
Meeting.
· Finally every task link is a Finish-to-Start dependency.
4. Now, select all the tasks of your project again.
5. Press the Unlink Tasks button Task toolbar, in the Schedule
ribbon.
6. All dependencies and links should be gone and your entry
table should look similar to figure 4 again.
7. Another way to link tasks, and perhaps better, is to select two
or more tasks before linking.
8. Click in task name 3, Inventory Current Equipment. Drag to
select all the tasks under the summary task of Proposal Creation
(see figure 6).
Figure 6
9. Click on the Link Tasks Button. Only these tasks should now
show link lines on the Gantt chart.
10. On your own, link the subtasks under Vendor Selection.
11. On your own, link the subtasks under Implement System.
12. Compare your results to figure 7.
Figure 7
In the image above, the project duration is 20 days. Proposal
Creation equals 20 days, Vendor Selection, 12 days, Implement
System, 12 days and Project Meeting 0.25 days.
If you are paying attention, you will notice one possible
problem with this dependency list: each phase or summary task
starts at the same time. Might be hard to implement system
before awarding the contract!
13. We need to show the dependencies between the work under
the summary tasks. However, we cannot use the previous
method because these tasks are non-contiguous.
14. To link non-contiguous tasks; follow the next steps very
carefully because it is extremely important that you select tasks
in the proper order!
15. Click in the summary task name for Proposal Creation.
16. Hold down the Control key on your keyboard while you do
the next two instructions.
17. Click in the summary task name for Vendor Selection.
18. Click in the summary task name for Implement System.
19. Release the Control key and press the Link Tasks button on
the main toolbar.
20. Check your Gantt chart to see if the summary tasks were
linked properly and in the right order. Also check the main
summary task duration. It should read 44 days. If not, unlink
all tasks and begin this section again.
21. One last thing…. It is NOT a good idea to link summary
tasks to summary tasks. Why? When doing project work it is
the LAST task in a group that will initiate the NEXT task – not
the summary tasks to each other. So, on your own, unlink
summary tasks and relink them using the appropriate task.
(Task 7 is the predecessor task to Task 9, and Task 11 is the
predecessor to Task 13.) When you are done, your table should
look like:
The image above shows the entire project linked and a total
duration of 44 days.
Changing Task Dependencies
Because not all tasks need to be in a Finish-to-Start
dependency, you can change the dependencytype. Currently all
of our tasks, except the main summary task (which is rarely
linked to any other task except to another project) and our
recurring task of Project Meeting, are defaulting to a Finish-to-
Start dependency. However, we want to make it clear that the
tasks of installing wire, hardware, and equipment must finish at
the same time before we begin testing the system. So how do
we do that?
First, we need to clarify two important terms, predecessor and
successor. A task that must start or finish before another task
can begin is called a predecessor (or independent) task. A task
that depends on the start or finish of a preceding task is called a
successor (or dependent) task.
In our example project, we will make the assumption that we
cannot begin any installation process until purchasing has been
completed. However, we make the assumption that installing
the wiring, hardware and the software can begin any time after
the purchasing, but all tasks must finish at the same time before
we begin testing.
1. Click in the subtask name field for Install Wiring.
2. Right-click and select Information from the pop-up menu.
3. The Task Information dialog box should now appear. Select
the Predecessor tab.
Figure 8
The Task Information dialog box details information about a
particular task, including notes. This information is important
when troubleshooting problems with scheduling, etc.
4. The predecessor information states that the subtask, Purchase
Equipment, is the only predecessor task to the Install Wiring
successor task. Under Type is listed Finish-to-Start (FS). This
is what we want, so press OK to close the Task Information box.
5. Select the task name for Install Hardware and open the Task
Information for this task. Select the predecessor tab.
6. The predecessor task for Install Hardware is Install Wiring.
We want to indicate that the dependency of these two tasks is a
Finish-to-Finish, since we need these tasks to finish at the same
time.
7. Click the Finish-to-Start (FS) type drop-down box for the
predecessor task of Install Wiring and select Finish-to-Finish.
Figure 9
8. Press Ok. Scroll out on the Gantt chart to view how the
dependencies look (Figure 10).
Figure 10
9. On your own, change the dependency between Install
Software (successor) and Install Hardware (predecessor) to a
Finish-to-Finish (FF). Remember, the successor task is the one
you want to click on! Your Gantt chart should now look like
figure 11.
Figure 11
In the image above, arrows for Finish to Finish tasks link from
the end of one Gantt bar to the end of its successor.
10. While the chart clearly shows the three tasks finishing at the
same time (also reducing the number of days to complete this
phase to 8 days), the chart gives the indication that once Install
Software and only Install Software is finished, can Test System
begin. In reality, allthreetasks, Install Wiring, Install Hardware
and Install Software must finish before Test System. We need to
clearly indicate that Test System has more than one predecessor
task.
11. To add another predecessor task to a successor task, we can
use the Task Information.
12. Select the task name, Test System, and open the Task
Information for this task.
13. Click in the next row under Task Name to open a drop-down
menu and select Install Hardware.
Figure 12
14. Leave the type as Finish-to-Start.
15. Add Install Wiring in the next row and leave as Finish-to-
Start.
16. Press OK. While the duration of the summary task does not
change, notice the change in your Gantt chart. We are now
clearly indicating that all three tasks are predecessors to the
Test System task.
Figure 13
There is one other detail missing from this arrangement or flow.
Remember that a successor task can have more than one
predecessor task. In the case of Install Hardware and Install
Software, they also are dependent on the Purchase Equipment
task. Therefore, we need to add that information to them.
17. Add Purchase Equipment as a predecessor task to Install
Hardware, with a Finish-to-Start dependency.
18. Add Purchase Equipment as a predecessor task to Install
Software, with a Finish-to-Start dependency.
Look at your Gantt chart to see the difference. Can you detect
it?
There are many ways to accomplish what we just did. However,
the task information properties dialog box is the best way to
troubleshoot. If you ever make a mistake in linking tasks or
dependencies, I have found the best way is to select the task or
tasks you want to correct and unlink the tasks and start over
again. Trust me…
(Note: another way to link tasks and set dependencies is to enter
the information directly in the Predecessors Column of your
Table: Entry. To see this column, just move the divider to see
the column or use the scroll bar at the bottom of the table.
Notice the syntax of setting dependencies other than Finish-to-
Start. This is another handy way to quickly set up dependencies;
yet because it only gives the number of the task, it is harder to
ensure that you have the right task(s) without the actual name of
the task).
19. Check your work and if you feel everything looks right (40
days total for the total project, 20 days for Project Creation
phase, 12 days for Vendor Selection phase, and 8 days total for
Implement System phase), save the file; if not, unlink all tasks
and start again at the section on dependencies and linking.
Understanding Lag and Lead Time
In addition to dependency type, you can further define the true
impact of task relationships using lead time and lag time.
Lead time creates an overlap in a dependency that can shorten
the project duration. For example, if you specify a lead time of
one day on a Finish-to-Start dependency, the two tasks overlap
in time by one day. The last day of the first task takes place
while the first day of the second task takes place. (Analogous to
getting “a head start”).
Lag time creates a delay, or gap, in the task dependency that
can lengthen the project duration. For example, if I specify a
lag time of one day, the successor task begins one day after the
predecessor task in a Finish-to-Start dependency.
To demonstrate lead time, let's say that Install Wiring can begin
prior to the finish of Purchase Equipment (at least we can start
doing some preparation ahead of time).
1. Bring up the task information for the task Install Wiring.
2. Select the Predecessor tab.
3. Under the column Lag, you should see 0d for 0 days for
Purchase Equipment.
4. In the lag cell, type in the number -1 (that's minus one).
5. Press OK. Check the duration for the phase Implement
System. It should now have been reduced by one day to 7 days.
Also look at your Gantt chart and notice that the start date for
Install Wiring has now moved to prior to the finish of Purchase
Equipment (figure 14).
Figure 14
To demonstrate lag time, let's say that we want to wait two days
after evaluating bids before awarding the contract (a cooling off
period).
6. Bring up the taskinformation for the task AwardContract.
7. Select the Predecessor tab.
8. Under the column Lag for the task Evaluate Bids, type in the
number 2.
9. Press OK. Check the duration for the phase Vendor
Selection. It is now 14 days. Also look at the effect on your
Gantt chart (now 41 days).
One final item: If you notice that your project meeting only
occurs once, in the first week of the project. What if you want
to schedule it for everyFriday until the end of the Project? In
this case, you would bring up the Recurring Project Information
for the summary task Project Meeting and indicate when the
meetings will end (such as the end of the project) or the number
of times the meetings will occur.
1. If I want to have project meetings every Friday until the end
of the project, I need to know when the project will finish.
2. Select File Tab, select the Info tab.
3. The finish date should be December 4, 2013. (If it isn’t, go
back to lag and lead time section).
4. Go back to the Task Tab and select the summary task Project
Meeting. (Make sure the Project Meeting is number 1.4 and not
1.3.6. If it is the later, you need to “outdent” or move the task
in the outline to the left).
5. Right-click and select Information from the menu.
6. In the Range of Recurrence section, change the End by date
to December 4, 2013 and Press OK (Figure 15).
Figure 15
7. Hide the subtasks under Project Meeting to just show the
Project Meeting summary task! (The total duration of the
Project Meeting task is 35.25 days. Do you know why?).
Checkpoint:
From the File Tab, select Info and then Project Information.
You will be given 2 choices, Advanced Properties and Project
Statistics. click Project Statistics. If your screen matches figure
16 (below), then save your project file and print the following
reports:
1. Your Gantt chart view and include only these columns from
the table: Task ID, Indicators, Task Mode, Task Name, and
Duration. To do this, slide the Gantt Chart divider to the left or
right as necessary. (All columns must be wide enough to see the
entire information in the fields). DO NOT DELETE
COLUMNS. Check to make sure your project information is
correctly inserted into your printouts, in the headers and
footers. Do NOT forget that this is lab #1B… Also, make sure
your Gantt timeline is set to the default of weekly for major
timeframe and daily for minor time frame. Your print out
should be no more than 3 pages.
2. Project Summary Report
3. Unstarted Tasks Report, with appropriate header/footer
information. Fit this printout to 1 page.
4. Attach your printouts to the back of the Review Questions
sheet IN ORDER, or submit to the dropbox.
When submitting required printouts, if you are not bringing
them to class, from the Print Preview Page, take a screen shot
(in Windows <ALT><Prt Scr>) of the report and paste the
screen shot to a MS Word Document. Make sure to crop the
screen to show only the report. After cropping, resize the image
appropriately. If the printout is on more than 1 page, paste each
page individually.
Add these images to the Word document, containing printouts
created in Part A, Week_1_Printouts_XXX.docx. Remember to
replace "XXX" in the file names with your initials and ensure
that all of your files are all clearly labeled and include your
initials in the file name. Submit this file to the Weekly iLab
Dropbox.
Figure 16
Printing tip: There is an easier way to specify which columns of
the table you want to print without worrying about how your
screen appears. While in Page Setup, after you change your
header and footer information, select the tab View. You can
quickly specify to print all columns or the first X columns. Try
it out.)
When you have completed this lesson, please save it as
MyLab1b_XXX.mpp and submit the file to the Weekly iLab
Dropbox. Remember to replace "XXX" in the file names with
your initials and ensure that all of your files are all clearly
labeled and include your initials in the file name.
Also, complete the following page. Submit this Review
Question sheet to the Weekly iLab Dropbox.
Review Questions
Name ____________________________
Answer the following questions (use MS Project Help, if
necessary):
1. What is the difference between a main summary task and a
summary task?
2. On the View Tab, what does the Outline button with plus and
minus signs do?
3. What is a milestone?
4. What predefined report can you not make changes to the
header and footer?
5. Give a real-world example of
a) A successor task requiring lead time
b) A successor task requiring lag time
Turn in this sheet with your MS Project file to the Week 1 iLab
Dropbox.
MS Project Lesson #1, Part B Page 12
MS Project - Lesson #1A - Basics of Project Scheduling - Part 1
Objectives - MS Project 2010
· Understanding Project Scheduling
· Introduction to Microsoft Project
· Working with Project Tasks
· Basic views, time scales and reports
Whether you are a project manager or not, project management
techniques are extremely helpful in meeting goals and objects.
Project management techniques define a path to a specified goal
and then supervise the implementation.
MS Project can help you establish your initial plan as well as
monitor progress. MS Project can quickly produce reports and
other information that will help keep management, customers,
and your project team informed. To get the most from MS
Project, not only do you need to understand project management
terminology, you also need to be familiar with the software
itself. Therefore, do not attempt to quickly finish the lab, but
take your time and read all instructions carefully.
Understanding Project Scheduling
A typical project is composed of tasks and resources. After
tasks are identified, you organize the tasks in a logical
hierarchy, also called a Work Breakdown Structure (WBS).
Eventually, this sequence will show the interdependencies of
each task. Then each task is given a duration. In MS Project,
this can be in weeks, days, hours or minutes. You can also
specify a milestone, which will represent an event that marks
the completion of a group of related tasks.
To accomplish any task, you need resources. Resources can
include people, equipment, material or special facilities
necessary to complete a task. Resource availability and
scheduling are important constraints to completing a task.
Once you establish a plan, complete with tasks and resources,
you will often need to refine the plan before saving it as a
baseline. The baseline is your guideline to help manage the
project.
MS Project Basics
When you first start MS Project, a blank project file is
displayed in Gantt Chart View. (If you need to open an existing
MS Project file, the file extension is .mpp.) Let's take a look at
the main window:
Select All
Entry Table
Task ID
Gantt Chart
Divider
View Bar
The above image is the default screen for MS Project 2010. The
right side of the screen consists of the area for the Gantt Chart.
The left side of the screen is the Entry table where tasks,
durations, and other task information is entered. The Entry
Table and Gantt Chart are separated by a moveable Divider
Pay particular attention to this layout. The Entry table is where
we enter our tasks and durations. The Gantt chart will
eventually show our tasks and durations in a graphical bar chart.
The other part of significance is the divider. This allows you to
show more or less of the Entry table/Gantt chart.
In Project 2010 the menu bar is set up into Ribbons. To access
the various ribbons, Tabs are selected across the top of the
menu bar. Within the ribbon the various sections are divided
into groups:
TABS
GROUPS
The above image displays the Microsoft Ribbon in the top of the
window. The ribbon is navigated via Tabs. Within each tab are
Groups and within each of the Groups are individual commands.
The first step in creating a project is establishing the project
information.
1. Select Project Information from the Project tab and the
Properties group
The Project Information is used for information that is critical
to the scheduling of tasks and resources. It contains the start
date and finish date of the overall project, the current date
(taken from the computer), and which calendar you will be
using. You must always enter this information when creating a
new project.
2. Enter the starting date of this project as October 9, 2013.
(Note: you can only enter the start date or the finish date, but
not both!).
3. Leave the other information as is and Press OK.
4. Next we are going to define other project information. Select
File on the Project Tab. Next select, Info. On the right hand
side of the screen select Project Information and then Advanced
Properties.
5. The Project Properties screen appears and the Summary tab
should be selected.
6. In the Title box, type Maynard Furniture Company Project.
7. In the Subject box, type New System.
8. In the Author's and the Manager's box, type in your name.
This information will be displayed on reports. In the Company
box, enter MGMT404 followed by your professor’s name. Click
OK.
9. Save the project as MyLab1a_XXX.mpp (where XXX are
your initials).Basic Setup
1. Before we start entering data there are a few setup tasks we
need to do.
2. The first is to change how MS Project calculates the
schedule. (We will explain this in week 5)
3. Go File, then Options. The Project Options window opens.
4. Select Schedule. The Project Options window now should be
visible.
5. Under Scheduling options for this project check the box
labeled "New tasks are effort driven"
6. Click OK to close the window.
7. Next, select the Gantt Chart Tools Format tab from the
ribbon. Click the check box to show the tasks that will be on
the Critical Path.
8. Select the Task tab. With these settings we are ready to start
entering data
Entering tasks
1. Click in the first field in the Task Name column. Type
Inventory current equipment.
2. Press the tab key. The information is entered and the
selection moves to the Duration column for task 1. (You may
need to slide the divider to the right to see the column). Also
notice the task is represented on the Gantt chart.
3. Change the duration to 3 days by typing 3 and press enter.
Notice the duration "days" or the letter "d" is automatically
assumed. If different, you would enter m for minutes, h for
hours, d for days or w for weeks after the number, such as 3w
would be three weeks).
4. By default, MS Project 2010 enters tasks as Manually
Scheduled. This allows the user to schedule individual dates for
the tasks. We however, want MS Project to schedule the tasks
for us.
5. For task 1, In the Task Mode column, select Auto Schedule.
This will enable MS Project to automatically assign the start
and end dates for each task.
6. To change this as the default mode, at the bottom left of the
screen there is a button where you can change this default
setting. Click on this and change the setting so all new tasks
are set to be Auto Scheduled. You can also do this from the
Task tab, Tasks group and selecting the Mode button, or from
the Options screen we looked at earlier.
7. Enter the following tasks and durations for this project:
Assess current department needs 2 days
Design and diagram new system 5 days
Proposal to accounting 3 days
Research products and services 7 days
Issue RFPs 7 days
Evaluate bids 5 days
Award contract 1 day
Meet with vendor 1 day
Purchase equipment 4 days
Install wiring 3 days
Install hardware 2 days
Install software 2 days
(Note: it is very important that you make any changes to
these durations prior to assigning resources. If you need to
change duration after assigning resources, you should unassign
all resources, change the duration and then re-assign the
resources!)
8. When you enter tasks, note that “1 Day?” is the automatic
default for duration. (You may need to slide the divider to the
right to see the column). Also notice the task is represented on
the Gantt chart. For durations that are only 1 day, make sure to
manually type 1 and then the <Enter> key to remove the “?”.
9. Next make sure each task is "Auto Scheduled" when you are
finished.
10. Notice as you enter each task and the duration, how the
tasks are presented on the Gantt chart.
(Tip: By default MS Project 2010 automatically wraps the text
on the task names. Some readers may find this not very clear.
To see the entire task name on one line, position your cursor on
the vertical line between the Task Name column header and the
Duration column header. When the cursor turns to a double
arrow, either drag the line to the right to increase the column
width or double-click. Another method is to double click on the
Task Name column header and select Best Fit. To see the
Duration column, move the divider between the tasks and the
Gantt chart. When you are done, then also adjust row height).
11. The text wrap can be toggled on and off from the Gantt
Chart Tools Format tab, in the Columns group and the Wrap
Text icon. Please turn this off now.
12. Change the duration of the task Award contract to 0 days.
Notice the symbol on the Gantt chart. This is a milestone task,
which has no duration but is used to mark progress in a project.
13. What if you need to insert a task later? Easy. For example,
select task #13 Install software and Right click and select click
Insert Task. A new task row will now be inserted above the
current task.
14. Type Test system as your new task and duration of 1 day.
(Remember next to select "Auto Scheduled".
15. Since “Test system” actually should be our last task, we
need to move it. Therefore click (but do not hold down the
mouse button) the task ID for task #13 - Test system. The
entire row should be selected.
Task ID
16. With the pointer still positioned on the task ID, drag down
until a horizontal gray bar is displayed after task #14. Then
release. Test system should now be your last task.
17. What if you want to delete a task? Click anywhere in the
row for the task Meet with vendor. Right click and select click
Delete Task.
Another type of task you may want to enter is a recurring task,
such as a team meeting, etc. Generally recurring tasks are not
included on a project, but it helps in resource scheduling.
18. Below the last task (task #13: Test System), click in the
Task Name Column, but do not type anything.
19. From the Task tab in the Insert group, click Select the arrow
under Task and choose Recurring Task.
20. The Recurring Task Information Box appears.
21. In the Name box, type Project Meeting.
22. Press the tab key and enter 2h for duration of 2 hours.
Select Weekly for "Recurrence pattern" and check the box for
Friday. Leave "Recur every" as is. We have scheduled a
weekly 2-hour meeting every Friday for the duration of the
project. Click OK. (Notice the circular arrows in the indicator
column next to the task name).
19. Save the project before continuing.
Displaying Project Information in Views
Before closing out this project, we need to spend a little time
with views. A view is a format in which you can enter and/or
display information in MS Project. Your default view is known
as the Gantt view: it is made up of the Entry table on the left,
used to enter task information, and the Gantt chart on the right,
which graphically represents the task information on a
timescale.
Task and resource views in MS Project fall into three
categories: sheet views, chart and graph views, and form views.
Each view displays combinations of project information in
different ways. Understanding what is your current view and
changing views is critical in mastering MS Project.
Sheet views display task or resource information in a row and
column format (similar to MS Excel). Chart and graph views
provide a graphical representation of task or resource
information. Form views display task or resource information
in a format that displays a single task or single resource at a
time. You use a form view when you want to focus on detailed
information about a specific task or resource.
MS Project comes with 27 (MS Project 2010) predefined views.
1. From the Task tab and the View group, click Calendar. What
do you see?
2. Now click on Task Usage. How is this different?
3. Finally, click on Network Diagram. Graphical view of
tasks…
4. Return to the Gantt Chart view.
5. Another item to explore is the timescale for the Gantt chart.
On longer projects, you may not be able to see all the tasks on
the Gantt chart. You can use the scroll bars to the right and on
the bottom of the Gantt chart or you can adjust the timescale of
the chart (shown above). The top line of the timescale is
referred to as the Major timescale (Oct 6, ‘13, etc.) and the
bottom line as the Minor timescale (SMTWTFS). To adjust the
timescale, you can use the Zoom In and Zoom Out buttons on
the View toolbar under Zoom:
6. Click the Zoom In button (the one with the + sign). Notice
the Major timescale changes to a day and the Minor timescale
changes to 6-hour increments.
7. Now click on the Zoom Out button (the one with the - sign).
The Major timescale returns to a week and the Minor timescale
changes to day increments.
8. Click on the Zoom Out button again. Notice the Major
timescale changes to a month and the Minor timescale changes
to 3-day increments.
9. Click the Zoom In button again to return to the default of a
week and one-day increments.
You can also specify your own timescale by selecting the
Timescale dialog box on the View tab, Zoom group and the
down arrow under "Timescale:" or by right clicking on the time
scale on the Gantt chart.
Printing Project Schedules and Reports
To manage a project effectively, you will need to communicate
project information to a variety of people, therefore it is
important the reports printed are understandable by the readers.
You can print views and reports that meet the needs of a
specific person or group. MS Project comes with 27 predefined
views and 22 Visual reports and 29 standard reports. Before
you print a view or report, it should be previewed to determine
the number of pages that will be printed and if any additional
information needs to be added.
Using the PageSetup dialog box, you can select page
orientation, adjust scaling, change margins, and add or change
the headers and footers. You can also add page breaks to
control the flow of information. You can also create a legend at
the bottom of the Gantt chart to explain the symbols used in the
chart. (With the exception of the Project Summary report, you
must do this for each report/printout; it is NOT a universal page
setup!)
1. On the File tab, Print, then Page Setup.
The Page Setup dialog box appears:
2. Click the Header tag. The top box is the Preview box and the
bottom box is the Text box.
3. Select the Left tab next to Alignment. In the Text box, type
Lesson #1A on the first line. (The left corner will always be the
lab number, so make sure you change it in future labs!)
4. Select the Center tab. Next to the General box displaying the
text, "Page Number", click the down arrow and select Project
Title. Click Add.
Note: the project title is displayed in the Preview box (based
upon the information you entered in the Project Information
earlier). The text box shows the “&” sign or the "place marker"
for this information. The nice thing here is that if you ever
change the Project Information, the changes will automatically
appear on any reports that contain this information in the
header.
5. Press Enter. (The cursor should now be on the second line
for your center header information). From the same drop-down
tab, add Manager Name. Press Enter and add File name as your
third line and add Report Name as your fourth and final line.
6. Select the Right tab. Notice the seven icons below the text
box. Select the middle (or fourth icon) to insert the currentdate
in this section of your header.
7. On your own, make sure Page Number is in your footer and it
is center aligned and then press OK. Review the Print Preview
to view the changes. What is missing? Notice that there is
nothing displayed in the fourth line of the header for report
name? Why??? This is a view and not a defined report so there
is nothing to display in this field. In order to see the view
name, the parameter in the fourth line of the header would have
to be changed to View Name – we will NOT do this at this time.
The fourth line will display as a blank line when we are in a
view format and not a report format.
8. Click the File tab to return to the Gantt chart view.
Previewing and Printing Views and Reports
When submitting required printouts, if you are not bringing
them to class, from the Print Preview Page, take a screen shot
(in Windows <ALT><Prt Scr>) of the report and paste the
screen shot to a MS Word Document. Make sure to crop the
screen to show only the report. After cropping, resize the image
appropriately. If the printout is on more than 1 page, paste each
page individually.
Save the Word document containing printouts as
Week_1_Printouts_XXX.docx. Remember to replace "XXX" in
the file names with your initials and ensure that all of your files
are all clearly labeled and include your initials in the file name.
In the second part of this lesson, there will be more printouts to
add to the Week_1_Printout_XXX.docx file.
9. On the File tab, click the Print button. Place the mouse
pointer over the preview page. The pointer changes to a
magnifying glass.
10. Click the lower-left corner of the preview page. The view is
zoomed in so you can see the legend to the Gantt chart. If you
ever want to change the contents of this legend, you can go to
the same Page Setup in our previous steps and select Legend.
11. Click on the magnifying glass again to return to normal
view. Make sure the task names column and the duration
column can be seen in their entirety and the Gantt chart also
appears in your window.
12. Click Print and print this view. We have just printed the
Gantt chart view.
13. To view and print reports: From the Project tab, click
Reports in the Reports group.
14. The Reports box opens. Each icon represents a category of
reports. The first five (Overview, Current Activities, Costs,
Assignments and Workload) represent 22 predefined reports.
The last category, Custom, allows you to create your own
report.
15. Select Overview and then select Project Summary. The
Project Summary report now opens in Print Preview.
16. Select Page Setup for this report. Notice something
interesting? The header and footer (and legend and view) tabs
are grayed out. For some reason, only known to Microsoft, this
is the only report that you cannot change the header and footer.
To that end, it is imperative that you enter all appropriate
project information and project properties as discussed in the
lab!
17. Print the Project Summary. This is a very important report.
It lists all relevant summary information as to project progress
and achievement of your project objective.
18. On your own, find the report, Unstarted Tasks. Before you
print this report, make sure your header and footer contain the
appropriate information!Printthereport when all is well.
19. Save your file and exit MS Project.
When submitting required printouts, if you are not bringing
them to class, from the Print Preview Page, take a screen shot
(in Windows <ALT><Prt Scr>) of the report and paste the
screen shot to a MS Word Document. Make sure to crop the
screen to show only the report. After cropping, resize the image
appropriately. If the printout is on more than 1 page, paste each
page individually.
Save the Word document containing printouts as
Week_1_Printouts_XXX.docx and submit this file to the Week 1
iLab Dropbox, along with the MyLab1B_XXX.mpp file and the
completed Review Questions at the end of Lesson 1B.
Remember to replace "XXX" in the file names with your initials
and ensure that all of your files are all clearly labeled and
include your initials in the file name.
In part 2 of this lesson we will continue working with task
information by outline and linking these tasks and discussing
interdependencies and constraints.
1. On the Project tab, click Project Information. In the Project
Information dialog box, click Statistics. The following screen
should appear. Use this to check your progress…
MS Project Lesson #1, Part A Page 7
MS Project - Lesson #1B - Basics of Project Scheduling - Part 2Obj.docx

More Related Content

Similar to MS Project - Lesson #1B - Basics of Project Scheduling - Part 2Obj.docx

Work Breakdown Structure (WBS) ActivityYour organisati.docx
Work Breakdown Structure (WBS) ActivityYour organisati.docxWork Breakdown Structure (WBS) ActivityYour organisati.docx
Work Breakdown Structure (WBS) ActivityYour organisati.docxambersalomon88660
 
Microsoft® Project Painting Exercise CPMGT303 Version 111
Microsoft® Project Painting Exercise CPMGT303 Version 111Microsoft® Project Painting Exercise CPMGT303 Version 111
Microsoft® Project Painting Exercise CPMGT303 Version 111DioneWang844
 
Microsoft® project painting exercise cpmgt303 version 111
Microsoft® project painting exercise cpmgt303 version 111Microsoft® project painting exercise cpmgt303 version 111
Microsoft® project painting exercise cpmgt303 version 111amit657720
 
CSCI 714 Software Project Planning and EstimationLec.docx
CSCI 714 Software Project Planning and EstimationLec.docxCSCI 714 Software Project Planning and EstimationLec.docx
CSCI 714 Software Project Planning and EstimationLec.docxmydrynan
 
Chapter A Guide to Using Microsoft Project 2013 Exploring Pro.docx
Chapter A Guide to Using Microsoft Project 2013 Exploring Pro.docxChapter A Guide to Using Microsoft Project 2013 Exploring Pro.docx
Chapter A Guide to Using Microsoft Project 2013 Exploring Pro.docxmccormicknadine86
 
How to create S-Curve by MS Project 2013
How to create S-Curve by MS Project 2013How to create S-Curve by MS Project 2013
How to create S-Curve by MS Project 2013Ong-Art Sanpinit
 
How to Create S Curve by MS Project 2013
How to Create S Curve by MS Project 2013How to Create S Curve by MS Project 2013
How to Create S Curve by MS Project 2013Ong-Art Sanpinit
 
Project Management Quick Reference Guide For Microsoft Project 2007
Project Management Quick Reference Guide For Microsoft Project 2007Project Management Quick Reference Guide For Microsoft Project 2007
Project Management Quick Reference Guide For Microsoft Project 2007Toney Sisk
 
Brief tutorial on gantt charts
Brief tutorial on gantt chartsBrief tutorial on gantt charts
Brief tutorial on gantt chartsDr Ghaiath Hussein
 
Project Management Quick Reference Guide for Microsoft Project 2007
Project Management Quick Reference Guide for Microsoft Project 2007Project Management Quick Reference Guide for Microsoft Project 2007
Project Management Quick Reference Guide for Microsoft Project 2007Toney Sisk
 
Microsoft® Project Painting ExerciseMicrosoft® Project .docx
Microsoft® Project Painting ExerciseMicrosoft® Project .docxMicrosoft® Project Painting ExerciseMicrosoft® Project .docx
Microsoft® Project Painting ExerciseMicrosoft® Project .docxARIV4
 
Software engineering modeling lab lectures
Software engineering modeling lab lecturesSoftware engineering modeling lab lectures
Software engineering modeling lab lecturesmarwaeng
 
Project NameCommunication PlanOverviewEffective and .docx
Project NameCommunication PlanOverviewEffective and .docxProject NameCommunication PlanOverviewEffective and .docx
Project NameCommunication PlanOverviewEffective and .docxwkyra78
 
2010 ms project 2010 (2)
2010 ms project 2010 (2)2010 ms project 2010 (2)
2010 ms project 2010 (2)douggillis
 
2009 ms project 2010 (2)
2009 ms project 2010 (2)2009 ms project 2010 (2)
2009 ms project 2010 (2)constancemccrea
 
Creating a task list
Creating a task listCreating a task list
Creating a task listahmed hamza
 
For this project you may choose one that is of interest to you or .docx
For this project you may choose one that is of interest to you or .docxFor this project you may choose one that is of interest to you or .docx
For this project you may choose one that is of interest to you or .docxbudbarber38650
 

Similar to MS Project - Lesson #1B - Basics of Project Scheduling - Part 2Obj.docx (20)

Work Breakdown Structure (WBS) ActivityYour organisati.docx
Work Breakdown Structure (WBS) ActivityYour organisati.docxWork Breakdown Structure (WBS) ActivityYour organisati.docx
Work Breakdown Structure (WBS) ActivityYour organisati.docx
 
Omni plan 2-manual
Omni plan 2-manualOmni plan 2-manual
Omni plan 2-manual
 
Microsoft® Project Painting Exercise CPMGT303 Version 111
Microsoft® Project Painting Exercise CPMGT303 Version 111Microsoft® Project Painting Exercise CPMGT303 Version 111
Microsoft® Project Painting Exercise CPMGT303 Version 111
 
Microsoft® project painting exercise cpmgt303 version 111
Microsoft® project painting exercise cpmgt303 version 111Microsoft® project painting exercise cpmgt303 version 111
Microsoft® project painting exercise cpmgt303 version 111
 
CSCI 714 Software Project Planning and EstimationLec.docx
CSCI 714 Software Project Planning and EstimationLec.docxCSCI 714 Software Project Planning and EstimationLec.docx
CSCI 714 Software Project Planning and EstimationLec.docx
 
Chapter A Guide to Using Microsoft Project 2013 Exploring Pro.docx
Chapter A Guide to Using Microsoft Project 2013 Exploring Pro.docxChapter A Guide to Using Microsoft Project 2013 Exploring Pro.docx
Chapter A Guide to Using Microsoft Project 2013 Exploring Pro.docx
 
How to create S-Curve by MS Project 2013
How to create S-Curve by MS Project 2013How to create S-Curve by MS Project 2013
How to create S-Curve by MS Project 2013
 
How to Create S Curve by MS Project 2013
How to Create S Curve by MS Project 2013How to Create S Curve by MS Project 2013
How to Create S Curve by MS Project 2013
 
Project Management Quick Reference Guide
Project Management Quick Reference GuideProject Management Quick Reference Guide
Project Management Quick Reference Guide
 
Project Management Quick Reference Guide For Microsoft Project 2007
Project Management Quick Reference Guide For Microsoft Project 2007Project Management Quick Reference Guide For Microsoft Project 2007
Project Management Quick Reference Guide For Microsoft Project 2007
 
BhadaniS Microsoft Project Manual Training
BhadaniS Microsoft Project Manual TrainingBhadaniS Microsoft Project Manual Training
BhadaniS Microsoft Project Manual Training
 
Brief tutorial on gantt charts
Brief tutorial on gantt chartsBrief tutorial on gantt charts
Brief tutorial on gantt charts
 
Project Management Quick Reference Guide for Microsoft Project 2007
Project Management Quick Reference Guide for Microsoft Project 2007Project Management Quick Reference Guide for Microsoft Project 2007
Project Management Quick Reference Guide for Microsoft Project 2007
 
Microsoft® Project Painting ExerciseMicrosoft® Project .docx
Microsoft® Project Painting ExerciseMicrosoft® Project .docxMicrosoft® Project Painting ExerciseMicrosoft® Project .docx
Microsoft® Project Painting ExerciseMicrosoft® Project .docx
 
Software engineering modeling lab lectures
Software engineering modeling lab lecturesSoftware engineering modeling lab lectures
Software engineering modeling lab lectures
 
Project NameCommunication PlanOverviewEffective and .docx
Project NameCommunication PlanOverviewEffective and .docxProject NameCommunication PlanOverviewEffective and .docx
Project NameCommunication PlanOverviewEffective and .docx
 
2010 ms project 2010 (2)
2010 ms project 2010 (2)2010 ms project 2010 (2)
2010 ms project 2010 (2)
 
2009 ms project 2010 (2)
2009 ms project 2010 (2)2009 ms project 2010 (2)
2009 ms project 2010 (2)
 
Creating a task list
Creating a task listCreating a task list
Creating a task list
 
For this project you may choose one that is of interest to you or .docx
For this project you may choose one that is of interest to you or .docxFor this project you may choose one that is of interest to you or .docx
For this project you may choose one that is of interest to you or .docx
 

More from rosemarybdodson23141

Young Adulthood begins with the individual being on the verge of att.docx
Young Adulthood begins with the individual being on the verge of att.docxYoung Adulthood begins with the individual being on the verge of att.docx
Young Adulthood begins with the individual being on the verge of att.docxrosemarybdodson23141
 
Your abilities in international management have been recognize.docx
Your abilities in international management have been recognize.docxYour abilities in international management have been recognize.docx
Your abilities in international management have been recognize.docxrosemarybdodson23141
 
your 14 years daughter accidently leaves her purse open in the fam.docx
your 14 years daughter accidently leaves her purse open in the fam.docxyour 14 years daughter accidently leaves her purse open in the fam.docx
your 14 years daughter accidently leaves her purse open in the fam.docxrosemarybdodson23141
 
Young people are ruining the English languageIn your reflectio.docx
Young people are ruining the English languageIn your reflectio.docxYoung people are ruining the English languageIn your reflectio.docx
Young people are ruining the English languageIn your reflectio.docxrosemarybdodson23141
 
Young man drops out of school in seventh grade and becomes his mothe.docx
Young man drops out of school in seventh grade and becomes his mothe.docxYoung man drops out of school in seventh grade and becomes his mothe.docx
Young man drops out of school in seventh grade and becomes his mothe.docxrosemarybdodson23141
 
Young and the RestlessWeek 11 Couples Therapy Movie Experience .docx
Young and the RestlessWeek 11 Couples Therapy Movie Experience .docxYoung and the RestlessWeek 11 Couples Therapy Movie Experience .docx
Young and the RestlessWeek 11 Couples Therapy Movie Experience .docxrosemarybdodson23141
 
You-Attitude A Linguistic PerspectiveLllita RodmanThe Uni.docx
You-Attitude A Linguistic PerspectiveLllita RodmanThe Uni.docxYou-Attitude A Linguistic PerspectiveLllita RodmanThe Uni.docx
You-Attitude A Linguistic PerspectiveLllita RodmanThe Uni.docxrosemarybdodson23141
 
You  may have seen how financial news outlets provide real-time .docx
You  may have seen how financial news outlets provide real-time .docxYou  may have seen how financial news outlets provide real-time .docx
You  may have seen how financial news outlets provide real-time .docxrosemarybdodson23141
 
You  are responsible for putting together the Harmony Day celebr.docx
You  are responsible for putting together the Harmony Day celebr.docxYou  are responsible for putting together the Harmony Day celebr.docx
You  are responsible for putting together the Harmony Day celebr.docxrosemarybdodson23141
 
You wrote this scenario from the perspective of Behaviorism learni.docx
You wrote this scenario from the perspective of Behaviorism learni.docxYou wrote this scenario from the perspective of Behaviorism learni.docx
You wrote this scenario from the perspective of Behaviorism learni.docxrosemarybdodson23141
 
You worked closely with your IT managers to develop a complementing .docx
You worked closely with your IT managers to develop a complementing .docxYou worked closely with your IT managers to develop a complementing .docx
You worked closely with your IT managers to develop a complementing .docxrosemarybdodson23141
 
You work in the office of a personal financial planner. He has asked.docx
You work in the office of a personal financial planner. He has asked.docxYou work in the office of a personal financial planner. He has asked.docx
You work in the office of a personal financial planner. He has asked.docxrosemarybdodson23141
 
You work in the IT department of a financial services company that s.docx
You work in the IT department of a financial services company that s.docxYou work in the IT department of a financial services company that s.docx
You work in the IT department of a financial services company that s.docxrosemarybdodson23141
 
You work for the Jaguars Bank as the Chief Information Officer.  It .docx
You work for the Jaguars Bank as the Chief Information Officer.  It .docxYou work for the Jaguars Bank as the Chief Information Officer.  It .docx
You work for the Jaguars Bank as the Chief Information Officer.  It .docxrosemarybdodson23141
 
You work for OneEarth, an environmental consulting company that .docx
You work for OneEarth, an environmental consulting company that .docxYou work for OneEarth, an environmental consulting company that .docx
You work for OneEarth, an environmental consulting company that .docxrosemarybdodson23141
 
You work for an international construction company that has been con.docx
You work for an international construction company that has been con.docxYou work for an international construction company that has been con.docx
You work for an international construction company that has been con.docxrosemarybdodson23141
 
You will write your Literature Review Section of your EBP Projec.docx
You will write your Literature Review Section of your EBP Projec.docxYou will write your Literature Review Section of your EBP Projec.docx
You will write your Literature Review Section of your EBP Projec.docxrosemarybdodson23141
 
You work for an airline, a small airline, so small you have only one.docx
You work for an airline, a small airline, so small you have only one.docxYou work for an airline, a small airline, so small you have only one.docx
You work for an airline, a small airline, so small you have only one.docxrosemarybdodson23141
 
You work for a small community hospital that has recently updated it.docx
You work for a small community hospital that has recently updated it.docxYou work for a small community hospital that has recently updated it.docx
You work for a small community hospital that has recently updated it.docxrosemarybdodson23141
 
You work for a regional forensic computer lab and have been tasked w.docx
You work for a regional forensic computer lab and have been tasked w.docxYou work for a regional forensic computer lab and have been tasked w.docx
You work for a regional forensic computer lab and have been tasked w.docxrosemarybdodson23141
 

More from rosemarybdodson23141 (20)

Young Adulthood begins with the individual being on the verge of att.docx
Young Adulthood begins with the individual being on the verge of att.docxYoung Adulthood begins with the individual being on the verge of att.docx
Young Adulthood begins with the individual being on the verge of att.docx
 
Your abilities in international management have been recognize.docx
Your abilities in international management have been recognize.docxYour abilities in international management have been recognize.docx
Your abilities in international management have been recognize.docx
 
your 14 years daughter accidently leaves her purse open in the fam.docx
your 14 years daughter accidently leaves her purse open in the fam.docxyour 14 years daughter accidently leaves her purse open in the fam.docx
your 14 years daughter accidently leaves her purse open in the fam.docx
 
Young people are ruining the English languageIn your reflectio.docx
Young people are ruining the English languageIn your reflectio.docxYoung people are ruining the English languageIn your reflectio.docx
Young people are ruining the English languageIn your reflectio.docx
 
Young man drops out of school in seventh grade and becomes his mothe.docx
Young man drops out of school in seventh grade and becomes his mothe.docxYoung man drops out of school in seventh grade and becomes his mothe.docx
Young man drops out of school in seventh grade and becomes his mothe.docx
 
Young and the RestlessWeek 11 Couples Therapy Movie Experience .docx
Young and the RestlessWeek 11 Couples Therapy Movie Experience .docxYoung and the RestlessWeek 11 Couples Therapy Movie Experience .docx
Young and the RestlessWeek 11 Couples Therapy Movie Experience .docx
 
You-Attitude A Linguistic PerspectiveLllita RodmanThe Uni.docx
You-Attitude A Linguistic PerspectiveLllita RodmanThe Uni.docxYou-Attitude A Linguistic PerspectiveLllita RodmanThe Uni.docx
You-Attitude A Linguistic PerspectiveLllita RodmanThe Uni.docx
 
You  may have seen how financial news outlets provide real-time .docx
You  may have seen how financial news outlets provide real-time .docxYou  may have seen how financial news outlets provide real-time .docx
You  may have seen how financial news outlets provide real-time .docx
 
You  are responsible for putting together the Harmony Day celebr.docx
You  are responsible for putting together the Harmony Day celebr.docxYou  are responsible for putting together the Harmony Day celebr.docx
You  are responsible for putting together the Harmony Day celebr.docx
 
You wrote this scenario from the perspective of Behaviorism learni.docx
You wrote this scenario from the perspective of Behaviorism learni.docxYou wrote this scenario from the perspective of Behaviorism learni.docx
You wrote this scenario from the perspective of Behaviorism learni.docx
 
You worked closely with your IT managers to develop a complementing .docx
You worked closely with your IT managers to develop a complementing .docxYou worked closely with your IT managers to develop a complementing .docx
You worked closely with your IT managers to develop a complementing .docx
 
You work in the office of a personal financial planner. He has asked.docx
You work in the office of a personal financial planner. He has asked.docxYou work in the office of a personal financial planner. He has asked.docx
You work in the office of a personal financial planner. He has asked.docx
 
You work in the IT department of a financial services company that s.docx
You work in the IT department of a financial services company that s.docxYou work in the IT department of a financial services company that s.docx
You work in the IT department of a financial services company that s.docx
 
You work for the Jaguars Bank as the Chief Information Officer.  It .docx
You work for the Jaguars Bank as the Chief Information Officer.  It .docxYou work for the Jaguars Bank as the Chief Information Officer.  It .docx
You work for the Jaguars Bank as the Chief Information Officer.  It .docx
 
You work for OneEarth, an environmental consulting company that .docx
You work for OneEarth, an environmental consulting company that .docxYou work for OneEarth, an environmental consulting company that .docx
You work for OneEarth, an environmental consulting company that .docx
 
You work for an international construction company that has been con.docx
You work for an international construction company that has been con.docxYou work for an international construction company that has been con.docx
You work for an international construction company that has been con.docx
 
You will write your Literature Review Section of your EBP Projec.docx
You will write your Literature Review Section of your EBP Projec.docxYou will write your Literature Review Section of your EBP Projec.docx
You will write your Literature Review Section of your EBP Projec.docx
 
You work for an airline, a small airline, so small you have only one.docx
You work for an airline, a small airline, so small you have only one.docxYou work for an airline, a small airline, so small you have only one.docx
You work for an airline, a small airline, so small you have only one.docx
 
You work for a small community hospital that has recently updated it.docx
You work for a small community hospital that has recently updated it.docxYou work for a small community hospital that has recently updated it.docx
You work for a small community hospital that has recently updated it.docx
 
You work for a regional forensic computer lab and have been tasked w.docx
You work for a regional forensic computer lab and have been tasked w.docxYou work for a regional forensic computer lab and have been tasked w.docx
You work for a regional forensic computer lab and have been tasked w.docx
 

Recently uploaded

Computed Fields and api Depends in the Odoo 17
Computed Fields and api Depends in the Odoo 17Computed Fields and api Depends in the Odoo 17
Computed Fields and api Depends in the Odoo 17Celine George
 
Paris 2024 Olympic Geographies - an activity
Paris 2024 Olympic Geographies - an activityParis 2024 Olympic Geographies - an activity
Paris 2024 Olympic Geographies - an activityGeoBlogs
 
EPANDING THE CONTENT OF AN OUTLINE using notes.pptx
EPANDING THE CONTENT OF AN OUTLINE using notes.pptxEPANDING THE CONTENT OF AN OUTLINE using notes.pptx
EPANDING THE CONTENT OF AN OUTLINE using notes.pptxRaymartEstabillo3
 
18-04-UA_REPORT_MEDIALITERAСY_INDEX-DM_23-1-final-eng.pdf
18-04-UA_REPORT_MEDIALITERAСY_INDEX-DM_23-1-final-eng.pdf18-04-UA_REPORT_MEDIALITERAСY_INDEX-DM_23-1-final-eng.pdf
18-04-UA_REPORT_MEDIALITERAСY_INDEX-DM_23-1-final-eng.pdfssuser54595a
 
Blooming Together_ Growing a Community Garden Worksheet.docx
Blooming Together_ Growing a Community Garden Worksheet.docxBlooming Together_ Growing a Community Garden Worksheet.docx
Blooming Together_ Growing a Community Garden Worksheet.docxUnboundStockton
 
SOCIAL AND HISTORICAL CONTEXT - LFTVD.pptx
SOCIAL AND HISTORICAL CONTEXT - LFTVD.pptxSOCIAL AND HISTORICAL CONTEXT - LFTVD.pptx
SOCIAL AND HISTORICAL CONTEXT - LFTVD.pptxiammrhaywood
 
Enzyme, Pharmaceutical Aids, Miscellaneous Last Part of Chapter no 5th.pdf
Enzyme, Pharmaceutical Aids, Miscellaneous Last Part of Chapter no 5th.pdfEnzyme, Pharmaceutical Aids, Miscellaneous Last Part of Chapter no 5th.pdf
Enzyme, Pharmaceutical Aids, Miscellaneous Last Part of Chapter no 5th.pdfSumit Tiwari
 
call girls in Kamla Market (DELHI) 🔝 >༒9953330565🔝 genuine Escort Service 🔝✔️✔️
call girls in Kamla Market (DELHI) 🔝 >༒9953330565🔝 genuine Escort Service 🔝✔️✔️call girls in Kamla Market (DELHI) 🔝 >༒9953330565🔝 genuine Escort Service 🔝✔️✔️
call girls in Kamla Market (DELHI) 🔝 >༒9953330565🔝 genuine Escort Service 🔝✔️✔️9953056974 Low Rate Call Girls In Saket, Delhi NCR
 
Sanyam Choudhary Chemistry practical.pdf
Sanyam Choudhary Chemistry practical.pdfSanyam Choudhary Chemistry practical.pdf
Sanyam Choudhary Chemistry practical.pdfsanyamsingh5019
 
Final demo Grade 9 for demo Plan dessert.pptx
Final demo Grade 9 for demo Plan dessert.pptxFinal demo Grade 9 for demo Plan dessert.pptx
Final demo Grade 9 for demo Plan dessert.pptxAvyJaneVismanos
 
Call Girls in Dwarka Mor Delhi Contact Us 9654467111
Call Girls in Dwarka Mor Delhi Contact Us 9654467111Call Girls in Dwarka Mor Delhi Contact Us 9654467111
Call Girls in Dwarka Mor Delhi Contact Us 9654467111Sapana Sha
 
Introduction to AI in Higher Education_draft.pptx
Introduction to AI in Higher Education_draft.pptxIntroduction to AI in Higher Education_draft.pptx
Introduction to AI in Higher Education_draft.pptxpboyjonauth
 
A Critique of the Proposed National Education Policy Reform
A Critique of the Proposed National Education Policy ReformA Critique of the Proposed National Education Policy Reform
A Critique of the Proposed National Education Policy ReformChameera Dedduwage
 
History Class XII Ch. 3 Kinship, Caste and Class (1).pptx
History Class XII Ch. 3 Kinship, Caste and Class (1).pptxHistory Class XII Ch. 3 Kinship, Caste and Class (1).pptx
History Class XII Ch. 3 Kinship, Caste and Class (1).pptxsocialsciencegdgrohi
 
Solving Puzzles Benefits Everyone (English).pptx
Solving Puzzles Benefits Everyone (English).pptxSolving Puzzles Benefits Everyone (English).pptx
Solving Puzzles Benefits Everyone (English).pptxOH TEIK BIN
 
Employee wellbeing at the workplace.pptx
Employee wellbeing at the workplace.pptxEmployee wellbeing at the workplace.pptx
Employee wellbeing at the workplace.pptxNirmalaLoungPoorunde1
 
Painted Grey Ware.pptx, PGW Culture of India
Painted Grey Ware.pptx, PGW Culture of IndiaPainted Grey Ware.pptx, PGW Culture of India
Painted Grey Ware.pptx, PGW Culture of IndiaVirag Sontakke
 
How to Configure Email Server in Odoo 17
How to Configure Email Server in Odoo 17How to Configure Email Server in Odoo 17
How to Configure Email Server in Odoo 17Celine George
 
Presiding Officer Training module 2024 lok sabha elections
Presiding Officer Training module 2024 lok sabha electionsPresiding Officer Training module 2024 lok sabha elections
Presiding Officer Training module 2024 lok sabha electionsanshu789521
 

Recently uploaded (20)

Computed Fields and api Depends in the Odoo 17
Computed Fields and api Depends in the Odoo 17Computed Fields and api Depends in the Odoo 17
Computed Fields and api Depends in the Odoo 17
 
Paris 2024 Olympic Geographies - an activity
Paris 2024 Olympic Geographies - an activityParis 2024 Olympic Geographies - an activity
Paris 2024 Olympic Geographies - an activity
 
EPANDING THE CONTENT OF AN OUTLINE using notes.pptx
EPANDING THE CONTENT OF AN OUTLINE using notes.pptxEPANDING THE CONTENT OF AN OUTLINE using notes.pptx
EPANDING THE CONTENT OF AN OUTLINE using notes.pptx
 
18-04-UA_REPORT_MEDIALITERAСY_INDEX-DM_23-1-final-eng.pdf
18-04-UA_REPORT_MEDIALITERAСY_INDEX-DM_23-1-final-eng.pdf18-04-UA_REPORT_MEDIALITERAСY_INDEX-DM_23-1-final-eng.pdf
18-04-UA_REPORT_MEDIALITERAСY_INDEX-DM_23-1-final-eng.pdf
 
Blooming Together_ Growing a Community Garden Worksheet.docx
Blooming Together_ Growing a Community Garden Worksheet.docxBlooming Together_ Growing a Community Garden Worksheet.docx
Blooming Together_ Growing a Community Garden Worksheet.docx
 
SOCIAL AND HISTORICAL CONTEXT - LFTVD.pptx
SOCIAL AND HISTORICAL CONTEXT - LFTVD.pptxSOCIAL AND HISTORICAL CONTEXT - LFTVD.pptx
SOCIAL AND HISTORICAL CONTEXT - LFTVD.pptx
 
Enzyme, Pharmaceutical Aids, Miscellaneous Last Part of Chapter no 5th.pdf
Enzyme, Pharmaceutical Aids, Miscellaneous Last Part of Chapter no 5th.pdfEnzyme, Pharmaceutical Aids, Miscellaneous Last Part of Chapter no 5th.pdf
Enzyme, Pharmaceutical Aids, Miscellaneous Last Part of Chapter no 5th.pdf
 
call girls in Kamla Market (DELHI) 🔝 >༒9953330565🔝 genuine Escort Service 🔝✔️✔️
call girls in Kamla Market (DELHI) 🔝 >༒9953330565🔝 genuine Escort Service 🔝✔️✔️call girls in Kamla Market (DELHI) 🔝 >༒9953330565🔝 genuine Escort Service 🔝✔️✔️
call girls in Kamla Market (DELHI) 🔝 >༒9953330565🔝 genuine Escort Service 🔝✔️✔️
 
Sanyam Choudhary Chemistry practical.pdf
Sanyam Choudhary Chemistry practical.pdfSanyam Choudhary Chemistry practical.pdf
Sanyam Choudhary Chemistry practical.pdf
 
Final demo Grade 9 for demo Plan dessert.pptx
Final demo Grade 9 for demo Plan dessert.pptxFinal demo Grade 9 for demo Plan dessert.pptx
Final demo Grade 9 for demo Plan dessert.pptx
 
Call Girls in Dwarka Mor Delhi Contact Us 9654467111
Call Girls in Dwarka Mor Delhi Contact Us 9654467111Call Girls in Dwarka Mor Delhi Contact Us 9654467111
Call Girls in Dwarka Mor Delhi Contact Us 9654467111
 
Introduction to AI in Higher Education_draft.pptx
Introduction to AI in Higher Education_draft.pptxIntroduction to AI in Higher Education_draft.pptx
Introduction to AI in Higher Education_draft.pptx
 
A Critique of the Proposed National Education Policy Reform
A Critique of the Proposed National Education Policy ReformA Critique of the Proposed National Education Policy Reform
A Critique of the Proposed National Education Policy Reform
 
Model Call Girl in Tilak Nagar Delhi reach out to us at 🔝9953056974🔝
Model Call Girl in Tilak Nagar Delhi reach out to us at 🔝9953056974🔝Model Call Girl in Tilak Nagar Delhi reach out to us at 🔝9953056974🔝
Model Call Girl in Tilak Nagar Delhi reach out to us at 🔝9953056974🔝
 
History Class XII Ch. 3 Kinship, Caste and Class (1).pptx
History Class XII Ch. 3 Kinship, Caste and Class (1).pptxHistory Class XII Ch. 3 Kinship, Caste and Class (1).pptx
History Class XII Ch. 3 Kinship, Caste and Class (1).pptx
 
Solving Puzzles Benefits Everyone (English).pptx
Solving Puzzles Benefits Everyone (English).pptxSolving Puzzles Benefits Everyone (English).pptx
Solving Puzzles Benefits Everyone (English).pptx
 
Employee wellbeing at the workplace.pptx
Employee wellbeing at the workplace.pptxEmployee wellbeing at the workplace.pptx
Employee wellbeing at the workplace.pptx
 
Painted Grey Ware.pptx, PGW Culture of India
Painted Grey Ware.pptx, PGW Culture of IndiaPainted Grey Ware.pptx, PGW Culture of India
Painted Grey Ware.pptx, PGW Culture of India
 
How to Configure Email Server in Odoo 17
How to Configure Email Server in Odoo 17How to Configure Email Server in Odoo 17
How to Configure Email Server in Odoo 17
 
Presiding Officer Training module 2024 lok sabha elections
Presiding Officer Training module 2024 lok sabha electionsPresiding Officer Training module 2024 lok sabha elections
Presiding Officer Training module 2024 lok sabha elections
 

MS Project - Lesson #1B - Basics of Project Scheduling - Part 2Obj.docx

  • 1. MS Project - Lesson #1B - Basics of Project Scheduling - Part 2Objectives - MS Project 2010 · Creating a summary task · Working with subtasks · Establishing task dependencies · Specify lead and lag times A project task list can be as few as 10 or as many as several hundred tasks. With a large project, it can become difficult to locate a specific task. Using MS Project, you can organize the task list by creating a hierarchical structure. This process of structuring a task list is known as outlining. Outlining is used to organize common tasks into groups within the task list. The groups can represent phases of the project. In this lab, we will first use outlining to group the tasks of our project into phases. We will create a main summary task to represent the entire project and then several levels of summary tasks below the main summary task to represent the phases of the project. Creating an Outline 1. Log onto Windows. Open MS Project. 2. Open your project file that you created in Lesson 1, Part A (MyLab1a_XXX.mpp, where XXX are your initials.) 3. Save this file, using Save As, as MyLab1b_XXX.mpp, where XXX are your initials. Creating a hierarchical outline organizes the project tasks list into groups of tasks. Each group of tasks is preceded by a summary task, which describes the tasks within each group. The outline of a project generally begins with a main summary
  • 2. task. The main summary task is a brief description of the project and all tasks are subordinate to the main summary task. This main summary task is also helpful in generation of summary reports and cumulative totals in budgeting and resource management. 4. Click in the task namefield for task 1, Inventory current equipment. 5. Right click and select Insert Task. A new blank task row is inserted above and the task list is renumbered. 6. Type in (Student's Name) New System, where you enter your first and last name for student name. For example, if you are John Smith, your task will read John Smith's New System. Got it? 7. Do not worry about duration. 8. Since this is our main summary task, we need to indent all the other tasks to indicate that they are subtasks or subordinate tasks. 9. We need to select all the tasks below our summary task (from Inventory Equipment up to and including Project Meeting). One way to do this is to click in the task name field for task 2, Inventory Equipment. Click and drag so that all the task names are selected. (Similar to Excel). (You can also click in task 2 name field, hold down the shift key and then click in the last task name field.) 10. On the Task tab, you should see the following icons: This is the Schedule Ribbon. The left arrow outdents a task to a higher level; the right arrow indents a task lower level task, thus creating a summary task above. 11. Press the Indent button (the right arrow). The selected tasks are indented one level within the outline. Also notice the duration for your main summary task. How did it come up with
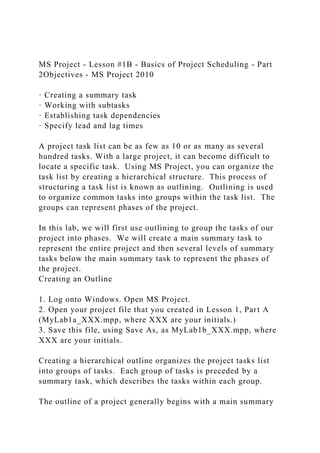
  • 3. 7 days? In addition, notice the change in the Gantt chart in representation of the summary task! 12. Press Crtl+Home. The cursor moves to the first task, your main summary task, and is bold indicating that it is a summary task. Your screen should like Figure 1. Figure 1 The image above is of the Workbreakdown Structure as currently designed. There are 15 total tasks. The main summary task is task 1, and the recurring Project Meeting task is task 15. Note: You can also automatically create a top level summary task, from the Gantt Chart Tools, Format tab. In the Show/Hide group, select the Project Summary task check box. The project title is inserted from the title box on the summary tab of the Project Properties dialog box. Since we are entering different information for our project main summary task name, we will not be practicing this procedure. Also, when this method is used, the automatic outline numbering format is changed, which we will get to in a few more steps. We now want to create additional summary tasks below our main summary task, perhaps to represent logical phases of the project. 1. Select the task name field for task 2, Inventory Current Equipment. 2. Right click and select Insert Task. 3. In the new Task 2 row, type Proposal Creation. (Again leave the default 1-day duration). 4. Select tasks 3 through 7 (Inventory Equipment to Research Products and Services). 5. Indent the tasks. These tasks are now subtasks to the
  • 4. summary task of Proposal Creation. When you insert tasks, you will also need to widen the Task Name Column. Your project should now look like figure 2. Figure 2 In the image above, the new summary task, "Proposal Creation" is indented one time beneath, the main summary task. The next five tasks are indented one time under "Proposal Creation". Hint: You can also indent tasks using the mouse. Position the mouse over the task name. The pointer changes to a two-way arrow. Drag the task one level to the right. 6. On your own create three more summary tasks or phases subordinate to the main summary task: · Vendor Selection, which will include the subtasks of Issue RFP's, Evaluate Bids and Award Contract. · Implement System, which will include the subtasks of Purchase Equipment, Install Wiring, Install Hardware, Install Software and Test System. · Leave Project Meeting where it is. We will treat this as subtask to the entire project. You will have to make use of the Outdent (Left Arrow) button to move your new summary tasks to the left. Make sure, however, you do not outdent too much! Compare your result with figure 3 and make any necessary correction before continuing the lab! Figure 3 In the image above, the WBS is now created with one main summary task, four summary tasks and then the work packages beneath each of the summaries. 7. If all looks good, save your file.
  • 5. Hiding and Showing the Outline By hiding and showing subtasks in the outline, you can display only the information needed. Not only does this cut down on the printing, but allows you to focus on any specific area of the project. The outline structure can be hidden or displayed using the outline buttons on the Formatting toolbar (as previously discussed) or by using the symbols next to each summary task. The (+) symbol indicates all the subtasks of the summary task are hidden and the (-) symbol indicates that all subtasks are shown. 8. Select your main summary task ((Your name) New System). Press the (-) symbol on the outlining toolbar to show only the main summary task. The main summary task should be the only task now listed. 9. Press the (+) symbol. Notice all the summary tasks and their subtasks now reappear. 10. Click on the - symbol next to the summary task, Proposal Creation. All the subtasks below Proposal Creation should now disappear. Click the + symbol next to the summary task, Proposal Creation. The subtasks for this summary task should now reappear. Viewing Outline Numbers MS Project automatically assigns an outline number to each task when you outline the schedule. (Do not confuse this with the task number, which appears in the first column of your entry table). The outline numbers are similar to a Work Breakdown Structure (WBS). 11. Click in main summary task name ("Your Name New Project). Select the Gantt Chart Tools Format Tab.
  • 6. 12. On the Show/Hide group, select the Outline Number check box 13. The outline numbers are now displayed in each task name field. (Once again, you may need to widen the Task Name column. 14. Leave the numbers displayed for now. Note: if you ever move a task (previously discussed in prior lab), MS Project will automatically renumber the outline for you. At this point, your screen should look like figure 4. Figure 4 In the image above, the outline numbers are added to the task name column. Task 1 is "1". The summary tasks beneath are Proposal creation, "1.1", Vendor Selection "1.2", Implement System, "1.3" and Project Meeting, "1.4". The work packages beneath each summary task continues the numbering. For example, Under Vendor Selection (1.1) the individual tasks are numbered 1.1.1, 1.1.2, 1.1.3, etc. Establishing Task Dependencies When a task list is first developed, the tasks are listed one after another, and the only consideration is the approximate logical order or sequence in which they should occur. Right now, our project looks like several isolated tasks that all start at the same time and finish according to each task's duration. In reality, a project is a series of related tasks and these relationships are
  • 7. called dependencies. There are four types of dependencies: Finish-to-Start (FS) The finish of one task marks the start of another. This will be the default when we link since it is the most common. Start-to-Start (SS) The start of one task marks the start of another. In other words, both tasks may start at the same time. This is what our Gantt Chart is currently showing. Finish-to-Finish (FF) The finish of one task marks the finish of another. In other words, both tasks may finish at the same time. Start-to-Finish (SF) The start of one task marks the finish of another task. This is the most uncommon dependency. When a task is initially entered into MS Project, it is scheduled to begin on the project start date. By linking tasks, you establish a dependency that determines the sequence of tasks. MS Project then schedules the tasks by setting the start and finish dates of each task. The Gantt bars in the Gantt chart view are then moved to the appropriate date on the timescale and link lines are drawn to display the dependency. 1. Select all the tasks in your project by clicking on the task name for the first task (Task #1) your main summary task, and then dragging the cursor down to the last task, Project Meeting. 2. On the Task toolbar, in the Schedule ribbon press the Link Tasks button. 3. Each task is now linked in a finish-to-start dependency. Your screen should look similar to figure 5. Link Line
  • 8. Figure 5 In the image above, arrows link the connected tasks. You need to notice several things at this point: · The duration of your main summary task and your summary tasks has now changed. Do you know why? · The duration of your main summary task may read ####. This means the number is too big for the size of the column, similar to an Excel spreadsheet. Widen the column so the number will appear by positioning your cursor to the right edge of the column header for Duration. The cursor will turn to a double horizontal arrow. Double click. You should see 44.25 days. · On the Gantt chart, scroll to the end of the project and notice how the summary tasks are linked. · Also notice there is no link to the recurring task of Project Meeting. · Finally every task link is a Finish-to-Start dependency. 4. Now, select all the tasks of your project again. 5. Press the Unlink Tasks button Task toolbar, in the Schedule ribbon. 6. All dependencies and links should be gone and your entry table should look similar to figure 4 again. 7. Another way to link tasks, and perhaps better, is to select two or more tasks before linking. 8. Click in task name 3, Inventory Current Equipment. Drag to select all the tasks under the summary task of Proposal Creation (see figure 6). Figure 6 9. Click on the Link Tasks Button. Only these tasks should now
  • 9. show link lines on the Gantt chart. 10. On your own, link the subtasks under Vendor Selection. 11. On your own, link the subtasks under Implement System. 12. Compare your results to figure 7. Figure 7 In the image above, the project duration is 20 days. Proposal Creation equals 20 days, Vendor Selection, 12 days, Implement System, 12 days and Project Meeting 0.25 days. If you are paying attention, you will notice one possible problem with this dependency list: each phase or summary task starts at the same time. Might be hard to implement system before awarding the contract! 13. We need to show the dependencies between the work under the summary tasks. However, we cannot use the previous method because these tasks are non-contiguous. 14. To link non-contiguous tasks; follow the next steps very carefully because it is extremely important that you select tasks in the proper order! 15. Click in the summary task name for Proposal Creation. 16. Hold down the Control key on your keyboard while you do the next two instructions. 17. Click in the summary task name for Vendor Selection. 18. Click in the summary task name for Implement System. 19. Release the Control key and press the Link Tasks button on the main toolbar. 20. Check your Gantt chart to see if the summary tasks were linked properly and in the right order. Also check the main summary task duration. It should read 44 days. If not, unlink all tasks and begin this section again. 21. One last thing…. It is NOT a good idea to link summary tasks to summary tasks. Why? When doing project work it is the LAST task in a group that will initiate the NEXT task – not
  • 10. the summary tasks to each other. So, on your own, unlink summary tasks and relink them using the appropriate task. (Task 7 is the predecessor task to Task 9, and Task 11 is the predecessor to Task 13.) When you are done, your table should look like: The image above shows the entire project linked and a total duration of 44 days. Changing Task Dependencies Because not all tasks need to be in a Finish-to-Start dependency, you can change the dependencytype. Currently all of our tasks, except the main summary task (which is rarely linked to any other task except to another project) and our recurring task of Project Meeting, are defaulting to a Finish-to- Start dependency. However, we want to make it clear that the tasks of installing wire, hardware, and equipment must finish at the same time before we begin testing the system. So how do we do that? First, we need to clarify two important terms, predecessor and successor. A task that must start or finish before another task can begin is called a predecessor (or independent) task. A task that depends on the start or finish of a preceding task is called a successor (or dependent) task. In our example project, we will make the assumption that we cannot begin any installation process until purchasing has been completed. However, we make the assumption that installing the wiring, hardware and the software can begin any time after the purchasing, but all tasks must finish at the same time before we begin testing.
  • 11. 1. Click in the subtask name field for Install Wiring. 2. Right-click and select Information from the pop-up menu. 3. The Task Information dialog box should now appear. Select the Predecessor tab. Figure 8 The Task Information dialog box details information about a particular task, including notes. This information is important when troubleshooting problems with scheduling, etc. 4. The predecessor information states that the subtask, Purchase Equipment, is the only predecessor task to the Install Wiring successor task. Under Type is listed Finish-to-Start (FS). This is what we want, so press OK to close the Task Information box. 5. Select the task name for Install Hardware and open the Task Information for this task. Select the predecessor tab. 6. The predecessor task for Install Hardware is Install Wiring. We want to indicate that the dependency of these two tasks is a Finish-to-Finish, since we need these tasks to finish at the same time. 7. Click the Finish-to-Start (FS) type drop-down box for the predecessor task of Install Wiring and select Finish-to-Finish. Figure 9 8. Press Ok. Scroll out on the Gantt chart to view how the dependencies look (Figure 10). Figure 10 9. On your own, change the dependency between Install Software (successor) and Install Hardware (predecessor) to a Finish-to-Finish (FF). Remember, the successor task is the one you want to click on! Your Gantt chart should now look like figure 11.
  • 12. Figure 11 In the image above, arrows for Finish to Finish tasks link from the end of one Gantt bar to the end of its successor. 10. While the chart clearly shows the three tasks finishing at the same time (also reducing the number of days to complete this phase to 8 days), the chart gives the indication that once Install Software and only Install Software is finished, can Test System begin. In reality, allthreetasks, Install Wiring, Install Hardware and Install Software must finish before Test System. We need to clearly indicate that Test System has more than one predecessor task. 11. To add another predecessor task to a successor task, we can use the Task Information. 12. Select the task name, Test System, and open the Task Information for this task. 13. Click in the next row under Task Name to open a drop-down menu and select Install Hardware. Figure 12 14. Leave the type as Finish-to-Start. 15. Add Install Wiring in the next row and leave as Finish-to- Start. 16. Press OK. While the duration of the summary task does not change, notice the change in your Gantt chart. We are now clearly indicating that all three tasks are predecessors to the Test System task. Figure 13 There is one other detail missing from this arrangement or flow. Remember that a successor task can have more than one predecessor task. In the case of Install Hardware and Install
  • 13. Software, they also are dependent on the Purchase Equipment task. Therefore, we need to add that information to them. 17. Add Purchase Equipment as a predecessor task to Install Hardware, with a Finish-to-Start dependency. 18. Add Purchase Equipment as a predecessor task to Install Software, with a Finish-to-Start dependency. Look at your Gantt chart to see the difference. Can you detect it? There are many ways to accomplish what we just did. However, the task information properties dialog box is the best way to troubleshoot. If you ever make a mistake in linking tasks or dependencies, I have found the best way is to select the task or tasks you want to correct and unlink the tasks and start over again. Trust me… (Note: another way to link tasks and set dependencies is to enter the information directly in the Predecessors Column of your Table: Entry. To see this column, just move the divider to see the column or use the scroll bar at the bottom of the table. Notice the syntax of setting dependencies other than Finish-to- Start. This is another handy way to quickly set up dependencies; yet because it only gives the number of the task, it is harder to ensure that you have the right task(s) without the actual name of the task). 19. Check your work and if you feel everything looks right (40 days total for the total project, 20 days for Project Creation phase, 12 days for Vendor Selection phase, and 8 days total for Implement System phase), save the file; if not, unlink all tasks and start again at the section on dependencies and linking. Understanding Lag and Lead Time
  • 14. In addition to dependency type, you can further define the true impact of task relationships using lead time and lag time. Lead time creates an overlap in a dependency that can shorten the project duration. For example, if you specify a lead time of one day on a Finish-to-Start dependency, the two tasks overlap in time by one day. The last day of the first task takes place while the first day of the second task takes place. (Analogous to getting “a head start”). Lag time creates a delay, or gap, in the task dependency that can lengthen the project duration. For example, if I specify a lag time of one day, the successor task begins one day after the predecessor task in a Finish-to-Start dependency. To demonstrate lead time, let's say that Install Wiring can begin prior to the finish of Purchase Equipment (at least we can start doing some preparation ahead of time). 1. Bring up the task information for the task Install Wiring. 2. Select the Predecessor tab. 3. Under the column Lag, you should see 0d for 0 days for Purchase Equipment. 4. In the lag cell, type in the number -1 (that's minus one). 5. Press OK. Check the duration for the phase Implement System. It should now have been reduced by one day to 7 days. Also look at your Gantt chart and notice that the start date for Install Wiring has now moved to prior to the finish of Purchase Equipment (figure 14). Figure 14 To demonstrate lag time, let's say that we want to wait two days after evaluating bids before awarding the contract (a cooling off period).
  • 15. 6. Bring up the taskinformation for the task AwardContract. 7. Select the Predecessor tab. 8. Under the column Lag for the task Evaluate Bids, type in the number 2. 9. Press OK. Check the duration for the phase Vendor Selection. It is now 14 days. Also look at the effect on your Gantt chart (now 41 days). One final item: If you notice that your project meeting only occurs once, in the first week of the project. What if you want to schedule it for everyFriday until the end of the Project? In this case, you would bring up the Recurring Project Information for the summary task Project Meeting and indicate when the meetings will end (such as the end of the project) or the number of times the meetings will occur. 1. If I want to have project meetings every Friday until the end of the project, I need to know when the project will finish. 2. Select File Tab, select the Info tab. 3. The finish date should be December 4, 2013. (If it isn’t, go back to lag and lead time section). 4. Go back to the Task Tab and select the summary task Project Meeting. (Make sure the Project Meeting is number 1.4 and not 1.3.6. If it is the later, you need to “outdent” or move the task in the outline to the left). 5. Right-click and select Information from the menu. 6. In the Range of Recurrence section, change the End by date to December 4, 2013 and Press OK (Figure 15). Figure 15 7. Hide the subtasks under Project Meeting to just show the Project Meeting summary task! (The total duration of the Project Meeting task is 35.25 days. Do you know why?).
  • 16. Checkpoint: From the File Tab, select Info and then Project Information. You will be given 2 choices, Advanced Properties and Project Statistics. click Project Statistics. If your screen matches figure 16 (below), then save your project file and print the following reports: 1. Your Gantt chart view and include only these columns from the table: Task ID, Indicators, Task Mode, Task Name, and Duration. To do this, slide the Gantt Chart divider to the left or right as necessary. (All columns must be wide enough to see the entire information in the fields). DO NOT DELETE COLUMNS. Check to make sure your project information is correctly inserted into your printouts, in the headers and footers. Do NOT forget that this is lab #1B… Also, make sure your Gantt timeline is set to the default of weekly for major timeframe and daily for minor time frame. Your print out should be no more than 3 pages. 2. Project Summary Report 3. Unstarted Tasks Report, with appropriate header/footer information. Fit this printout to 1 page. 4. Attach your printouts to the back of the Review Questions sheet IN ORDER, or submit to the dropbox. When submitting required printouts, if you are not bringing them to class, from the Print Preview Page, take a screen shot (in Windows <ALT><Prt Scr>) of the report and paste the screen shot to a MS Word Document. Make sure to crop the screen to show only the report. After cropping, resize the image appropriately. If the printout is on more than 1 page, paste each page individually. Add these images to the Word document, containing printouts created in Part A, Week_1_Printouts_XXX.docx. Remember to replace "XXX" in the file names with your initials and ensure that all of your files are all clearly labeled and include your initials in the file name. Submit this file to the Weekly iLab
  • 17. Dropbox. Figure 16 Printing tip: There is an easier way to specify which columns of the table you want to print without worrying about how your screen appears. While in Page Setup, after you change your header and footer information, select the tab View. You can quickly specify to print all columns or the first X columns. Try it out.) When you have completed this lesson, please save it as MyLab1b_XXX.mpp and submit the file to the Weekly iLab Dropbox. Remember to replace "XXX" in the file names with your initials and ensure that all of your files are all clearly labeled and include your initials in the file name. Also, complete the following page. Submit this Review Question sheet to the Weekly iLab Dropbox. Review Questions Name ____________________________ Answer the following questions (use MS Project Help, if necessary): 1. What is the difference between a main summary task and a summary task? 2. On the View Tab, what does the Outline button with plus and minus signs do?
  • 18. 3. What is a milestone? 4. What predefined report can you not make changes to the header and footer? 5. Give a real-world example of a) A successor task requiring lead time b) A successor task requiring lag time Turn in this sheet with your MS Project file to the Week 1 iLab Dropbox. MS Project Lesson #1, Part B Page 12 MS Project - Lesson #1A - Basics of Project Scheduling - Part 1 Objectives - MS Project 2010 · Understanding Project Scheduling · Introduction to Microsoft Project · Working with Project Tasks
  • 19. · Basic views, time scales and reports Whether you are a project manager or not, project management techniques are extremely helpful in meeting goals and objects. Project management techniques define a path to a specified goal and then supervise the implementation. MS Project can help you establish your initial plan as well as monitor progress. MS Project can quickly produce reports and other information that will help keep management, customers, and your project team informed. To get the most from MS Project, not only do you need to understand project management terminology, you also need to be familiar with the software itself. Therefore, do not attempt to quickly finish the lab, but take your time and read all instructions carefully. Understanding Project Scheduling A typical project is composed of tasks and resources. After tasks are identified, you organize the tasks in a logical hierarchy, also called a Work Breakdown Structure (WBS). Eventually, this sequence will show the interdependencies of each task. Then each task is given a duration. In MS Project, this can be in weeks, days, hours or minutes. You can also specify a milestone, which will represent an event that marks the completion of a group of related tasks. To accomplish any task, you need resources. Resources can include people, equipment, material or special facilities necessary to complete a task. Resource availability and scheduling are important constraints to completing a task. Once you establish a plan, complete with tasks and resources, you will often need to refine the plan before saving it as a baseline. The baseline is your guideline to help manage the project.
  • 20. MS Project Basics When you first start MS Project, a blank project file is displayed in Gantt Chart View. (If you need to open an existing MS Project file, the file extension is .mpp.) Let's take a look at the main window: Select All Entry Table Task ID Gantt Chart Divider View Bar The above image is the default screen for MS Project 2010. The right side of the screen consists of the area for the Gantt Chart. The left side of the screen is the Entry table where tasks, durations, and other task information is entered. The Entry Table and Gantt Chart are separated by a moveable Divider Pay particular attention to this layout. The Entry table is where we enter our tasks and durations. The Gantt chart will eventually show our tasks and durations in a graphical bar chart. The other part of significance is the divider. This allows you to show more or less of the Entry table/Gantt chart. In Project 2010 the menu bar is set up into Ribbons. To access the various ribbons, Tabs are selected across the top of the menu bar. Within the ribbon the various sections are divided into groups: TABS
  • 21. GROUPS The above image displays the Microsoft Ribbon in the top of the window. The ribbon is navigated via Tabs. Within each tab are Groups and within each of the Groups are individual commands. The first step in creating a project is establishing the project information. 1. Select Project Information from the Project tab and the Properties group The Project Information is used for information that is critical to the scheduling of tasks and resources. It contains the start date and finish date of the overall project, the current date (taken from the computer), and which calendar you will be using. You must always enter this information when creating a new project. 2. Enter the starting date of this project as October 9, 2013. (Note: you can only enter the start date or the finish date, but not both!). 3. Leave the other information as is and Press OK. 4. Next we are going to define other project information. Select File on the Project Tab. Next select, Info. On the right hand side of the screen select Project Information and then Advanced Properties.
  • 22. 5. The Project Properties screen appears and the Summary tab should be selected. 6. In the Title box, type Maynard Furniture Company Project. 7. In the Subject box, type New System. 8. In the Author's and the Manager's box, type in your name. This information will be displayed on reports. In the Company box, enter MGMT404 followed by your professor’s name. Click OK. 9. Save the project as MyLab1a_XXX.mpp (where XXX are your initials).Basic Setup 1. Before we start entering data there are a few setup tasks we need to do. 2. The first is to change how MS Project calculates the schedule. (We will explain this in week 5) 3. Go File, then Options. The Project Options window opens. 4. Select Schedule. The Project Options window now should be visible. 5. Under Scheduling options for this project check the box labeled "New tasks are effort driven"
  • 23. 6. Click OK to close the window. 7. Next, select the Gantt Chart Tools Format tab from the ribbon. Click the check box to show the tasks that will be on the Critical Path. 8. Select the Task tab. With these settings we are ready to start entering data Entering tasks 1. Click in the first field in the Task Name column. Type Inventory current equipment. 2. Press the tab key. The information is entered and the selection moves to the Duration column for task 1. (You may need to slide the divider to the right to see the column). Also notice the task is represented on the Gantt chart. 3. Change the duration to 3 days by typing 3 and press enter. Notice the duration "days" or the letter "d" is automatically assumed. If different, you would enter m for minutes, h for hours, d for days or w for weeks after the number, such as 3w
  • 24. would be three weeks). 4. By default, MS Project 2010 enters tasks as Manually Scheduled. This allows the user to schedule individual dates for the tasks. We however, want MS Project to schedule the tasks for us. 5. For task 1, In the Task Mode column, select Auto Schedule. This will enable MS Project to automatically assign the start and end dates for each task. 6. To change this as the default mode, at the bottom left of the screen there is a button where you can change this default setting. Click on this and change the setting so all new tasks are set to be Auto Scheduled. You can also do this from the Task tab, Tasks group and selecting the Mode button, or from the Options screen we looked at earlier. 7. Enter the following tasks and durations for this project: Assess current department needs 2 days Design and diagram new system 5 days Proposal to accounting 3 days Research products and services 7 days Issue RFPs 7 days Evaluate bids 5 days Award contract 1 day Meet with vendor 1 day Purchase equipment 4 days Install wiring 3 days Install hardware 2 days Install software 2 days (Note: it is very important that you make any changes to these durations prior to assigning resources. If you need to change duration after assigning resources, you should unassign all resources, change the duration and then re-assign the
  • 25. resources!) 8. When you enter tasks, note that “1 Day?” is the automatic default for duration. (You may need to slide the divider to the right to see the column). Also notice the task is represented on the Gantt chart. For durations that are only 1 day, make sure to manually type 1 and then the <Enter> key to remove the “?”. 9. Next make sure each task is "Auto Scheduled" when you are finished. 10. Notice as you enter each task and the duration, how the tasks are presented on the Gantt chart. (Tip: By default MS Project 2010 automatically wraps the text on the task names. Some readers may find this not very clear. To see the entire task name on one line, position your cursor on the vertical line between the Task Name column header and the Duration column header. When the cursor turns to a double arrow, either drag the line to the right to increase the column width or double-click. Another method is to double click on the Task Name column header and select Best Fit. To see the Duration column, move the divider between the tasks and the Gantt chart. When you are done, then also adjust row height). 11. The text wrap can be toggled on and off from the Gantt Chart Tools Format tab, in the Columns group and the Wrap Text icon. Please turn this off now. 12. Change the duration of the task Award contract to 0 days. Notice the symbol on the Gantt chart. This is a milestone task, which has no duration but is used to mark progress in a project.
  • 26. 13. What if you need to insert a task later? Easy. For example, select task #13 Install software and Right click and select click Insert Task. A new task row will now be inserted above the current task. 14. Type Test system as your new task and duration of 1 day. (Remember next to select "Auto Scheduled". 15. Since “Test system” actually should be our last task, we need to move it. Therefore click (but do not hold down the mouse button) the task ID for task #13 - Test system. The entire row should be selected. Task ID 16. With the pointer still positioned on the task ID, drag down until a horizontal gray bar is displayed after task #14. Then release. Test system should now be your last task. 17. What if you want to delete a task? Click anywhere in the row for the task Meet with vendor. Right click and select click Delete Task. Another type of task you may want to enter is a recurring task, such as a team meeting, etc. Generally recurring tasks are not included on a project, but it helps in resource scheduling. 18. Below the last task (task #13: Test System), click in the Task Name Column, but do not type anything. 19. From the Task tab in the Insert group, click Select the arrow under Task and choose Recurring Task.
  • 27. 20. The Recurring Task Information Box appears. 21. In the Name box, type Project Meeting. 22. Press the tab key and enter 2h for duration of 2 hours. Select Weekly for "Recurrence pattern" and check the box for Friday. Leave "Recur every" as is. We have scheduled a weekly 2-hour meeting every Friday for the duration of the project. Click OK. (Notice the circular arrows in the indicator column next to the task name). 19. Save the project before continuing. Displaying Project Information in Views Before closing out this project, we need to spend a little time with views. A view is a format in which you can enter and/or display information in MS Project. Your default view is known as the Gantt view: it is made up of the Entry table on the left, used to enter task information, and the Gantt chart on the right, which graphically represents the task information on a timescale. Task and resource views in MS Project fall into three categories: sheet views, chart and graph views, and form views. Each view displays combinations of project information in different ways. Understanding what is your current view and changing views is critical in mastering MS Project. Sheet views display task or resource information in a row and column format (similar to MS Excel). Chart and graph views provide a graphical representation of task or resource information. Form views display task or resource information
  • 28. in a format that displays a single task or single resource at a time. You use a form view when you want to focus on detailed information about a specific task or resource. MS Project comes with 27 (MS Project 2010) predefined views. 1. From the Task tab and the View group, click Calendar. What do you see? 2. Now click on Task Usage. How is this different? 3. Finally, click on Network Diagram. Graphical view of tasks… 4. Return to the Gantt Chart view. 5. Another item to explore is the timescale for the Gantt chart. On longer projects, you may not be able to see all the tasks on the Gantt chart. You can use the scroll bars to the right and on the bottom of the Gantt chart or you can adjust the timescale of the chart (shown above). The top line of the timescale is referred to as the Major timescale (Oct 6, ‘13, etc.) and the bottom line as the Minor timescale (SMTWTFS). To adjust the timescale, you can use the Zoom In and Zoom Out buttons on the View toolbar under Zoom: 6. Click the Zoom In button (the one with the + sign). Notice the Major timescale changes to a day and the Minor timescale changes to 6-hour increments.
  • 29. 7. Now click on the Zoom Out button (the one with the - sign). The Major timescale returns to a week and the Minor timescale changes to day increments. 8. Click on the Zoom Out button again. Notice the Major timescale changes to a month and the Minor timescale changes to 3-day increments. 9. Click the Zoom In button again to return to the default of a week and one-day increments. You can also specify your own timescale by selecting the Timescale dialog box on the View tab, Zoom group and the down arrow under "Timescale:" or by right clicking on the time scale on the Gantt chart. Printing Project Schedules and Reports To manage a project effectively, you will need to communicate project information to a variety of people, therefore it is important the reports printed are understandable by the readers. You can print views and reports that meet the needs of a specific person or group. MS Project comes with 27 predefined views and 22 Visual reports and 29 standard reports. Before you print a view or report, it should be previewed to determine the number of pages that will be printed and if any additional information needs to be added. Using the PageSetup dialog box, you can select page orientation, adjust scaling, change margins, and add or change the headers and footers. You can also add page breaks to control the flow of information. You can also create a legend at the bottom of the Gantt chart to explain the symbols used in the chart. (With the exception of the Project Summary report, you must do this for each report/printout; it is NOT a universal page setup!)
  • 30. 1. On the File tab, Print, then Page Setup. The Page Setup dialog box appears: 2. Click the Header tag. The top box is the Preview box and the bottom box is the Text box. 3. Select the Left tab next to Alignment. In the Text box, type Lesson #1A on the first line. (The left corner will always be the lab number, so make sure you change it in future labs!) 4. Select the Center tab. Next to the General box displaying the text, "Page Number", click the down arrow and select Project Title. Click Add. Note: the project title is displayed in the Preview box (based upon the information you entered in the Project Information earlier). The text box shows the “&” sign or the "place marker" for this information. The nice thing here is that if you ever change the Project Information, the changes will automatically appear on any reports that contain this information in the header. 5. Press Enter. (The cursor should now be on the second line for your center header information). From the same drop-down tab, add Manager Name. Press Enter and add File name as your third line and add Report Name as your fourth and final line. 6. Select the Right tab. Notice the seven icons below the text box. Select the middle (or fourth icon) to insert the currentdate in this section of your header. 7. On your own, make sure Page Number is in your footer and it is center aligned and then press OK. Review the Print Preview
  • 31. to view the changes. What is missing? Notice that there is nothing displayed in the fourth line of the header for report name? Why??? This is a view and not a defined report so there is nothing to display in this field. In order to see the view name, the parameter in the fourth line of the header would have to be changed to View Name – we will NOT do this at this time. The fourth line will display as a blank line when we are in a view format and not a report format. 8. Click the File tab to return to the Gantt chart view. Previewing and Printing Views and Reports When submitting required printouts, if you are not bringing them to class, from the Print Preview Page, take a screen shot (in Windows <ALT><Prt Scr>) of the report and paste the screen shot to a MS Word Document. Make sure to crop the screen to show only the report. After cropping, resize the image appropriately. If the printout is on more than 1 page, paste each page individually. Save the Word document containing printouts as Week_1_Printouts_XXX.docx. Remember to replace "XXX" in the file names with your initials and ensure that all of your files are all clearly labeled and include your initials in the file name. In the second part of this lesson, there will be more printouts to add to the Week_1_Printout_XXX.docx file. 9. On the File tab, click the Print button. Place the mouse pointer over the preview page. The pointer changes to a magnifying glass. 10. Click the lower-left corner of the preview page. The view is zoomed in so you can see the legend to the Gantt chart. If you ever want to change the contents of this legend, you can go to the same Page Setup in our previous steps and select Legend.
  • 32. 11. Click on the magnifying glass again to return to normal view. Make sure the task names column and the duration column can be seen in their entirety and the Gantt chart also appears in your window. 12. Click Print and print this view. We have just printed the Gantt chart view. 13. To view and print reports: From the Project tab, click Reports in the Reports group. 14. The Reports box opens. Each icon represents a category of reports. The first five (Overview, Current Activities, Costs, Assignments and Workload) represent 22 predefined reports. The last category, Custom, allows you to create your own report. 15. Select Overview and then select Project Summary. The Project Summary report now opens in Print Preview. 16. Select Page Setup for this report. Notice something interesting? The header and footer (and legend and view) tabs are grayed out. For some reason, only known to Microsoft, this is the only report that you cannot change the header and footer. To that end, it is imperative that you enter all appropriate project information and project properties as discussed in the lab! 17. Print the Project Summary. This is a very important report. It lists all relevant summary information as to project progress and achievement of your project objective. 18. On your own, find the report, Unstarted Tasks. Before you print this report, make sure your header and footer contain the
  • 33. appropriate information!Printthereport when all is well. 19. Save your file and exit MS Project. When submitting required printouts, if you are not bringing them to class, from the Print Preview Page, take a screen shot (in Windows <ALT><Prt Scr>) of the report and paste the screen shot to a MS Word Document. Make sure to crop the screen to show only the report. After cropping, resize the image appropriately. If the printout is on more than 1 page, paste each page individually. Save the Word document containing printouts as Week_1_Printouts_XXX.docx and submit this file to the Week 1 iLab Dropbox, along with the MyLab1B_XXX.mpp file and the completed Review Questions at the end of Lesson 1B. Remember to replace "XXX" in the file names with your initials and ensure that all of your files are all clearly labeled and include your initials in the file name. In part 2 of this lesson we will continue working with task information by outline and linking these tasks and discussing interdependencies and constraints. 1. On the Project tab, click Project Information. In the Project Information dialog box, click Statistics. The following screen should appear. Use this to check your progress… MS Project Lesson #1, Part A Page 7