Download as PDF, PPTX


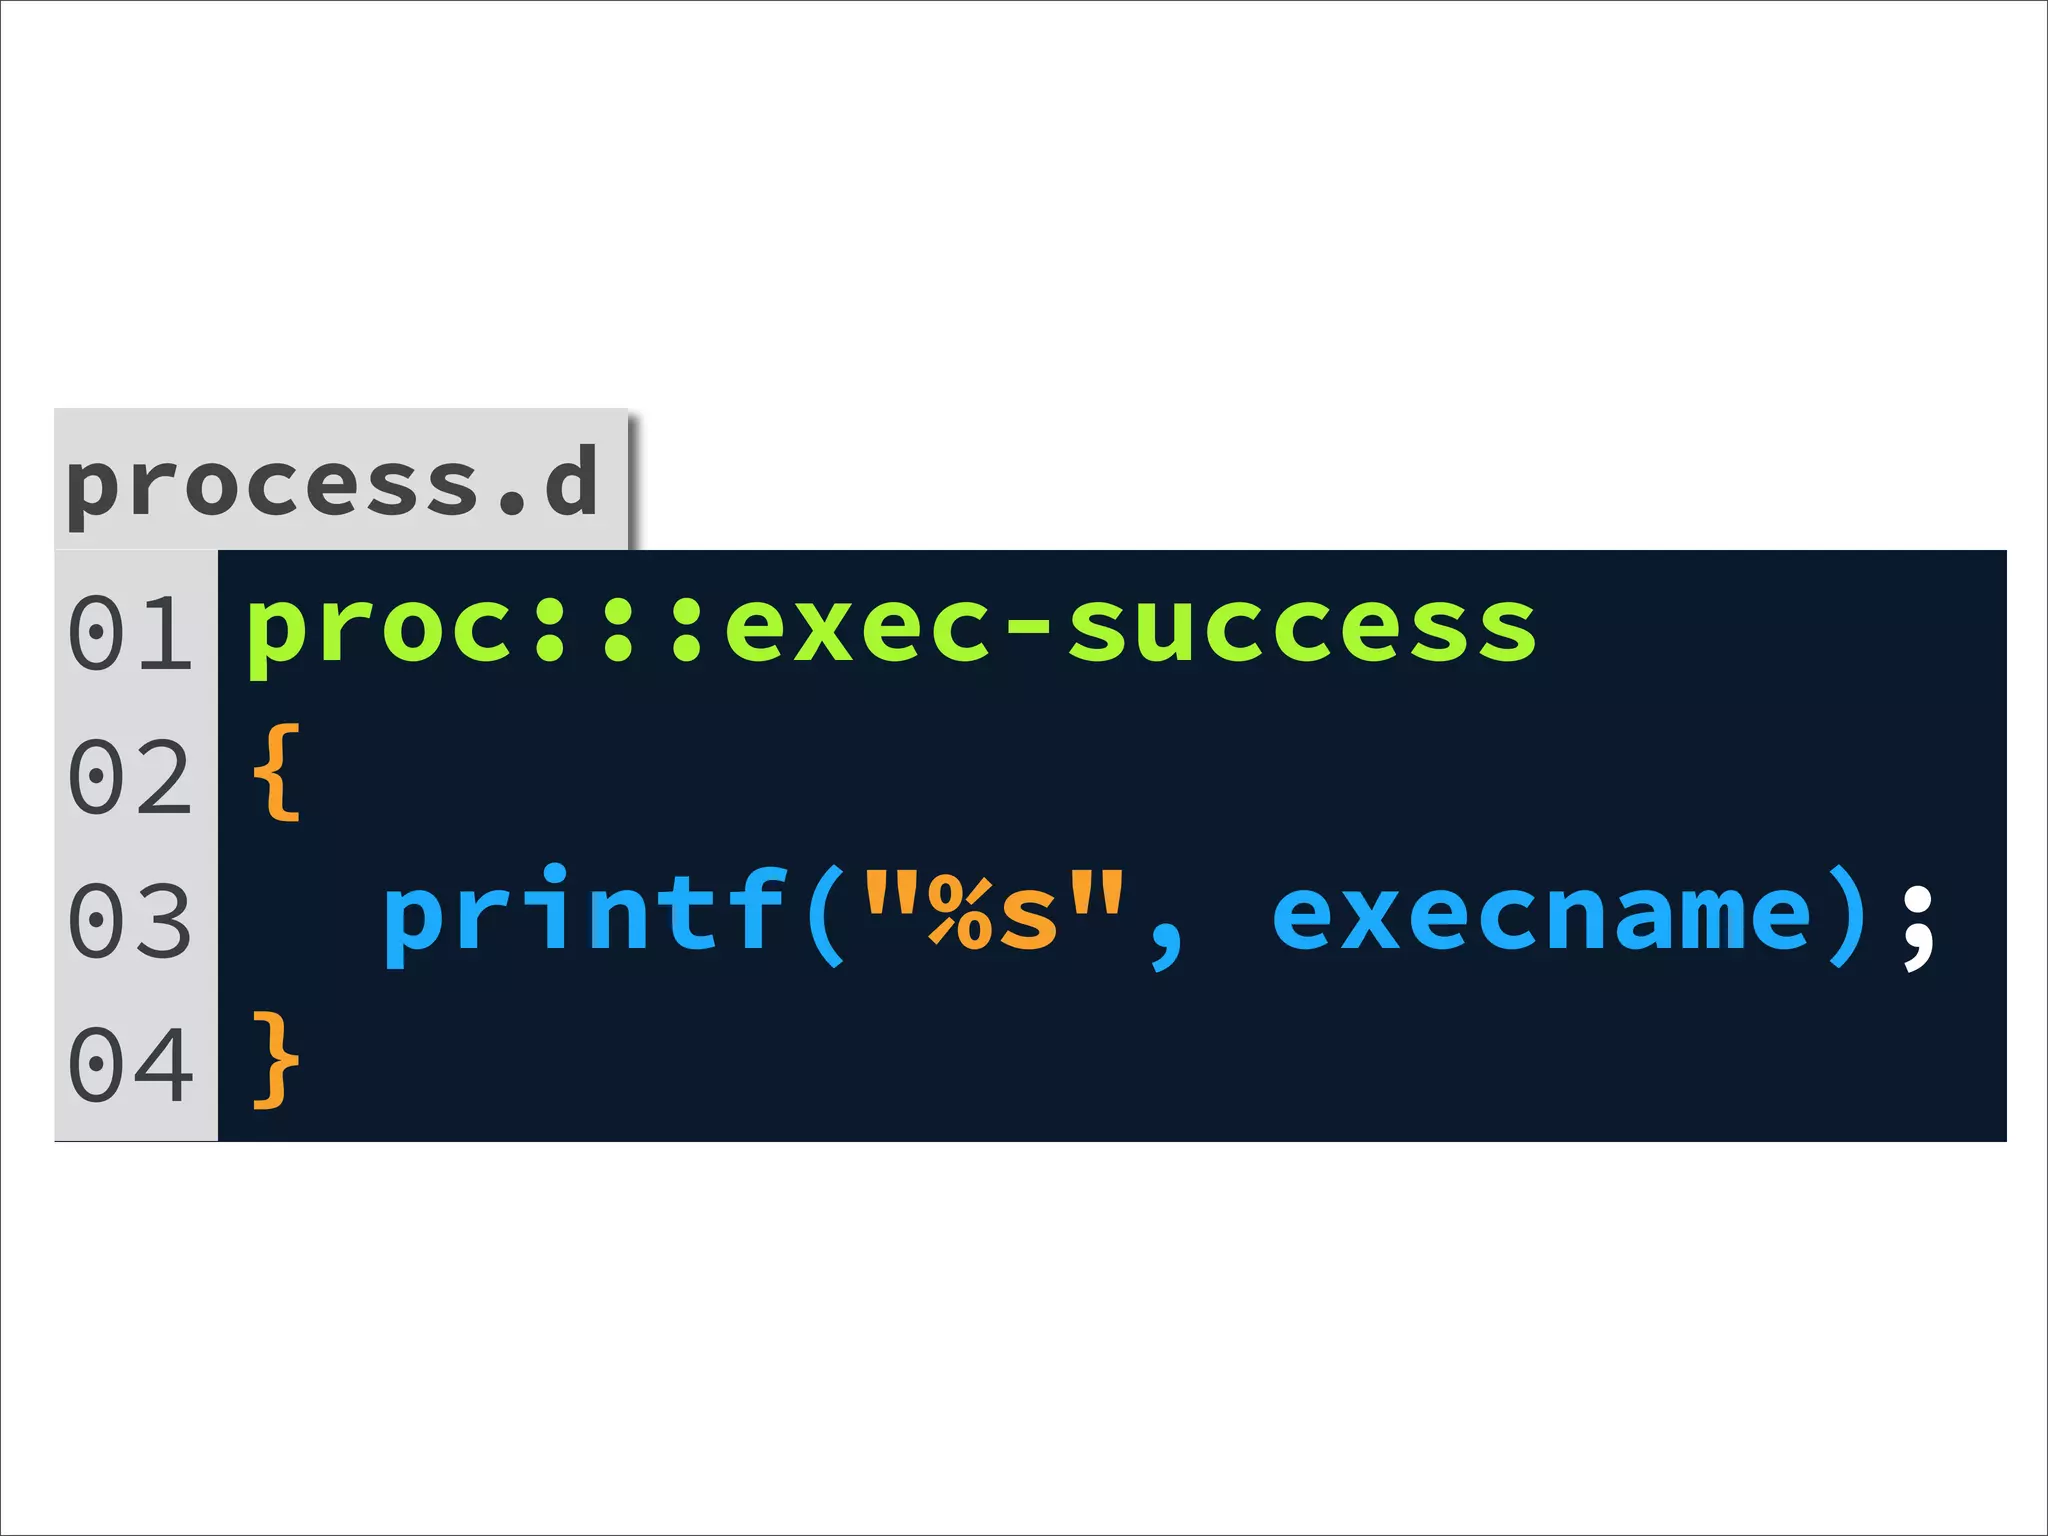
![Aggregate
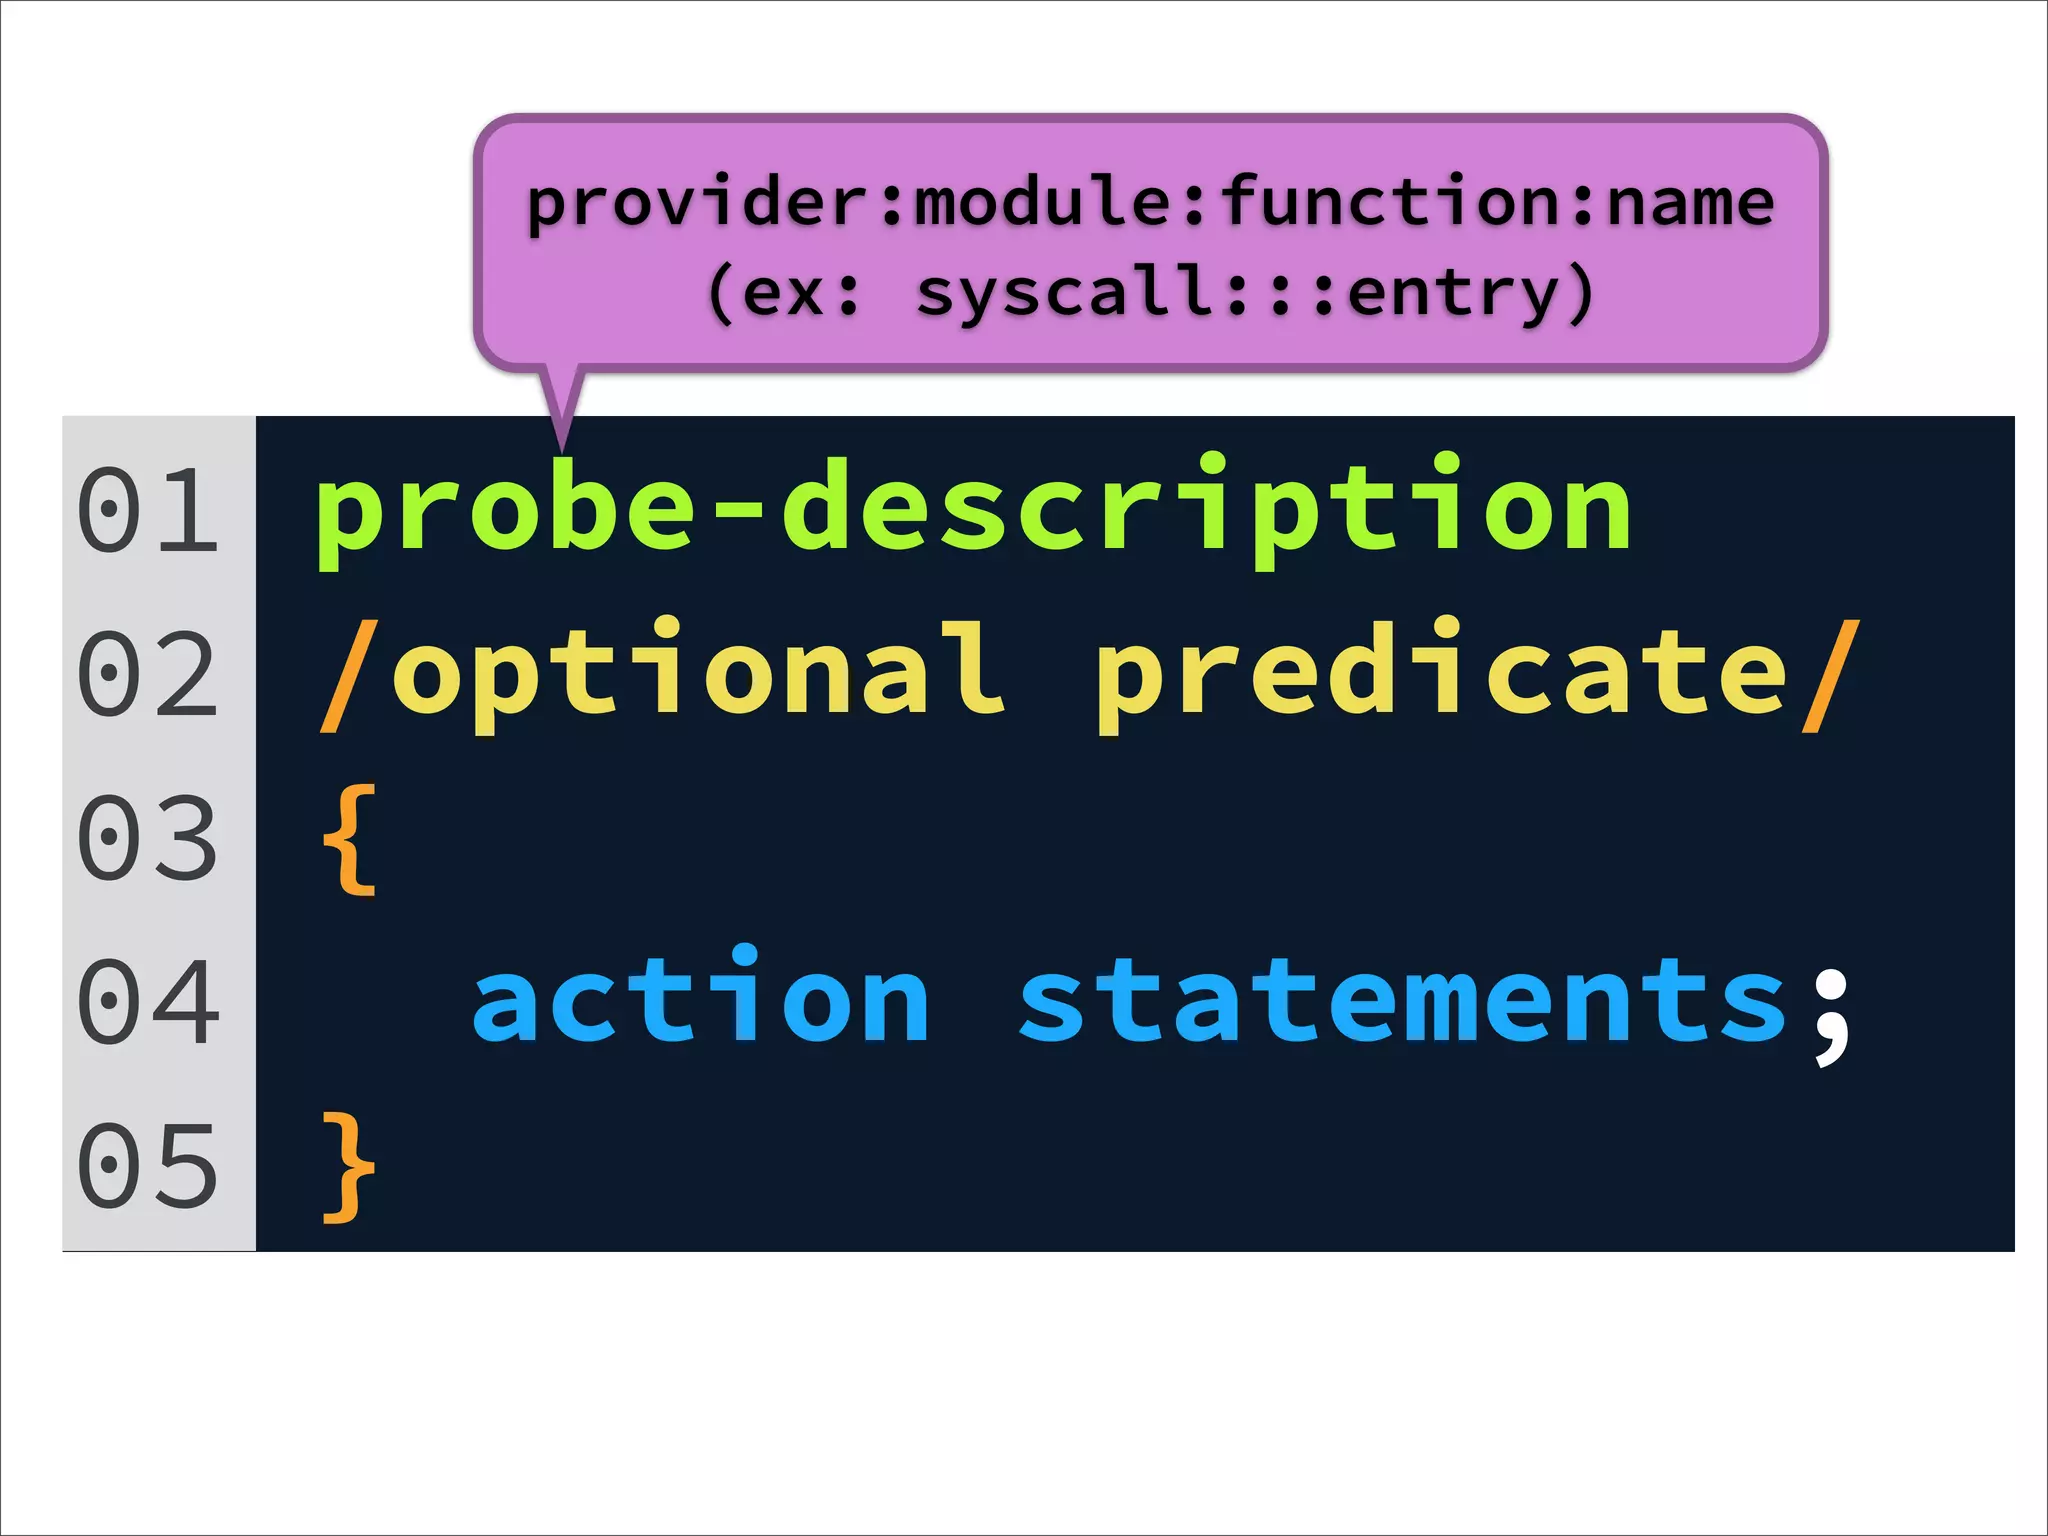
@name[key] = aggfunc(args)
@: aggregation’s prefix
name: aggregation’s name
key: D expression list (comma-separated)
aggfunc: aggregation function](https://image.slidesharecdn.com/learning-dtrace-121121112324-phpapp02/75/Learning-Dtrace-40-2048.jpg)
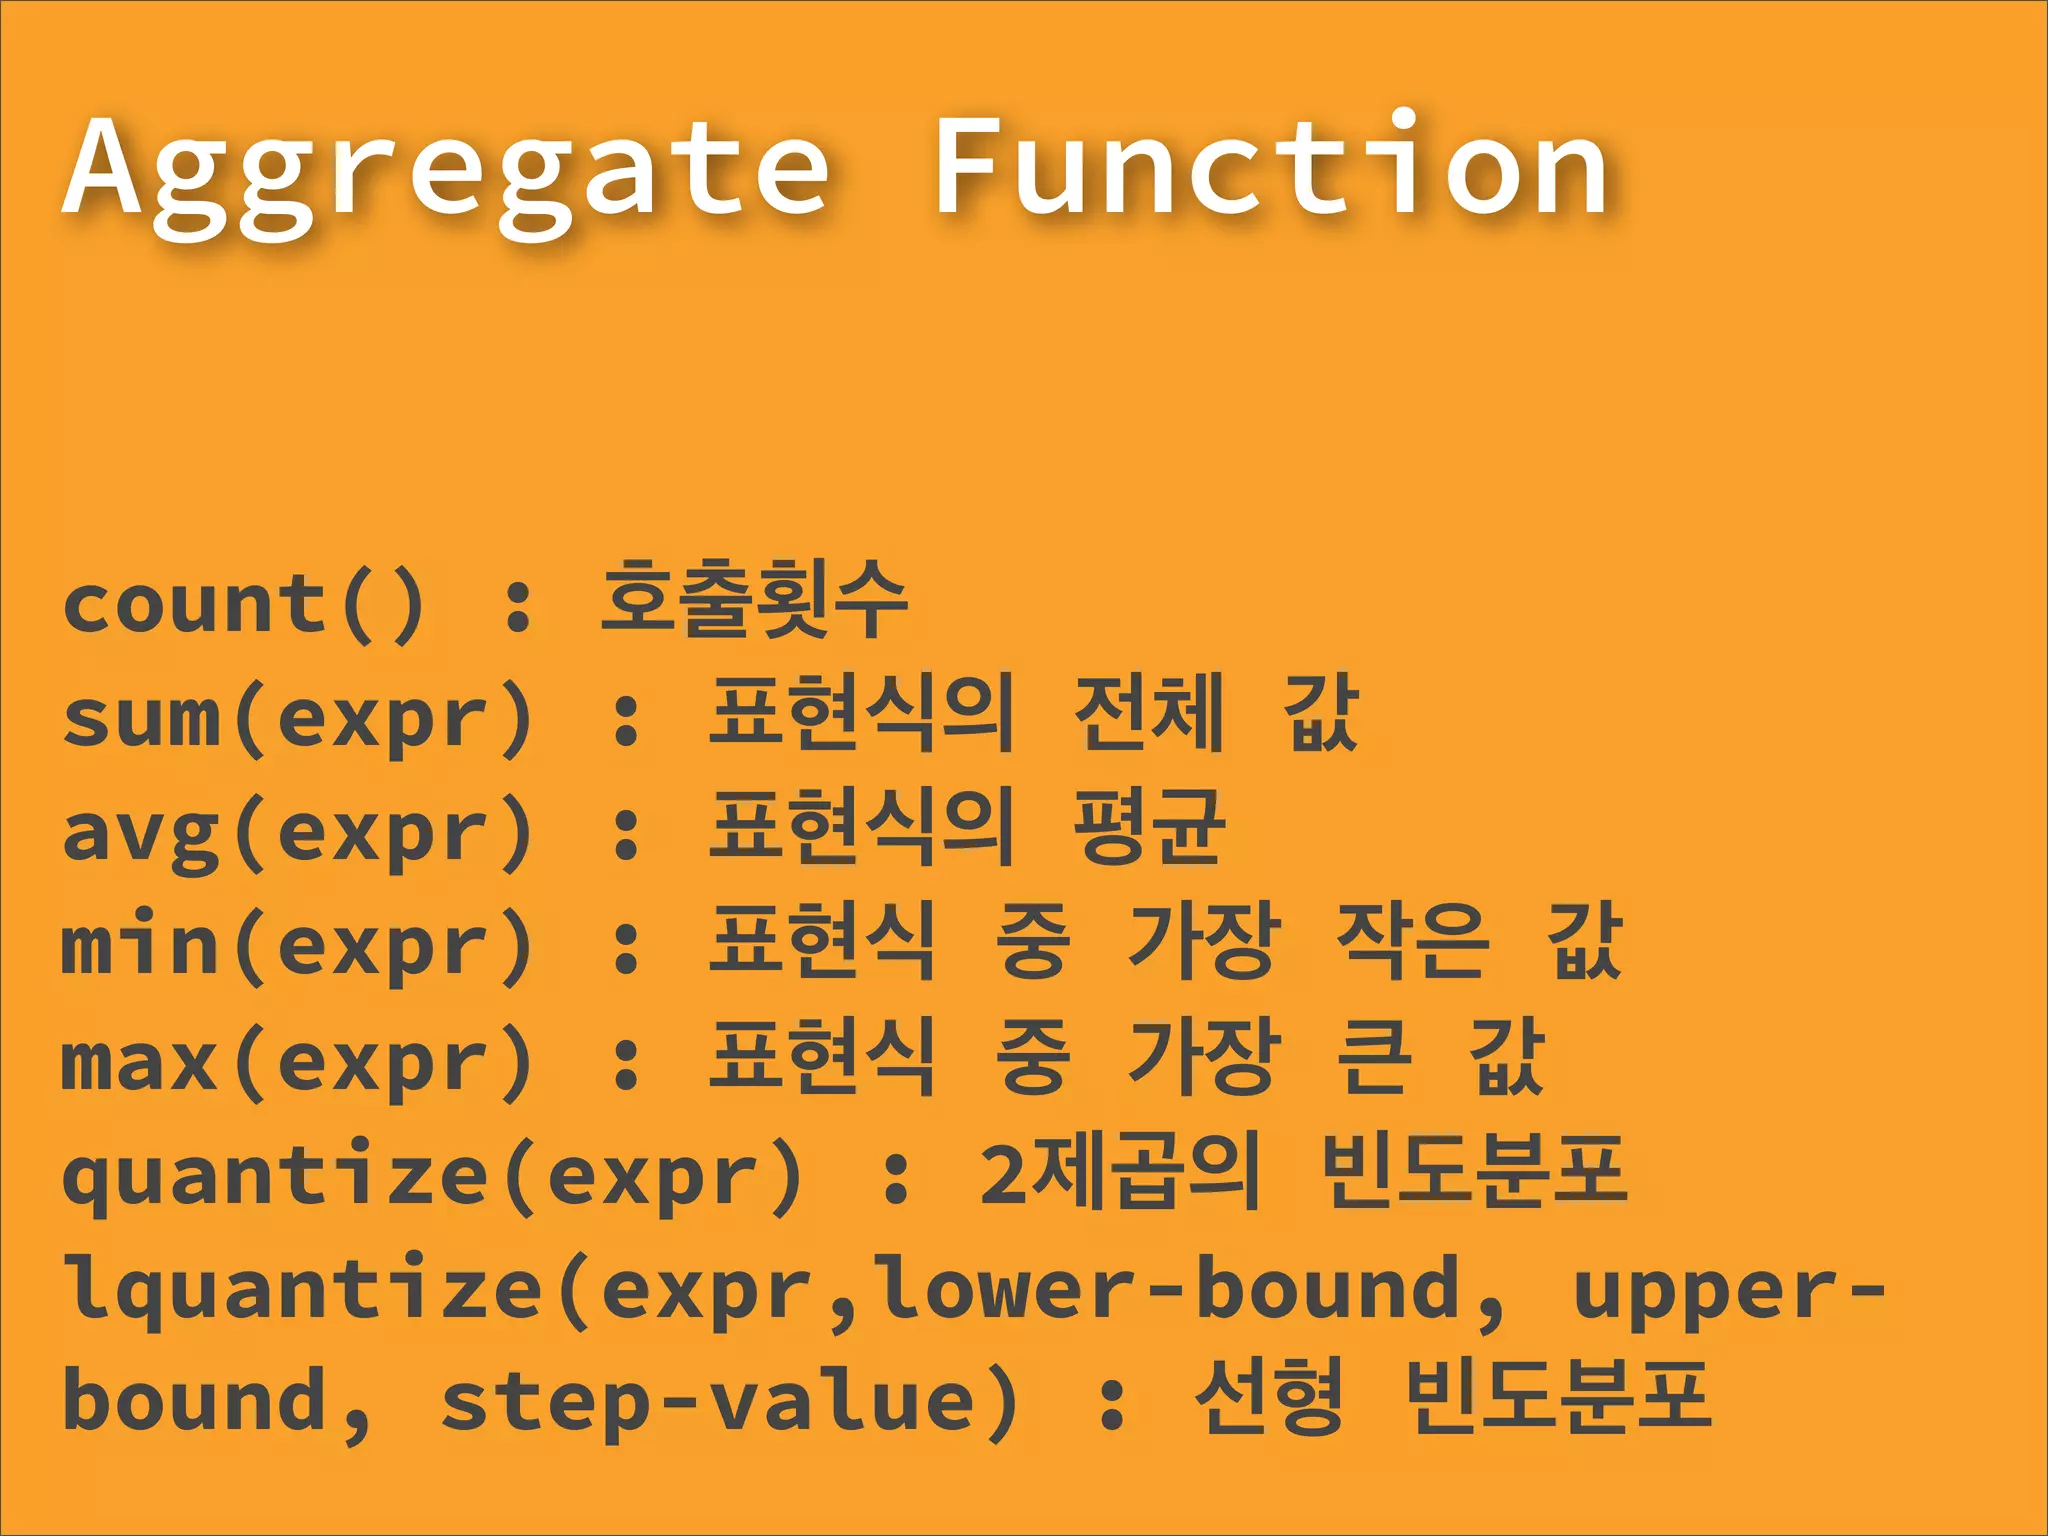
![aggr-count.d
01 syscall::read:entry
02 {
03 @counts[execname] = count();
04 }
05 profile:::tick-5s
06 {
07 exit(0);
08 }](https://image.slidesharecdn.com/learning-dtrace-121121112324-phpapp02/75/Learning-Dtrace-42-2048.jpg)
![aggr-quant.d
01 syscall::read:entry
02 {
03 self->ts = timestamp;
04 }
05 syscall::read:return
06 /self->ts/
07 {
08 delta = timestamp - self->ts;
09 @quanttime[execname] = quantize(delta);
10 }
11 profile:::tick-5s
12 {
13 exit(0);
14 }](https://image.slidesharecdn.com/learning-dtrace-121121112324-phpapp02/75/Learning-Dtrace-43-2048.jpg)


![http-server.d
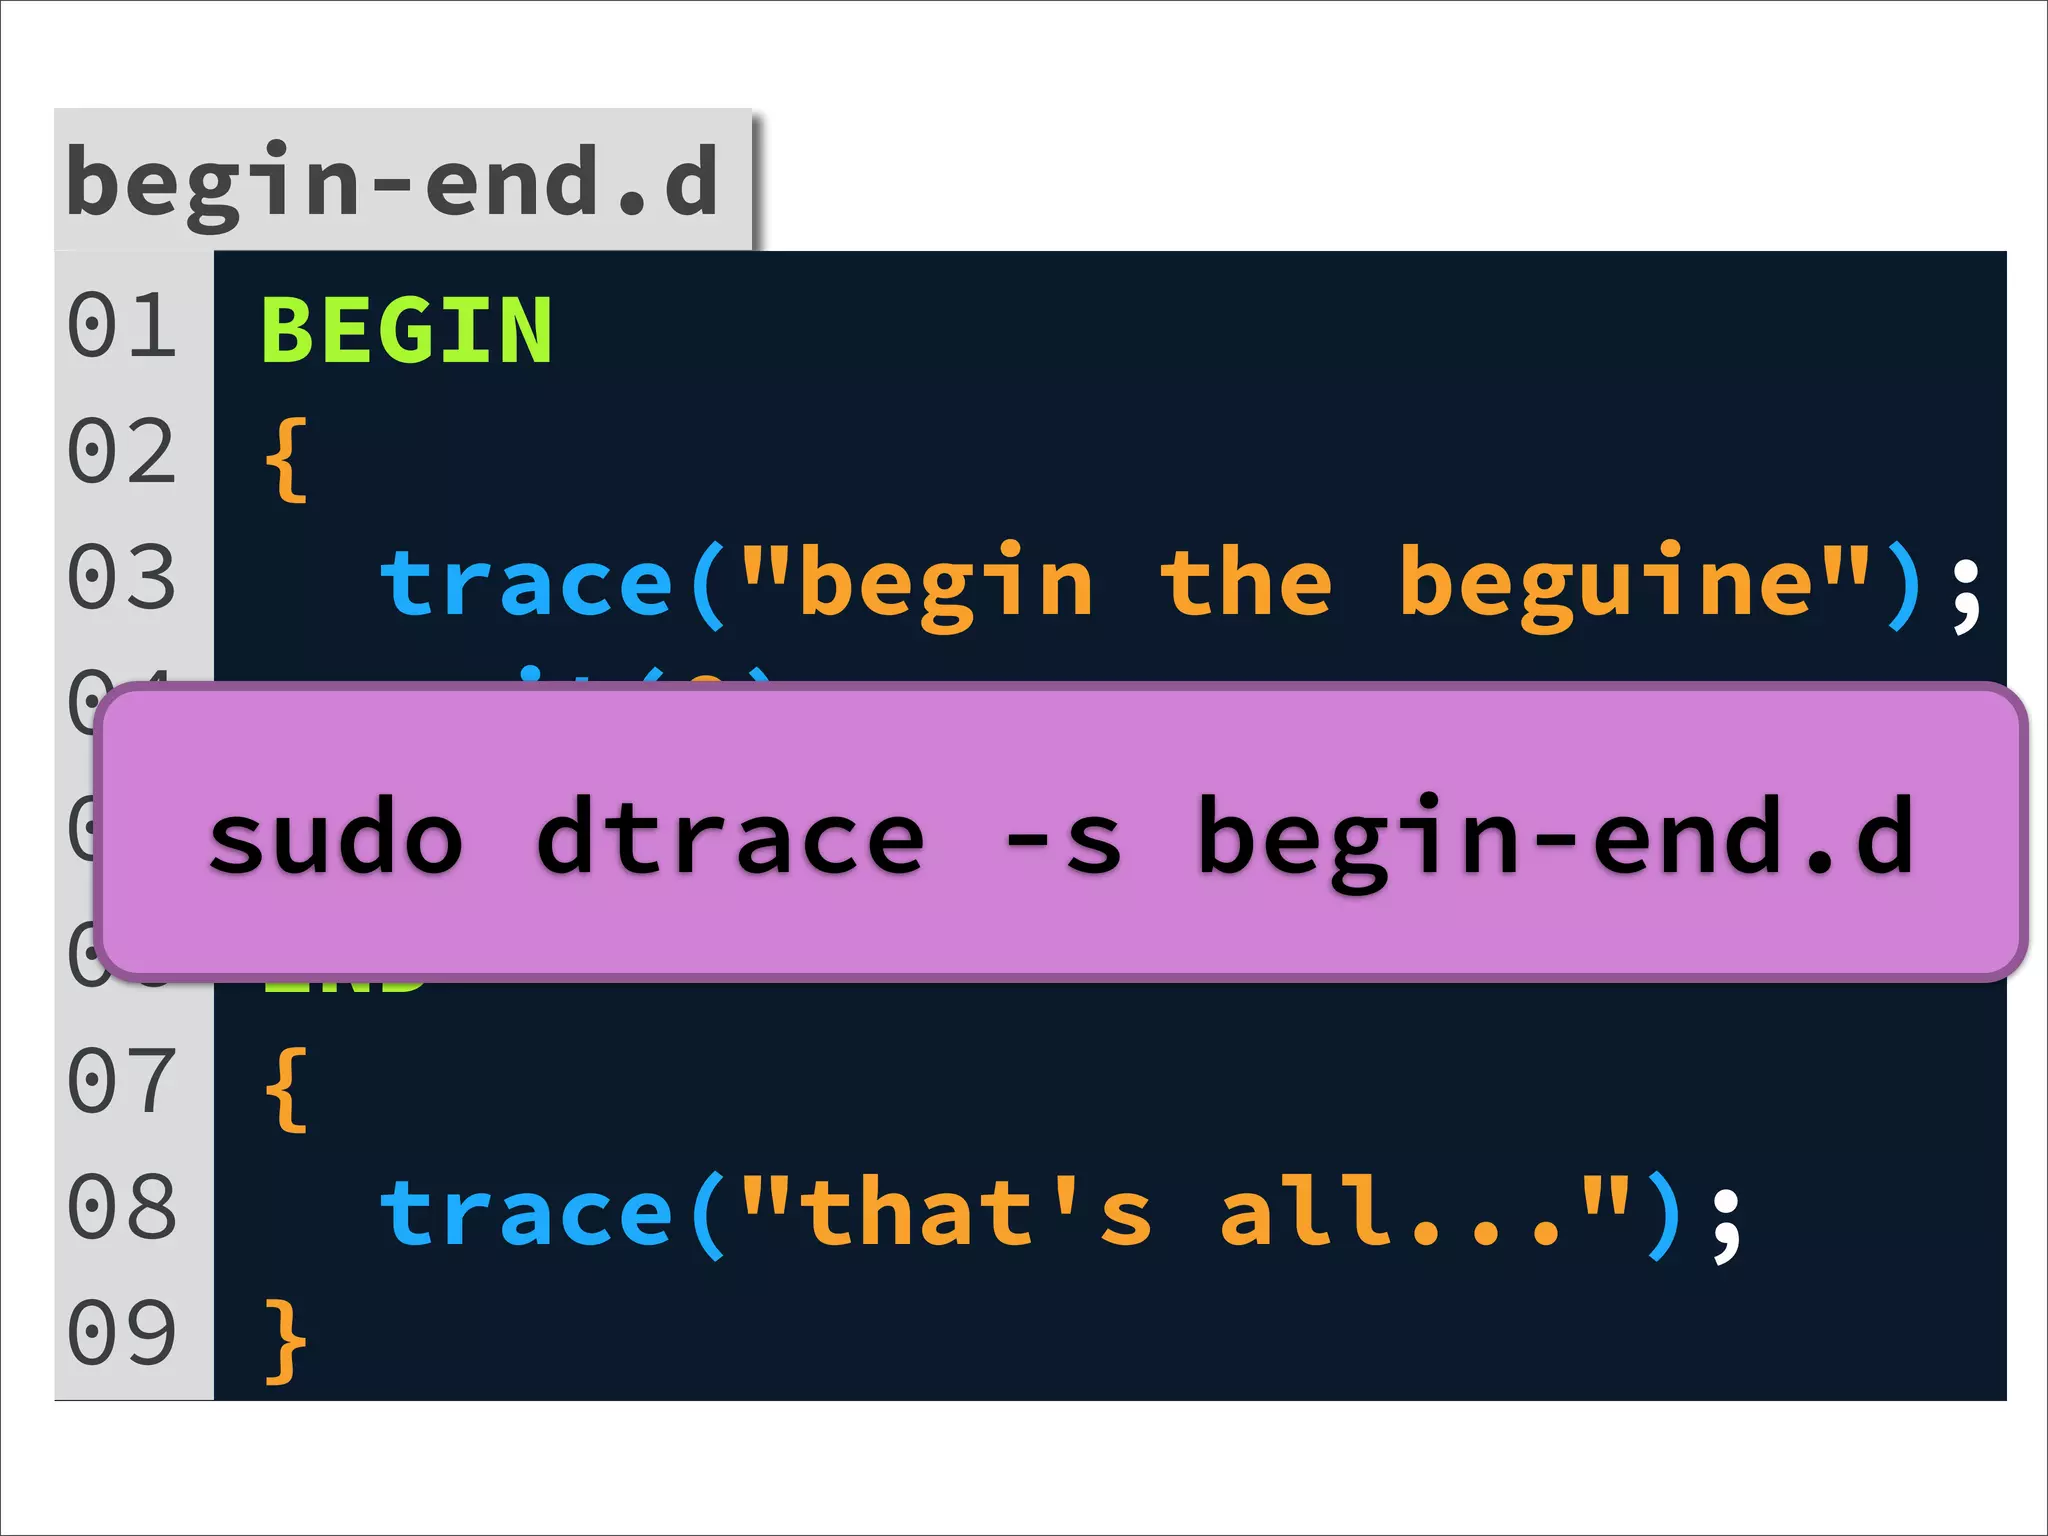
01 BEGIN
02 {
03 printf("%7s %2s %5s %20s (%5s) %8s %s (%s)n",
04 "WHO", "FD", "RPORT", "REMOTE", "BUFFR",
05 "METHOD", "URL", "FWDFOR");
06 }
07
08 node*:::http-server-request
09 {
10 printf("+SERVER %2d %5d %20s (%5d) %8s %s (%s)n",
11 args[1]->fd, args[1]->remotePort, args[1]->remoteAddress,
12 args[1]->bufferSize,
13 args[0]->method, args[0]->url, args[0]->forwardedFor);
14 }
15
16 node*:::http-server-response
17 {
18 printf("-SERVER %2d %5d %20s (%5d)n",
19 args[0]->fd, args[0]->remotePort, args[0]->remoteAddress,
20 args[0]->bufferSize);
21 }](https://image.slidesharecdn.com/learning-dtrace-121121112324-phpapp02/75/Learning-Dtrace-55-2048.jpg)
![request-count.d
01 http-server-request
02 {
03 @[args[0]->url]=count()
04 }](https://image.slidesharecdn.com/learning-dtrace-121121112324-phpapp02/75/Learning-Dtrace-56-2048.jpg)
![profile.d
01 profile-97
02 /execname == "node" && arg1/
03 {
04 @[jstack(150, 8000)] = count();
05 }
06 tick-10sec
07 {
08 exit(0);
09 }](https://image.slidesharecdn.com/learning-dtrace-121121112324-phpapp02/75/Learning-Dtrace-58-2048.jpg)

![01 dtp.fire("probe1", function(p) {
02 return [1, 2];
03 });
04 dtp.fire("probe2", function(p) {
05 return ["hello, dtrace via provider", "foo"];
06 });](https://image.slidesharecdn.com/learning-dtrace-121121112324-phpapp02/75/Learning-Dtrace-66-2048.jpg)
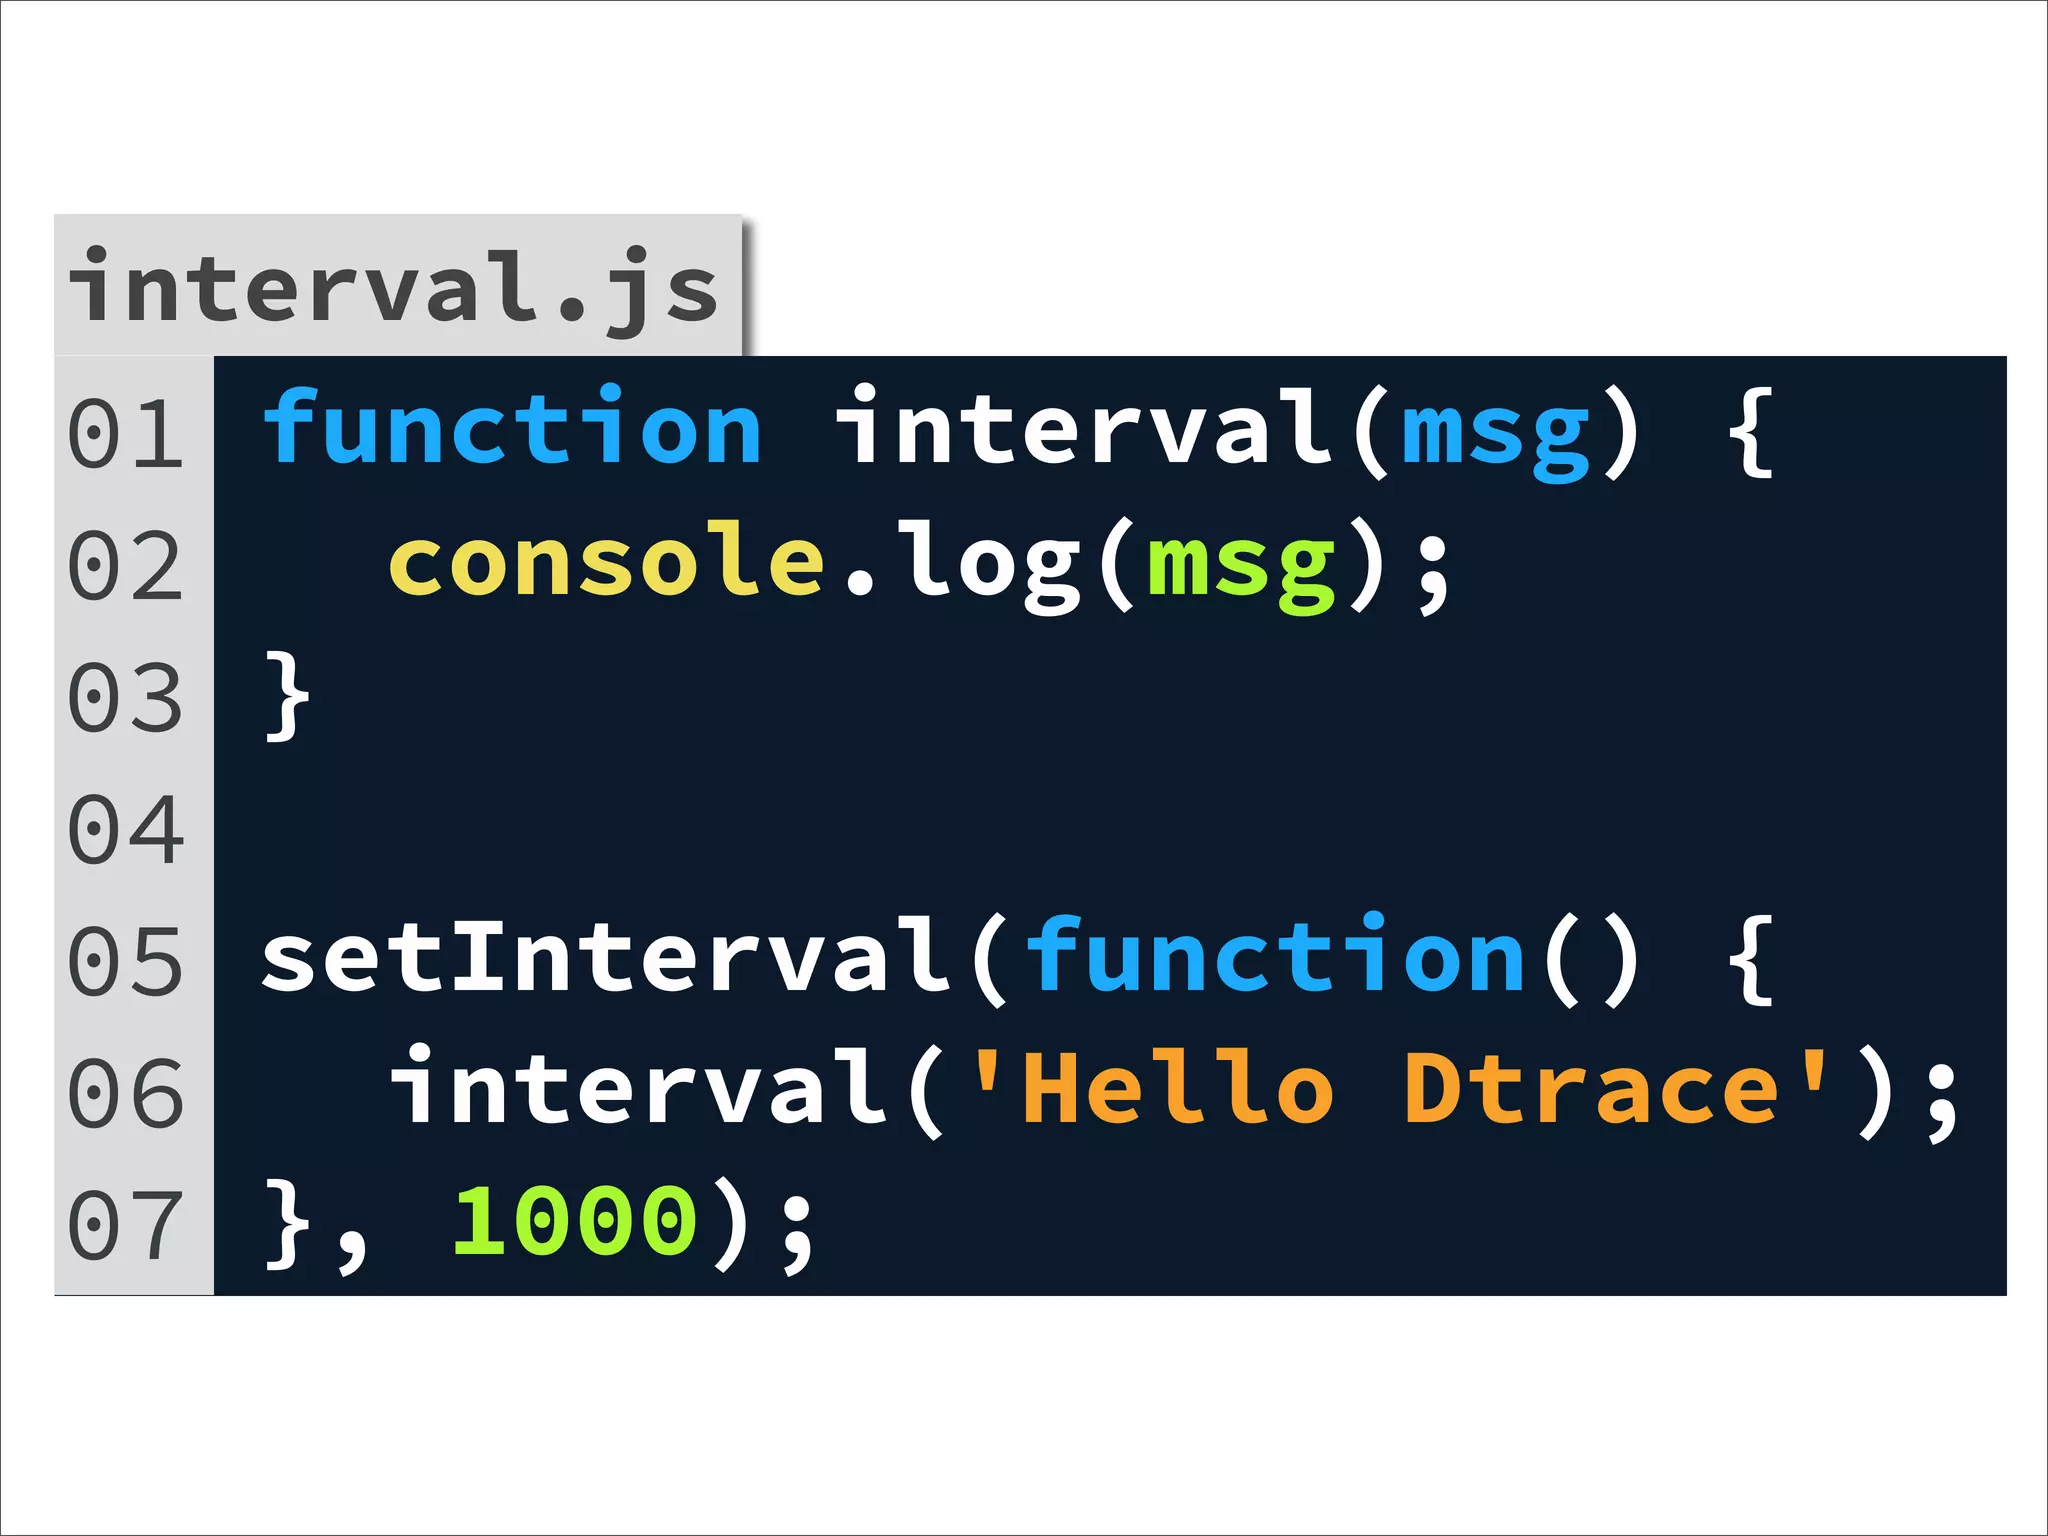
![interval.js
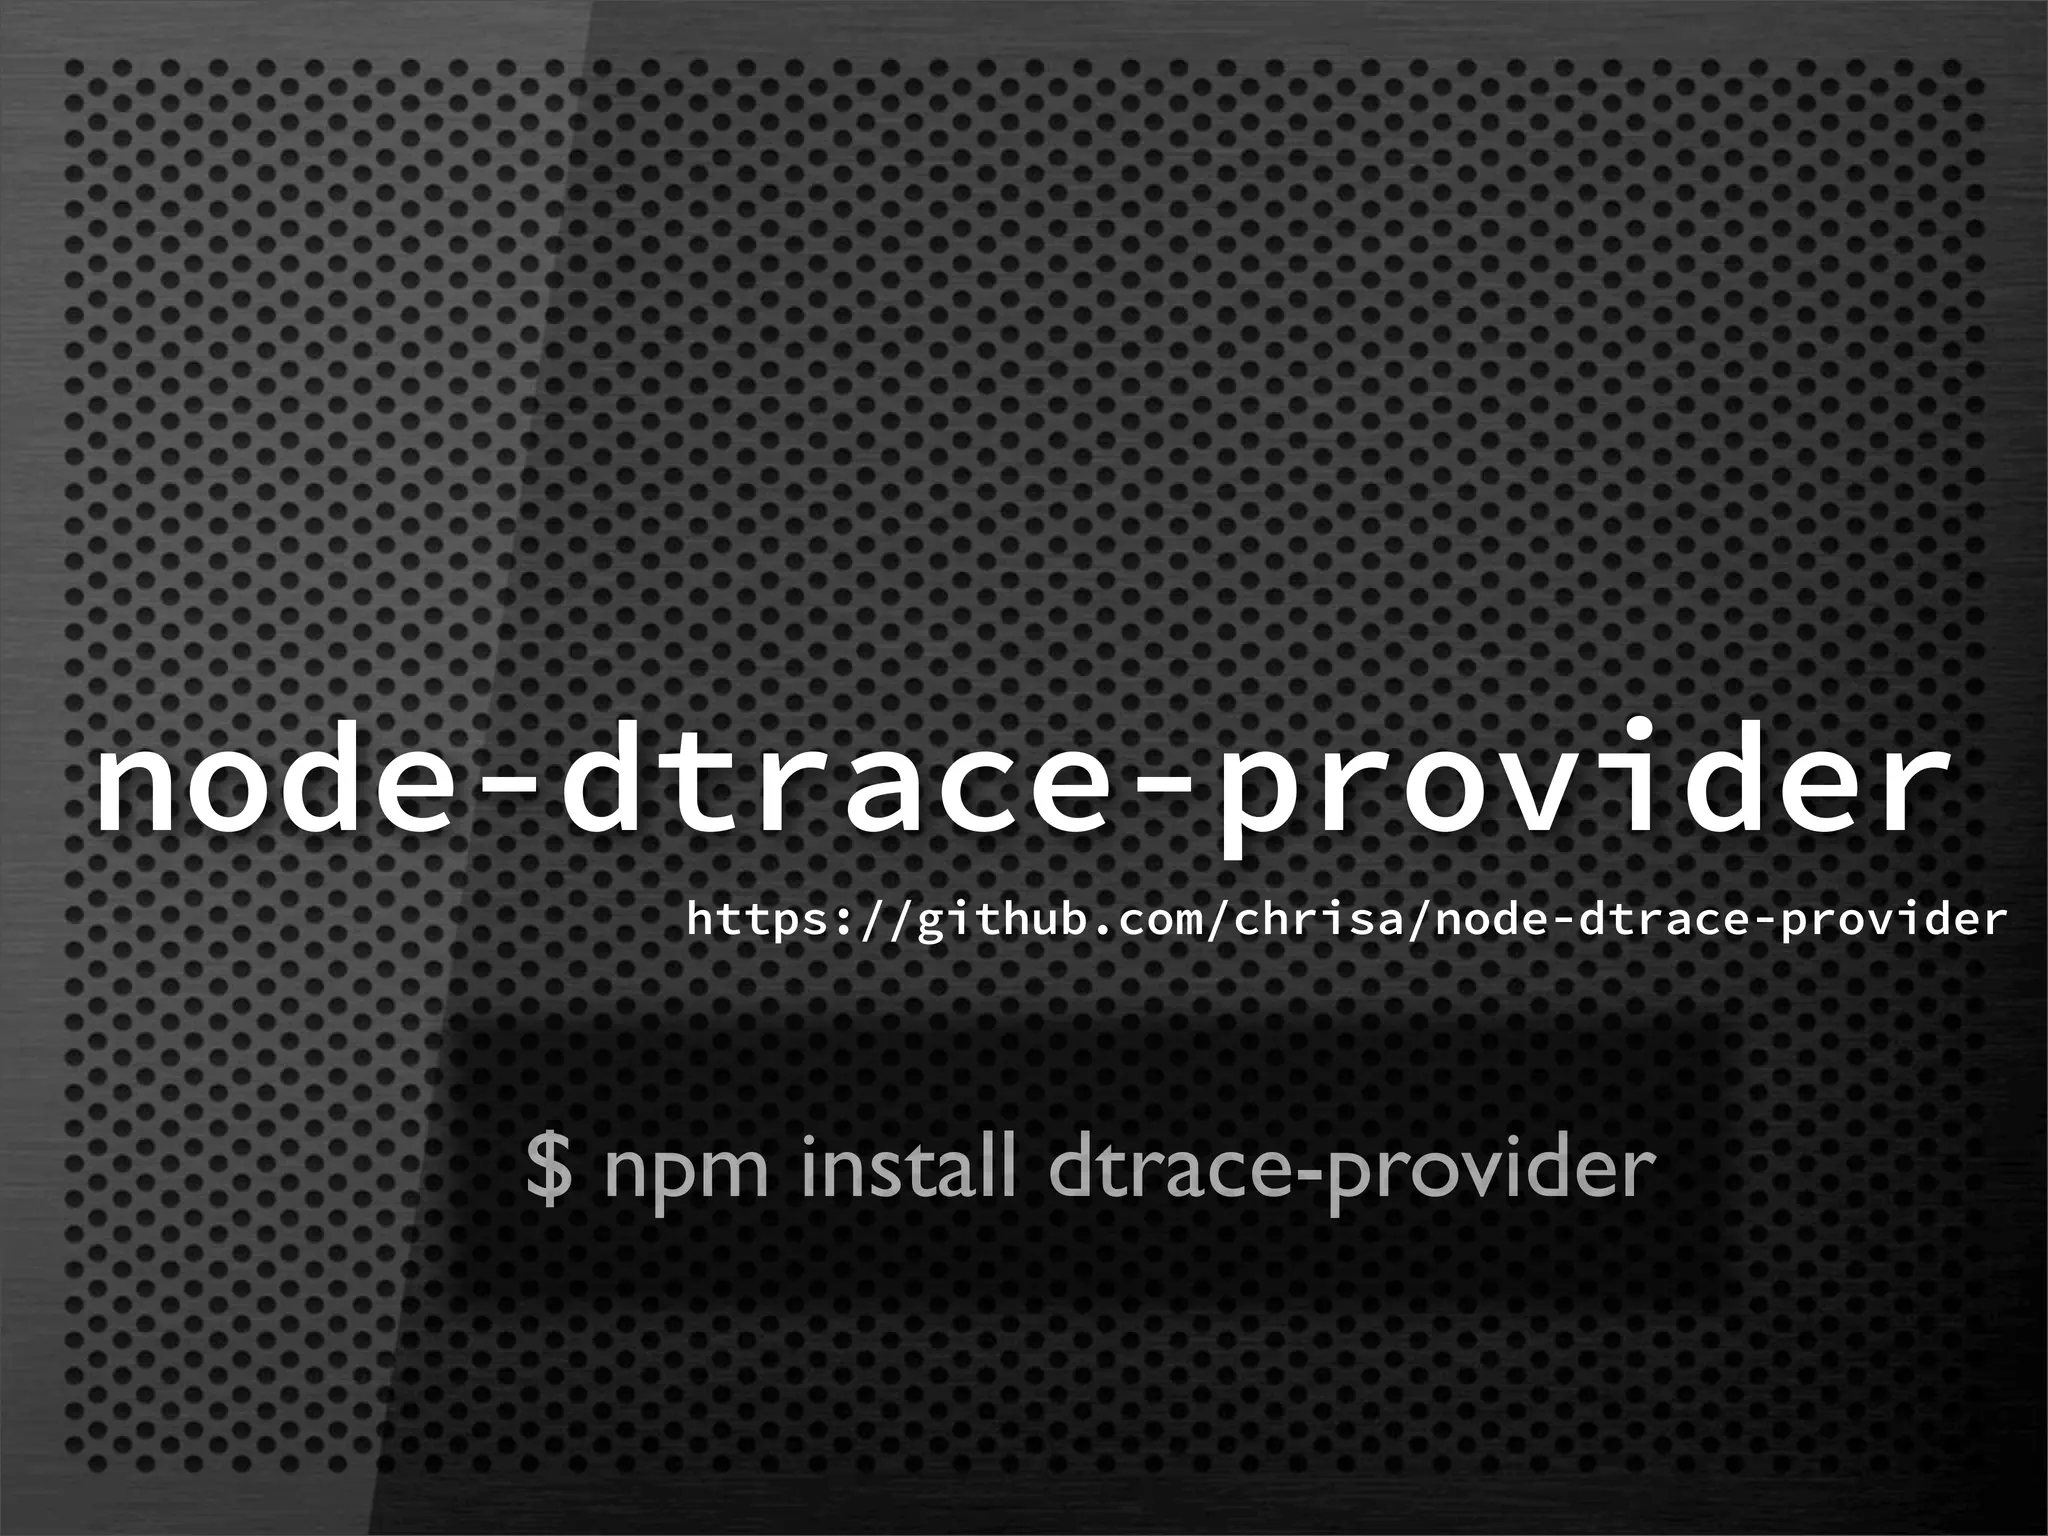
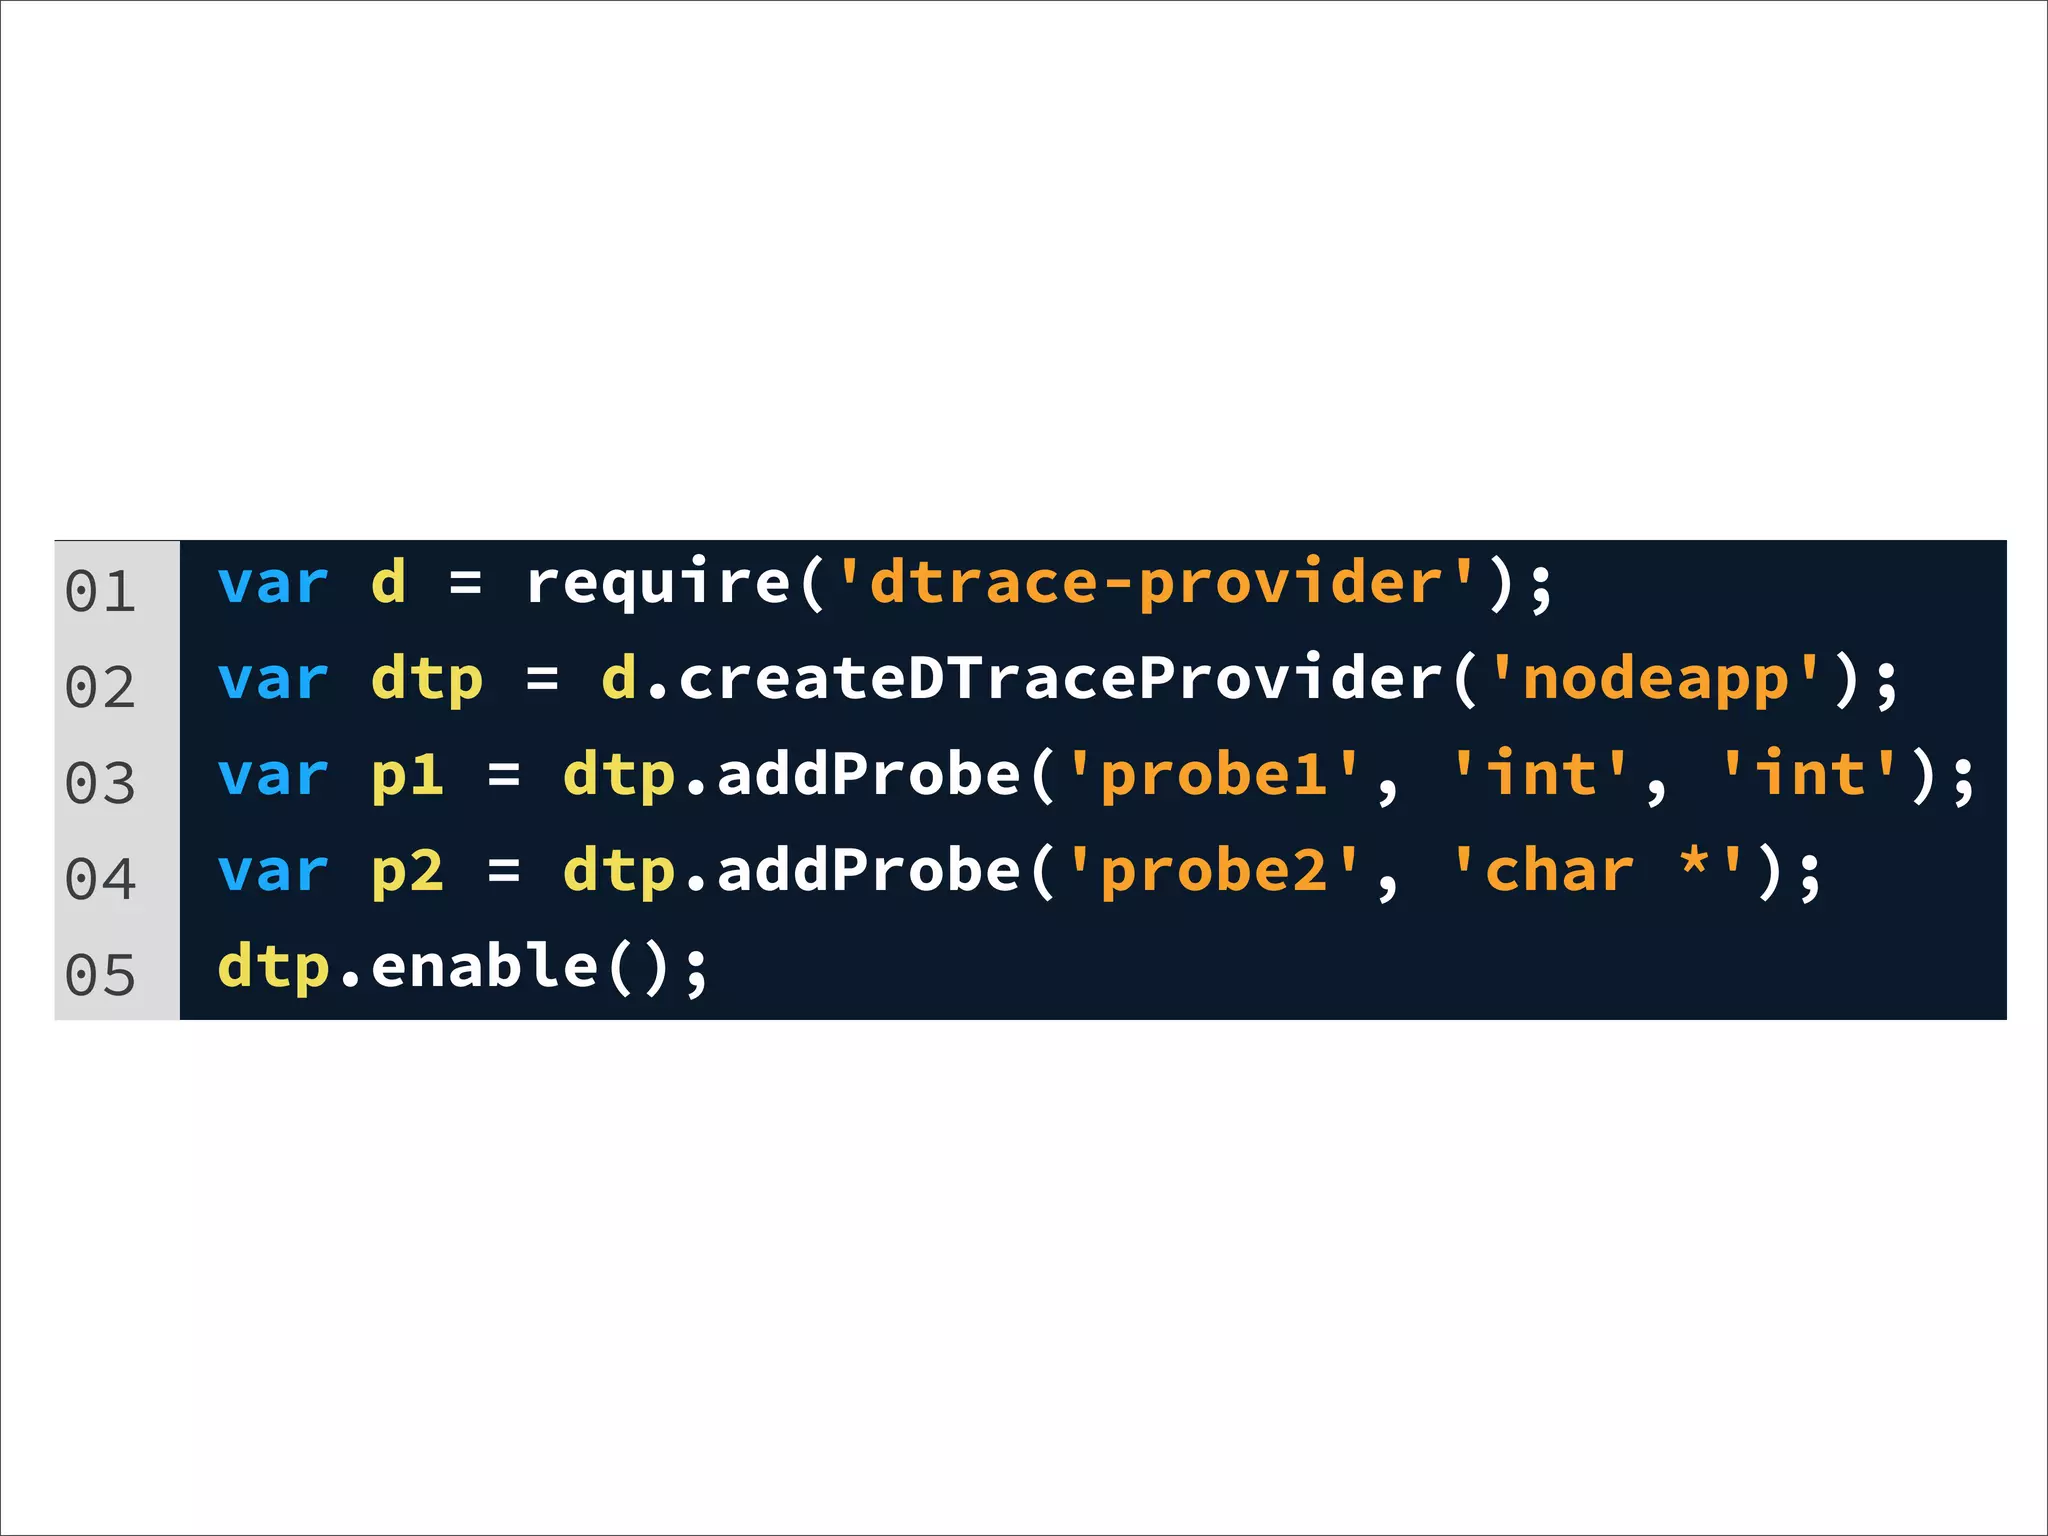
01 var d = require('dtrace-provider');
interval.js
02 var dtp =
03 d.createDTraceProvider('nodeapp');
04 var p2 = dtp.addProbe('echo', 'char *');
05
06 function interval(msg) {
07 dtp.fire('echo', function () {
08 return [msg];
09 });
10 console.log(msg);
11 }
12 setInterval(function() {
13 interval('Hello Dtrace');
14 }, 1000);
15 dtp.enable();](https://image.slidesharecdn.com/learning-dtrace-121121112324-phpapp02/75/Learning-Dtrace-69-2048.jpg)


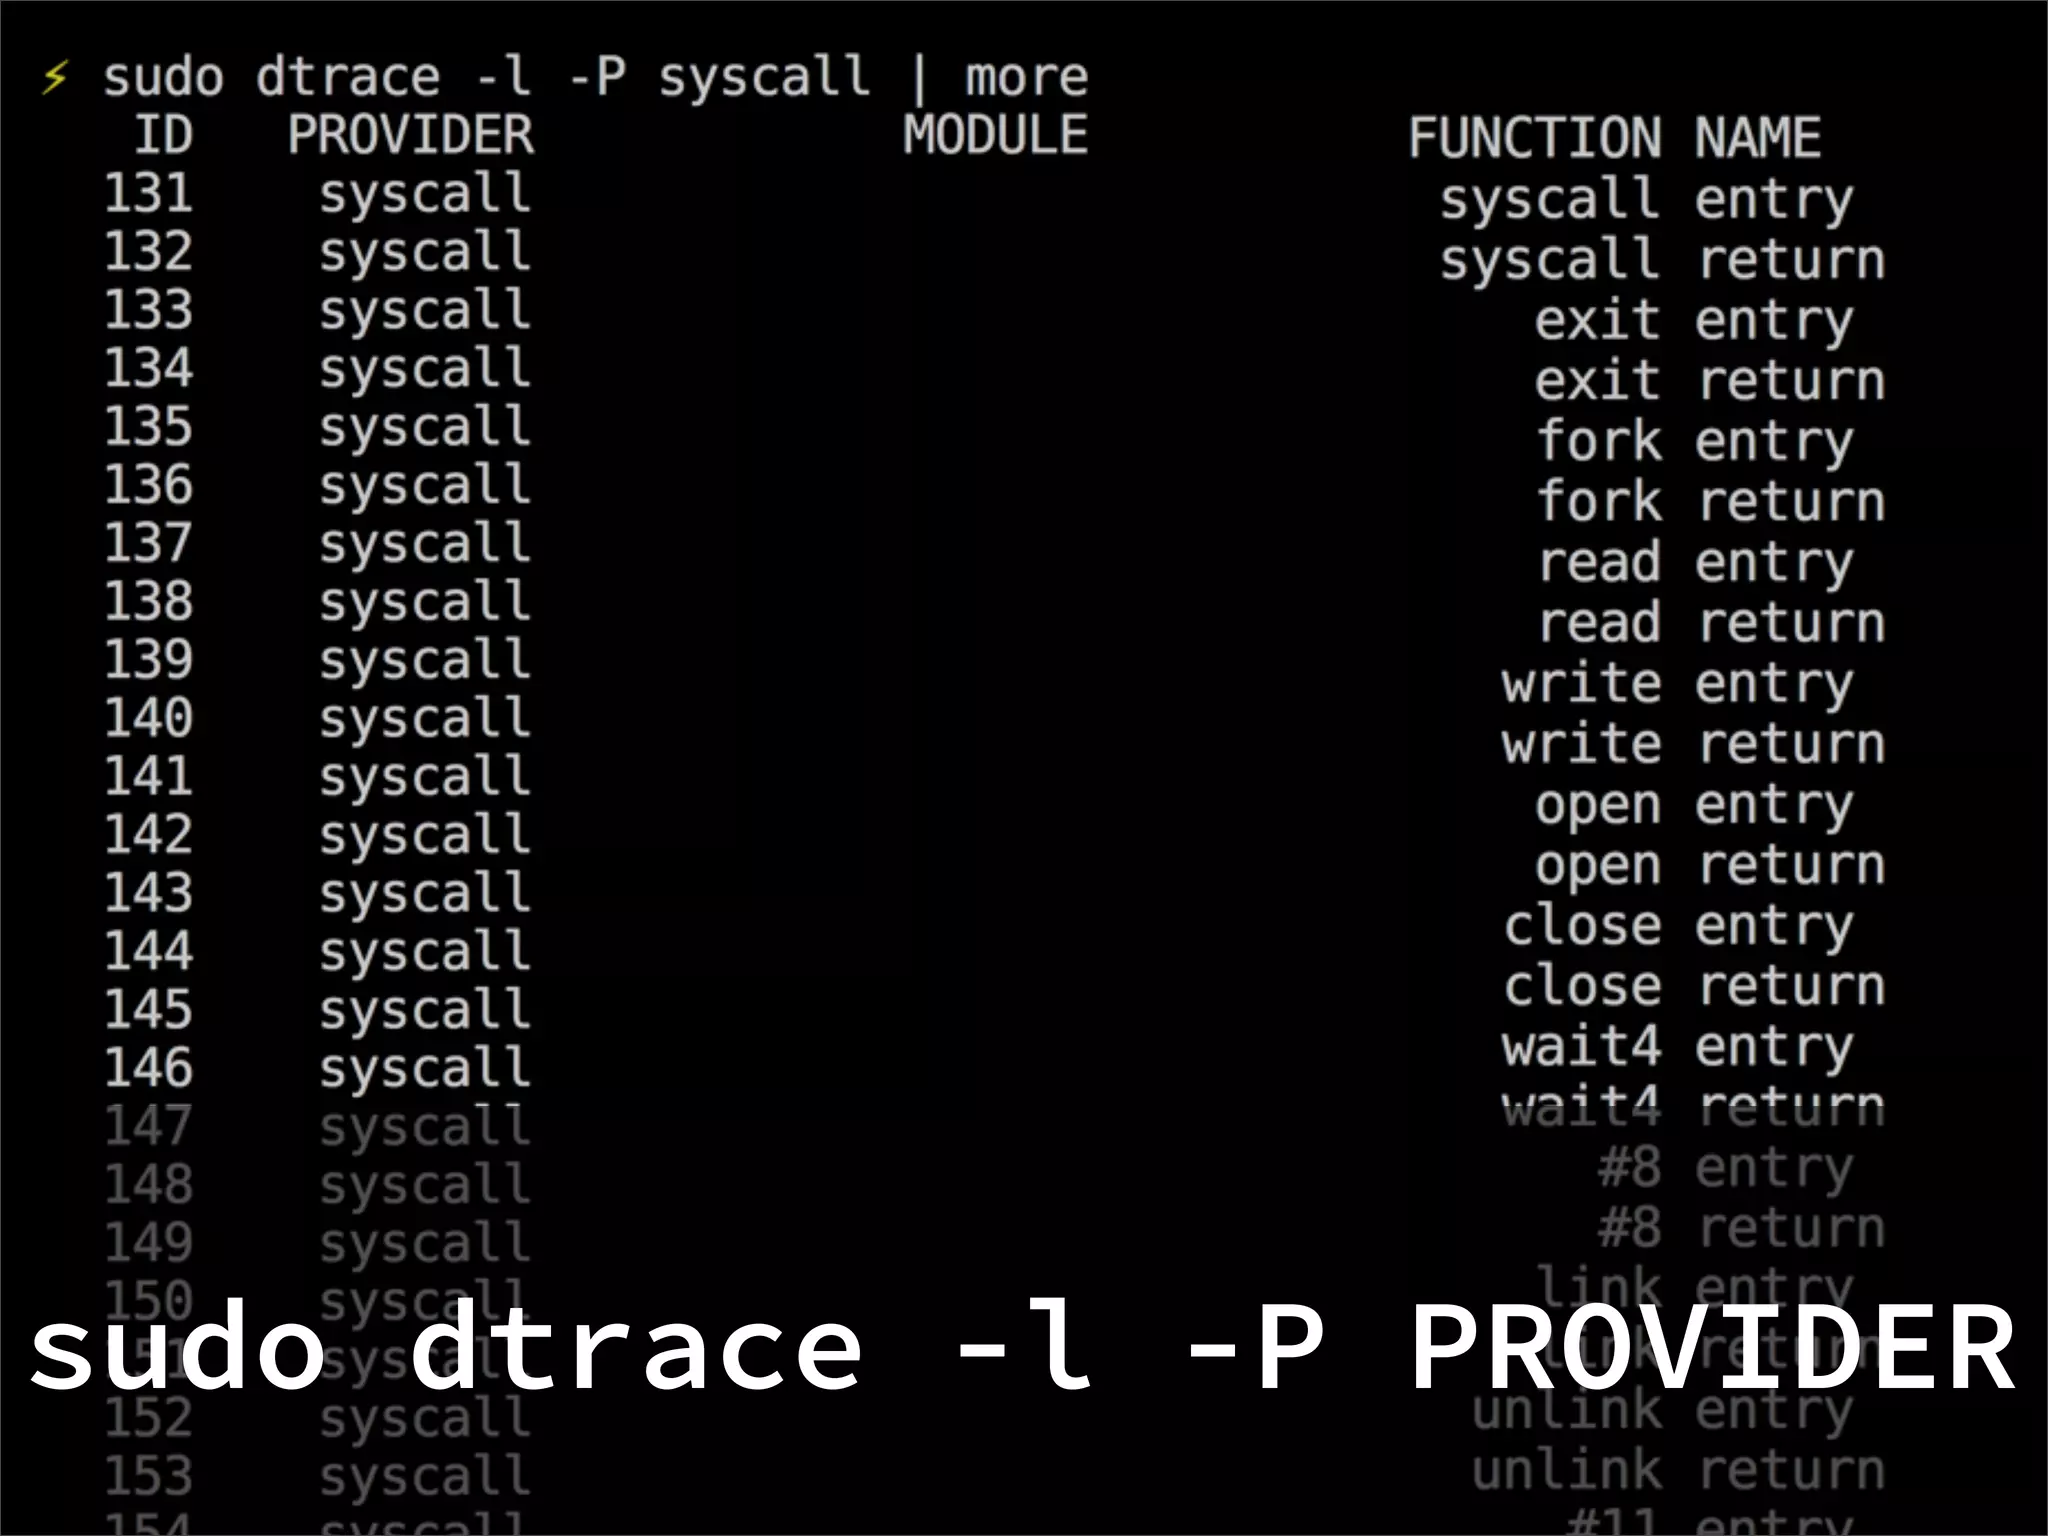
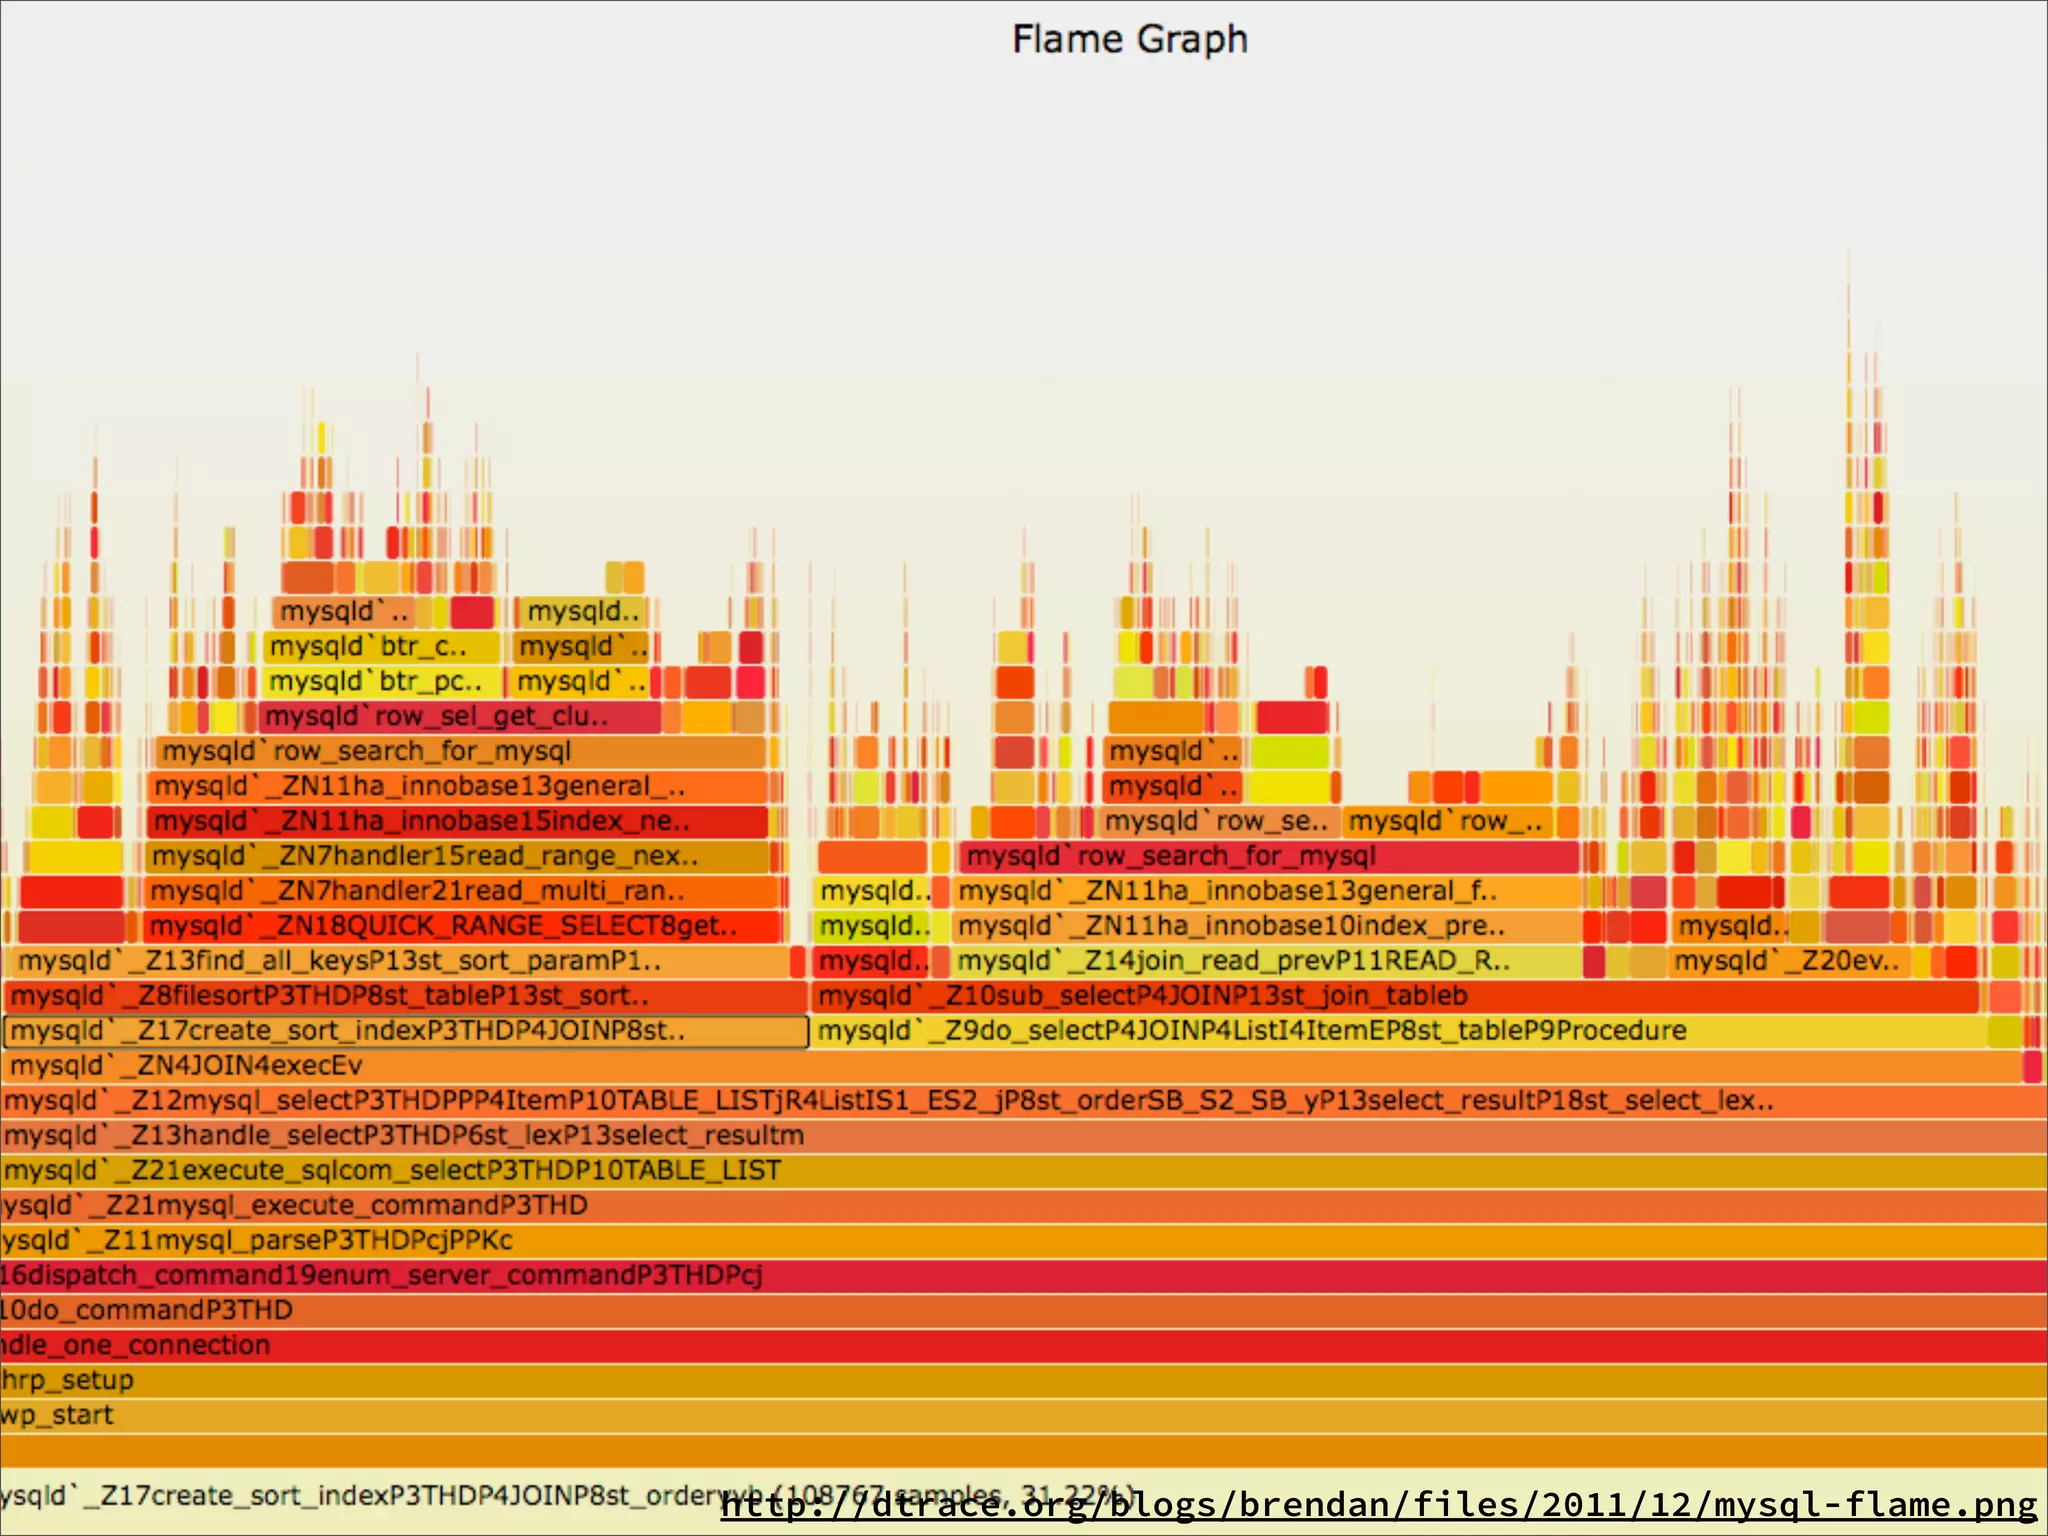
DTrace is a comprehensive dynamic tracing framework created by Sun Microsystems for troubleshooting kernel and application problems on production systems in real time. It provides probes in the operating system and applications to monitor events, collects and aggregates data, and provides tools to analyze the data. DTrace can be used on Unix-like systems like Solaris, Linux, macOS, and in Node.js applications through a DTrace provider. It allows gathering insights about the system and application behavior without restarting or slowing the system.