Using Hydroacoustics to Spatially Quantify Productive Capacity in Freshwater Ecosystems
1. Using Hydroacoustics to Spatially Quantify
Productive Capacity in Freshwater Ecosystems
A Thesis Proposal Submitted by Riley Pollomin Partial Fulfillment of the
Requirements for the
Master’s of Science Degree in Biology at
Memorial University of Newfoundland
Advisor: Dr. George A. Rose – Director, Centre for Fisheries Ecosystems
Research (Fisheries and Marine Institute of Memorial University)
Committee: Dr. Daniel Boisclair – Professor, Département de Sciences
Biologiques(Université de Montréal);
Scientific Director, NSERC HydroNet Strategic Network
Dr. RodolpheDeVillers – Professor, Department of Geography
(Memorial University)
Statement of Purpose
2. It is the purpose of this MSc. thesis to determine hydroacoustic methods to evaluate
the productive capacity of fish habitats in freshwater lakes and reservoirs in Manitoba, and
to discover how this productive capacity varies over space within and between natural and
reservoir systems. This research is part of NSERC’s HydroNet research program
(Smokorowskiet al. 2011).
Introduction
Freshwater ecosystems of the world provide people with a vast amount of
ecosystem services that are vital to our survival and well-being(Braumanet al. 2007). One
of the most salient services provided by these ecosystems is the production of fish for
human consumption and recreation. Increasingly, freshwater systems and the services
they provide - includingfish productivity -are under threat from multiple stressors
(Ormerodet al. 2010). One of the major ways in which the productive capacity of fish
habitats (i.e. the total production of all stock during the time they spend any part of their
life history in that habitat; Minns 1997)is altered is through the creation and operation of
hydropower facilities (Rosenberg et al. 1997).
In Canada there is a federal mandate to protect fish habitat and productive capacity
through a ‘no net loss’ approach (DFO 1986), however it remains prohibitively challenging
to measure such capacity in the field (Randall and Minns 2002; Smokorowskiet al. 2011).
Challenges include the need for long-term monitoring and the necessary measurement of
multiple ecosystem components such as plankton production and interactions among
trophic levels. Even when such comprehensive studies are undertaken, they can lead to
3. ecosystem disturbances and fish mortality that can contradict the ultimate goals of the
project (Argent and Kimmel 2005).
Hydroacoustics offer a substantial contribution to the amelioration of the challenges
for assessing aquatic production. The technology allowsresearchers to study multiple
facets of ecosystems including fish, plankton, macrophytes, and bathymetry relatively
quickly over large areas andwith minimal impact to the studied environment (Simmonds
and MacLennan 2005). Hydroacoustics have long been used in marine environments for
studying fish (e.g. Trout et al. 1952; Tungate 1956; Robichaud and Rose 2002), and have
more recently been applied to the study of freshwater environments in northern Europe
(e.g. Mehneret al. 2007;Godlewskaet al. 2009), the Pacific Northwest (e.g. Ransom et al.
1998;Scheuerell and Schindler 2004), and the Laurentian Great Lakes (Rudstamet al.
2009).
Although hydroacoustics have traditionally been used only for fish surveys,
scientists studying smaller planktonic organisms have recently adopted the technology.
Euphasiid shrimp (Amakasu and Furusawa 2006), smaller-bodied zooplankton
(Georgakarakos and Kitsiou 2008), and even phytoplankton (Selivanovskyet al. 1996) have
been assessed using hydroacoustics. This versatility of the technology allows for a
comprehensive examination of pelagic aquatic ecosystems at relatively low cost in terms of
both man-hours and subject mortality.
Another advantage of hydroacoustics is the spatial resolution of the data collected.
Integrated GPS and a high ping rate (the number of sound waves sent per unit time)
provide data for analysis at various spatial scales, including across an entire lakeas well as
at meso- and microscale habitat patches. This presents the opportunity to
4. appreciatepattern and process at multiple levels, and to understand the aquatic ecosystem
more fully (Rose and Leggett 1990; Levin 1992).
One of the major potential drawbacks of using hydroacoustics is the difficulty
associated with species identification (Horne 2000).The echograms produced through the
use of hydroacoustic deviceseffectively depict the body size of an organism (as a function of
target strength, or TS), but it is very challenging to be confident in the actual identification
of fish species, and the possibility of identifying plankton is even more remote. Body size
has been seen, however, as fundamental to the ecology of individuals for many decades
(Elton 1927). Recent literature strongly suggests that the binomial species classification of
organisms may not be as crucial as body size data when studying structure and function in
ecosystems, especially in aquatic environments (Kerr and Dickie 2001; Hildrewet al. 2007;
Belgrano and Reiss 2011).
The theoretical foundations for using organismal body size as a primary avenue for
understanding ecosystems are found in the close linkages between this trait, metabolism,
and energy flux through ecological communities (Woodward et al. 2005). It has even been
suggestedthatthe concepts surrounding body size lie at the heart of a unified theory of
ecology as a discipline (Allen and Hoekstra 1993; Brown et al. 2004).
Body size shows a consistent relationship to metabolic rate across all ecosystems at
theindividual level,resulting in strong implications in terms of resource allocation(Brown
et al. 2007; Yvon-durocheret al. 2011). Aquatic ecosystems in particular have provided
evidence to support this theory of size structure, owing largely to the gape-limitation that
only permits efficient feeding for a certain predator-prey body size ratio (Jennings et al.
2001). Body size is thus robustly indicative of the ecology of individuals and the flux of
5. energy through an ecosystem (White et al. 2007), and can accurately reveal patterns in the
productive capacity of fish habitat at multiple scales.
It is the overarching goal of the present study to use hydroacoustic methods
(combined with a limited amount of traditional sampling techniques for groundtruthing) to
first spatially quantify fish productivity in Lac du Bonnet and Lake Manigotagan, Manitoba,
and then to analyze how this productivity relates to other functional characteristics of the
ecosystem, namely the distribution of organisms at lower trophic levels. Finally,individual
size distributions (ISDs – i.e. a histogram of log10Abundance vs. log10Body Size, sensu White
et al. 2007) will be used to determine how resources are divided across body size classes
within each ecosystem.
Methods
Study Sites
Hydroacoustic surveys will be conducted over two summers on one natural lake
(Lake Manigotagan) and one reservoir (Lac du Bonnet), both of which are a part of the
Winnipeg River system in southeastern Manitoba. The much smaller Lake Manigotagan is
located at 50° 52’N 95° 37W in Nopiming Provincial Park. It is a naturally formed,
undammed lake, and the only human settlements on it are a modest fishing lodge and some
small cabins. Lac du Bonnet is located at 50° 22’N 95° 55’W. It is a reservoir which is
dammed at both ends and is highly developed, with many large summer homes,
campgrounds, and a small town on its banks. Each system has a maximum depth of
approximately 30 metres, and summer surface temperature is approximately 22°C.
6. Both Lac du Bonnet and Lake Manigotagan lie over the Canadian Shield in the
transition zone between aspen parkland and boreal forest, and can be classified as
mesotrophic. Each is characterized by larger fish such as walleye (Sander vitreus), sauger
(Sander canadensis), northern pike (Esoxlucius), lake whitefish (Coregonusclupeaformis)
and burbot (Lotalota), as well as smaller cisco (Coregonusspp.) and shiners
(Notropisspp.)(Stewart and Watkinson 2004; personal observation August 2011).
Hydroacoustic Surveys
Acoustic surveys will be performed in July and August of 2011 and 2012 in both
systems. Parallel straight-line transects will be run along the short axis of the basin getting
as close to the shoreline as possible in order to cover the most ground. Space between
transects will be one nautical mile for Lac du Bonnet and 500m for Lake Manigotagan, with
vessel speeds of 6kts and 4kts, respectively. Areas with high densities of fish targets will be
adaptively sampled with increased transect frequency to capture more variability.
A BioSonicssplitbeam DTX echosounder will be used with 200kHz, 430kHz and
1000kHz transducers mounted on a 17’ Boston Whaler. The vessel will have a foam-cored
hull and a four-stroke engine, and will use battery power to reduce noise interference. The
transducers will be deployed on an aluminum arm between 40 and 50cm below the water
surface. Transducers will be calibrated using well-established standard methods (Foote
1982). All acoustic data will be georeferenced with an integrated GPS and collected using
Visual Acquisition Software version 6.0.2 (BioSonics Inc., Seattle, WA, USA).Acoustic fish
target signals will be ground-truthed haphazardly using a combination of gill-netting and
7. line fishing at sites that are identified as having high fish densities or unique acoustic fish
signal.
Target Strength Experiments
In situ target strength experiments will be performed in order to quantify the
relationship between target strength and body size for the more important species in the
study sites. Fish of a known size will be enclosed in a mesh bag beneath the transducers for
a period of time to record target strength. An underwater camera will be used to help
quantify any deviations in target strength due to fish movement (Gauthier and Rose 2001).
This technique may also shed light on what some of the species that are actually observed
with the hydroacoustics, furthering our understanding of how the ecosystems are
structured.
Plankton Sampling
Plankton sampling to ground-truth acoustic signals will occurhaphazardly at sites
with interesting or unrecognized signals (collected with the 1000kHz transducer), with
enough replication to ensure each signal type is consistently identifiable. Vertical tows will
take place with an 80µm plankton net. Zooplankton will be counted, measured and
identified in the lab. A fluorometer will be used to systematically measure chlorophyll a
levels in the water as a proxy for phytoplankton densities. Maps portraying both
zooplankton andphytoplankton distributions will be created using ArcGIS 10 Software
(ESRI Inc., Redlands, CA, USA).
8. Fish Tagging
During the summer of 2012 several individual fish will be tagged and tracked with
the Vemco VRAP acoustic telemetry system (Amirix Systems Inc., Halifax, NS, Canada) in
order to determine the movement patterns of fish within each system.
Data Analysis
All acoustic data will be edited and analyzed using Echoview version 5.0 (Myriax
Inc., Hobart, TAS, Australia). All noise in the data, including that arising from air bubbles or
wave action will be removed prior to analysis, and bottom lines will be corrected in all data
files. Abundance and biomass estimates of fish will be analyzed, while only biomass
estimates of plankton will be looked at due to logistical difficulties associated with
obtaining count data. Spatial data will be analyzed using intrinsic geostatistical methods
(Rivoirardet al. 2000) with ArcGIS 10 (ESRI).
Potential Results
The results from the first portion of the study will be largely descriptive in nature,
and will lead into the more biologically interesting topics addressed later on. Echograms
(see Figure 4) will be used to create fish and plankton distribution maps for Lac du Bonnet
and Lake Manigotagan. GIS will be used in order to visualize general patterns in
productivity that occur in each system. Biomass estimates will be performed on both fish
and plankton to determine relative abundances and to visualize the system from a ‘bird’s-
eye view’. At this point it may become apparent that fish are avoiding the vessel in
shallower areas, or that different portions of the lake or reservoir are supporting more
9. biomass. Variability in the biomass estimates from the acoustic surveys may prove to be
quite high. Repetition of surveys will hopefully deal with this problem effectively. In
addition, the fish and/or plankton may display variability in habitat selection, failing to
reveal a particular pattern.
Geostatistical analysis has the potential to reveal different patterns at different
scales in terms of the correlation between fish and plankton biomass. On a small scale, it
may be apparent that fish are not closely associated with food sources, while at a larger
scale they may be more closely linked (i.e. smaller fish or plankton avoid predators, but
predators are always close enough to food sources to access them when necessary). It may
be possible to recognize that fish are associated with a particular plankton species or body
type. Differences between day and night surveys due to diel migrations will become
evident as well.
In terms of the body size analysis, it can be predicted that a hierarchical trophic
pyramid will be exposed, one in which organisms with a much larger body size are much
less abundant and/or make up less biomass in the ecosystem due to metabolic scaling and
differences in energy use and availability. Predicted values for the relationship between
abundance and body mass can be calculated using the equation
Log Abundance = log a +b log Mass ,
wherea is a coefficient different for each group, and b (the slope of the regression line) is
approximately equal to -¾ (Boudreau and Dickie 1987). Observed data may deviate from
this as organisms can experience influences that affect their numbers outside of the body
mass – metabolism – energy flux framework, including competition from fish or other
10. species that are transient in the system, and obtaining resources from outside the system.
In addition, patterns may only be observable at certain scales, and the estimate of body size
used in this case may not capture everything (Hildrewet al. 2007a).
In conclusion, this thesis should provide a general understanding of how the
structure of the aquatic community can be described and analyzed using hydroacoustics.
Patterns of organism distribution will be better understood in both freshwater systems,
and the role of body size on the partitioning and movement of energy throughout the
ecosystem will be exposed.In general the project will help to better understand the
productive capacity of fish habitats and how to assess it. This will lead to further
knowledge about the impacts of hydropower projects on aquatic ecosystems.
13. Figure 3.Photo of the deployment system for the acoustic transducers. The arm swings
down into the water, orienting the transducer faces toward the lake bottom.
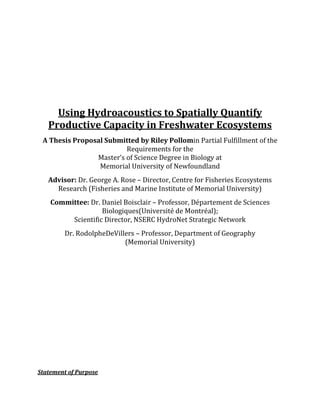
14. Figure 4.200 kHz echogram displaying bathymetry, plankton and fish targets in Lake
Manigotagan, Manitoba. Hotter colours represent stronger sound wave backscatter
detection by the transducer. The lake bottom is the large yellow-green band. Light
blue fish targets are visible, and dark purple flecks represent plankton signal,
evidently beginning at the thermocline or about eight metres depth. Maximum
depth is approximately 25m.
15. Timetable and Milestones
Milestone Description Timeframe
Attend workshops in Seattle to learn hydroacoustics basics, how
Acoustic Training to use BioSonics DTX system, how to use Echoview software January 2011
program.
MED-A1 Complete Marine Emergency Duties course January 2011
Research Aboard the RV Taking part in cod acoustic and trawl surveys with other CFER
February 2011
Celtic Explorer members aboard the RV Celtic Explorer
Complete Transport Canada's Small Vessel Operator's
SVOP April 2011
Proficiency course
Complete multiple acoustic surveys of both LakeManigotagan
First Field Season and Lac du Bonnet; Collect first set of plankton data; Perform July & August 2011
some gillnetting to groundtruth acoustic fish signals.
Complete MSc. coursework at MUN including Biology 7220:
Model-based Statistics in Biology; Biology 7000: Graduate Core September-December
Course Work
Seminar; and Fisheries Resource Management 6009: Overview 2011
of World Fisheries.
Complete comprehensive research proposal for peer review and
Research Proposal November 21st, 2011
editing.
Present proposal to Biology 7000 classmates and instructors for
Research Proposal Seminar November 28th, 2011
critiquing.
Departmental Research
Present proposal to MUN Biology Department. December 5th, 2011
Proposal Seminar
Edit and analyze data using Echoview. Map plankton and fish
Data Editing and Analysis distributions using ArcGIS. Perform geostatistical analyses. January-May 2012
Preliminary thesis preparations.
Research Aboard the RV Taking part in cod acoustic and trawl surveys with other CFER
May 2012
Celtic Explorer members aboard the RV Celtic Explorer
Complete multiple acoustic surveys of both Lake Manigotagan
and Lac du Bonnet; Collect more comprehensive plankton data;
Perform gillnetting to groundtruth acoustic fish signals; Use
Second Field Season July & August 2012
VRAP telemetry system to track several fish species in each
system; Perform in situ target strength experiments to relate
target strength to fish body size.
Edit and analyze data using Echoview. Map plankton and fish September-November
Data Editing and Analysis
distributions using ArcGIS. Perform geostatistical analyses. 2012
Submit First Draft of
December 2012
Thesis
January-February
Thesis Revisions
2012
Convocation June 2013
16. Literature Cited
Allen, T. F. H. And T. W. Hoekstra. 1992. Toward a Unified Ecology. New York, NY, USA:
Columbia University Press.
Amakasu, K. and M. Furusawa. 2006. The target strength of Antarctic krill (Euphasia
superb) measured by the split-beam method in a small tank at 70 kHz. ICES Journal
of Marine Science 63:36-45.
Argent, D. G. and W. G. Kimmel. 2005. Efficiency and selectivity of gill nets for assessing fish
community composition of large rivers. North American journal of Fisheries
Management 25:1315-1320.
Belgrano, A. and J. Reiss.eds. 2011.Advances in Ecological Research Volume 45: The Role of
Body Size in Multispecies Systems. Waltham, MA, USA: Academic Press.
Brauman, K. A., G. C. Daly, T. K. Duarte, and H. A. Mooney. 2007. The nature and value of
ecosystem services: An overview highlighting hydrologic services. Annual Review of
Environment and Resources 32:67-98.
Brown, J. H., A. P. Allen and J. F. Gillooly. 2007. The metabolic theory of ecology and the role
of body size in marine and freshwater ecosystems. In Body Size: The Structure and
Function of Aquatic Ecosystems (Hildrew, A., D. Rafaelli and R. Edmonds-Brown, eds),
pp. 1-15, Cambridge University Press.
Brown, J. H., J. F. Gilooly, A. P. Allen, V. M. Savage and G. B. West. 2004. Toward a metabolic
theory of ecology. Ecology 85(7):1771-1789.
Dickie, L. M., S. R. Kerr and P. R. Boudreau. 1987. Size-dependent processes underlying
regularities in ecosystem structure. Ecological Monographs 57(3):233-250.
Elton, C. 1927. Animal Ecology. Chicago, IL, USA: The University of Chicago Press.
Foote, K. G. 1982. Optimizing copper spheres for precision calibration of hydroacoustic
equipment. Journal of the Acoustical Society of America 71(3):742-747.
Gauthier, S. and G. A. Rose. 2001. Target strength of encaged Atlantic redfish
(Sebastesspp.). ICES Journal of Marine Science 58:562-568.
Georgakarakos, S. and D. Kitsiou. 2008. Mapping abundance distribution of small pelagic
species applying hydroacoustics and Co-Kriging techniques. Hydrobiologia612:155-
169.
Godlewska, M., M. Colon, L. Doroszczyk, C. Verges, and J. Guillard. 2009. Hydroacoustic
measurements at two frequencies: 70 and 120 kHz – consequences for fish stock
estimation. Fisheries Research 96:11-16.
Horne, J. 2000. Acoustic approaches to remote species identification: a review. Fisheries
Oceanography 9(4):356-371.
17. Hildrew, A., D. Rafaelli and R. Edmonds-Brown.eds. 2007. Body Size: The Structure and
Function of Aquatic Ecosystems. New York, NY, USA: Cambridge University Press.
Hildrew, A., D. Rafaelli and R. Edmonds-Brown.2007a. Body size in aquatic ecology:
important, but not the whole story. In Body Size: The Structure and Function of
Aquatic Ecosystems (Hildrew, A., D. Rafaelli and R. Edmonds-Brown, eds), pp. 326-
334, Cambridge University Press.
Kerr, S. R. and L. M. Dickie. 2001. The Biomass Spectrum: A predator-prey theory of aquatic
production. New York, NY, USA: Columbia University Press.
Jennings, S., J. K. Pinnegar, N. V. C. Polunin and T. W. Boon.2001. Weak cross-species
relationships between body size and trophic level belie powerful size-based trophic
structuring in fish communities. Journal of Animal Ecology 70:934-944.
Levin, S. A. 1992. The problem of pattern and scale in ecology.Ecology 73(6):1943-1967.
Mehner, T., P. Kasprzak, and F. Hölker. 2007. Exploring ultimate hypotheses to predict diel
vertical migrations in coregonid fish. Canadian Journal of Fisheries and Aquatic
Science 64:874-886.
Minns, C. K. 1997. Quantifying “no net loss” of productivity of fish habitats. Canadian
Journal of Fisheries and Aquatic Science 54:2463-2473.
Ormerod, S. J., M. Dobson, A. G. Hildrew, and C. R. Townsend. 2010. Multiple stressors in
freshwater ecosystems. Freshwater Biology 55(Suppl. 1):1-4.
Randall, R. G. and C. K. Minns. 2002. Comparison of a habitat productivity index (HPI) and
an index of biotic integrity (IBI) for measuring the productive capacity of fish
habitat in nearshore areas of the Great Lakes. Journal of Great Lakes Research
28(2):240-255.
Ransom, B. H., S. V. Johnston and T. W. Steig. 1998. Review on monitoring adult salmonid
(OnchorhynchusandSalmospp.) escapement using fixed-location split-beam
hydroacoustics. Fisheries Research 35:33-42.
Rivoirard, J., J. Simmonds, K. G. Foote, P. Fernandes and N. Bez. 2000. Geostatistics for
Estimating Fish Abundance. Osney Mead, OX, UK: Blackwell Science Ltd.
Robichaud, D. and G. A. Rose. 2002. Assessing evacuation rates and spawning abundance of
marine fishes using coupled telemetric and acoustic surveys. ICES Journal of Marine
Science 59:254-260.
Rose, G. A. and W. C. Leggett. 1990. The importance of scale to predator-prey spatial
correlations: An example of Atlantic Fishes. Ecology 71(1):33-43.
Rosenberg, D. M., F. Berkes, R. A. Bodaly, R. E. Hecky, C. A. Kelly, and J. W. M. Rudd. 1997.
Large-scale impacts of hydroelectric development. Environmental Reviews 5(1):27-
54.
18. Rudstam, L. G., S. L. Parker-Setter, P. J. Sullivan, and D. M. Warmer. 2009. Towards a
standard operating procedure for fishery acoustic surveys in the Laurentian Great
Lakes, North America. ICES Journal of Marine Science 66:1391-1397.
Scheuerell, M. D. and D. E. Schindler. 2004. Changes in the spatial distribution of fishes in
lakes along a residential development gradient. Ecosystems 7:98-106.
Selivanovsky, D. A., P. A. Stunzhas, and I. N. Didenkulov.Acoustical investigation of
phytoplankton.ICES Journal of Marine Science 53:313-316.
Simmonds, J. And D. MacLennan. 2005. Fisheries Acoustics: Theory and Practice (2nd Edition).
Oxford, UK: Blackwell Science Publishing Ltd.
Smokorowski, K. E., N. Bergeron, D. Boisclair, K. Clarke, S. Cooke, R. Cunjack, J. Dawson, B.
Eaton, F. Hicks, P. Higgins, C. Katopodis, M. Lapointe, P. Legendre, M. Power, R.
Randall, J. Rasmussen, G. Rose, A. Saint-Hilaire, B. Sellars, G. Swanson, N. Winfield, R.
Wysocki and D. Zhu. 2011. NSERC’s HydroNet: A national research network to
promote sustainable hydropower and healthy aquatic ecosystems. Fisheries
36(10):480-488.
Stewart, K. W. and D. A. Watkinson. 2004. The Freshwater Fishes of Manitoba. Winnipeg,
MB, Canada: Manitoba University Press.
Trout, G. C., A. J. Lee, I. D. Richardson and F. R. Harden Jones. 1952. Recent echosounder
studies. Nature 170(4315):71-72.
Tungate, D. S. 1958. Echo-sounder surveys in the autumn of 1956. Fishery Investigations,
Series 2 12:3-17.
Woodward, G, B. Ebenman, M. Emmerson, J. M. Montoya, J. M. Olesen, A. Valido, and P. H.
Warren. Body size in ecological networks.Trends in Ecology and Evolution
20(7):402-409.
Yvon-durocher, G., J. Reiss, J. Blanchard, B. Ebenman, D. M. Perkins, D. C. Reuman, A.
Thierry, G. Woodward and O. L. Petchey. Across ecosystem comparisons of size
structure: methods, approaches and prospects. Oikos120: 550-563.