SlideShare a Scribd company logo
1 of 4
Michael Abramson – Raphaël Bils – Lucie Wullschleger                               Business Forecasting


Does Junk Food make you feel better?


People tend to eat more and more Junk Food. Does the level of happiness is related with the junk food
sales worldwide? Is Junk Food related to well-being?

 Countries                  Level of happiness (X)        Junk Food Sales (Y)
                                                           $
 Russia                                              32   180,000.00
                                                           $
 Spain                                               36   220,000.00
                                                           $
 Brazil                                              71   390,000.00
                                                           $
 Canada                                              65   510,000.00
                                                           $
 China                                               78   890,000.00
                                                           $
 United Kingdom                                      85   1,300,000.00
                                                           $
 United States                                       88   1,450,000.00
                                                           $
 Japan                                               92   1,340,000.00
                                                           $
 South Korea                                         82   830,000.00
                                                           $
 Germany                                             73   610,000.00
                                                           $
 France                                              46   290,000.00
                                                           $
 Taïwan                                              37   490,000.00


SUMMARY OUTPUT

   Regression Statistics
Multiple R       0.858003
R Square        0.736169
Adjusted R
Square           0.709786
Standard
Error            242969.1
Michael Abramson – Raphaël Bils – Lucie Wullschleger                                                                                                                 Business Forecasting


Observations                                   12

ANOVA
                                                                                                                                                 Significan
                                      Df                                             SS                               MS                 F          ce F
                                                                                                                    1.65E+1
Regression                                      1                        1.65E+12                                         2           27.90302   0.000356
Residual                                       10                         5.9E+11                                   5.9E+10
Total                                          11                        2.24E+12

                            Coefficien                                  Standard                                                                  Lower         Upper       Lower       Upper
                               ts                                         Error                                      t Stat           P-value      95%           95%        95.0%       95.0%
                                                                                                                          -
Intercept                      -446134                                   229531.7                                   1.94367           0.080589    -957563       65294.18    -957563    65294.18
X Variable 1                  17647.91                                   3340.933                                   5.28233           0.000356   10203.85       25091.97   10203.85    25091.97


Null Hypothesis H0: The amount of the junk food sales will not be statistically significant and dependent
on the change in level of happiness.

Alternative Hypothesis: H1: The amount of our sales will be affected in a statistically significant manner
by the level of happiness.


Sales vs. Happiness Level Example for Regression and Interpreting the Statistics:

The goal of regression is to produce an equation that "best" depicts the relationship and minimizes the
deviations between the plotted points.

A "tighter" the regression line, the better


           Level of Happiness (X)                                                                                                                             Junk Food Sales (Y)
 100                                                                                                                                    1,600,000.00
                                                                                                                                        1,400,000.00
  80                                                                                                                                    1,200,000.00
                                                                                                                                        1,000,000.00
  60                                                                                                                                      800,000.00
  40                                                                                                                                      600,000.00
                                                                                                                                          400,000.00
  20                                                                                                                                      200,000.00
                                                                                                                                                   -
   0
                                                                                                                                                       United Kingdom
                                                                                                                                                               Canada


                                                                                                                                                                France
                                                                                                                                                                 Russia

                                                                                                                                                                  Brazil

                                                                                                                                                                 China

                                                                                                                                                         United States
                                                                                                                                                                 Japan


                                                                                                                                                                Taïwan
                                                                                                                                                                  Spain


                                                                                                                                                             Germany
                                                                                                                                                           South Korea
                         Brazil


                                           China


                                                                                                                    France
                 Spain


                                  Canada


                                                                                            South Korea
        Russia


                                                                    United States
                                                                                    Japan


                                                                                                                             Taïwan
                                                   United Kingdom


                                                                                                          Germany


What is the Data Telling You?
Michael Abramson – Raphaël Bils – Lucie Wullschleger                                       Business Forecasting


The collection of data for tracking is best when it's been tracked over a longer period of time or a survey
has been done with a fairly high sample size and limited questioning bias.

The R squared value tells us what percent of the variation in the data is explained by the regression
equation given.
The Regression equation for a line is: Y = mX + b

The Least Square line equation is: Y = b0 + b1X

The R squared value of 73.6% tells us what percent of the variation in the data is explained by the
regression equation given.

This is high and seems to show a positive linear correlation between happiness level and sales.

In a boarder sense, an R squared of .30 could be considered high when forecasting the economy
because of multiple input variables. Example, the weather make you more or less happy, the stress you
have in your city, the revenue per capita in your country…

The T statistic will help us determine if the regression equation is a good one to use for forecasting.

The T statistic is an independent test that reveals if an X variable has a statistically significant effect on
the Y (stress levelvs sales).

It is calculated by dividing the X coefficient by the standard error.

The T statistic is used because it's possible to create a model with more than 1 variable (multiple
regression) and as the number of variables is added, the R squared will rise.

The general rule for significance of our T statistic is > 2 for a positivecorrelation or < -2 for a negative
correlation.
When considering if a model is a good forecaster, it's best to have both a high R squared and T statistic
(>2 or < -2)

The Standard Error is synonymous with the standard deviation, which means how far something will
move from the mean or center of the curve.

The standard error is an estimate of the amount of variability inherent in the regression and can be
measured with the MSE or Mean Square Error

The best forecast would have a lower standard deviation, which is associated with less risk.

The P Value is the probability of accepting the null hypothesis (our general assumption that stress level
has no affect on sales of ice cream) when testing at certain confidence levels: 90%, 95%, 99%.

In this case, it's associated with the independent variable and is usually good if it's < .05 or <.01
depending on the significant level we are testing at.
Michael Abramson – Raphaël Bils – Lucie Wullschleger                                 Business Forecasting


The F test plays an important role in the analysis of variance, ANOVA. These sums of squares are
constructed so that the statistic tends to be greater when the null hypothesis is not true.

Forecasting is the process of making statements about events whose actual outcomes have not occurred
yet. Forecasting is "trying" to predict the future based on past events.

Forecasting is both an "art" and a "science." The most accurate forecasts are ones in which managers
have clearly tracked past data, have standard probabilities assigned, or have done an extensive survey
sample with high number of participants. i.e. at least 100 but usually a couple of thousand.

The forecast variables in the above examples are:

Y intercept = b = -446,134
X variable = m = 17,647.91

Residual Plot analysis: If the points in a residual plot are randomly dispersed around the horizontal
axis, a linear regression model is appropriate for the data; otherwise, a non-linear model is more
appropriate.


                                          Junk Food Sales vs Happiness
                            1600000
                            1400000
      Junk Food Sales ($)


                            1200000
                            1000000
                             800000
                             600000
                             400000
                             200000
                                  0
                                      0     20       40         60        80   100
                                                 Level of Happiness (%)


Using a forecast

What is the predicted amount of sales with happiness level forecast of 61, 100, 44%s ?

                            Solution
61:                         17,647.91x61-446134= $630,388.51

100:                        $1,318,657

44:                         $330,374.04

Conclusion: If you want to open a Junk Food restaurant, you would have better result opening it in a
stressful city where people need to feel happier, faster…

More Related Content

What's hot

Consulting toolkit profit trees
Consulting toolkit   profit treesConsulting toolkit   profit trees
Consulting toolkit profit treeschrisdoran
 
Heesen san diego venture group - 2012-01-24
Heesen   san diego venture group - 2012-01-24Heesen   san diego venture group - 2012-01-24
Heesen san diego venture group - 2012-01-24San Diego Venture Group
 
Google student survey p4
Google student survey p4Google student survey p4
Google student survey p4liana1995
 
Texas Market O Verview Kdh
Texas Market O Verview KdhTexas Market O Verview Kdh
Texas Market O Verview KdhBob Lowery
 
Executive Summary Case 4 Melford
Executive Summary  Case 4 MelfordExecutive Summary  Case 4 Melford
Executive Summary Case 4 MelfordUCFPMBA
 
marriott international 2001 Annual Report
marriott international 2001 Annual Reportmarriott international 2001 Annual Report
marriott international 2001 Annual Reportfinance20
 
2009 Market Disruption Webinar
2009 Market Disruption Webinar2009 Market Disruption Webinar
2009 Market Disruption WebinarBrent B
 
Diane Watson | Research to improve public confidence and views on quality in ...
Diane Watson | Research to improve public confidence and views on quality in ...Diane Watson | Research to improve public confidence and views on quality in ...
Diane Watson | Research to improve public confidence and views on quality in ...Sax Institute
 
SMH Market & Liquidity Services
SMH Market & Liquidity ServicesSMH Market & Liquidity Services
SMH Market & Liquidity Serviceskathleenunger
 
Bill Stankeiwicz Copy Scope 2010 Bristlecone Co. Strategy
Bill Stankeiwicz Copy Scope 2010 Bristlecone Co. StrategyBill Stankeiwicz Copy Scope 2010 Bristlecone Co. Strategy
Bill Stankeiwicz Copy Scope 2010 Bristlecone Co. StrategyBillStankiewicz
 
Stryker AnnualReport2008
Stryker AnnualReport2008Stryker AnnualReport2008
Stryker AnnualReport2008finance34
 
Llc Business Model 2011 Sr20 B Cv1
Llc Business Model   2011 Sr20 B Cv1Llc Business Model   2011 Sr20 B Cv1
Llc Business Model 2011 Sr20 B Cv1Bill Cattley
 
regions Citigroup Napa_20080521
regions Citigroup Napa_20080521regions Citigroup Napa_20080521
regions Citigroup Napa_20080521finance25
 

What's hot (16)

Consulting toolkit profit trees
Consulting toolkit   profit treesConsulting toolkit   profit trees
Consulting toolkit profit trees
 
Ch 04
Ch 04Ch 04
Ch 04
 
Heesen san diego venture group - 2012-01-24
Heesen   san diego venture group - 2012-01-24Heesen   san diego venture group - 2012-01-24
Heesen san diego venture group - 2012-01-24
 
Google student survey p4
Google student survey p4Google student survey p4
Google student survey p4
 
Texas Market O Verview Kdh
Texas Market O Verview KdhTexas Market O Verview Kdh
Texas Market O Verview Kdh
 
Executive Summary Case 4 Melford
Executive Summary  Case 4 MelfordExecutive Summary  Case 4 Melford
Executive Summary Case 4 Melford
 
GPI2004AR
GPI2004ARGPI2004AR
GPI2004AR
 
marriott international 2001 Annual Report
marriott international 2001 Annual Reportmarriott international 2001 Annual Report
marriott international 2001 Annual Report
 
2009 Market Disruption Webinar
2009 Market Disruption Webinar2009 Market Disruption Webinar
2009 Market Disruption Webinar
 
Diane Watson | Research to improve public confidence and views on quality in ...
Diane Watson | Research to improve public confidence and views on quality in ...Diane Watson | Research to improve public confidence and views on quality in ...
Diane Watson | Research to improve public confidence and views on quality in ...
 
SMH Market & Liquidity Services
SMH Market & Liquidity ServicesSMH Market & Liquidity Services
SMH Market & Liquidity Services
 
Bill Stankeiwicz Copy Scope 2010 Bristlecone Co. Strategy
Bill Stankeiwicz Copy Scope 2010 Bristlecone Co. StrategyBill Stankeiwicz Copy Scope 2010 Bristlecone Co. Strategy
Bill Stankeiwicz Copy Scope 2010 Bristlecone Co. Strategy
 
Stryker AnnualReport2008
Stryker AnnualReport2008Stryker AnnualReport2008
Stryker AnnualReport2008
 
Llc Business Model 2011 Sr20 B Cv1
Llc Business Model   2011 Sr20 B Cv1Llc Business Model   2011 Sr20 B Cv1
Llc Business Model 2011 Sr20 B Cv1
 
Red Crescent Resources Limited
Red Crescent Resources LimitedRed Crescent Resources Limited
Red Crescent Resources Limited
 
regions Citigroup Napa_20080521
regions Citigroup Napa_20080521regions Citigroup Napa_20080521
regions Citigroup Napa_20080521
 

Viewers also liked

Viewers also liked (20)

A Diverse and Inclusive World (workshop)
A Diverse and Inclusive World (workshop)A Diverse and Inclusive World (workshop)
A Diverse and Inclusive World (workshop)
 
Cybercrime
CybercrimeCybercrime
Cybercrime
 
02252012
0225201202252012
02252012
 
Trabajo 2
Trabajo 2Trabajo 2
Trabajo 2
 
Université de Montréal REP2300 - Cours 6 - 2013
Université de Montréal REP2300 - Cours 6 - 2013Université de Montréal REP2300 - Cours 6 - 2013
Université de Montréal REP2300 - Cours 6 - 2013
 
Herramienta tecnológica slideshare
Herramienta tecnológica slideshareHerramienta tecnológica slideshare
Herramienta tecnológica slideshare
 
Apagon analogico en mexico
Apagon analogico en mexico Apagon analogico en mexico
Apagon analogico en mexico
 
No alejarse involucrarse
No alejarse involucrarseNo alejarse involucrarse
No alejarse involucrarse
 
Why is energy efficiency so damn unsexy?
Why is energy efficiency so damn unsexy?Why is energy efficiency so damn unsexy?
Why is energy efficiency so damn unsexy?
 
PRESENTACION EFECTO INVERNADERO
PRESENTACION EFECTO INVERNADERO PRESENTACION EFECTO INVERNADERO
PRESENTACION EFECTO INVERNADERO
 
Early idea's
Early idea'sEarly idea's
Early idea's
 
Andy barón higiene-a2
Andy barón higiene-a2Andy barón higiene-a2
Andy barón higiene-a2
 
Taller de tecnologia web 2
Taller de tecnologia web 2Taller de tecnologia web 2
Taller de tecnologia web 2
 
Biologi sel
Biologi selBiologi sel
Biologi sel
 
Guia plan-de-negocios
Guia plan-de-negociosGuia plan-de-negocios
Guia plan-de-negocios
 
Food and Diet
Food and DietFood and Diet
Food and Diet
 
Wk7 assignbarbere
Wk7 assignbarbereWk7 assignbarbere
Wk7 assignbarbere
 
Taniltsuulga
TaniltsuulgaTaniltsuulga
Taniltsuulga
 
Donación de órganos
Donación de órganosDonación de órganos
Donación de órganos
 
Early idea's (1)
Early idea's (1)Early idea's (1)
Early idea's (1)
 

Similar to Junk food final 1

Similar to Junk food final 1 (20)

A Cheaper Hospital In Five Days
A Cheaper Hospital In Five DaysA Cheaper Hospital In Five Days
A Cheaper Hospital In Five Days
 
Car Net Business Plan
Car Net Business PlanCar Net Business Plan
Car Net Business Plan
 
Presupuesto mensual
Presupuesto mensualPresupuesto mensual
Presupuesto mensual
 
Presupuesto mensual
Presupuesto mensualPresupuesto mensual
Presupuesto mensual
 
Ch.11
Ch.11Ch.11
Ch.11
 
Melford Written Analysis
Melford Written AnalysisMelford Written Analysis
Melford Written Analysis
 
E2 financial oep report
E2 financial oep reportE2 financial oep report
E2 financial oep report
 
Chapter 10generac flujo caja
Chapter 10generac flujo cajaChapter 10generac flujo caja
Chapter 10generac flujo caja
 
HSBC M&A: curse or cure
HSBC M&A: curse or cure HSBC M&A: curse or cure
HSBC M&A: curse or cure
 
Americaspony
AmericasponyAmericaspony
Americaspony
 
State of California Wireless
State of California WirelessState of California Wireless
State of California Wireless
 
Sales p.p
Sales p.pSales p.p
Sales p.p
 
André Ernst
André ErnstAndré Ernst
André Ernst
 
Using The What If Scenarios In Excel
Using The What If Scenarios In ExcelUsing The What If Scenarios In Excel
Using The What If Scenarios In Excel
 
Sales Math Workshop
Sales Math WorkshopSales Math Workshop
Sales Math Workshop
 
Budget Forecast Project
Budget Forecast ProjectBudget Forecast Project
Budget Forecast Project
 
Mini Case2
Mini Case2Mini Case2
Mini Case2
 
Differential games
Differential gamesDifferential games
Differential games
 
Grupo Technos 2Q11
Grupo Technos 2Q11Grupo Technos 2Q11
Grupo Technos 2Q11
 
amgen Investors_2000_AnnualReport
amgen Investors_2000_AnnualReportamgen Investors_2000_AnnualReport
amgen Investors_2000_AnnualReport
 

Recently uploaded

CARE OF CHILD IN INCUBATOR..........pptx
CARE OF CHILD IN INCUBATOR..........pptxCARE OF CHILD IN INCUBATOR..........pptx
CARE OF CHILD IN INCUBATOR..........pptxGaneshChakor2
 
ECONOMIC CONTEXT - LONG FORM TV DRAMA - PPT
ECONOMIC CONTEXT - LONG FORM TV DRAMA - PPTECONOMIC CONTEXT - LONG FORM TV DRAMA - PPT
ECONOMIC CONTEXT - LONG FORM TV DRAMA - PPTiammrhaywood
 
How to Configure Email Server in Odoo 17
How to Configure Email Server in Odoo 17How to Configure Email Server in Odoo 17
How to Configure Email Server in Odoo 17Celine George
 
Pharmacognosy Flower 3. Compositae 2023.pdf
Pharmacognosy Flower 3. Compositae 2023.pdfPharmacognosy Flower 3. Compositae 2023.pdf
Pharmacognosy Flower 3. Compositae 2023.pdfMahmoud M. Sallam
 
Kisan Call Centre - To harness potential of ICT in Agriculture by answer farm...
Kisan Call Centre - To harness potential of ICT in Agriculture by answer farm...Kisan Call Centre - To harness potential of ICT in Agriculture by answer farm...
Kisan Call Centre - To harness potential of ICT in Agriculture by answer farm...Krashi Coaching
 
Introduction to ArtificiaI Intelligence in Higher Education
Introduction to ArtificiaI Intelligence in Higher EducationIntroduction to ArtificiaI Intelligence in Higher Education
Introduction to ArtificiaI Intelligence in Higher Educationpboyjonauth
 
भारत-रोम व्यापार.pptx, Indo-Roman Trade,
भारत-रोम व्यापार.pptx, Indo-Roman Trade,भारत-रोम व्यापार.pptx, Indo-Roman Trade,
भारत-रोम व्यापार.pptx, Indo-Roman Trade,Virag Sontakke
 
“Oh GOSH! Reflecting on Hackteria's Collaborative Practices in a Global Do-It...
“Oh GOSH! Reflecting on Hackteria's Collaborative Practices in a Global Do-It...“Oh GOSH! Reflecting on Hackteria's Collaborative Practices in a Global Do-It...
“Oh GOSH! Reflecting on Hackteria's Collaborative Practices in a Global Do-It...Marc Dusseiller Dusjagr
 
POINT- BIOCHEMISTRY SEM 2 ENZYMES UNIT 5.pptx
POINT- BIOCHEMISTRY SEM 2 ENZYMES UNIT 5.pptxPOINT- BIOCHEMISTRY SEM 2 ENZYMES UNIT 5.pptx
POINT- BIOCHEMISTRY SEM 2 ENZYMES UNIT 5.pptxSayali Powar
 
Paris 2024 Olympic Geographies - an activity
Paris 2024 Olympic Geographies - an activityParis 2024 Olympic Geographies - an activity
Paris 2024 Olympic Geographies - an activityGeoBlogs
 
_Math 4-Q4 Week 5.pptx Steps in Collecting Data
_Math 4-Q4 Week 5.pptx Steps in Collecting Data_Math 4-Q4 Week 5.pptx Steps in Collecting Data
_Math 4-Q4 Week 5.pptx Steps in Collecting DataJhengPantaleon
 
internship ppt on smartinternz platform as salesforce developer
internship ppt on smartinternz platform as salesforce developerinternship ppt on smartinternz platform as salesforce developer
internship ppt on smartinternz platform as salesforce developerunnathinaik
 
Mastering the Unannounced Regulatory Inspection
Mastering the Unannounced Regulatory InspectionMastering the Unannounced Regulatory Inspection
Mastering the Unannounced Regulatory InspectionSafetyChain Software
 
EPANDING THE CONTENT OF AN OUTLINE using notes.pptx
EPANDING THE CONTENT OF AN OUTLINE using notes.pptxEPANDING THE CONTENT OF AN OUTLINE using notes.pptx
EPANDING THE CONTENT OF AN OUTLINE using notes.pptxRaymartEstabillo3
 
Call Girls in Dwarka Mor Delhi Contact Us 9654467111
Call Girls in Dwarka Mor Delhi Contact Us 9654467111Call Girls in Dwarka Mor Delhi Contact Us 9654467111
Call Girls in Dwarka Mor Delhi Contact Us 9654467111Sapana Sha
 
Painted Grey Ware.pptx, PGW Culture of India
Painted Grey Ware.pptx, PGW Culture of IndiaPainted Grey Ware.pptx, PGW Culture of India
Painted Grey Ware.pptx, PGW Culture of IndiaVirag Sontakke
 
Introduction to AI in Higher Education_draft.pptx
Introduction to AI in Higher Education_draft.pptxIntroduction to AI in Higher Education_draft.pptx
Introduction to AI in Higher Education_draft.pptxpboyjonauth
 

Recently uploaded (20)

CARE OF CHILD IN INCUBATOR..........pptx
CARE OF CHILD IN INCUBATOR..........pptxCARE OF CHILD IN INCUBATOR..........pptx
CARE OF CHILD IN INCUBATOR..........pptx
 
ECONOMIC CONTEXT - LONG FORM TV DRAMA - PPT
ECONOMIC CONTEXT - LONG FORM TV DRAMA - PPTECONOMIC CONTEXT - LONG FORM TV DRAMA - PPT
ECONOMIC CONTEXT - LONG FORM TV DRAMA - PPT
 
How to Configure Email Server in Odoo 17
How to Configure Email Server in Odoo 17How to Configure Email Server in Odoo 17
How to Configure Email Server in Odoo 17
 
Pharmacognosy Flower 3. Compositae 2023.pdf
Pharmacognosy Flower 3. Compositae 2023.pdfPharmacognosy Flower 3. Compositae 2023.pdf
Pharmacognosy Flower 3. Compositae 2023.pdf
 
Model Call Girl in Tilak Nagar Delhi reach out to us at 🔝9953056974🔝
Model Call Girl in Tilak Nagar Delhi reach out to us at 🔝9953056974🔝Model Call Girl in Tilak Nagar Delhi reach out to us at 🔝9953056974🔝
Model Call Girl in Tilak Nagar Delhi reach out to us at 🔝9953056974🔝
 
Kisan Call Centre - To harness potential of ICT in Agriculture by answer farm...
Kisan Call Centre - To harness potential of ICT in Agriculture by answer farm...Kisan Call Centre - To harness potential of ICT in Agriculture by answer farm...
Kisan Call Centre - To harness potential of ICT in Agriculture by answer farm...
 
Introduction to ArtificiaI Intelligence in Higher Education
Introduction to ArtificiaI Intelligence in Higher EducationIntroduction to ArtificiaI Intelligence in Higher Education
Introduction to ArtificiaI Intelligence in Higher Education
 
भारत-रोम व्यापार.pptx, Indo-Roman Trade,
भारत-रोम व्यापार.pptx, Indo-Roman Trade,भारत-रोम व्यापार.pptx, Indo-Roman Trade,
भारत-रोम व्यापार.pptx, Indo-Roman Trade,
 
“Oh GOSH! Reflecting on Hackteria's Collaborative Practices in a Global Do-It...
“Oh GOSH! Reflecting on Hackteria's Collaborative Practices in a Global Do-It...“Oh GOSH! Reflecting on Hackteria's Collaborative Practices in a Global Do-It...
“Oh GOSH! Reflecting on Hackteria's Collaborative Practices in a Global Do-It...
 
POINT- BIOCHEMISTRY SEM 2 ENZYMES UNIT 5.pptx
POINT- BIOCHEMISTRY SEM 2 ENZYMES UNIT 5.pptxPOINT- BIOCHEMISTRY SEM 2 ENZYMES UNIT 5.pptx
POINT- BIOCHEMISTRY SEM 2 ENZYMES UNIT 5.pptx
 
Paris 2024 Olympic Geographies - an activity
Paris 2024 Olympic Geographies - an activityParis 2024 Olympic Geographies - an activity
Paris 2024 Olympic Geographies - an activity
 
_Math 4-Q4 Week 5.pptx Steps in Collecting Data
_Math 4-Q4 Week 5.pptx Steps in Collecting Data_Math 4-Q4 Week 5.pptx Steps in Collecting Data
_Math 4-Q4 Week 5.pptx Steps in Collecting Data
 
internship ppt on smartinternz platform as salesforce developer
internship ppt on smartinternz platform as salesforce developerinternship ppt on smartinternz platform as salesforce developer
internship ppt on smartinternz platform as salesforce developer
 
Mastering the Unannounced Regulatory Inspection
Mastering the Unannounced Regulatory InspectionMastering the Unannounced Regulatory Inspection
Mastering the Unannounced Regulatory Inspection
 
EPANDING THE CONTENT OF AN OUTLINE using notes.pptx
EPANDING THE CONTENT OF AN OUTLINE using notes.pptxEPANDING THE CONTENT OF AN OUTLINE using notes.pptx
EPANDING THE CONTENT OF AN OUTLINE using notes.pptx
 
TataKelola dan KamSiber Kecerdasan Buatan v022.pdf
TataKelola dan KamSiber Kecerdasan Buatan v022.pdfTataKelola dan KamSiber Kecerdasan Buatan v022.pdf
TataKelola dan KamSiber Kecerdasan Buatan v022.pdf
 
Call Girls in Dwarka Mor Delhi Contact Us 9654467111
Call Girls in Dwarka Mor Delhi Contact Us 9654467111Call Girls in Dwarka Mor Delhi Contact Us 9654467111
Call Girls in Dwarka Mor Delhi Contact Us 9654467111
 
Painted Grey Ware.pptx, PGW Culture of India
Painted Grey Ware.pptx, PGW Culture of IndiaPainted Grey Ware.pptx, PGW Culture of India
Painted Grey Ware.pptx, PGW Culture of India
 
Introduction to AI in Higher Education_draft.pptx
Introduction to AI in Higher Education_draft.pptxIntroduction to AI in Higher Education_draft.pptx
Introduction to AI in Higher Education_draft.pptx
 
9953330565 Low Rate Call Girls In Rohini Delhi NCR
9953330565 Low Rate Call Girls In Rohini  Delhi NCR9953330565 Low Rate Call Girls In Rohini  Delhi NCR
9953330565 Low Rate Call Girls In Rohini Delhi NCR
 

Junk food final 1

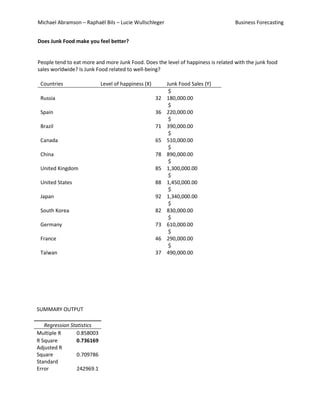
  • 1. Michael Abramson – Raphaël Bils – Lucie Wullschleger Business Forecasting Does Junk Food make you feel better? People tend to eat more and more Junk Food. Does the level of happiness is related with the junk food sales worldwide? Is Junk Food related to well-being? Countries Level of happiness (X) Junk Food Sales (Y) $ Russia 32 180,000.00 $ Spain 36 220,000.00 $ Brazil 71 390,000.00 $ Canada 65 510,000.00 $ China 78 890,000.00 $ United Kingdom 85 1,300,000.00 $ United States 88 1,450,000.00 $ Japan 92 1,340,000.00 $ South Korea 82 830,000.00 $ Germany 73 610,000.00 $ France 46 290,000.00 $ Taïwan 37 490,000.00 SUMMARY OUTPUT Regression Statistics Multiple R 0.858003 R Square 0.736169 Adjusted R Square 0.709786 Standard Error 242969.1
  • 2. Michael Abramson – Raphaël Bils – Lucie Wullschleger Business Forecasting Observations 12 ANOVA Significan Df SS MS F ce F 1.65E+1 Regression 1 1.65E+12 2 27.90302 0.000356 Residual 10 5.9E+11 5.9E+10 Total 11 2.24E+12 Coefficien Standard Lower Upper Lower Upper ts Error t Stat P-value 95% 95% 95.0% 95.0% - Intercept -446134 229531.7 1.94367 0.080589 -957563 65294.18 -957563 65294.18 X Variable 1 17647.91 3340.933 5.28233 0.000356 10203.85 25091.97 10203.85 25091.97 Null Hypothesis H0: The amount of the junk food sales will not be statistically significant and dependent on the change in level of happiness. Alternative Hypothesis: H1: The amount of our sales will be affected in a statistically significant manner by the level of happiness. Sales vs. Happiness Level Example for Regression and Interpreting the Statistics: The goal of regression is to produce an equation that "best" depicts the relationship and minimizes the deviations between the plotted points. A "tighter" the regression line, the better Level of Happiness (X) Junk Food Sales (Y) 100 1,600,000.00 1,400,000.00 80 1,200,000.00 1,000,000.00 60 800,000.00 40 600,000.00 400,000.00 20 200,000.00 - 0 United Kingdom Canada France Russia Brazil China United States Japan Taïwan Spain Germany South Korea Brazil China France Spain Canada South Korea Russia United States Japan Taïwan United Kingdom Germany What is the Data Telling You?
  • 3. Michael Abramson – Raphaël Bils – Lucie Wullschleger Business Forecasting The collection of data for tracking is best when it's been tracked over a longer period of time or a survey has been done with a fairly high sample size and limited questioning bias. The R squared value tells us what percent of the variation in the data is explained by the regression equation given. The Regression equation for a line is: Y = mX + b The Least Square line equation is: Y = b0 + b1X The R squared value of 73.6% tells us what percent of the variation in the data is explained by the regression equation given. This is high and seems to show a positive linear correlation between happiness level and sales. In a boarder sense, an R squared of .30 could be considered high when forecasting the economy because of multiple input variables. Example, the weather make you more or less happy, the stress you have in your city, the revenue per capita in your country… The T statistic will help us determine if the regression equation is a good one to use for forecasting. The T statistic is an independent test that reveals if an X variable has a statistically significant effect on the Y (stress levelvs sales). It is calculated by dividing the X coefficient by the standard error. The T statistic is used because it's possible to create a model with more than 1 variable (multiple regression) and as the number of variables is added, the R squared will rise. The general rule for significance of our T statistic is > 2 for a positivecorrelation or < -2 for a negative correlation. When considering if a model is a good forecaster, it's best to have both a high R squared and T statistic (>2 or < -2) The Standard Error is synonymous with the standard deviation, which means how far something will move from the mean or center of the curve. The standard error is an estimate of the amount of variability inherent in the regression and can be measured with the MSE or Mean Square Error The best forecast would have a lower standard deviation, which is associated with less risk. The P Value is the probability of accepting the null hypothesis (our general assumption that stress level has no affect on sales of ice cream) when testing at certain confidence levels: 90%, 95%, 99%. In this case, it's associated with the independent variable and is usually good if it's < .05 or <.01 depending on the significant level we are testing at.
  • 4. Michael Abramson – Raphaël Bils – Lucie Wullschleger Business Forecasting The F test plays an important role in the analysis of variance, ANOVA. These sums of squares are constructed so that the statistic tends to be greater when the null hypothesis is not true. Forecasting is the process of making statements about events whose actual outcomes have not occurred yet. Forecasting is "trying" to predict the future based on past events. Forecasting is both an "art" and a "science." The most accurate forecasts are ones in which managers have clearly tracked past data, have standard probabilities assigned, or have done an extensive survey sample with high number of participants. i.e. at least 100 but usually a couple of thousand. The forecast variables in the above examples are: Y intercept = b = -446,134 X variable = m = 17,647.91 Residual Plot analysis: If the points in a residual plot are randomly dispersed around the horizontal axis, a linear regression model is appropriate for the data; otherwise, a non-linear model is more appropriate. Junk Food Sales vs Happiness 1600000 1400000 Junk Food Sales ($) 1200000 1000000 800000 600000 400000 200000 0 0 20 40 60 80 100 Level of Happiness (%) Using a forecast What is the predicted amount of sales with happiness level forecast of 61, 100, 44%s ? Solution 61: 17,647.91x61-446134= $630,388.51 100: $1,318,657 44: $330,374.04 Conclusion: If you want to open a Junk Food restaurant, you would have better result opening it in a stressful city where people need to feel happier, faster…