
Recommended
Recommended
More Related Content
Similar to A UNiQyE APPROACH TO MEETINGTHE EMPLOYMENT AND TRAININGNEE.docx
Similar to A UNiQyE APPROACH TO MEETINGTHE EMPLOYMENT AND TRAININGNEE.docx (17)
More from ransayo
More from ransayo (20)
Recently uploaded
Recently uploaded (20)
A UNiQyE APPROACH TO MEETINGTHE EMPLOYMENT AND TRAININGNEE.docx
- 1. A UNiQyE APPROACH TO MEETING THE EMPLOYMENT AND TRAINING NEEDS OE FOOD STAMP RECIPIENTS By Luke Posiniewski A S the country lay entrenched in a prolonged economic downturn and claims for unemployment insurance grew exponentially, the subsequent need for expanded employment related services was clear. With an unemployment rate flirting with double dig- its and a food stamp caseload that had approximately doubled since 2008, New York state was faced with a multifaceted challenge of engaging a vast increase in the number of recipients needing service, training and reintro- ducing them to a labor market that requires skills that may be vastly differ- ent from the one they just left, and ultimately, finding a way to pay for it all. In an effort to confront this chal- lenge and continue to implement new and innovative social programs, the
- 2. New York State Office of Temporary and Disability Assistance created the Food Stamp Employment and Training Venture Initiative, taking advantage of the availability of federal matching funds to expand services. Designed to support job training and education to improve the economic prospects of those receiving benefits from the Food Stamp Program—the name still used in New York for the Supplemental Nutrition Assistance Program—the pro- gram engages the services of nonprofit agencies to target work registrants, including those deemed "hard-to- place" who may need more specialized services to enter, re-enter or advance in the workforce. "Traditionally, designing a social pro- gram is the easy part," stated Russell Sykes, deputy commissioner of the Center for Emplojonent and Economic Supports at the New York State Office of Temporary and Disability Assistance. "Funding it, particularly in this eco- nomic environment, is another story. States facing multi-billion dollar defi- cits are often unable to allocate lim- ited dollars to new social programs. However, this is where the federal SNAP Employment and Training pro- gram's attractive funding design comes into play Federal SNAP E&T funds are available to meet 50 percent of the eli-
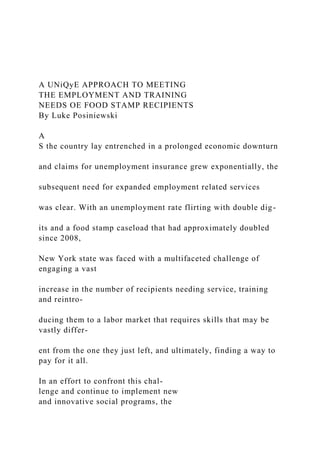
- 3. gible Venture program expenditures, and while the state is required to record the outlay of funds, it is not required to use any state resources to draw down the federal share." As part of the RFP development process. New York state required potential bidders to identify eligible nonfed- eral funding sources. In some instances entities were able to secure pri- vate foundation funding to support the program. Contracts with 17 non- profit agencies were set up, and by using the E&T funds to reimburse them for 50 of the program costs, the nearly $8 million Ventures Initiative was established at no cost to the state. Contracts with providers are perfor- mance based. Federal funds are earned as participants complete instructional hours, make educational gains, obtain a credential in a vocational skill and enter and maintain emplo3mient for 30- and 90-day periods. A total of 1,303 recipients enrolled in the first year, and the adjacent graph displays the pro- gram outcomes.
- 4. Credential 9% 7% Fields 33% w 2 1 % • Health Care • Const./Bldg/Maint • "Green" Jobs • Computers • Culinary 1 4 Policy&Practice April 2011 1000 800 600 400 200
- 5. 897 Career Plans Educational Credentials Job Entries Gains & Retentions As similar as the individual programs are in terms of payment structure, fiex- ibility in how and what services are delivered is critical. As labor market conditions, training resources and the needs of the target population vary across the state so, too, does the make-up of individual Venture pro- grams. Each program was designed in partnership with the Local Workforce Investment Board and required cer- Each program vi^as designed in partnership with the Local Workforce Investment Board and required certification and approval that the credentials
- 6. being offered were in economic fields that were in demand within the region. tification and approval that the credentials being offered were in eco- nomic fields that were in demand within the region. Trainings range from that of Certified Nursing Assistant and Home Health Aide, to credentials for Warehouse Worker, Commercial Driver's Licenses, and new and expanding "green" fields. Adult Basic Education and English language instruction is also offered. Individuals targeted for service include those with a history of substance abuse and ex-offenders. A summary of a few individual programs follows: The Paraprofessionals Healthcare
- 7. Institute, Inc. is a New York City-based provider that specializes in short-term (four-week) training that leads directly to emplojmient. The PHI and its part- ner. Cooperative HomeCare Associates, prepare participants for full-time home care jobs. Classes are offered in English and Spanish and students who complete the training are guaranteed employment. Each trainee earns two Department of Health-required cre- dentials: a Personal Care Aide creden- tial followed by a Home Health Aide credential. After 12 weeks of employ- ment, workers can purchase an owner- ship stake in CHCA, qualify for 401(k) accounts, and receive full health and dental coverage. The Altamont Program, Inc. is an upstate provider that targets ex-offend- ers and individuals with a history of substance abuse. Altamont provides much-needed basic education and computer skills to its clients and offers credential training in culinary arts. maintenance, weatherization and renewable "green" energy. Each client is provided with classroom edu- cation as well as with "hands-on"
- 8. practical experi- ence. A recent graduate of the green-jobs program and a client with an extensive criminal history uses the educa- tion and skills he acquired through the program and remains fully employed as an electrician helper earning $11.00 an hour almost a year later. New York state is very encouraged by the first year results, and is exploring the release of a second REP to expand the program and to maximize the use of SNAP E&T funds. With its traditional educational and job training design, coupled with a relatively debt-neutral impact on state budgets, the ESET Venture program is an attractive and easily adaptable initiative for states fac- ing client service challenges in these economic times to emulate. Eor more information on the ESET Venture program, contact Luke Posniewski at [email protected] state.ny.us. 01 Luke Posniewski is
- 9. a program contract manager at the Center for Employment and Economic Supports at the New York State Office of Temporary and Disability Assistance. April 2011 Palicy&Practice 1 5 Copyright of Policy & Practice (19426828) is the property of American Public Human Services Association and its content may not be copied or emailed to multiple sites or posted to a listserv without the copyright holder's express written permission. However, users may print, download, or email articles for individual use. This is link book http://s1.downloadmienphi.net/file/downloadfile7/149/1379790. pdf Case from chapter 22: 22.2, and 22.4 All cases have the same questions and put each answer under each question. CASE NAME: ____________________________ A. Legal Cognizance 1. Facts: a. Briefly describe the facts. b. Which facts were key to the outcome? 2. Legal issue: a. What legal issue(s) does this case illustrate (i.e. why is
- 10. this case in the chapter)? b. What are all of the elements of the main legal rule that this case illustrates? For instance, if the case is about undue influence, list ALL of the elements that the court in this case said had to be proven by the plaintiff. Repeat 2. For each issue raised. (For example, a case may discuss 1. Whether there is an implied-in-fact contract, and II. Whether the UCC or common law applied. If so, you will repeat 2. For each of these two issues.) B. Expand Perspective, Gain Interpersonal Understanding, and Critically Assess Implications 3. Prevailing party’s point of view: a. What legal arguments were made by the prevailing party? b. What facts, legal reasoning, social policy, and ethical principles would support a ruling for the prevailing party? c. What were the probable motivations behind the prevailing party’s actions leading up to the dispute? After the dispute? Repeat 3. For each and every issue in the case. 4. Losing party’s point of view: a. What legal arguments were made by the losing party? b. What facts, legal reasoning, social policy, and ethical principles would support a ruling for the losing party? c. What were the probable motivations behind the losing party’s actions leading up to the dispute? After the dispute? Repeat 4. For each and every issue in the case. 5. Judge’s point of view: a. How did the court rule on each argument? b. What facts, legal reasoning, social policy, and ethical principles did the court use to support its ruling? c. What were the probable motivations behind the judge’s decision?
- 11. Repeat 5. For each ruling made by the judge. C. Find Recent Developments and Diverse Theories, Synthesize, and Compare 6. Different Rules: Pose the question “What if the court adopted a different legal rule?” a. Search the web for other articles to refer to in your article or call an attorney or business professional who may have experience with this type of issue. Write a brief one-paragraph summary of this case or article: b. Ponder and reflect to compare this case to recent news and cases. This is the really cool part. You will be thinking like a legally astute manager, owner, or professional as you read, analyze and compare cases to draw your conclusions. Some neat ideas to help with your analysis: If the outcomes of the recent cases you found are different, can you make sense of the different outcomes? Are there different legal standards that make for different outcomes? Is there a trend leaning more in favor of a plaintiff or defendant’s position? Are the outcomes the same or different simply because the facts are similar or dissimilar? What accounts for the same or different results? Write your thoughts here: D. Creative, Application and Critical Thinking Questions 7. Your point of view of the case in the book: a. Do you agree or disagree with the actual outcome? Why or why not? b. Change it up: Pose the question “What if the facts were different?” Create changes to the facts that would probably result in a different outcome of the case and, using critical thinking and legal reasoning, tell why your change in facts would make a difference. C. Relate the case to your own experience, if applicable, or
- 12. to the experience someone else has shared with you. d. How will you apply the lessons from this case to your future career? e. Write recommendations to avoid future legal problems and that best suit the objectives of a firm or company in your chosen career field. Social Service Review ( June 2012). � 2012 by The University of Chicago. All rights reserved. 0037-7961/2012/8602-0002$10.00 Ending Access as We Know It: State Welfare Benefit Coverage in the TANF Era Keith Gunnar Bentele University of Massachusetts Boston Lisa Thiebaud Nicoli University of Arizona Much of the quantitative literature evaluating welfare reform focuses on caseloads. In order to contextualize caseload declines, the current study examines a closely related measure of welfare coverage: the ratio of children receiving welfare assistance to children in poverty. A multilevel model approach is employed to investigate state-level factors that have contributed to declines in coverage. The findings suggest
- 13. that welfare coverage has fallen the most in states with higher levels of coverage prereform, ideologically conservative governments, Republican governors, and larger proportions of African American welfare recipients. In addition, this study identifies specific policies and administrative practices that are associated with falling coverage and reveals a substantial erosion of the traditionally countercyclical relationship between unemployment and welfare provision since reform. By the late 2000s, the policy choices that embody welfare reform have produced both historically low levels of welfare coverage nationally and unprecedented diversity in benefit accessibility across states. In his speech accepting the Democratic nomination for President of the United States, William Clinton promised to “end welfare as we know it” (New York Times 1992). One of the main problems with the Aid to Families with Dependent Children program (AFDC), according to Clin- ton and others in favor of dramatic reform, was that it encouraged dependency (O’Connor 2000). Advocates of reform viewed welfare de- pendency as both the cause and effect of a variety of social ills, including teenage pregnancy, crime, and low labor-market participation among racial and ethnic minorities. In creating the Temporary Assistance for Needy Families program (TANF), the Personal Responsibility
- 14. and Work 224 Social Service Review Opportunity Reconciliation Act of 1996 (PRWORA; 110 Stat. 2105) cod- ified this rhetoric about the ills of dependency. “End[ing] the depen- dence of needy parents on government benefits by promoting job prep- aration, work, and marriage” is listed as one of the four main goals of the new program (110 Stat. 2113 [1996]). With dependency framed as a problematic consequence of welfare provision, caseload reduction became the primary metric of welfare reform’s effectiveness. As caseloads declined dramatically following re- form, many media commentators, regardless of political orientation, viewed these declines as an indication that welfare reform did something right (Besharov 2006; Clinton 2006; Jencks, Swingle, and Winship 2006; Kim and Rector 2006; New York Times 2006). Academics also contributed to this debate, studying why caseloads fell so quickly after the institution of TANF (Council of Economic Advisors 1997, 1999; Martini and Wise- man 1997; Mead 2000; Schoeni and Blank 2000; Ziliak et al. 2000; Blank
- 15. 2001; Danielson and Klerman 2008). The current study explores the long-term consequences of reform for the adequacy and responsiveness of state welfare (TANF) programs. Access to cash assistance declined dramatically after reform. A 2008 Congressional Research Service report finds that, in 2007, one- third of single mothers in poverty were both unemployed and not receiving cash benefits, over twice the proportion in this situation in 1995 (Burke, Gabe, and Falk 2008). Studies examining levels or change in state case- loads can provide insight into these developments, but caseload mea- sures are not ideal indicators of welfare state adequacy. The primary issue is that it is difficult to interpret the meaning of a caseload decline without assessing whether need is declining as well. In the following, the authors hope to help shift the focus of the welfare reform debate toward questions of welfare state adequacy and away from discussions of dependency and caseloads. Following the work of Marcia Meyers, Janet Gornick, and Laura Peck (2002), this study employs a different measure as the dependent variable in the analyses: the number of state welfare child cases relative to the number of children in poverty, a
- 16. measure of welfare coverage. The research on caseload changes since welfare reform is dominated by debate about the extent to which caseload declines are a consequence of economic or policy changes. This framing, combined with an em- pirical focus on the uniquely strong economic growth following reform in the late 1990s, obfuscates important transformations in access to welfare services and enables, however unintentionally, the development of unqualified narratives about the success of welfare reform. Examining the performance of TANF through the lens of a coverage measure may suggest alternative narratives. Coverage in the TANF Era 225 Fig. 1.—States’ average number of children receiving welfare and states’ average welfare coverage for children, 1995–2009. Coverage versus Caseloads In this study, the focus on welfare coverage over caseloads deserves some further elaboration. Figure 1 presents national trends for both measures since welfare reform. Specifically, this figure displays the mean of the
- 17. number of children receiving welfare in each state (recipients of benefits from AFDC, TANF, and SSPs [Separate State Programs]) as well as the mean of state child coverage rates between 1995 and 2009. Separate State Programs are TANF-like programs funded by states and admin- istered by state TANF offices, but these programs were exempt from many federal TANF policies, such as time limits and work requirements, until TANF was reauthorized in 2006. Many states have used SSPs to varying degrees to provide assistance to families outside of the frame- work (and, some argue, the constraints) of TANF. The child caseload measure is the ratio of the average monthly number of children re- ceiving assistance to the total number of children in a state. Child cov- erage is the ratio of the average monthly number of children receiving assistance to the total number of children in poverty in a state. If caseload decline is the sole measure of success, then welfare reform has been an extraordinary triumph. Nationally, the total number of children receiving welfare declined 65 percent between 1996 and 2007. At the state level, there is substantial variation in the magnitude of
- 18. 226 Social Service Review caseload decline. In a handful of states (Florida, Georgia, Idaho, Illinois, Louisiana, Mississippi, and Wyoming), child caseloads declined by over 80 percent between 1996 and 2007. Caseloads did increase in response to the 2007–9 recession; total child caseloads rose nearly 13 percent between 2008 and 2010. Similarly, average welfare coverage fell dra- matically nationwide, with individual states converging on historically low rates of coverage. In contrast to caseload trends, whether measured at the national level or as state averages, child coverage decreased every year since reform, even falling through the 2001 and 2007–9 recessions. A simultaneous examination of the two measures is instructive. For example, declines in coverage between 1995 and 1998 appear to be driven largely by falling caseloads and not by reductions in poverty. The drop in caseloads continues from 1998 until the 2001 recession, but the decline in coverage moderates substantially in these years. This is a result of the considerable drop in poverty during the very late 1990s. However, the fact that coverage continues to decline in these years indicates that
- 19. the decline in caseloads is more than that warranted by the declines in poverty and unemployment alone. Finally, although child caseloads sta- bilize for a few years during and following the 2001 recession, and even increase in 2009 and 2010, coverage falls through both of these reces- sionary periods. These trends indicate that caseloads did not keep pace with the increase in child poverty during either recession. This is a key advantage of the coverage measure, as it enables the assessment that the dramatic caseload declines, especially in the very late 1990s, are not driven solely by falling poverty in the context of a tight labor market. Further, reliance on a caseload measure could lead one to overestimate the adequacy of state responses to postreform re- cessions. However, the differences between these two measures should not be overstated, as they are closely related, have identical numerators, and display similar overall trends. At the state level, the measure of child coverage and the ratio of child cases to child population are highly correlated (r p .85). It is important to stress that the use of a coverage measure is not intended to be a methodological contribution; the cov- erage ratio is not presented as a more accurate measure of some com-
- 20. mon underlying concept than caseloads. Instead, the coverage measure is considered a better indicator of the adequacy and responsiveness of TANF. Consequently, this study is not a direct extension of research examining caseloads; rather, it focuses on the specific question of the determinants of change in program adequacy since reform. The authors expect that the factors influencing coverage are not necessarily identical to those that affect caseloads.1 1. While tangential to this study’s primary research questions, analyses were run ex- amining the determinants of change in the child caseload to child population ratio in Coverage in the TANF Era 227 The coverage measure is desirable for several other reasons. On a descriptive level, it is more intuitively informative and accessible than the measure of caseloads. In 2009, nearly 4 percent of all children participated in TANF or an SSP. The child coverage ratio for the same year was .21. The coverage measure allows an immediate assessment of the extent of program use relative to need, something that is not possible with a caseload measure. This limitation of caseload measures
- 21. is exac- erbated if one wishes to examine changes in caseloads or to make com- parisons over time. Caseload numbers are sensitive to the size of the population eligible for benefits, and that population fluctuates in re- sponse to changing economic conditions. Focusing on coverage allows one to partially control for the mechanistic changes in eligibility, and consequent changes in caseload volume, created by macroeconomic fluctuations. Variation across States While all states have experienced declines in coverage since 1995, within this national trend trajectories of change in coverage vary substantially across states. Figure 2 displays welfare coverage rates for children in five states from 1995 to 2009. Coverage declines substantially in California and Alabama, but both states maintain their customary positions at the extremes of a now compressed spectrum of welfare adequacy. Illinois, on the other hand, experienced dramatic reductions in coverage through the 2001 recession, and these declines substantially change its rank order in level of coverage. Cumulatively, these state-level changes constitute a trend of nationwide convergence upon lower levels of wel-
- 22. fare coverage. In the context of federal policy constraints, a broad mandate to reduce caseloads, and falling coverage nationwide, why have some states re- duced welfare coverage more substantially than others? The 2001 re- cession, the subsequent weak recovery, and the intensity and duration of the 2007–9 recession have provided dramatic tests of TANF’s re- addition to the analyses of child coverage provided below. While many of the results are similar, the findings are not identical and differ in noteworthy manners. In particular, a number of key factors of interest are statistically significant in one analysis and not the other. Further, comparisons of standardized coefficients across models indicate that the magnitude of effects vary substantially between these different dependent variables. This may lead one to either overstate or understate the impact of a particular factor. For example, states with larger proportions of African Americans receiving welfare benefits experienced statistically significant and substantial declines in both child cases and child coverage. However, the estimate of the effect of caseload racial composition is nearly twice as large in the caseload analysis as the coverage analysis, even when controlling for child poverty and state unemployment rates. What this suggests is that a substantial portion of the reduction in caseloads in states with more African American
- 23. welfare recipients is attributable to falling child poverty in those states. 228 Social Service Review Fig. 2.—Welfare coverage for children, selected states, 1995– 2009 sponsiveness to increases in poverty. Overall, the impact of these eco- nomic downturns on coverage has been surprisingly weak, although individual states exhibit significant variation in their responses to in- creases in poverty. The current study seeks to explain this variation by examining the factors that have shaped state-level trajectories of change in coverage following reform. The manner in which state political and economic conditions as well as policy changes and changes in administrative prac- tices have influenced these trajectories is investigated using a form of hierarchical linear modeling for longitudinal analyses, the multilevel model for change. This study contributes to the debate over recent changes in welfare provision on a number of levels. First, the following exploration of the determinants of changes in coverage in the TANF
- 24. era is the most extensive to date. The vast majority of research on caseload decline is confined to the 1990s. The period examined here covers both the 2001 and 2007–9 recessions, allowing the authors to assess how welfare reform affected coverage in both the late 1990s and during the economically turbulent 2000s. Second, the modeling ap- proach utilized here permits a more detailed examination of the effects of time-invariant factors, especially stable, state political and racial char- acteristics, than is possible in the approaches utilized in many studies. Coverage in the TANF Era 229 Potential Determinants of Coverage Little research specifically examines AFDC or TANF benefit coverage. Meyers and associates (2001, 2002) find that coverage declined dra- matically in the 1994–98 period, but they do not explore the causes of these changes. The literature on caseloads, broad studies of welfare generosity and retrenchment, and research examining states’ TANF pol- icy choices and administrative practices suggest additional factors that may influence welfare coverage.
- 25. Following an unusual rise in the early 1990s, AFDC caseloads began a dramatic and unprecedented decline in 1994 (Blank 2001, 2002). A 1997 Council of Economic Advisors report on this decline triggered the development of the caseload literature. The report concludes: “The estimates provided here suggest that over 40 percent of the decline in welfare receipt between 1993 and 1996 may be attributed to the falling unemployment rate and almost one-third can be attributed to the waiv- ers” (1997, 11); that is, to policy changes. Continuing in the mold set by the 1997 report, several studies (e.g., Wallace and Blank 1999; Blank 2001, 2002) find that the economy and policy are both important to explaining caseload decline. However, James Ziliak and colleagues (2000) find that policy has a negligible effect and that the strong econ- omy of the late 1990s was a primary driver of the caseload decline. Developing an index that characterizes the strength of state- level TANF sanctions, Robert Rector and Sarah Youssef (1999) find substantially larger declines in caseloads between 1997 and 1998 in states with stricter sanctions. Using this same index, Joe Soss and associates (2001) report similar findings based on their examination of changes in
- 26. caseloads be- tween 1997 and 1999. This literature suggests that economic factors likely play a central role in explaining caseload decline and that policy and political variables may also be important. Most of the scholars who study caseload decline do not include political variables, but those who do find statistically significant effects. Rebecca Blank (2001), for example, finds that the presence of Republican governors and partisan control of the state legislature by either party reduce AFDC and TANF caseloads. Political factors are prom- inent in research examining the determinants of state policy content under TANF. The wide range of punitive and disciplinary policy features incorporated in state TANF programs is directly relevant to explaining coverage, as states that implemented more stringent policies would be expected to be more likely to restrict access to TANF. Matthew Fellowes and Gretchen Rowe (2004) find that liberal citizen and government ide- ology as well as the proportion of Democrats in the state legislature all reduce the stringency of state eligibility requirements under TANF. Sim- ilarly, Soss and colleagues (2001) find that liberal government ideology reduces the strength of state sanctions under TANF.
- 27. 230 Social Service Review However, in more recent work, Soss, Richard Fording, and Sanford Schram (2011) find that party control and state government ideology provide no leverage in explaining whether states adopted a wide variety of TANF policies ranging from harsher sanctions and more rigid work requirements to restrictive eligibility standards. This stands in contrast to their extensive research, which indicates that partisan control of state governments is consistently a primary factor shaping changes in a variety of features of state welfare programs, including AFDC benefit levels and the adoption of AFDC waivers, in the decades preceding reform. This development leads Soss and colleagues (2011) to suggest that welfare reform may have fundamentally altered the forces shaping state welfare provision. In addition to state political context, the two other primary forces that have been central to shaping state action and policy choices in regard to welfare provision are the racial composition of states (and welfare recipients) and market wages for low-income workers. The existence of multiple and pervasive effects of race on
- 28. welfare provision, both historically and today, is one of the most consistent findings in research examining welfare benefits and state policy choices (Soss et al. 2011). In terms of TANF policies specifically, states with higher percentages of African American residents tend to implement more re- strictive policies (Soss et al. 2001; Fellowes and Rowe 2004). Further, Soss and colleagues (2011) find that across all dimensions of TANF policy choices examined, ranging from strength of sanctions to eligibility stan- dards, states with larger proportions of African Americans receiving ben- efits were more likely to adopt stringent or restrictive policies. Local labor-market conditions, in particular the level of demand and wages for low-skilled labor, are also argued to be central to the character of welfare accessibility and generosity (Piven and Cloward 1971; Soss et al. 2011). In the decades preceding reform, changes in AFDC benefits were strongly associated with the ratio of benefits to average wages for low-skilled workers (Soss et al. 2011). Further, Soss and colleagues find that, in the early 2000s, patterns of TANF sanctions in Florida counties were strongly related to local unemployment rates and demand for low- wage labor. Broadly speaking, such labor market impacts are
- 29. argued to operate on a “principle of less eligibility,” in which access to benefits and the generosity of benefits are limited in manners that ensure welfare remains less attractive or accessible than the lowest-paying jobs within local labor markets (Piven and Cloward 1971, 35). Finally, a handful of studies examine the effects of changes in admin- istrative practice under TANF, in particular the rise in both formal and informal diversion practices. Formal diversion practices may take the form of the offer of one-time, lump-sum payments. In exchange for such pay- ments, recipients agree to forego TANF eligibility for a specified period. Other diversion programs assist applicants in utilizing publicly or privately provided services other than TANF (Ridzi and London 2006). While there Coverage in the TANF Era 231 are no systematic figures on the number of applicants diverted nationwide, a number of case studies suggest that utilization of diversion strategies is widespread and in some cases aggressive. Drawing upon studies from four states, Rebecca London (2003) reports increases in the numbers of di-
- 30. verted recipients and expansion of the use of one-time cash assistance, although in all locations, less than 10 percent of all cases were diverted. In a study of 2,400 low-income families living in Boston, Chicago, and San Antonio, Robert Moffitt (2003) finds that diversion experiences are extremely common. Finally, Frank Ridzi and Andrew London (2006) dis- cover that an overwhelming number of formal and informal diversion practices have been integrated into the TANF intake process in West County, New York. Efforts to shift TANF recipients onto the caseloads of different gov- ernment programs parallel these diversion tactics and represent another change in administrative practice. Specifically, studies suggest that wel- fare reform has provided incentives for both individuals and state gov- ernments to make greater use of the Supplemental Security Income program (SSI) over TANF. The incentive for individual recipients is that SSI payments are higher than those from TANF, and SSI does not impose work requirements or time limits. For state governments, there are strong formal incentives to reduce TANF caseloads but not SSI caseloads. In addition, some argue that states have a financial incentive to en-
- 31. courage movement from TANF to SSI, as SSI is financed entirely by federal funds (Nadel, Wamhoff, and Wiseman 2003–4; Schmidt and Sevak 2004; Wamhoff and Wiseman 2005–6). Data and Hypotheses The data set compiled for this study contains annual observations on 50 states for a 14-year period (1995–2009), and the various models discussed below examine change in coverage over three periods: 1995– 2009 (the entire period), 1995–2000, and 2000–2009. The dependent variable in these analyses is an annual measure of welfare coverage for children, which is the number of children, in an average month, re- ceiving AFDC, TANF, or SSP benefits relative to the number of children in poverty in that state. The primary reason for focusing on the number of children receiving assistance is to obtain an assessment of the ade- quacy of program participation relative, roughly, to the size of the pop- ulation served by the program. The vast majority of recipients of TANF funds are children, and the proportion of recipients who are children has increased over time with the rise in the number of child- only cases that do not have an adult recipient (US Government Accountability
- 32. Office 2011). In 1995, child recipients constituted 68 percent of all AFDC recipients; by 2007, the proportion of child recipients of TANF had risen to 77 percent (SSA [Social Security Administration] 1997; US 232 Social Service Review Department of Health and Human Services [USDHHS] 2009b). Op- erationalizing the coverage measure as the ratio of the total number of child recipients to the total number of poor children comes much closer to assessing the TANF caseload relative to the target population than a ratio of the total number of recipients to the total number of individuals under the poverty line. The data for the average monthly number of children receiving AFDC, TANF, and SSP benefits are drawn from two sources. The Annual Statistical Supplement to the Social Security Bulletin provides data for the years 1994–99 (SSA 1994–1999). For the years 2000–2009, TANF and SSP caseload data come from the USDHHS Ad- ministration for Children and Families (2009a–2009d, 2010a– 2010p). An ideal measure of coverage would be the ratio of the total number
- 33. of child TANF recipients to the total number of poor children in single- parent households. Unfortunately, state-level estimates of the number of poor children in single-parent households suffer from measurement error as a consequence of focusing on such a small segment of the population. This issue is especially problematic in the context of less populous states, where sample sizes are small. Instead, for this study, the best available state-level estimates of child poverty, the Census Bu- reau’s Small Area Income and Poverty Estimates, are used as the de- nominator in the coverage ratio (US Census Bureau 2011). The Small Area Income and Poverty Estimates have the additional benefit of ac- counting for the influence of taxes and tax credits on household in- comes. Given multiple constraints and considerations, the authors feel strongly that this specific construction of the coverage variable is the best possible for assessing welfare adequacy over time and across states.2 States have responded to welfare reforms in two ways that complicate efforts to accurately characterize the extent to which states are providing assistance. The first involves state use of SSPs following the 1996 reform, which many states created in order to provide a broader level of
- 34. assistance than was possible within the constraints of federal TANF guidelines. States could create SSPs that were funded solely by the state but administered by TANF agencies to meet federal maintenance-of-effort requirements. Despite the increased cost associated with creating and operating these programs, states had an incentive to utilize SSPs, as families and children receiving support through SSPs were not considered to be receiving TANF assistance, were not subject to a number of TANF requirements (including work participation requirements), and were not included in the calcu- lation of state work-participation targets (Cohen 2006; SSA 2008a). Unfortunately, data on SSP caseloads are only available beginning in 2. The authors also considered examining caseloads as a proportion of the eligible population, because eligibility criteria are determined at the state level and vary widely across states. This approach is rejected, however, because eligibility criteria affect the extent to which assistance reaches the poor (in this case, poor children). Instead, a measure of eligibility thresholds is included as an independent variable. Coverage in the TANF Era 233
- 35. 2000. While the majority of states either did not use, or made only very limited use of, SSPs prior to 2000, there are a handful of states that did make use of SSPs before 2000. An examination of figure 1 suggests that, at the national level at least, the inclusion of SSP cases in the coverage ratio in 2000 does not produce a disruptive jump in coverage estimates. In order to control for any artificial increase in coverage due to the lack of data on SSP cases prior to 2000, a dummy variable for the year 2000 is included in the 1995–2009 period analyses.3 A second complication results from how state policy makers have re- sponded to additional extensions of TANF requirements contained in the Deficit Reduction Act of 2005 (120 Stat. 4 [2006]). While many states explicitly created SSPs in order to meet TANF work requirements, the Deficit Reduction Act reduces the capacity for states to utilize SSPs for this purpose by requiring states to include SSP cases in their work-par- ticipation calculations as of October 2006. In response, some states have shifted from using SSPs to solely state-funded programs (SSFs), which are not funded with maintenance-of-effort dollars and consequently are not included in states’ work participation calculations (Schott and
- 36. Parrott 2009). As the programs are completely state funded, there are no federal reporting requirements and no systematic federal data on SSF caseloads. This is potentially a serious problem for a study of state welfare ad- equacy, given that the creation of SSFs represents a direct effort by states to increase benefit access and that use of SSFs has increased since the onset of the 2007–9 recession. Danilo Trisi and LaDonna Pavetti (2012) collect data on total TANF, SSP, and SSF caseloads directly from state agencies, as opposed to from the USDHHS. These data are on total cases, and it is not possible to distinguish child cases. In order to assess the consequences of excluding child recipients of SSF funds in this study, an estimate of total child cases is generated for each year after 2005. The estimates use the degree of change in total cases in the Trisi and Pavetti (2012) data.4 These estimates are created for the 25 states that implemented SSF programs by 2009 (Schott and Parrott 2009). For the years 2006–9, the correlation is very high (r p .95) between the coverage measure used in the analyses below and the estimate of total coverage using the Trisi and Pavetti (2012) data. Further, the fact that the results
- 37. of models using either measure are nearly identical (and do not differ in terms of any of the central findings) provides reassurance that the inclusion of SSF recipients would not alter this study’s conclusions. 3. In addition, for the states that made use of SSPs in 2000, estimates of SSP cases between 2000 and 1997 were created using a linear interpolation. The inclusion of these estimated SSP cases in the coverage ratio produces results that are identical to those presented below. 4. Trends in child cases are projected using 2005 child caseload numbers. For example, if total caseloads in a state increase by 5 percent between 2005 and 2006 in the Trisi and Pavetti (2012) data, then 2006 child caseloads are estimated to be 5 percent higher than their level in 2005. 234 Social Service Review Fig. 3.—Average AFDC and TANF coverage vs. average AFDC, TANF, SSP, and SSF coverage for all states and selected states. AFDC p Aid to Families with Dependent Chil- dren program; TANF p Temporary Assistance for Needy Families program; SSP p separate state programs; SSF p solely state-funded programs. * Inclusion of SSP recipients increases AFDC and TANF coverage measure by 5 percent or more in 14
- 38. states: California, Con- necticut, Hawaii, Iowa, Maine, Maryland, Minnesota, Missouri, Nebraska, New York, Rhode Island, Vermont, Virginia, and Washington. Figure 3 illustrates the contribution of state use of SSPs and SSFs to national coverage rates by comparing average state AFDC and TANF coverage to a measure of coverage that includes SSP and estimated SSF child cases in the numerator. In addition, this figure provides an illus- tration of the portion of coverage attributable to SSP and SSF cases in a subset of 14 states in which the inclusion of SSP recipients increases their coverage ratio by 5 percent or more in any year. Nationally, the use of either SSPs or SSF programs only increases coverage rates marginally. However, for a relatively small number of states, the use of SSPs or SSF programs has allowed these states to cover a significantly larger portion of the poor (e.g., coverage rates increase 10 percentage points or more with the inclusion of SSP recipients in Hawaii, Maine, Minnesota, Ne- braska, New York, Rhode Island, and Virginia). Coverage in the TANF Era 235 The independent variables in the following analyses may be
- 39. roughly grouped in four distinct categories: measures of economic factors, polit- ical and racial context, TANF policy content, and administrative practices. Definitions and sources for all variables are listed in table 1. Economic Factors One of the most consistent and robust findings from the caseload lit- erature is the crucial role that strong economic growth played in the reduction of caseloads during the late 1990s (Council of Economic Advisors 1997; Wallace and Blank 1999; Ziliak et al. 2000; Blank 2001). The composition of the coverage variable partially controls for caseload fluctuations driven by changes in the state of the local economy. How- ever, the authors expect that unemployment will still exert considerable influence on coverage, as high unemployment may increase the depth of poverty for poor families or push the working poor out of the labor market. These conditions are expected to increase application for and receipt of benefits but would be poorly captured by the poverty measure in the coverage ratio. Further, the authors expect that state welfare offices may fluctuate between leniency during economic downturns and more stringent approaches when unemployment is very low. As
- 40. such, high unemployment is expected to increase coverage as both need and application for, and possibly receipt of, benefits increase. This analysis examines a number of additional economic factors, in- cluding the female employment-to-population ratio, real per- capita in- come, real per-capita revenue, and average earnings in low- wage occu- pations. As low-income women increasingly enter the workforce, either pulled by the strong economy or pushed by welfare reform, the authors expect that a higher female employment-to-population ratio will either result in higher coverage rates as the size of the population in poverty (the denominator in the coverage ratio) decreases or will have no influ- ence on coverage as both cases and poverty decline simultaneously. It should be noted that this factor in particular is potentially endogenous given that TANF policies may affect both welfare coverage and the em- ployment-to-population ratio. There is also a possibility of reciprocal cau- sation between these two factors. To address the latter issue, the female employment-to-population ratio is lagged by one year.5 This issue of en- dogeneity is addressed in greater detail in the discussion of the modeling approaches below.
- 41. Following the literature on welfare benefit generosity, wealthier states, measured by real per-capita income and real per-capita revenue, are 5. The former issue is more difficult to address. Duncan and Raudenbush (1999) suggest that one way to deal with endogeneity in the context of multilevel models is to control, if possible, for the relevant omitted factor. In the analyses below, variables are introduced that characterize various TANF policy characteristics expected to affect welfare coverage. 236 T ab le 1 D efi n it io n s a
- 123. d H u m an Se rv ic es . 238 Social Service Review expected to have higher levels of coverage (Tweedie 1994; Ribar and Wilhelm 1999). Finally, in order to explore the possibility that changes in coverage are related to local labor market conditions, models include a variable capturing the average earnings in low-wage occupations within states. Following Soss and colleagues (2011), this variable is comprised of average monthly earnings in a variety of low-wage occupations (listed in table 1). Given the demonstrated influence of the principle of less eligibility in the pre-TANF era, states with lower wages in less desirable
- 124. occupations are expected to more substantially reduce coverage. Political and Racial Context In order to address the effect of the ideological and partisan compo- sition of states on changes in coverage, all models include a measure of liberal government ideology and a dummy variable that indicates whether the state had a Republican governor in the previous year. The government ideology measure aggregates information on individual state governors and legislators. It places state governments on a scale in which higher values indicate more liberal governments and lower values indicate more conservative governments (Berry et al. 1998; Ford- ing 2010).6 The authors expect that states with more liberal governments will exhibit slower decreases in coverage rates. Following Blank’s (2001) work, it is also expected that states with Republican governors will ex- perience more substantial decreases in coverage. Finally, broadly speaking, a large body of research argues that race is a central and highly salient factor influencing the structure, logic, and policy choices embodied in state approaches to welfare provision (e.g., Quadagno 1994; Wacquant 2009; Soss et al. 2011). More specifically,
- 125. multiple studies demonstrate a strong relationship between the restric- tiveness of TANF sanctions and state racial composition (Schram, Soss, and Fording 2003; Soss et al. 2011). Similarly, Soss and associates (2011) find that states with larger proportions of African American benefit recipients are more likely to adopt more punitive and exclusionary TANF policies. Given this research, the authors expect that the racial composition of a state’s welfare caseload may influence the rate of cov- erage decline in that state. To investigate this, the authors include the percentage of the state welfare recipients that are African American. Policy Content The next two variables address variation in state TANF policy charac- teristics or programs; one examines the strength of a state’s welfare sanctions, and the other measures whether a state’s reform policies are more restrictive or punitive than federal requirements. First, the authors 6. This study draws upon the revised 1960–2008 government ideology data. Coverage in the TANF Era 239
- 126. follow Rector and Youssef (1999) in constructing a trichotomous index that characterizes the strength of sanctions imposed by a state for a benefit recipient’s noncompliance with work requirements. Loss of all benefits at the first instance of noncompliance is considered a strong sanction. If a recipient may eventually lose all benefits after repeated instances of noncompliance, the sanction is considered moderate. Fi- nally, if a partial reduction of benefits is the harshest consequence for repeated noncompliance, the sanction is considered weak. For the second of the two variables, the authors follow Soss and as- sociates (2001) in constructing an index indicating the extent to which states adopted reform policies that were more restrictive or punitive than federal requirements. This policy severity index is the sum of three dichotomous variables: (1) whether a state adopted a work requirement stricter than the federal requirement,7 (2) whether a state adopted a time limit shorter than the federal 60-month lifetime limit, and (3) whether a state instituted a family cap.8 Administrative Practice Three measures are included to capture how states have
- 127. responded to the incentives and pressures built into welfare reform at the level of administrative practices. First, while it is difficult to obtain measures of the multiple diversion practices employed at the level of welfare offices, it is possible to indicate whether a state has a formal diversion payment program. The authors expect that states with an institutionalized option to divert applicants with lump-sum payments will exhibit more substan- tial reductions in coverage than states without such programs. Second, states have exhibited substantial variation in their maximum income-eligibility thresholds. These thresholds indicate the maximum income that a family of three can receive and remain eligible for pro- gram participation and benefits. These thresholds are important to both levels of coverage and change in welfare coverage over time. In terms of levels, states with high income-eligibility thresholds likely have higher coverage than states with low income-eligibility thresholds, as benefits are available to a larger swath of the population, including some resi- dents whose incomes may not be below the poverty line. In the case of change in these thresholds over time, reductions in thresholds reduce the size of the population eligible for benefits. Consequently,
- 128. the authors expect that declines in coverage will occur more slowly in states with higher income-eligibility thresholds. 7. The federal requirement is that all adult recipients must begin participating in work activities no later than 24 months after they start receiving TANF. 8. The size of the TANF grant depends on household size. A family cap policy means that the grant amount does not increase when a child is born to a mother who has been receiving assistance for 10 months or more. 240 Social Service Review The third administrative practice variable examines change in a state’s SSI caseload. If states reduce TANF caseloads by moving recipients onto SSI, the authors expect to find that increases in the state SSI caseload will be associated with decreases in coverage. Statistical Model In the analyses below, hierarchical linear modeling is employed to ex- plore the factors that influence both initial levels and trajectories of change in welfare coverage for children. When utilized to examine
- 129. change over time, as opposed to contextual effects, hierarchical linear modeling is commonly referred to as linear growth modeling or the multilevel model for change (MMC; Singer and Willett 2003). The MMC approach is highly appropriate for this analysis. First, this approach is specifically designed to allow the detailed exploration of the causes of both within- and between-case variation in trajectories of change. This is consistent with this study’s primary goal: to explain within- and across- state differences in changes in coverage levels. This approach is also valuable because it allows the examination of the determinants of overall trajectories of change over the period observed. This allows an assess- ment of what it is about the particular states that has resulted in large differences in overall trajectories of change in coverage since reform. Within research on changes in welfare caseloads, fixed-effects mod- eling approaches are frequently used to examine the determinants of caseload levels from year to year. Such analyses provide insights into the manner in which within-state variation over time is associated with changes in caseloads, but such models do not make use of cross- sectional variation in factors across states. Consequently, the effects of
- 130. factors that vary substantially between states but are somewhat stable over time (such as state racial composition) may not be fully captured by such analyses. The same problem is present in first-difference analyses, another ap- proach used to analyze changes in caseloads. The MMC approach allows a direct examination of how a relatively stable factor, such as racial composition, affects overall trajectories of change in coverage over a period of time (in this case, the 14 years following reform). Year-to-year changes in racial composition are not theorized to have consequences for welfare adequacy. Rather, it is the stable differences in racial com- position across states that are expected to matter. Finally, pooled cross- sectional analyses often raise serious problems in terms of high levels of autocorrelation and heteroscedasticity, both of which are present in these data. The error structure of the MMC model allows residuals to be autocorrelated and heteroscedastic within the larger Level-II units (states, in this analysis), which allows more efficient use of the data (Singer and Willett 2003). One key assumption of the MMC is that unobserved panel-level effects
- 131. Coverage in the TANF Era 241 are not related with the variables in the analyses. A Hausman test in- dicated that one independent variable, the female employment- to-pop- ulation ratio, violates this assumption. Once this variable is dropped from the analyses, Hausman tests indicate that this assumption is sat- isfied in the data set and the use of a MMC approach is appropriate. One approach would be to drop this variable from all analyses, but this raises the issue of omitting a potentially influential regressor. A more conservative approach is used in these analyses. One technique for ad- dressing endogeneity in a multilevel context is the Mundlak approach (Mundlak 1978; Wooldridge 2001). In this technique, panel means for each Level-I variable are either included in the model as control vari- ables or subtracted from each Level-I variable to control for endogeneity (Rabe-Hesketh and Skrondal 2008). The latter technique is used in the models below. Once the Level-I variables in these analyses are panel- mean (or cluster-mean) centered, Hausman tests indicate clearly that unobserved panel-level effects are not correlated with the independent
- 132. variables in the analysis and consequently satisfy this assumption re- quired for the use of the MMC. In this case, the MMC is a two-level model in which states are the larger, Level-II units, and annual state coverage rates over time are the Level-I units. The Level-I model describes how states change over time; the Level-II model describes how these changes vary across states (Singer and Willett 2003). The following is the Level-I model for welfare cov- erage for children, Y, for each state s at time t: 2Y p p � p TIME � p TIME � p UNEMP � p UNEMPts 01 1s ts 2s ts 3s ts 4s ts # TIME � … p X � e . (1)ts qs qts ts Annual state levels of coverage are a function of an intercept (p01, the grand mean of coverage across states when all predictors equal zero), TIME (p1s and p2s), the state unemployment rate (UNEMP) at time t (p3s), and the interaction of UNEMP and TIME (p4s), while controlling for other variables included in the Level-I analysis (pqs). The TIME variable in this analysis is centered so that the intercept parameter can be interpreted as the level of welfare coverage in 1995, the beginning of the period examined.
- 133. Using the first set of time-varying independent variables, the Level-I analysis attempts to explain within-state, year-to-year change in state coverage rates. The Level-II analysis, which utilizes a set of time-invariant independent variables, examines the manner in which stable state char- acteristics predict both the value of the intercept and the slope of an individual state’s entire trajectory of change over the period examined. The outcome variables in the Level-II model are the p parameters from the Level-I model: 242 Social Service Review p p b � b %AFRICAN AMERICAN � … � b X � r ,01 00 01 1s 0q qs 0s p p b � b %AFRICAN AMERICAN � … � b X � r , (2)1s 00 11 1s 1q qs 0s p p b � r .2s 00 0s For example, states with larger proportions of African American welfare recipients are hypothesized to have lower initial levels of coverage in 1995 and to experience more dramatic declines in welfare coverage over the 1995–2009 period. The Level-II model assesses factors
- 134. that affect initial values (the intercept) and rates of decline or increase (the slope) in the dependent variable. For each state over the examined period, the trajectory of change in coverage is characterized in p1s. This is regressed upon a measure of caseload racial composition (%African American) and a vector, Xqs, of other time-invariant predictors. The other time-invariant variables in the following analysis are per capita income, average government ideology, average earnings in low- wage occupations, and prereform coverage (discussed below). All other var- iables vary over time. A few more model specification choices require explanation. The starting point for this analysis is 1995, because that year directly precedes the 1996 welfare reform and sets a prereform baseline against which change can be evaluated. A first step in MMC analyses is to specify the form of the time trend, linear or otherwise, in the dependent variable. A quadratic time specification (TIME and TIME2) provides the best fit and is used in all models. Last, Alaska was identified as an extreme and unduly influential outlier using multiple techniques. The state is ex- cluded from all models.
- 135. Tables 2, 3, and 4 present results from sets of models that address different questions about state experiences with declining coverage. Ta- ble 2 examines determinants of change over the entire 1995– 2009 pe- riod, table 3 focuses on change between 1995 and 2000, and table 4 presents the results from models covering 2000–2009. The analyses are broken into these periods, as it is expected that the dynamics driving change in coverage in the years following reform, in the context of unusually strong economic growth, might be different than those of the 2000s. Further, the models examining the 2000–2009 period allow a distinct analysis of how states responded to the two most recent reces- sions. At least three models are run for each time period. In each table, the first model contains the economic factors, political context, and other stable state characteristics that are expected to affect state welfare cov- erage. This model allows the identification of state characteristics that influence initial levels and change in coverage as well as a determination of what types of states have experienced the largest declines in coverage. The second model includes all measures from the first model
- 136. and in- Table 2 MMC Analysis of Welfare Coverage Rates for Children on State Characteristics: 1995–2009 Model 1 t-ratio (Coef./SE) Model 2 t-ratio (Coef./SE) Model 3 t-ratio (Coef./SE) Time in years (slope) .85 �2.43* �.36 Time2 (deceleration) 8.09*** 8.12*** 2.00* Year 2000 .40 .38 1.11 Level-I covariate main effects: Economic factors: Unemployment rate (t � 1) 3.27** 3.36** 1.71� Real per capita state revenue (2009 $) �1.01 �.62 �.26 Female employment/population (t � 1) �3.11** �3.13** �2.74** Political context: Republican governor (t � 1) �4.36*** �5.16*** �4.79*** Policy content: Policy severity index �2.91** Strength of sanctions �5.27***
- 137. Administrative practice: Diversion payments �6.39*** Real max. initial eligibility income 5.80*** Per capita SSI caseload 1.26 Level-II initial status (effect on intercept): Max. initial eligibility income in 1995a .77 �.89 �1.90� Per capita income in 1995a 3.28** �1.49 �1.07 Avg. gov. ideology 1995–2009a 4.06*** .33 �.98 % welfare caseload African American in 1995a �.89 �.71 �2.00* Avg. earnings in low-wage jobs (1995–2009)a �.10 .27 .00 Level of coverage in 1994a 14.32*** 13.69*** Level-II rate of change (effect on slope): Unemployment (t � 1) # time �2.47* �2.37* �1.03 Per capita income in 1995a # time �3.29** �.15 �.47 Avg. government ideology (1995–2009)a # time �.95 2.25* 1.69� % welfare caseload African American in 1995a # time �2.16* �3.75*** �2.44* Avg. earnings in low-wage jobs (1995– 2009)a # time .92 .90 1.13 Level of coverage in 1994a # time �6.24*** �5.76*** Constant �4.21*** .82 �.43 Random-effects parameters: Intercept 4.65*** 3.86*** 3.88** Time 4.20*** 3.77*** 3.75*** Residual 17.83*** 17.73*** 17.81*** Covariance (time, intercept) �3.50*** �1.43 �.72�
- 138. No. of observations 735 735 735 Deviance (�2 log likelihood) �1,844.7 �2,071.5 �2,058.1 BIC �1,706.1 �1,926.27 �1,873.2 Pseudo- 2R .67 .83 .84 Note.—MMC p multilevel model for change; AFDC p Aid to Families with Dependent Children program; TANF p Temporary Assistance for Needy Families program; coef. p coefficient; SE p standard error; req. p requirement; avg. p average; gov. p government; max. p maximum; BIC p Bayesian information criterion. a Variable is time invariant. � p ! .10. * p ! .05. ** p ! .01. *** p ! .001. 244 T ab le 3 M M C A
- 189. p ! .0 01 . Table 4 MMC Analysis of Welfare Coverage Rates for Children on State Characteristics: 2000–2009 Model 8 t-ratio (Coef./SE) Model 9 t-ratio (Coef./SE) Model 10 t-ratio (Coef./SE) Time in years (slope) .74 �3.08** �3.13** Time2 (deceleration) 1.82� 1.82� 2.06* Level-I covariate main effects: Economic factors:
- 190. Unemployment rate (t � 1) 2.70** 2.67** 2.61** Real per capita state revenue (2009$) .49 .42 .90 Female employment/population (t � 1) �1.64 �1.69� �1.87� Political context: Republican governor (t � 1) �2.00* �1.95� �1.93� Policy content: Policy severity index �2.40* Strength of sanctions �3.57*** Administrative practice: Diversion payments �7.22*** Real max. initial eligibility income .82 SSI caseload .56 Level-II initial status (effect on intercept): Max. initial eligibility income in 2000a 2.75** 1.61 1.55 Per capita income in 2000a 1.27 �.55 �.43 Avg. government ideology 2000–2009a 3.26** �1.06 �1.07 % welfare caseload African American in 2000a �1.43 �1.55 �1.75 � Avg. earnings in low-wage jobs (2000– 2009)a .48 �1.04 �1.00 Level of coverage in 1999a 13.41*** 13.69*** Level-II rate of change (effect on slope): Per capita income in 2000a # time �1.22 .05 �.33 Avg. government ideology (2000–2009)a # time �1.62 2.37* 2.53* % welfare caseload African American in
- 191. 2000a # time .17 �1.17 �.90 Avg. earnings in low-wage jobs (2000– 2009)a # time .44 1.93� 2.24* Level of coverage in 1999a # time �8.40*** �8.46*** Constant �2.63** 2.23* 2.34* Random effects: Intercept 4.55*** 4.44*** 4.42** Time 4.26*** 4.24*** 3.98*** Residual 14.01*** 14.00*** 13.96*** Covariance (time, intercept) �4.23*** �2.86** �2.54** No. of observations 490 490 490 Deviance (�2 log likelihood) �1,591.66 �1,674.36 �1,743.01 BIC �1,467.78 �1,538.08 �1,575.76 Pseudo- 2R .58 .81 .82 Note.—MMC p multilevel model for change; TANF p Temporary Assistance for Needy Families program; SSP p Separate State Program; Coef. p coefficient; SE p standard error; req. p re- quirement; avg. p average; Max. p maximum; BIC p Bayesian information criterion. a Variable is time invariant. � p ! .10. * p ! .05. ** p ! .01. *** p ! .001. Coverage in the TANF Era 247
- 192. troduces a variable capturing states’ initial levels of coverage (in either 1994 or 1999). The importance of this variable will be discussed in further detail below. The last model in each table includes the variables from preceding models and introduces the measures characterizing pol- icy content and administrative practice. This model attempts to identify more specifically the components of state-level TANF policies and ad- ministrative practices that have contributed to reductions in coverage. The authors recognize the possibility that measures of policy content may function as intermediate variables that link state characteristics with outcomes. For example, more racially diverse states have introduced TANF legislation with stricter sanctions, which may correspondingly re- duce coverage. Introducing the variables in this order allows an assessment of the extent to which the influence of particular factors are independent of program structure, channeled through policy choices, or both. Results State Characteristics The structure of MMC analyses allows the examination of the influence of independent variables on three different aspects of the dependent
- 193. variable. The “Level-I covariate main effects” portion of table 2 contains the estimates for Level-I variables that change over time. These coeffi- cients characterize the relationship of annual levels of the independent variables to annual change in coverage from year to year. It should be noted that since these variables are panel mean-centered, these estimates are based only on within-state variation over time. The Level-II section of the table presents estimates of the relationships of Level-II time- invariant variables with initial levels of coverage in 1995 (the intercept) and with the trajectory of overall change in coverage for the entire 1995–2009 period (the slope). Change in Coverage since Reform: 1995–2009 Economic factors.—Beginning with the economic factors, estimates for the unemployment rate suggest that coverage is strongly associated with a state’s economic climate. All three of the models in table 2 include state unemployment (t � 1) as well as the interaction between the lagged unemployment rate and time. The interaction is included in order to ascertain whether the influence of the unemployment rate on coverage changes over time. The state unemployment rate exhibits a strong, pos-
- 194. itive, and statistically significant association with coverage, indicating that higher unemployment is associated with increasing coverage (or smaller declines in coverage) from one year to the next. However, the interaction term is negative, indicating that the unemployment rate’s positive association with coverage decreases over time and actually re- 248 Social Service Review verses sign by 2007. This suggests that high unemployment in the late 1990s and early 2000s produced increases in caseloads that outpaced the increases in poverty, consequently raising the coverage ratio. How- ever, by the mid-to-late 2000s, higher levels of unemployment have no relationship with coverage or may even be associated with reductions in coverage. The latter outcome is presumably a consequence of un- employment increasing the size of the population in poverty faster than states increase their caseloads. In line with arguments elsewhere, this suggests that TANF is no longer as responsive to fluctuations in eco- nomic conditions as has been the case in the past (Murray and Primus 2005).
- 195. The results in table 1 also reveal that the female employment- to- population ratio is related to change in coverage; increases in the ratio are associated with decreases in coverage. Increased female labor force participation could increase, decrease, or have no effect on coverage. Growth in the number of women in the labor market could reduce the number of households in poverty and, assuming caseloads remain con- stant, increase coverage. However, if women’s entry into the workforce removes them from both the TANF rolls and poverty, then there should be no change in coverage. Last, if entry into the labor market removes women from receipt of benefits but does not pull their families out of poverty, then coverage should decrease. These results suggest that this last process appears to have been the most common, as a higher female employment-to-population ratio within states is associated with decreas- ing coverage. Increases in earnings inequality, working poverty, and part- time and contingent work arrangements observed in recent decades are all consistent with such a relationship, especially given that working women have been disproportionately affected by many of these phe- nomena.
- 196. The estimates for real per-capita state revenue (t � 1) may seem counterintuitive. In all three models, its association with coverage is consistently negative and not statistically significant. This variable is likely capturing a negative relationship between revenue and coverage produced by the countercyclical nature of welfare provision within states over time. When economic growth is strong, revenue and em- ployment rise and coverage decreases. In an economic slowdown, rev- enues decline, employment falls, and some states respond to increased need in a manner that raises coverage rates. Regardless, the lack of statistical significance for these estimates indicates, interestingly, that state revenues do not drive short-term fluctuations in coverage. Political context, state wealth, and race.—Model 1 in table 2 suggests a contributing role for state-level political conditions. The estimates sug- gest that coverage falls more year to year in states with a Republican governor in the previous year. This is consistent with Blank’s (2001) finding that caseloads declined more dramatically in states with Repub- Coverage in the TANF Era 249
- 197. lican governors. Model 1 also includes Level-II time-invariant variables that affect both the intercept and the slope of the overall decline in coverage over the entire 1995–2009 period. The goal here is to under- stand how relatively stable state characteristics, such as state wealth, government ideology, racial composition, and wage levels affect the over- all rate of decline in coverage. Estimates for the intercept suggest, as expected, that initial (1995) levels of coverage are statistically signifi- cantly higher in states with higher per capita incomes in 1995 and in states with more ideologically liberal governments over the period ex- amined. The second set of Level-II results, located under “Level-II rate of change (effect on slope),” characterize the influence of time- invariant factors on overall trajectories of change in coverage. Consistent with expectations, there is a negative and statistically significant association between the percentage of African American welfare recipients and overall change in coverage between 1995 and 2009. However, counter- intuitively per capita state income and average government ideology also exhibit negative relationships, indicating that each is
- 198. associated with steeper overall declines in coverage. The estimated relationship for per capita state income is highly statistically significant. While not statistically significant, average government ideology bears a curious negative sign, indicating larger declines in coverage in more ideologically liberal states. These unexpected results stem from strong relationships among pre- reform levels of coverage, state wealth, and government ideology. In particular, per capita income in 1995 is highly correlated with the level of coverage in 1995 (r p.75) and consequently acts as a proxy for initial levels of coverage. Figure 4 indicates that prereform levels of coverage are strongly associated with the degree of subsequent change in cov- erage; states with the highest initial levels of coverage experience the largest decreases in coverage over the entire period. To reiterate, cov- erage does not fall faster in these states because they are wealthier or because they have more liberal governments; rather, these wealthier and more liberal states had the highest prereform levels of coverage and consequently the farthest to fall in the context of a national mandate to reduce caseloads. To confirm this interpretation, model 2 explicitly
- 199. models this influence by including level of coverage in 1994. The as- sociation between prereform coverage levels and change in overall cov- erage is both very strong and highly statistically significant; states with higher prereform levels of coverage are estimated to experience sub- stantially steeper overall declines in coverage between 1995 and 2009. Further, a state’s prereform level of coverage is one of the strongest predictors of the magnitude of subsequent overall change in coverage. With the inclusion of prereform levels of coverage in model 2, the association between per-capita income and change in overall coverage is no longer statistically significant. Additionally, the estimated relation- 250 Social Service Review Fig. 4.—Change in coverage 1995–2009 by prereform coverage level in 1995. AFDC p Aid to Families with Dependent Children program. ship between average government ideology and trajectory of change in coverage both reverses sign and achieves statistical significance. Model 2 suggests that coverage declined less in states that had more liberal
- 200. governments (on average) between 1995 and 2009. The manner in which the inclusion of prereform coverage substantially alters these re- lationships deserves some elaboration. The 1996 reform legislation both required and incentivized states to reduce caseloads. States responded to these pressures differently depending on the size of their respective caseloads. Ideally, the inclusion of the prereform coverage variable cap- tures variation across states in caseload reductions that are the result of somewhat mechanical responses to welfare reform. Once this variation is accounted for, the influence of state-level factors begins to emerge. Stated more succinctly, welfare reform initiated a broad national trend of declining caseloads and coverage; controlling for this trend allows a clearer delineation of the manner in which particular state character- istics either moderated or accelerated this trend. Another consequence of controlling for prereform coverage is an increase in the strength and statistical significance of the negative as- sociation between the proportion of a state’s welfare recipients that are African American and overall change in coverage. This is a consequence of the fact that a substantial number of states with large percentages of
- 201. African American recipients had comparatively smaller reductions in coverage as a result of already having low initial levels of coverage in 1995. Once these differences in prereform coverage levels are controlled Coverage in the TANF Era 251 for (differences that are a legacy of racial attitudes in state practices), the association strengthens between the racial composition of welfare recipients and changes in coverage. The authors assume that this re- lationship is in part a consequence of the stricter sanctions imposed in states with larger African American populations. This interpretation is supported by the results in model 3, in which the inclusion of a variable measuring strength of sanctions reduces the size of the coefficient of welfare recipient racial composition. Given the strong historical rela- tionship between race and the generosity of state welfare benefits (Moller 2002; Thiebaud 2007), the highly racialized nature of public opinion and political rhetoric surrounding the issue of welfare (Gilens 1999; Hancock 2004), and the specific findings that indicate the im- plementation of stricter sanctions and tougher eligibility
- 202. requirements in more racially diverse states (Soss et al. 2011), it is not surprising that race is found to play a role in accelerating reductions in the utilization of, or access to, welfare services.9 The manner in which the inclusion of prereform level of coverage influences other relationships in the analysis has been discussed, but why does this factor matter so much in and of itself ? First, there is the simple fact that states with higher initial levels had further to fall as all states have responded to strong incentives to reduce caseloads. Addi- tionally, states with generous prereform programs (i.e., states with high coverage and inclusive eligibility thresholds) likely had a larger pro- portion of caseloads comprised of poor or near poor families with fewer barriers to labor market participation. Such families may have been, in a sense, easier to remove from the rolls. Also, in the context of height- ened attention to caseload levels, policy makers and administrators in states with above-average caseloads may have experienced more pressure to reduce caseloads. The 1996 welfare law requires state welfare officials to submit annual reports on caseload reduction. Attention to such re- ports in the media and from political elites, particularly in the
- 203. early years following reform, undoubtedly increased the salience of caseload reduction for local welfare officials. Such attention may have both fueled coverage declines and impeded subsequent expansions of coverage even in the context of increased need for services. TANF policy content and administrative practice.—Model 3, which in- cludes time-varying measures of the content of state-level TANF policies and changes in administrative practice, seeks to determine whether these changes contributed to declines in coverage and, if so, how. Con- sistent with previous research on caseloads, the strength of state TANF sanctions and the stringency of state welfare policies are both strongly 9. Additional analyses (not shown) examine the effect of the percentage of the state population that identifies as Hispanic and the percentage that is foreign born. Neither variable is statistically significant. 252 Social Service Review and statistically significantly associated with declines in coverage year to year. Within states over time, coverage declines more substantially in
- 204. states with stronger sanctions and TANF policies that are stricter than federal requirements. Model 3 also examines the effects of the presence of formal state diversion programs, the possible movement of recipients from TANF to the SSI caseload, and changes in eligibility thresholds. States with formal diversion programs experienced substantially steeper declines in cov- erage year to year than was the case in states lacking such programs. This estimated relationship is both substantial and highly statistically significant, and given the myriad formal and informal diversion strat- egies employed at welfare offices, this variable may capture only a frac- tion of the overall contribution of diversion practices to declines in coverage. Estimates from model 3 identify no statistically significant association between state SSI caseloads and change in coverage. Last, the results in table 2 suggest that the maximum income threshold for initial eligibility is strongly and statistically significantly related to change in coverage. Within states, higher income-eligibility thresholds are associated with slower declines in coverage year to year. On average, the real value of
- 205. income-eligibility thresholds fell by roughly 12 percent between 1995 and 2009. However, this average conceals enormous variation across states. While 14 states have increased the real value of their eligibility thresholds over this period, a number of states have dramatically re- duced the nominal value of their thresholds in addition to the declines in real values due to inflation. These reductions constituted a 40 percent decrease in the real value of thresholds in 13 states; in 8 of those states, the value of thresholds dropped by over 50 percent. In Arkansas, for example, the maximum eligibility income for a family of three fell be- tween 1995 and 2009 from roughly $600 to $279 per month in constant (2009) dollars. In contrast, the threshold exceeds $1,200 in several states (Alaska, Hawaii, Nevada, North Dakota, Rhode Island, Tennessee, and Virginia). These analyses suggest shifting income-eligibility thresholds are an important and heretofore underdiscussed practice through which states have reduced coverage. Change in Coverage during Strong and Weak Economic Performance: 1995–2000 and 2000–2009 The following analyses investigate whether the factors driving changes
- 206. in coverage during the years immediately following reform, a period characterized by unusually low unemployment, may be different than those driving developments in the 2000s. Table 3 presents results from analyses of annual and overall changes in welfare coverage for children between 1995 and 2000, and table 4 provides the same for 2000–2009. Coverage in the TANF Era 253 As these models are based on substantially different numbers of state- year observations (294 in table 3 and 490 in table 4, respectively), dif- ferences observed between the sets of models are only suggestive of distinct dynamics between the two periods. For example, substantially fewer factors emerge as statistically significant in the analysis of the 1995– 2000 period. Unfortunately, it is not possible to determine the extent to which this is a function of differences in the number of observations or actual differences between the two time periods. Regardless, the distinct dynamics that emerge are illuminating, even if they must be qualified. Economic factors.—While the lagged state unemployment rate is statis-
- 207. tically significant in the models examining the full period (table 2) and in those covering only the 2000s (table 4), this factor is not statistically significant and has a substantially smaller coefficient in the models that focus on 1995–2000 (table 3). In the 1995–2000 period, the level of unemployment in a state in one year is not related to the degree of change in coverage from that year to the next. This suggests that declines in state AFDC and TANF coverage in the years following reform are primarily driven by changes in policies and administrative practices, not by local economic conditions. This is worth emphasizing because it underlines an important difference between this study’s coverage anal- yses and the broader caseload literature. Nearly all research on caseloads finds that low unemployment rates were a contributing factor, and often a major contributing factor, to caseload declines in the late 1990s. The authors do not dispute this; low unemployment clearly contributed to caseload declines. However, these results suggest that the strong rela- tionship between low unemployment and caseload reductions did not translate into substantial improvements in state coverage levels. If any- thing, the direction of the relationship in models 5–7 suggests low un-
- 208. employment is associated with falling coverage year to year.10 This in- dicates that, in states with improved employment prospects, families were moving off of the TANF rolls faster than they were moving out of poverty. This point is critical to evaluations of the success of welfare reform. This finding appears to be inconsistent with the results from the models in table 2, which indicate that unemployment has a positive but eroding association with coverage between 1995 and 2009. The authors suspect that states’ responses to both the 2001 and 2007–9 recessions drive this association. Further, regarding the interaction term that sug- gests the influence of the unemployment rate declines over time, the authors suspect that this variable largely captures differences in state responsiveness between these two recessions. Simply put, states re- 10. As this variable is panel mean-centered, all values of unemployment below a state’s mean unemployment rate take on a negative value. In the context of below-average un- employment, the sign of the association between unemployment and change in coverage consequently flips.
- 209. 254 Social Service Review sponded more to increases in unemployment and poverty during the 2001 recession than during the 2007–9 recession. A similar pattern emerges in the estimates of the influence of the female employment-to-population ratio. Although this factor is not a statistically significant predictor of coverage in the 1995–2000 period (table 3), and is only significant at the level of a one-tailed test in the 2000–2009 (models 9 and 10 in table 4) period, the results for the full study period (table 2) indicate that the female employment-to- popu- lation ratio has a strong, negative, and statistically significant association with change in coverage. It was already noted that this indicates that the movement of more women into the labor force is associated with larger reductions in child caseloads than reductions in child poverty. Further, it is interesting to highlight that the coefficient for this variable is positive in the late 1990s (table 3) and negative in the 2000s (table 4). This change of sign suggests that higher levels of female labor force participation may have been associated with increases in coverage during the late 1900s, presumably as the movement of women into the work-