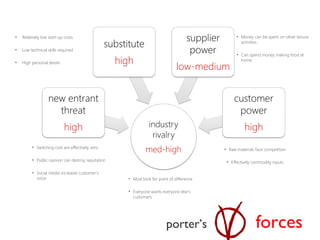
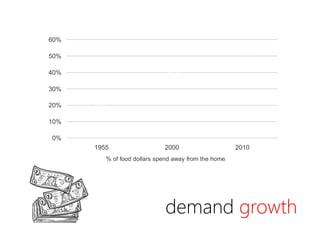
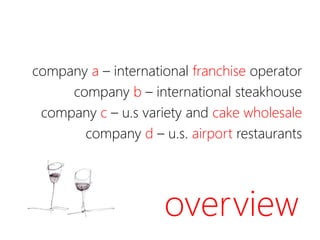
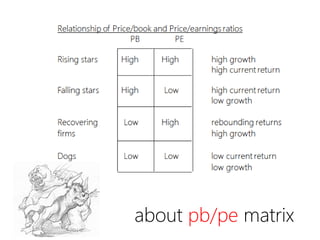
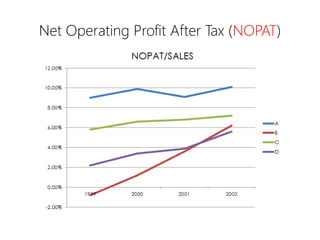
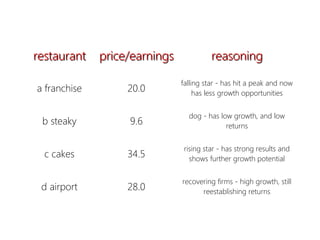
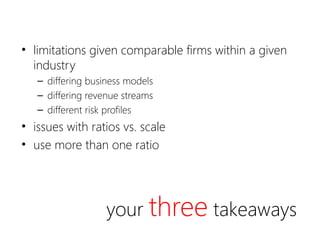
valuation ratios in the restaurant
industry
katherine koh, zac loo, rahul mishra & ying zhou
• Relatively low start-up costs
• Low technical skills required
• High personal desire
• Money can be spent on other leisure
activities
• Can spend money making food at
home
• Raw materials face competition
• Effectively commodity inputs
• Switching cost are effectively zero
• Public opinion can destroy reputation
• Social media increases customer’s
voice • Most look for point of difference
• Everyone wants everyone else’s
customers
porter’s forces
demand growth
25%
46%
53%
0%
10%
20%
30%
40%
50%
60%
1955 2000 2010
% of food dollars spend away from the home
overview
company a – international franchise operator
company b – international steakhouse
company c – u.s variety and cake wholesale
company d – u.s. airport restaurants
comparisons
company
aa franchisefranchise bb steakysteaky c!c! cakes!cakes! dd airportairport
Type of food Variety Steakhouse Variety Branded variety
Restaurants 1,500 269 64 148
% Owned 24% 100% 100% 100%
% Franchised 76% - - -
New stores
p/year
100 3 14 21
Countries 9 2 1 1
Average
cheque
$10.25
$17.50 (Dinner)
$12.50 (Lunch)
$15.78 -
Target market All ages 25-54 - -
Differentiation Hometown Texas Upscale, casual Airports
comparisons
company
first impressions…
Company A was the only company who could access debt
Everyone else had negative net financial leverage
Due to high cost of getting debt?
Company A is potentially the rising star
Who is the falling star?
driver of company’s
pb & pe multiples?
ZAC
current returns
are they performing well?
have they slumped?
are there returns headed up or down?
driven by fundamentals - sales growth, cogs
growth prospects
is demand growing?
have the results tended up or down?
off-balance sheet items
internally generated brand value
risk profile
match the price-to-book equity valuation
multiple with each of the four restaurant
businesses puzzle!!
Rahul
about pb/pe matrix
annual sales growth
restaurantrestaurant
price/bookprice/book
valuevalue
reasoningreasoning
a franchise 3.9
falling star - high current return,
low growth
c cakes! 4.4
rising star - high growth, high
current return
b steaky 1.0 dog - low current return/growth
d airport 1.0
recovering firms - rebounding
returns, high growth
Match the price-to-earnings valuation multiples
below with each of the four restaurant businesses discussed
above. Another game!!
Grace
Net Operating Profit After Tax (NOPAT)
restaurantrestaurant price/earningsprice/earnings reasoningreasoning
a franchise 20.0
falling star - has hit a peak and now
has less growth opportunities
b steaky 9.6
dog - has low growth, and low
returns
c cakes 34.5
rising star - has strong results and
shows further growth potential
d airport 28.0
recovering firms - high growth, still
reestablishing returns
your three takeaways
• limitations given comparable firms within a given
industry
– differing business models
– differing revenue streams
– different risk profiles
• issues with ratios vs. scale
• use more than one ratio
questions?

Restaurant Valuation Ratios

  • 1.
    valuation ratios inthe restaurant industry katherine koh, zac loo, rahul mishra & ying zhou
  • 2.
    • Relatively lowstart-up costs • Low technical skills required • High personal desire • Money can be spent on other leisure activities • Can spend money making food at home • Raw materials face competition • Effectively commodity inputs • Switching cost are effectively zero • Public opinion can destroy reputation • Social media increases customer’s voice • Most look for point of difference • Everyone wants everyone else’s customers porter’s forces
  • 3.
    demand growth 25% 46% 53% 0% 10% 20% 30% 40% 50% 60% 1955 20002010 % of food dollars spend away from the home
  • 4.
    overview company a –international franchise operator company b – international steakhouse company c – u.s variety and cake wholesale company d – u.s. airport restaurants
  • 5.
  • 6.
    aa franchisefranchise bbsteakysteaky c!c! cakes!cakes! dd airportairport Type of food Variety Steakhouse Variety Branded variety Restaurants 1,500 269 64 148 % Owned 24% 100% 100% 100% % Franchised 76% - - - New stores p/year 100 3 14 21 Countries 9 2 1 1 Average cheque $10.25 $17.50 (Dinner) $12.50 (Lunch) $15.78 - Target market All ages 25-54 - - Differentiation Hometown Texas Upscale, casual Airports comparisons company
  • 7.
    first impressions… Company Awas the only company who could access debt Everyone else had negative net financial leverage Due to high cost of getting debt? Company A is potentially the rising star Who is the falling star?
  • 8.
    driver of company’s pb& pe multiples? ZAC current returns are they performing well? have they slumped? are there returns headed up or down? driven by fundamentals - sales growth, cogs growth prospects is demand growing? have the results tended up or down? off-balance sheet items internally generated brand value risk profile
  • 9.
    match the price-to-bookequity valuation multiple with each of the four restaurant businesses puzzle!! Rahul
  • 10.
  • 11.
  • 12.
    restaurantrestaurant price/bookprice/book valuevalue reasoningreasoning a franchise 3.9 fallingstar - high current return, low growth c cakes! 4.4 rising star - high growth, high current return b steaky 1.0 dog - low current return/growth d airport 1.0 recovering firms - rebounding returns, high growth
  • 13.
    Match the price-to-earningsvaluation multiples below with each of the four restaurant businesses discussed above. Another game!! Grace
  • 14.
    Net Operating ProfitAfter Tax (NOPAT)
  • 15.
    restaurantrestaurant price/earningsprice/earnings reasoningreasoning afranchise 20.0 falling star - has hit a peak and now has less growth opportunities b steaky 9.6 dog - has low growth, and low returns c cakes 34.5 rising star - has strong results and shows further growth potential d airport 28.0 recovering firms - high growth, still reestablishing returns
  • 16.
    your three takeaways •limitations given comparable firms within a given industry – differing business models – differing revenue streams – different risk profiles • issues with ratios vs. scale • use more than one ratio
  • 17.