Technology Advantage Transformation Initiative - Ana Maria Loboguerrero CGIAR...
RTCES manuscript
1. Sustainable development in Manufacturing-Applicability to India and
Rural development versus Pollution of Environment
Dr Rahul Basu
Professor,
Sambhram Institute of Technology
BANGALORE 560097,Ka,INDIA
(ra4499@gmail.com)
ABSTRACT: The terms Sustainable development and sustainable growth have become
important in view of the impending environmental crisis. Global warming has suddenly
been taken seriously and various steps are being attempted at tackling the problem which
may assume unmanageable proportions in the near future. Sustainable growth and
development in India needs to be examined in the light of two contexts: macro
development in the urban and industrial centers and micro development in the rural areas
especially as these are intimately tied to the agricultural ethos rural India. These would
lead naturally to further studies on rural urban migration and rising unemployment,
concomitant pollution and congestion in the metro cities of India. Pollution being
associated with Industrial growth, the possibility of “leapfrogging” technology to jump
over the EKC curve hump is a possibility for India.
KEYWORDS: Environment, EKC ( Environmental Kuznets Curve), Pollution,
sustainable, rural urban migration, BOD (Biochemical Oxygen Demand).
INTRODUCTION:
Sustainable development is a term with myriad meanings; hence one must define it for
the Indian economy and scenario. A commonly accepted definition is that sustainable
1
2. development entails improvement of standards without adversely affecting the
environment and overall surroundings. The term has become a “Buzz Word:” in the
funding and International policy circles, along with “Global Warming”., “Environmental
degradation”, “Carbon Footprint” and the like.
In order to tackle global warming and the effect of pollution caused by excess heat
rejection in to the surroundings along with fossil fuel residues, the idea of Carbon Credits
is now actively being touted. In this aspect, poorer nations with large green areas
capable of renewing the carbon dioxide in the atmosphere have more carbon credits and
can “sell” these to nations, which pollute the air with industrial effluents. However, such
nations must subscribe to this scheme. The USA and China are the heaviest polluters and
apparently have not agreed to such a scheme till now. Even the Kyoto Protocol has not
been signed by several advanced countries.
The countries with heaviest forest resources like Brazil (classed as a developing country),
are also in the forefront in .the efforts to reduce carbon emissions. In Brazil for example
the petrol is mixed with a minimum of ethanol made from sugar cane grown there. Other
nations like Malaysia have taken to large-scale palm plantations to produce bio diesel.
India has made efforts in the areas of non fossil fuel technology like Wind, solar and
hydropower.
In the Indian Context- there is a vast rural population, which is mainly subsisting on
agriculture. Until now much of this has been rain dependent and of subsistence type.
Improvement in the agricultural pattern by introducing other cash crops, financial
incentives and irrigation must be attempted on a scientific planned basis, since cultural
bias and habits are very hard to change. There has been a shift in the past few years
where leguminous crops have been grown to reintroduce nitrogen in the soil, and
provision of fertilizer and pesticides. On the downside, these chemicals affect the ground
water. Animal dung, which was used as fuel if used as fertilizer by the poor farmers,
creates a problem culturally and financially. (a)Sustainable growth here would mean
that any improvements made in the agricultural pattern are sustained and that once the
2
3. supervising is over, the farmer does not lapse into the previous patterns. (b) The
tendency to abandon the country side and migrate to the urban centers is minimized or
kept at a sustainable level by encouraging rural investment and thereby relieving pressure
on the urban centers.
One such example exists in Maharashtra where a large milk producers union exists
(AMUL), similarly KOMUL in Kolar. The collective efforts of an organized group is
effective in implementing change and maintaining the sustainable growth and
development
It can be deduced that sustainable growth needs financial inputs and technology. This is
essential to maintain viability and offset threats from other regions in the light of cheaper
imports and efforts by vested interests to break the growth cycle. I have attached some
ideas from “Green Path Research” where extensive quotes are given on the economic
studies done on sustainability of economic growth and depletion of a poor country’s
resources to the benefit of more powerful and rich nations. According to Barbier (1), -“it
is rare for capital obtained by depleting resources of a LDC (Less developed country)
to be reinvested in a sustainable way” India has rich experience of this after over 2
centuries of exploitation from the 1700’s to the 1900’s where it fell from the richest
country in the world to one of the poorest. As a case in point the historical example of
the Indigo plantations on Bengal being replaced, and the opium trade to China may be
mentioned where the depletion and substitution t of agricultural food crops for export of
opium was forced. Massive famines resulted several times in Bengal and Orissa.
Similarly, in Afghanistan, Burma and Colombia—the growing of poppies and other
plants for opium despite the ban on the same is enriching a few warlords while
impoverishing and depriving peasants and farmers of the most basic necessities. It is
here and in these kind of glaring instances that the test of “SUSTAINABLE
DEVELOPMENT” lies and must be applied.
(Green Path Research: http://greenpathresearch.com/id12.html)
3
4. THE ENVIRONMENTAL KUZNETS CURVE:
It would be instructive to explain a little here on the EKC (Environmental Kuznets
Curve). A paper in the 1950’s by Kuznets (2), introduced the idea of income disparity
versus per capita income and stated that there was a non linear relationship, the disparity
peaking then reducing. A similar curve is postulated for environmental pollution versus
per capita income. Various studies have been done for the various pollutants commonly
present in industrial emissions, and an average of about 10,000 USD to 17,000 USD
appears to govern the turning or tipping point. A similar curve is postulated for
deforestation, Koop (3). However, there is strong debate about the validity for the so-
called EKC, with various proponents and opponents arguing one way or the other.
Harbaugh et al (4) claim there is no reliable evidence for this curve. Rosser (5) has
published research illustrating the symbiosis of Institutional evolution with the EKC.
The trend seems to be the laissez faire attitude that environmental pollution would take
care of itself once the level of development reaches a certain state, and was implicit in the
UN declaration of 1987 (OUR COMMON FUTURE), (6).This was the view taken by
Grossman and Krueger also (7, 8), where they assume that sustainability would follow
once a certain level of economy was reached.
In the case of developing countries like India and Brazil, the primary task to be tackled is
one of alleviating poverty. Poor people directly use the environmental resources like
firewood, forest land, and directly pollute the water and land in rural scenarios. It may
happen that there are groups that have learned to micromanage their environments. In
fact many poor people are concerned with the environment but do not have the means to
do anything about it. Their survival depends on their degrading the environment even
further. Alleviation of poverty towards environmental protection was mentioned as early
as 1972 by the then Indian Prime Minister, Mrs. Indira Gandhi at the UN Stockholm
conference on Human environment. In a sense, once the question of baseline poverty is
addressed, the environmental concerns can then be addressed, implying the basis of the
EKC, although not supporting proving or disproving the validity of this concept.
4
5. EFFECT OF SOCIO-POLITICAL VARIABLES ON THE EKC:
Russia (former USSR), India, to some extent the UK, Scandinavia and the Eastern Bloc
adopted a socialist model for their economies and growth plans. Here, greater equality
in the intermediate stages was enforced through structured taxation, Welfare schemes,
and Investment by the State leading to large employers like the Government Institutions
and firms. The forced shift in income levels needs to be analyzed with reference to the
EKC, perhaps through a lateral or upward shift (assuming linearity). However, since the
EKC is non linear, the resultant effects may not be seen immediately and essentially these
factors need to be included as Institutional variables which are fixed in a sense, (as given
variables or constraints), leaving room for other variables in the models. The price of
‘Taking Off” invariably was environmental degradation and deterioration in social
conditions, (slums, low quality housing and sanitation, poor medical and educational
facilities) and quality of life.
EFFECT OF TECHNOLOGY INPUTS ON SUSTAINABLE DEVELOPMENT
In the global scenario, which India is now forced to view while doing its daily work, job
outsourcing and the availability of cheap labour from offshore via the medium of the
Internet must be kept in mind. The Tigers of South East Asian economies have quickly
adapted from manufacture and assembly line to virtual technologies based on software,
flooding the markets with cheap goods and imitations. Traditional paradigms do not hold
good any more. The factory of today needs to be designed in a way that is energy
efficient, able to capture and retain technology and adapt to the future changes that must
occur with corresponding technology changes with market shifts. To this end, computer
based manufacture using NC machines and CAM (Numerical Control, Computer Aided
Manufacture), must be included for even basic units, as the cost of a conventional lathe
with that of skilled workers and that of a NC machine are now quite comparable. The
work force needs to be trained in such technologies and the production in such workshops
5
6. and factories must follow scientific methods using time and motion studies, work-study,
and linear programming to optimize transportation and storage costs. Machinery
discarded as scrap should preferably be recycled or refurbished, for instance old
computers may be donated to needy schools.
Manufacturing methods must then shift to such technologies as DFM, (Design for
Manufacture), Near net shape design (sinter and NCT methods), rapid prototyping and
the like all of which mean higher capital cost but lower losses and gains in the long run.
Similarly in the welding industry, there is need to adapt to other means like pressure
welding, TIG/MIG, diffusion welding and similar innovative methods to increase quality
and reliability and lower wastage. Eventually, the total energy budget needs to be looked
at including the cost of mining and extracting the material, cost of fabricating and
finishing and compare this with alternative materials and fabrication technologies, along
with associated carbon footprints.
Health and welfare of the workforce needs to be kept at high levels for it is only then that
efficiency will be optimum. In Japan there is large involvement of the work force with
manufacture, using Group and cell technologies. SQC (Statistical Quality Control) ,
KANBAN, JIT (Just in Time),etc. To keep at the same pace with the advances in
technology and competition from China, Japan, Malaysia, Korea and other countries with
advanced automated manufacturing methodology, will need major inputs from Industry
and academia along with Government involvement. Knowledge bases for such industries
will need interfacing with computers and the Internet to stand in the same place without
falling back in the race with other competing economies. The baggage we are having to
carry from the past is still there due to the traditional methods of manufacture seen in
places like the Brass industry of Moradabad, lock industries of Aligarh, fireworks and
match industry of Sivakasi, which employ child labour and unskilled labour to reduce
costs. The vast slums of Dharavi in Mumbai, house many small scale industries which
are viable due to the low overheads and cheap labour. To move such industries out of the
slums and sheds to modern cost effective international standards is a daunting task and
must be taken up at a national policy level. It is not enough to produce DVD (Video),
6
7. covers with duplicate videos and pirated novels at a fraction of the cost to show that “we
have arrived” on the international scene. The mental outlook has to change, along with a
concern for the environment.
SUSTAINABLE MANUFACTURE
Several academic studies have been done on these disparate and incongruous inputs
which India is well known for. It can be argued that with its population size, and other
problems, India cannot have sustainable growth; in fact sustainable growth as such is a
misnomer economically. The UN vaguely stated (Bruntland, 1987) that growth is OK
provided it was done in a sustainable fashion. In fact it is only now with the global
economic meltdown that it is being realized that unfettered economic growth is not
sustainable. According to studies done in 1990’s, sustainability will follow from growth
once a certain income level is reached, According to the Green Path Research paper;
wealth shift in the poorest countries aligns from agriculture and fishing to wards
industries, and in the richer countries from industries to services. Economic growth is
linked to Environmental quality. Another study submitted in 2007 to the Indian
Government by Jadavpur University (9) also dwells on some aspects and is attached in
part.
Of interest is the case of waste disposal by Indian industries. The pollutants being
dumped into the Jamuna near the Taj Mahal is a case in point. Similarly one hears almost
daily of Erin Brockovitch type cases in India where Industries dump chemicals into land
fills and water used by neighbouring villages is badly polluted. Or take the case of Union
Carbide in Bhopal where a duplicate of the plant in Institute Virginia was built, knowing
full well of the leaks and other effects of such chemicals. Thermal waste from nuclear
reactors into rivers and ponds irreversible changes the ecology by depleting marine life,
birds and increase in mosquito levels causing malaria and loss of output by workers. A
few cases have come out in the press where toxic waste that by law is banned from being
disposed of in foreign countries is towed to India and sold to scrap dealers in Gujerat etc.
7
8. India has thus become a dumping ground for junk and e-waste from the advanced
countries. Old computer instead of being donated to the rural schools and colleges are
being incinerated and used to extract the gold plating on the electrical contacts. It appears
there is a thriving business in such extraction of rare and noble metals from computers,
which is possible only by burning causing pollution in the process. This type of pollution
harms the water bodies, where degradation by micro organisms requires Oxygen
involving BOD.
Sustainable manufacture would necessarily entail: Reduction in waste, recycling, lower
energy consumption, lower pollution (both chemical and thermal waste). To take some
ideas from the Jadavpur University study (9), economic, social and environmental issues
need consideration. Sustainability implies caring for common resources like the air,
water and global temperatures. . Increasingly of importance, are common intellectual
property, internet resources and the like. I term these variables “UNSEEN” indicators of
sustainability, as they affect economic well being, along with atmospheric effects.
According to Greenpath research(10):
Structural and technological change:With economic growth, the structure of a nation's
economy can change in ways that have repercussions for environmental quality.
SCALE EFFECT:The scale effect is associated with a negative relationship between
economic growth and environmental quality at all income levels.
COMPOSITION EFFECT: Changing composition of output. Increased wealth is
associated in the poorest countries with a shift in composition of GDP from agriculture
and fishing to industries, and in wealthier countries from industry to services. This
mechanism suggests that countries will have different environmental problems at
different levels of development. The EKC theory suggests that this leads countries to
have better environmental quality at the extremes of the income scale. The changing
composition of output effect could lead to an EKC for certain environmental problems,
such as industrial pollution.
8
9. A third way is that as countries grow wealthier they may also alter their industrial
composition to focus less on polluting industries like steel manufacturing and more on
cleaner industries such as computer industries. This would also lead to an EKC for
industrial pollution if above a certain income level countries switched to cleaner
industries.
TECHNIQUE EFECT: This mechanism creates a positive correlation between economic
growth and environmental quality.
Evidence: Shifting Composition of GDP. Survey of evidence:
• Some studies find no evidence of a change in industrial mix as high income
countries grow wealthier, but there is a shift in the composition of GDP away
from industry.
• Other studies find evidence of movement of dirty industries from high income to
poorer nations as these nations become wealthier.
In other words, the EKC is simply an artifact of the current world structure of inequality
between nations as well as trade patterns, rather than a generalized relationship between
environmental quality and economic growth.
In order for the composition effect to be able to effect improvements in environmental
quality across all nations, one would need to look at changes in consumption patterns
with changing income levels to see if above a certain income level a dematerialization of
spending patterns was evident.
If people started spending more income on services and goods with cleaner and less
resource intensive production processes, then it would be the case that increased income
led to a change in composition of GDP away from resource consumption and polluting
activities.
However, we generally witness increased material consumption as countries grow
wealthier, suggesting that any improvements in the composition of GDP in terms of
9
10. decreases in environmental degradation reflects the movement of environmentally
degrading activities to other nations.
Energy Use: While increased energy efficiency with GDP growth appears to occur in
wealthier nations, energy intensity continues to growth with GDP in most developing
countries (Goldemberg, 1998). In other words, there is an inverted U-shaped relationship
between income level and energy intensity per unit GDP.
This "decoupling" could contribute to an EKC for environmental problems associated
with energy use. A study by J. Timmons Roberts and Peter Grimes (1997) finds evidence
for an inverted U-shaped curve for carbon dioxide emissions per unit output versus GDP.
They find that this is a result of efficiency improvements in a collection of wealthier
countries since 1970 while other countries became less efficient.
They also find that the scatter in the regression has increased over time, suggesting that
there is increasing variability in energy efficiency for countries at given income levels.
As new energy efficient technologies have become available, adoption has been uneven.
Industry: Wheeler and Martin (1992) examine the adoption of cleaner technologies in the
pulp and paper mill industry. They find that income level is not related to the rate of
technology adoption. Valerie Reppelin-Hill (1998) considers the adoption of cleaner
technologies for steel manufacturing. She finds that income level is unrelated to rate of
adoption for higher income countries, but there is a positive correlation for lower income
countries.
Conclusion:
Cleaning the Augean stables will require more than 12 years in India. By that time,
technology will have developed much further and whether we are left standing still or
10
11. running backwards remains to be seen. It can only be said that while disparities in
income and wealth have increased, and the affluent in the Indian cities have reached
standards of New York, the level of technology in the rural areas has not kept up with the
same. To avoid massive influx of rural poor to the urban centers, rural technology and
improvement of the standards in the rural areas is a must, keeping in mind the words and
philosophy of Mahatma Gandhi that the strength of India lies in its villages and provide
them with self-reliance.
However, the literature does not present a clear view of the mechanisms linking
economic growth and environmental technological change. Debate is still ongoing
regarding the beneficial effects of growth on Pollution past a certain income level.
• Technologies that allow for reducing the impact of production activities on
environmental quality are more available in wealthier countries due to the overall
technological advancement in these countries. This results, in part, from greater
financial support for research and development.(Ruttan, 2001)
Leapfrog Technologies. The case of India and Leap frog technology has been discussed
by Goldemberg(1998). Guivarch (2012) discusses the decoupling possibilities for GDP
and Pollution in case of India with use of Leap frog technologies which may be an
alternative mechanism to avoid the “Kuznets Trap”. Turning points in the EKC vary by
country and type of pollution. In the case ofCO2, the turning point appears as $80,000 for
CO2, and for BOD at about $24000 per capita, (UNIDO (2004)).
11
12. REFERENCES:
1. Barbier, E.B. Special Issue: The Environmental Kuznets Curve, Environmental
and Developmental Economics, 2, 357-515, (1997)
2. Kuznets, S. Economic Growth and Income Inequality, American Economic
Review, 45,1-28., (1955)
3. Koop, G , Tole, L. Is there an Environmental Kuznets curve for deforestation? Jnl.
of Developmental Economics, 58, 231-244., (1999)
4. Harbaugh, W.T., Levinson, A. and Wilson, D.MReexamining the empirical
evidence for an Environmental Kuznets Curve, The Review of Economics and
Statistics, 84(3),541-551,(2002)
5. Rosser, J.B. Institutional Evolution and the Environmental Kuznets Curve,
http://cob.jmu.edu/rosserjb/Inst.ev.Kuznets.curve.doc
6. Brundtland, G.H. Our Common Future, (The Bruntland Report), OUP, (1987)
7. Grossman,G , Krueger, A, Economic Growth and the Environment, Qtly Jnl of
Economics, 110,353-377 (1995),
8.Grossman,G., Krueger, A, Environmental Impact of a North American Free Trade
Association, NBER working Paper No 3914, Cambridge, Ma. (NBER) . (1991)
9. Report by Jadavpur University- Lecture Notes: by Joyashree Roy November 27,
2007. “Natural Resource Accounting for West Bengal for the sectors: Air and Water”
Submitted to The Ministry of Statistics and Programme Implementation, Government
of India.”2007. –“Need for Green Accounting”
10. Green Path Research: http://greenpathresearch.com/id12.html(accessed Sept
8 2008, now available on internet archive)
12
13. 11. Reppelin-Hill, Valerie. "Trade and Environment: An Empirical Analysis of the
Technology Effect in the Steel Industry," Journal of Environmental Economics and
Management 38, 1999, 283-301.
12. Wheeler, D. and P. Martin. 1992. ‘Prices, Policies and the International Diffusion
of Clean Technology: The Case of Wood Pulp Production.’ P. Low (ed) International
Trade and the Environment, Discussion Paper No, 159. Washington, DC: World Bank.
13. UNIDO Industrial Development Report (2004)
http://www.unido.org/fileadmin/import/24439_093108_Chapter04.5.pdf
14. Roberts, J. Timmons and Peter E. Grimes. 1997. Carbon Intensity and Economic
Development 1962-91: A Brief Exploration of the Environmental Kuznets Curve.
World Development 25:191-198.
15. Goldemberg J (1998) Leapfrogging energy technologies. Energy Policy 10, 729–
741.
16. Guivarch, C. and Mathy, S. 2012. Energy-GDP decoupling in a second best world
– A case study on India. Climatic Change, Volume 113, Number 2, pages 339–
356
17. Ruttan, V. W. Technology, Growth and Development: An Induced Innovation
Perspective. New York: Oxford University Press, 2001.
18. Gandhimati S, Savitha M, Priyanga G, Rahini R, Thilagavathi E, “ Impact of
Economic Development on Carbon Emission in Selected World Economies-An
Empirical Analysis”: The Asian Economic Review, v56,no 3., 2 Sept 2014, pages
29-44
19. World bank Annual Report 2013
13
14. FIGURES AND TABLES
Figure 1: CO2 emissions vs gdp(BILLION $) USA (Data from Gandhimati(18),
(19))
14
15. Figure 2: GDP vs Pollution of CO2 for India (Data from Gandhimati(18),(19)))
Figure 3: Pollution vs GDP for EU( Data from Gandhimati(18),(19))
15
16. Source: World Bank, 2003.
Table (From Unido Report 2004,(13))
16
Table 4A.1 Data Summary for panel of 196 countries, 1960–2001.
Variable Number of
Variable abbreviation Observations Minimum
CO2 emissions per international dollar of PPP GDP (kg per international dollar) CO2GDP 3 510 0.0009
Total CO2 emissions (kt) CO2TOT 7 054 3.6640
CO2 emissions per unit of land (kg per sq km) CO2AREA 6 812 0.0000
CO2 emissions per international dollar of industrial output (kg per international dollar) CO2INDO 3 362 0.0035
Total BOD emissions (tons) BODTOT 2 042 10.595
BOD emissions per unit of land (kg per sq km) BODAREA 1 935 0.0162
BOD emissions per international dollar of PPP GDP (kg per international dollar) BODGDP 1 842 0.0026
Capital expenditure (percent of total expenditure) CAPEXP 2 938 0.57
Chemicals (percent of MVA) CHEMSH 3 030 0.01
Machinery and transport equipment (percent of MVA) MACHSH 3 004 0.08
Food and Beverages (percent of MVA) FBTSH 3 230 0.41
Textiles and clothing (percent of MVA) TEXTSH 3 214 0.03
Chemicals value added (million international dollar.) CHEMVA 1 613 0.059819
Machinery and transport equipment value added (million international dollars) MACHVA 1 591 0.160846
Food and Beverages value added (million international dollars) FBTVA 1 715 12.030
Textiles and clothing value added (million international dollars) TEXTVA 1 709 0.107870
Share of Industry value added in GDP (percent) INDUSTSH 4 980 2.23
Industry value added (million international dollars.) INDUSTVA 3 549 11.091
Share of MVA in GDP (percent) MVASH 4 242 0.10
Energy per international dollar of PPP GDP (tons of oil equivalent per international dollar) ENERGY 2 666 0.0505
PPP GDP per capita (current international dollar) GDPPC 3 944 210
Personal computers (per 1 000 people) COMP 1 442 0
Population density (people per sq km) POPDEN 7 007 0
Fixed line and mobile phones (per 1 000 people) TELEPHON 1 880 1
17. 120 20% Increase in the share of
tonnes) Industrial Value Added
100
(thousand
60
80
year
20% Decrease in the share of
40
Industrial Value Added
BODper
20
0
0 15 000 30 000 45 000 60 000 75 000 90 000
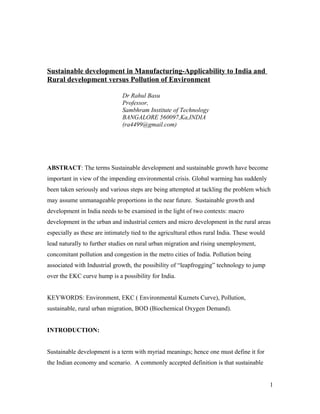
Figure 4: Organic water pollution (BOD) vs GDP per capita , (From UNIDO Report,(13))
● For total Biochemical Oxygen Demand,(BOD), a turning point of about
$24.000 (in purchasing power parity (PPP) terms) was found at which total
BOD levels off and begins to decline.
●
For CO2, a global non-visible pollutant, the turning point is at a much higher
level of income, more than $80.000, which is well above the currently
observable income levels. This implies that, in the absence of deliberate policy
intervention, incomes per capita in the developed countries must more than
double from current levels to observe declining CO2 emissions. By that time, the
damages to health and ecosystems is likely to be too great to tolerate and to
reverse.
●
17