More Related Content
Similar to Copy of market slides (mar 17)
Similar to Copy of market slides (mar 17) (20)
Copy of market slides (mar 17)
- 1. 0
10,000
20,000
30,000
40,000
50,000
60,000
Jan-05
Jan-06
Jan-07
Jan-08
Jan-09
Jan-10
Jan-11
Jan-12
Jan-13
Jan-14
Jan-15
Jan-16
Jan-17
1©2016 UBL Fund Managers. All rights reserved.
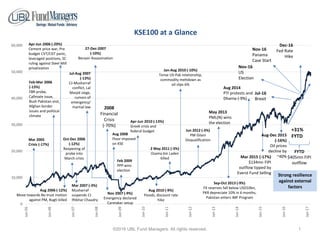
KSE100 at a Glance
2008
Financial
Crisis
(-70%)
Jul-16
Brexit
FYTD
$405mn FIPI
outflow
+31%
FYTD
Strong resilience
against external
factors
Nov-16
Panama
Case Start
Apr-Jun 2006 (-29%)
Cement price war, Pre
budget CVT/CGT panic,
leveraged positions, SC
ruling against Steel Mill
privatization
Aug 2006 (-12%)
Move towards No trust motion
against PM, Bugti killed
Mar 2007 (-3%)
Musharraf
suspends CJ
Iftikhar Chaudry
Apr-Jun 2010 (-13%)
Greek crisis and
federal budget
Jan-Aug 2010 (-10%)
Tense US-Pak relationship,
commodity meltdown as
oil slips 6%
Sep-Oct 2013 (-9%)
FX reserves fall below USD10bn,
PKR depreciate 10% in 6 months,
Pakistan enters IMF Program
Jun 2012 (-3%)
PM Gilani
Disqualification
27-Dec-2007
(-10%)
Benazir Assassination
Feb-Mar 2006
(-13%)
FBR probe,
Callmate issue,
Bush Pakistan visit,
Afghan border
issues and political
climate
Jul-Aug 2007
(-13%)
CJ-Musharraf
conflict, Lal
Masjid siege,
rumors of
emergency/
martial law
Mar 2005
Crisis (-17%)
Nov 2007 (-9%)
Emergency declared
Caretaker setup
Oct-Dec 2006
(-12%)
Reopening of
probe into
March crisis
Aug 2008
Floor imposed
on KSE
Feb 2009
PPP wins
election
2 May 2011 (-3%)
Osama bin Laden
killed
Aug 2010 (-9%)
Floods, discount rate
hike
Mar 2015 (-17%)
$134mn FIPI
outflow tipped by
Everst Fund Selling
Aug-Dec 2015
(-16%)
Oil prices
decline by
~40%
May 2013
PML(N) wins
the election
Aug 2014
PTI protests and
Dharna (-9%)
Nov-16
US
Election
Dec-16
Fed Rate
Hike
- 2. 2©2016 UBL Fund Managers. All rights reserved.
Nominal vs Real Returns on Asset Classes
• Notional Value of PKR 100
Bank Deposit, 247
T-Bill, 394
PIB, 766
SSC, 462
CPS, 1,005
Equity
3,171
-
500
1,000
1,500
2,000
2,500
3,000
3,500
Dec-00
Dec-01
Dec-02
Dec-03
Dec-04
Dec-05
Dec-06
Dec-07
Dec-08
Dec-09
Dec-10
Dec-11
Dec-12
Dec-13
Dec-14
Dec-15
Dec-16
Bank Deposit T-Bill PIB SSC CPS Equity
Annualied Return 5.8% 8.9% 13.6% 10.0% 15.5% 24.1%
Annualized STDEV (Risk) 0.5% 1.2% 12.4% 6.6% 8.0% 25.9%
NOMINAL RETURN
- 3. 3©2016 UBL Fund Managers. All rights reserved.
Nominal vs Real Returns on Asset Classes
Bank Deposit, 72
T-Bill, 116
PIB, 225
SSC, 136
CPS, 295
Equity
930
-
100
200
300
400
500
600
700
800
900
1,000
Dec-00
Dec-01
Dec-02
Dec-03
Dec-04
Dec-05
Dec-06
Dec-07
Dec-08
Dec-09
Dec-10
Dec-11
Dec-12
Dec-13
Dec-14
Dec-15
Dec-16
Bank Deposit T-Bill PIB SSC CPS Equity
Annualied Return -2.0% 0.9% 5.2% 1.9% 7.0% 15.0%
Annualized STDEV (Risk) 2.8% 2.9% 13.1% 7.8% 8.7% 26.2%
REAL RETURN
(Nominal Return - Inflation)
• Notional Value of PKR 100
- 4. 4©2016 UBL Fund Managers. All rights reserved.
2006-2009
Average return 12%
Average Volatility 23%
Sharpe Ratio 0.07
2012-2016
Average return 35%
Average Volatility 13%
Sharpe Ratio 2.5
Better Risk Adjusted Returns
Probability of Negative
Returns=24%
Probability of Negative
Returns=66%
Probability of Negative
Returns=88%
0
10
20
30
40
50
60
0
10,000
20,000
30,000
40,000
50,000
60,000
Jan-05 Jan-06 Jan-07 Jan-08 Jan-09 Jan-10 Jan-11 Jan-12 Jan-13 Jan-14 Jan-15 Jan-16 Jan-17
KSE-100 30 Day Standard Deviation
Volatility above 40%
Annualized return -62%
when volatility was in
this range. Market has
remained in this range
only 6% of time (Mar-05,
Jun-06, 2008-09)
Volatility between 20-
40%
Annualized return -9%
when volatility was in
this range. Market has
remained in this range
for 24% of time
Volatility between 0-
20%
Annualized return of
36% when volatility was
in this range. Market has
remained in this range
for 70% time
Greater
Institutional
Participation
- 5. 5©2016 UBL Fund Managers. All rights reserved.
Spreads between Earning yield and 3 Year PIB
Interest Rate Differentials also playing its part
-
10,000
20,000
30,000
40,000
50,000
60,000
0.00%
2.00%
4.00%
6.00%
8.00%
10.00%
12.00%
14.00%
16.00%
18.00%
FY02
FY03
FY04
FY05
FY06
FY07
FY08
FY09
FY10
FY11
FY12
FY13
FY14
FY15
FY16
FY17E
FY18E
FY19E
3YPIB Earning Yield KSE100
2002-04
Average spread was as
wide as 9.3%
2005-09
Market continued upward
momentum despite rate hikes.
Average spread narrowed to ~1%
2010-13
Higher rates led to higher earning
yield/low PE multiple. Average
spread was maintained at ~2%
2013 till Date
Sequential rate reduction has resulted in lower
earning yield/higher multiples. However,
average spread of 3.5% is now being carried
8% 8% 7%
3%
-1% 0%
-1%
1%
0% -1%
2%
4%
1% 2%
4%
2% 3% 3%
-5%
0%
5%
10%
FY02
FY03
FY04
FY05
FY06
FY07
FY08
FY09
FY10
FY11
FY12
FY13
FY14
FY15
FY16
FY17E
FY18E
FY19E
- 6. 6©2016 UBL Fund Managers. All rights reserved.
GDP Growth expected to surpass projections
Sectors Units USD mn % of GDP
Power Capacities 10,000 MW 8,343 2.6%
Auto Expansions ~250k cars 3,571 1.1%
Cement Expansions 26mn tons 2,377 0.7%
Steel Expansions 1.1mn tons 715 0.2%
LNG Supply 1200 mmcfd 273 0.1%
OMC Storage 480k tons 249 0.1%
Total Contribution to GDP 4.9%
0.0%
1.0%
2.0%
3.0%
4.0%
5.0%
6.0%
7.0%
FY10 FY11 FY12 FY13 FY14 FY15 FY16 FY17E FY18E FY19E FY20E
IMF Projections Internal Projection
We expect GDP growth over the next 5 years to surpass
initial projections due to capacity building in industrial
sector, improved availability of energy and growth in trade
& consumption
- 7. 7©2016 UBL Fund Managers. All rights reserved.
-600
-400
-200
0
200
400
600
CY11 CY12 CY13 CY14 CY15 CY16
LIPI (USD mn)
INDIVIDUALS COMPANIES BANKS / DFI / NBFC MUTUAL FUNDS OTHER
Domestic Liquidity and
Institutional support
continues to sustain the
rally at a time of foreign
investment outflows
Expected CPEC related
FDI and Potential
Emerging market
inflows will continue to
support the market
despite near term
outflows
Improving Domestic Liquidity
-127
126
399 384
-316 -339 (45,000)
(35,000)
(25,000)
(15,000)
(5,000)
5,000
15,000
25,000
35,000
45,000
55,000
-400
-300
-200
-100
0
100
200
300
400
500
CY11 CY12 CY13 CY14 CY15 CY16
FIPI (USD mn)
FIPI USD mn (LHS) KSE100
Average return of 24%
despite cumulative outflow
of USD655mn
- 8. 8©2016 UBL Fund Managers. All rights reserved.
AUM Comparison – Equity surpassing Debt
-
50,000
100,000
150,000
200,000
250,000
300,000
350,000
400,000
Dec-08 Dec-09 Dec-10 Dec-11 Dec-12 Dec-13 Dec-14 Dec-15 Dec-16
Industry Conventional Industry Islamic
-
50,000
100,000
150,000
200,000
250,000
300,000
Dec-08 Dec-09 Dec-10 Dec-11 Dec-12 Dec-13 Dec-14 Dec-15 Dec-16
AUM - Fixed Income AUM - Equity
PKR mn
PKR mn
- 9. 9©2016 UBL Fund Managers. All rights reserved.
Global Pension Fund Comparison (% of GDP)
-
20
40
60
80
100
120
140
160
180
Canada
USA
Switzerland
Australia
UK
Sweden
Finland
Japan
Korea
-
5
10
15
20
25
Brazil
Thailand
Nigeria
Turkey
Egypt
Indonesia
China
India
Pakistan
Emerging EconomiesDeveloped Economies
Pakistan has the lowest concentration
in private pension fund investments
among a sample of 80 countries
- 10. 10©2016 UBL Fund Managers. All rights reserved.
PSX – A case of Depth & Reform
• Growing institutional participation
• Chinese investment in PSX and injection of liquidity via brokers
• Regulatory reforms and formalization of products such as in-house badla
• Introduction of broad-based leverage products covering a larger pool of stocks
• Introduction of derivative products such as Options
• Expected Foreign Portfolio Investment Flows on account of Emerging market status
• Expected fiscal spending on large scale infrastructure projects to keep corporate earning growth profile intact
• Potential offering of Govt stakes in public sector to local and foreign institutions and HNWIs