More Related Content
Similar to Aurora Investor Presentation_March 2022_.pdf (20)
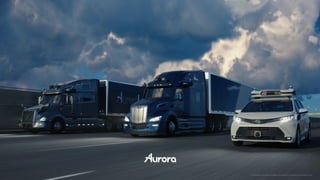
Aurora Investor Presentation_March 2022_.pdf
- 2. ©2022 | Aurora Proprietary 2
Disclaimer
Cautionary statement regarding
forward-looking statements
This presentation contains certain forward-looking statements within the meaning of the federal securities laws. All statements contained in this presentation that do not relate to matters of
historical fact should be considered forward-looking statements, including but not limited, to those statements around the size of the potential market opportunities, our ability to achieve
certain technical and commercial goals with our product. In some cases, you can identify forward-looking statements because they contain words such as “may,” “might,” “possible,” “will,”
“should,” “expect,” “plan,” “anticipate,” “could,” “intend,” “target,” “project,” “contemplate,” “believe,” “estimate,” “predict,” “potential” or “continue” or the negative of these words or other similar
terms or expressions that concern our expectations, strategy, plans or intentions.These statements are based on management’s current assumptions and are neither promises nor guarantees,
but involve known and unknown risks, uncertainties and other important factors that may cause our actual results, performance or achievements to be materially different from any future
results, performance or achievements expressed or implied by the forward-looking statements, including, but not limited to, the challenges we face to commercialize our technology, our history
of losses, our limited operating history, which makes it difficult to evaluate our future prospects, the highly competitive market in which we operate, the pace at which our services and
technology may be accepted and adopted by the market, the additional capital investment required to run our business, our dependence on our senior management team, difficulties in
managing our growth and expanding our operations, our ability to successfully select, execute or integrate past and future acquisitions, unauthorized control or manipulation of systems, which
may cause them to operate improperly, cybersecurity risks to our operational systems, security systems and infrastructure, our ability to develop and maintain an effective system of internal
control over financial reporting, burdensome or inconsistent regulations, or a failure to receive regulatory approvals of our technology, product liability, the volatility of the market price of our
common stock, and the dual class structure of our common stock, which has the effect of concentrating voting power with our founders. For factors that could cause actual results to differ
materially from the forward-looking statements in this presentation, please see the risks and uncertainties identified under the heading “Risk Factors” in Aurora Innovation, Inc.’s (“Aurora”)
Annual Report on Form 10-K for the year ended December 31, 2021, filed with the SEC on March 11, 2022, and other documents filed by Aurora from time to time with the SEC, which are
accessible on the SEC website at www.sec.gov. All forward-looking statements reflect our beliefs and assumptions only as of the date of this presentation. Aurora undertakes no obligation to
update forward-looking statements to reflect future events or circumstances.
This presentation also contains statistical data, estimates and forecasts that are based on independent industry publications or other publicly available information, as well as other information
based on our internal sources. This information may be based on many assumptions and limitations, and you are cautioned not to give undue weight to such information. We have not
independently verified the accuracy or completeness of the data contained in the industry publications and other publicly available information. Aurora does not undertake to update such data
after the date of this presentation.
All third-party logos appearing in this presentation are trademarks or registered trademarks of their respective holders. Any such appearance does not necessarily imply any affiliation with or
endorsement of Aurora.
- 4. The Aurora Driver enables the
digitalization of transportation
4
©2022 | Aurora Proprietary
- 5. Improve lives
The average driver spends
54 minutes4
each work day
commuting—the equivalent
of 10 days a year
Delivering the benefits of self-driving technology
safely, quickly, and broadly
Increase safety
Every hour 154 people
lose their lives1
on the
world’s roads
Expand access
25.5 million people2
with
a disability in the U.S. have
difficulty traveling outside
of the home
Transform logistics
In the U.S., trucking
accounts for 300B miles
annually & 65% of total
goods3
movement
©2022 | Aurora Proprietary 5
The
Aurora
Driver
SOURCES: 1
1.35m people die per year in road fatalities (WHO 2018) https://www.who.int/violence_injury_prevention/road_safety_status/2018/en/external icon 2
In
the 2017 NHTS, an estimated 25.5 million people report having disabilities that make traveling outside the home difficult. (3-20, USDOT Transportation Statistics
Annual Report 2018). 3
Trucks moved 65% of Goods by weight in 2017 (https://www.bts.gov/topics/freight-transportation/freight-shipments-mode) 4
27min
one-way commute (US Census Bureau, 2018)
- 6. Aurora expects to address the entirety of an enormous
transportation market
$1tn / $5tn
Personal mobility TAM (US / Global)5
$700bn
Trucking market (US)1
$35bn
Ride-hailing market (US)2
$100bn
Local goods delivery market (US)3
$4tn
Global4
$400bn
Global6
SOURCES: 1
A.T. Kearney State of Logistics, 2020. 2
Public filings of ride-hailing companies. 3
Pitney Bowes, Parcel Shipping Index Report; analysis of public filings
from e-delivery companies. 4
Armstrong & Associates, Global Third Party Logistics, 2019. 5
RAND, The Future of Driving in Developing Countries; Autocosts.info
World Statistics; AAA, Your Driving Costs; IRS; Bureau of Transportation Statistics, Household Spending Survey, 2019. 6
Derived from US share of global GDP
©2022 | Aurora Proprietary 6
The
Aurora
Driver
- 7. The automation of transportation is analogous to
the digitalization of advertising
Digitalization of advertising
1995
$160B
~$1.6T
Automation of transportation
Facebook and Google captured
~70% of US digital market for ads
Immediate global addressable market
2021
$835B
Only a handful of winners
US
market
size
Market
cap
of
leaders
Source: CapitalIQ. FB and GOOG shown as current
market capitalization on May 28, 2021
©2022 | Aurora Proprietary 7
~$900B
The
Aurora
Driver
- 8. ©2022 | Aurora Proprietary 8
*Computer-rendered imagery provided for illustrative purposes only
- 9. 9
The Aurora Driver is a common platform
across transportation verticals
©2022 | Aurora Proprietary
The
Aurora
Driver
Self-driving software Self-driving hardware Maps, offboard support, and
other data services
Trucking Passenger mobility Local goods delivery
- 10. The Aurora Driver is set up to be delivered as
a service and monetized on a usage basis
The Driver as a Service business model enables:
10
©2021 | Aurora Confidential and Proprietary
Focused
development
Rapid scaling through
partnerships
High-margin
revenue
©2022 | Aurora Proprietary
The
Aurora
Driver
- 12. 12
Aurora’s differentiated
market entry sequence
starts in trucking
SOURCES: 1
A.T. Kearney State of Logistics,
2020. 2
Derived from public filings of
ride-hailing companies. 3
Pitney Bowes, Parcel
Shipping Index Report; analysis of public
filings from e-delivery companies.
US market
revenue today
$700bn1
Trucking
Passenger
mobility
$35bn ride-hail2
Local goods
delivery
$100bn3
Value proposition
for self-driving
Technical
considerations
Selected
partners
Increased vehicle operating
hours, driver access, network
uptime/efficiency, and safety
Infeasible without long-range,
multi-modal perception
Little need for ride comfort
Heavy technology reuse on
consistent, high-volume routes
Increased vehicle operating
hours, driver access, network
uptime/efficiency, and safety
Drafts on truck technology
Emphasizes ride comfort and
human interaction
Leads trucking in road complexity
Increased driver access and
safety
Benefits from trucking and
passenger development
12
©2022 | Aurora Proprietary
Path
to
Market
*Select partners referenced
- 13. ©2022 | Aurora Proprietary 13
▸ The Aurora Driver's common
core requires only minor
adaptations for different
vehicles and use cases
▸ Trucking is the “tip of the
spear”, enabling Aurora to
rapidly and efficiently move
into adjacent verticals
The common core of the Aurora Driver facilitates efficient development
and rapid adaptation to trucking and ride-hailing
Path
to
Market
Common Core
Redundant Passenger Car
Redundant Truck
Trucking Product
Ride Hailing Product
- 14. Development, launch, and scale of
the Aurora Driver is expected to happen in five phases
14
©2022 | Aurora Proprietary
Path
to
Market
Phase I
Lay the foundation
Phase II
Develop & refine
Phase III
Validate
Phase IV
Launch
Phase V
Expand
- 15. Aurora’s trucking product is expected to expand
across the continental US over eight years
2023
2024
2025
2026
2027
2028
2029
2030
Illustrative lane expansion
given commercial,
technical, and regulatory
considerations
15
©2022 | Aurora Proprietary
Path
to
Market
- 17. 17
©2022 | Aurora Proprietary
Partnerships
*Select partners referenced
Aurora’s partnerships accelerate the commercialization
of the Aurora Driver
Partners produce ~50%
of US trucks
Partnered with logistics
companies and the
largest global ride-hailing
company
OEMs Ride Networks
Fleet Service Partners
Logistics Services
- 18. Inventory
carrying costs,
and
network
inefficiencies
The Aurora Driver can create immense value for trucking partners
Alleviate driver shortage
Speed up service and supply chains
Improve energy efficiency
SOURCES: 1
Deloitte ‘Autonomous trucks lead the way’ link, 2
Bureau of Labor Statistics. 2020. Employed persons by detailed industry and age; Analysis of Truck
Driver Age Demographics Across Two Decades (2014) White paper, 3
ATA Truck driver shortage analysis 2021, 4
‘Turnover Rate at Large Truckload Carriers Rises in
Third Quarter’ ATA, 5
Large Truck and Bus Crash Facts 2018, 6
CDLLife ‘Driving a truck is the deadliest job in the U.S.’ link , 7
NHTSA 2015 Critical Reasons for Crashes
Investigated in the National Motor Vehicle Crash Causation Survey, 8
ICCT ‘Automation in the long haul: challenges and opportunities’ paper
▸ Half a million US large truck crashes are reported each year5
▸ Truck Drivers had the most fatalities of any occupation group in 20186
▸ Human factors like recklessness, fatigue and distraction are attributed to 94% of crashes7
Optimize vehicle utilization and design
18
©2022 | Aurora Proprietary
Partnerships
Vehicle +
maintenance
Fuel
Other
Driver
Insurance
Trucking cost of operation
▸ 80,000+ driver shortage set to rise to 160,000 by 20302
▸ Aging workforce as fewer enter a difficult job, with 54% of truckers above 45 years old in 2020, compared with 31% in 19943
▸ 92% turnover for large truckload for-hire carriers4
Increase safety
▸ The Aurora Driver can operate 24 hours/day vs a traditional truck’s 11
▸ Moving a load from LA to Houston drops from 2+ days to a single day
▸ Can reach entire US within a day with only 2-3 distribution centers1
▸ >10% fuel and emissions reduction potential through eco-driving, off-peak deployment, and capping peak speeds8
▸ Maximum, near 24 hour utilization potential without Hours of Service limitations
▸ Optimized truck configuration does not require heavy, expensive creature comforts
- 19. Aurora’s strategic truck OEM
partners collectively represent
~50% of the US market
Partnerships with two of the top three truck OEMs
▸ Long-term commitments to build and
deploy self-driving trucks at scale, with all
parties making significant investment in the
success of the programs
▸ Deep technical integration to accelerate
the development and validation of
compelling, driverless-capable trucks
▸ Built to scale, allowing the autonomous
solution to expand quickly through existing
dealer and service networks
19
©2022 | Aurora Proprietary
Partnerships
*Computer-rendered imagery provided for illustrative purposes only
- 20. The Aurora driver is key to a significant
expansion in the ride-hailing market
©2022 | Aurora Proprietary
SOURCES: Aurora internal analysis derived from AAA, Your Driving Costs; US
Department of Transportation, National Household Travel Survey. Includes direct
driver vehicle ownership costs, parking, and value of time.
100%
80%
60%
20%
$3.00 $2.00 $1.00
Price per mile
Addressable
US
Urban
Vehicle
Miles
Traveled
(VMT)
Estimated adoption of ride hail by price
⇠ Current avg.
ride-hail price
(<1% ride hail
penetration)
40%
0
20
Safety ✓
Cost
✓
Step change reduction in
shared mobility cost
Service levels
✓
Personalized customer
experience
Supply access
✓
Driver supply constraints
in key markets
Energy
efficiency
✓
Accelerates electrification
- 22. ▸ Top global OEM & Tier 1 Supplier, respectively
▸ Long-term commitment: Large investor and
major development partnership
▸ Structured for success: Relationship built on a
strong framework supported at the highest
levels
Toyota and Aurora are
committed long-term partners
22
©2022 | Aurora Proprietary
Partnerships
- 23. ▸ Compelling commercial relationship:
Driven by mutually-beneficial economics
and demand
▸ Long-term commitment:
Uber is a large minority investor and CEO is
on Aurora’s Board of Directors
▸ Unprecedented data advantage:
10 year agreement to receive Uber data
Aurora’s partnership with Uber
drives key competitive benefits
23
©2022 | Aurora Proprietary
Partnerships
- 24. Access to Uber data is a unique
competitive advantage
Refined market selection Clear roadmap prioritization Optimized fleet positioning
Detailed marketplace data
combined with regulatory
understanding enables Aurora to
select the best market entry
sequence.
Not all self-driving capabilities are
created equal. Knowing where
trips take place and what
roadways are traversed allows
Aurora to prioritize capability
development.
Uber data informs our in-market
tactics e.g. fleet rebalancing,
placement of pick-up and drop-off
zones and parking. These
incremental improvements
generate more efficient unit
economics.
24
©2022 | Aurora Proprietary
Partnerships
- 26. Gerardo Interiano
VP of Government
Relations
Bart Nabbe
VP of Corporate
Development &
Strategic Partnerships
Khobi Brooklyn
VP of Marketing &
Communications
Nat Beuse
VP of Safety
Sterling Anderson
Chief Product
Officer, Co-founder
Gerhard
Eschelbeck
Chief Information
Security Officer
David Maday
SVP of Business
Development
Chris Urmson
Chief Executive
Officer, Co-founder
Drew Bagnell
Chief Scientist,
Co-founder
Richard Tame
Chief Financial Officer
Will Mouat
General Counsel
Aurora has proven leadership and expertise
26
©2022 | Aurora Proprietary
Team
Sandor Barna
Senior VP of Hardware
Engineering
Yanbing Li
Senior VP of Software
Engineering
- 27. Aurora has the required scale
to deliver self-driving
1400+
Product & Engineering
~1600
Employees
1100+
Patents1
Seattle, WA
Bozeman, MT
Louisville, CO
Detroit, MI
Pittsburgh, PA
Dallas / Ft. Worth, TX
San Francisco, CA
Mountain View, CA
Office
Aurora Test Site Network
27
©2022 | Aurora Proprietary
Team
1
Includes patents and pending applications worldwide
- 29. Aurora is innovating
throughout the
self-driving stack
Localization
Perception
Radar
Camera
Lidar
Maps
IMU Encoders
GPS
Planning
Control
Drive-by-wire
Simulation
Hardware
29
©2022 | Aurora Proprietary
Technology
Indicates the technologies
highlighted in this presentation
- 30. Aurora’s FirstLight Lidar is engineered for the needs of highway driving
Long Range Performance
Coherent light allows FirstLight to see more
than twice as far as traditional lidar1
Multi-modal long-range sensing
The ability to see at distance with both Lidar & Camera—is crucial to unlocking
safe autonomous operation at high speed. FirstLight FMCW Lidar enables
quicker reaction and longer range for safer, more capable driving.
Interference Immunity
Eliminates virtually all interference from
sunlight and other sensors
Simultaneous Range + Velocity
Doppler effect provides high velocity
precision at every point
30
©2022 | Aurora Proprietary
Technology
1
Based on internal Aurora testing of lidar
- 32. Step 4
Digest data, revise
assumptions, iterate
Step 3
Deploy early
prototypes on fleet
Step 2
Product requirements
determined jointly
with perception
Step 1
Fundamental
technology
Joint
Optimization
There are significant challenges relying on
externally-developed lidar
▸ Lack of clarity in vision and requirements
▸ Risk of being left out via exclusivity
▸ Tier 1s have long cycle times
Aurora is internally developing its lidar to
meet the needs of self-driving
▸ Rapid iteration and feedback
▸ Synchronized development with fleet
▸ Vertically integrated to ensure supply
Developing lidar in-house
has many advantages
Technology
©2022 | Aurora Proprietary 32
- 33. Aurora’s Virtual Testing Suite (which
includes simulation and data replay
technologies) improves:
▸ Safety: Dramatically reduces the
number of on-road miles needed
to develop the Aurora Driver
▸ Efficiency: Aurora’s motion
planning simulation is 2,500x less
expensive than on-road testing
▸ Speed: At scale, Aurora’s Virtual
Testing Suite can simulate in one
hour, the equivalent of over
50,000 trucks operating on the
road. Aurora was able to simulate
2.25M unprotected left hand turns
before testing that capability on
public roads.
33
Technology
Aurora's Virtual Testing Suite creates a paradigm shift
in testing safety, efficiency, and speed
©2022 | Aurora Proprietary
- 34. The Aurora Atlas is HD
mapping with exceptional
maintainability
34
Technology
Aurora’s Atlas architecture:
▸ Provides accuracy where it’s needed
most: near the vehicle
▸ Unlocks rapid (near-real-time)
updates
▸ Enables efficient maintenance so
that map data can always be
up-to-date
▸ Shards data so that map building
can be massively parallelized
©2022 | Aurora Proprietary
- 36. Description Aurora provides its technology to an external fleet owner and/or operator
Revenue Fee per mile
Costs borne by Aurora1
Variable: Insurance2
, Aurora Driver hardware/maintenance cost3
, Teleassist, Cloud,
Telecommunications, and any variable fees paid to partners
Fixed: Development & extension of Aurora Driver
Fleet Ownership Third Party
Fleet Operation Third Party
1
Cost allocations subject to change as we commercialize and further define sharing of costs with our partners.
2
Insurance cost may be borne by our partners.
3
Aurora Driver hardware cost expected to be leased, with cost passed through to customer.
Note: For the first 1-2 years of commercial operations, we expect to own and operate our own small fleet as we learn and develop the playbooks for our partners.
Driver as a Service business model
is highly capital efficient
36
Financials
©2022 | Aurora Proprietary
- 37. ©2022 | Aurora Proprietary 37
*Computer-rendered imagery provided for illustrative purposes only
- 38. Aurora’s next-generation
approach positions it to win
38
©2022 | Aurora Proprietary
▸ Led by a management team
with deep technical and
industry experience
▸ A differentiated go-to-market
strategy that enables rapid and
efficient entry to multiple
verticals
▸ Strong, strategic partnerships
accelerate commercialization
▸ Driver as a Service model
creates attractive unit
economics
Financials
- 41. Development, launch, and scale of
the Aurora Driver is expected to happen in five phases
41
©2022 | Aurora Proprietary
Phase I
Lay the Foundation
Phase II
Develop & Refine
Phase III
Validate
Phase IV
Launch
Phase V
Expand
Product
Minimally viable product
defined & go-to-market
strategy outlined
Commercial pilots
expanded; customer support
infrastructure developed
Trucking and rides products
(Driver + Vehicle + Operational
Infrastructure) validated
Driverless truck product
launched on initial lane(s);
rides product launched in
initial geo(s)
Truck lane coverage,
trailer types & use cases
expands
Rides product launches &
trip coverage grows
Driver
Functional architecture
designed; HW/SW
foundational driving
capability developed
Design-representative HW
complete
Software performance
refined
HW & SW validated for initial
operational domain
Additional vehicles, lanes, and
markets begin development
Post-MVP SW capabilities
added to incrementally
unlock new lanes & trips
Vehicle
Platform partners &
requirements developed
Driverless-capable truck and
passcar platforms designed
Release candidate truck &
passcar platforms validated
Start of scale vehicle
production
Driver HW, truck platform
& passcar platforms
optimized for cost/scale
Operations
Development process
established; commercial
process prototyped/tested in
first customer pilot
Development & commercial
operations integrated
Commercial infrastructure &
ops established
End-to-end commercial pilots
ramped; operational support
infrastructure refined
Commercial engagements
grown
Operational presence &
processes hardened
Third parties trained
Select operational
support workstreams
transitioned to third-party
partners
Appendix
- 42. Self-driving 2.0: Aurora is developing
the next-generation approach to self-driving
Self-driving 1.0 Self-driving 2.0
Hardware
Vehicle interface Highly customized/bespoke to a single vehicle Widely adaptable/consistent platform approach
Sensor suite Limited range, resolution, and data Advanced range, resolution, and data on multiple
sensor modes (e.g FirstLight lidar, imaging radar,
custom cameras)
Software
Structured learning Machine learned and engineered approaches
largely segregated
ML and engineering elegantly interleaved throughout
the system (perception, forecasting, motion planning
& controls)
Virtual development Heavily focused/reliant on slow, inefficient on-road
testing to understand system performance
Leverages a full suite of simulation and log-based
tests for both module and end-to-end performance.
Extremely high fidelity sensor simulation; large-scale
structured tests; every disengagement analyzed &
turned into durable offline tests
Localization 2-3 degree of freedom positioning 6 degree of freedom, highly-accurate/precise
positioning
Mapping Globally-consistent at the expense of local
consistency and maintainability. Difficult to edit and
deploy localized changes
Sharded, lightweight, locally-consistent Aurora Atlas
that enables high accuracy, localized changes, and
rapid — even over the air — updates
42
©2022 | Aurora Proprietary
Appendix
- 43. Historical Financial Summary
($ in thousands) Year End December 31, 2021 Year End December 31, 2020
Collaboration revenue $82,538 -
Operating expenses:
Research and development 697,276 179,426
Selling, general and administrative 115,925 38,693
Loss from operations (730,663) (218,119)
Other income (expense):
Interest and other income 525 3,717
Change in fair value of derivative liabilities (20,116) -
Transaction costs (4,516) -
Other expense (5,184) (45)
Loss before income taxes (759,954) (214,447)
Income tax expense (benefit) (4,501) 2
Net Loss $(755,453) $(214,449)
Basic and diluted net loss per share - Class A and Class B $(1.22) $(0.79)
Basic and diluted weighted - average shares outstanding - Class A and Class B 620,816,420 270,940,197
43
©2022 | Aurora Proprietary