Result & discussion uv vis (exp 3) - for merge
1. 5.0 RESULT / DATA ANALYSIS
Table 1: Absorbance value at 516 nm of Carmoisine Standard at different concentration
Concentration (ppm) Absorbance (516 nm) Molar absorptivity (L.mol−1
. cm−1
)
0 (Blank) 0 0
5 0.342 3.4366 × 10⁴
15 0.739 2.4753 × 10⁴
25 1.106 2.2228 × 10⁴
35 1.455 2.0887 × 10⁴
45 1.792 2.0008 × 10⁴
Table 2: Absorbance value at 516 nm of Unknown Samples at different concentration
Unknown Concentration (ppm) Absorbance (516 nm) Molar absorptivity
(L. mol−1
. cm−1
)
A 27.8 1.005 1.8163 × 10⁴
B 36.4 1.317 1.8179 × 10⁴
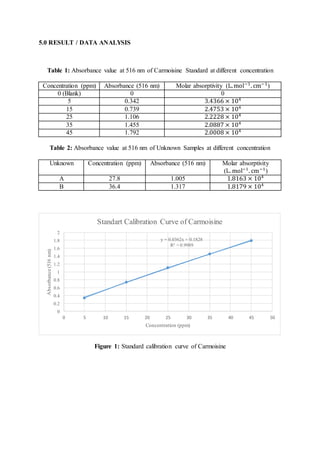
Figure 1: Standard calibration curve of Carmoisine
y = 0.0362x + 0.1828
R² = 0.9989
0
0.2
0.4
0.6
0.8
1
1.2
1.4
1.6
1.8
2
0 5 10 15 20 25 30 35 40 45 50
Absorbance(516nm)
Concentration (ppm)
Standart Calibration Curve of Carmoisine
2. 6.0 DISCUSSION
The purpose of this experiment were to determine Lambda Max for Carmoisine sample
(wavelength scan). To determine ɛ the molar absorptivity of Carmoisine and to prepare a serial
dilution and generate a standard calibration graph for sample quantitation (photometric scan).
The Carmoisine standard solution samples were run by using Uv-Vis Spectrophotometer.
Ultraviolet-visible spectroscopy or ultraviolet-visible spectrophotometry (UV-Vis or UV/Vis)
refers to absorption spectroscopy in the ultraviolet-visible spectral region. This means it uses light
in the visible and adjacent (near-UV and near-infrared (NIR)) ranges. UV-Vis spectrophotometer
is used in the quantitative determination of concentrations of the absorber in the solutions of
transition metal ions and highly conjugated organic compounds (IIT Kanpur, 2012). Besides, UV
spectrophotometer principle follows the Beer-Lambert Law. This law states that whenever a beam
of monochromatic light is passed through a solution with an absorbing substance, the decreasing
rate of the radiation intensity along with the thickness of the absorbing solution is actually
proportional to the concentration of the solution and the incident radiation (Choudhary, A. 2017).
The experiment was started with 100 ppm of stock solution of Carmoisine was prepared
to dilute the stock solution into different concentration which were 5 ppm, 15 ppm, 25 ppm, 35
ppm and 45 ppm with distilled water into 50 ml volumetric flask. The volume needed to prepare
the serial dilution from 100 ppm of stock solution were 2.5 ml, 7.5 ml, 12.5 ml, 17.5 ml and
22.5 ml respectively. The volume of serial dilution were calculated by using the
formula M1V1 = M2V2. Moreover, the unknown sample was prepared with the same method
as serial dilution but the volume of stock solution must be between 2.5 ml to 22.5 ml.
After setting up the UV-Vis, the blank solution was placed into instrument and baseline
was click. After the blank solution became zero, the standard solution of 45 ppm was placed to
another cuvette. The maximum wavelength was recorded at 516 nm. The maximum
wavelength was the wavelength with the higher absorbance. For the photometric scan, the
cuvette was filled with standard solution 5 ppm to 45 ppm to determine the absorbance and
prepared for the standard calibration curve.
3. According to the result obtained, the absorbance reading showed for the standard
solution 5 ppm, 15 ppm, 25 ppm, 35 ppm and 45 ppm were 0.342, 0.739, 1.106, 1.455 and
1.792 respectively. Based on graph plotted, the absorbance (516 nm) was directly proportional
to the concentration (ppm). Because of when the concentration was higher, more radiation is
absorbed and the absorbance also become higher. In addition, for the unknown samples the
absorbance obtained were 1.005 and 1.317. The concentration of unknown samples have found
by using Beer’s Lambert law formula A = εbc with the slope obtained was 0.0362 which
indicates the molar absorptivity of Carmoisine. Thus, the concentration of unknown samples
were 27.8 ppm and 36.4 ppm. Furthermore, the graph showed the R2
value that is a statistical
measure of how close the data are to the fitted regression line (Ogee, A. 2013). The correlation
coefficient varies about +1 to -1. The graph showed the correlation coefficient was 0.9989
which the R2
value was nearest to the +1 which indicates the accurate of the result.
As conclusion, there are several possibilities precaution that should be considered.
Firstly, make sure use the pipette to measure the volume of Carmoisine to get the accuracy.
Secondly, make sure wipe and do not touched the clean sides of cuvette and carrying out the
set-up procedure in the correct order.
REFERENCES
1. Ogee, A. (2013). Regression Analysis: How Do I Interpret R-squared and Assess the
Goodness-of-Fit?. Retrieved from https://blog.minitab.com/blog/adventures- in-
statistics-2/regression-analysis-how-do-i-interpret-r-squared-and-assess-the-goodness-
of-fit.
2. Wenzel, T. (2019). Beer’s Law. Retrieved from
https://chem.libretexts.org/Bookshelves/Analytical_Chemistry/Supplemental_Module
s_(Analytical_Chemistry)/Analytical_Sciences_Digital_Library/Active_Learning/In_
Class_Activities.
3. IIT Kanpur. (2012). UV-Vis Spectrophotometer. Retrieved from
https://www.iitk.ac.in/dordold/index.php?option=com_content&view=category&layo
ut=blog&id=219&Itemid=238.
4.