Temperature Mapping (WHO).pdf
•
4 likes•3,520 views

The document discusses temperature mapping, which involves identifying temperature variations within storage areas like warehouses and cold rooms. It outlines GMP requirements for temperature mapping, the mapping process, methodology, and periodic requalification. The methodology involves selecting data loggers, mapping the site, establishing acceptance criteria, determining logger locations, running the study for 7+ days typically, and identifying any hot or cold spots. Periodic requalification is recommended every 3 years or when systems change.

Recommended
Recommended
More Related Content
What's hot
What's hot (20)
Similar to Temperature Mapping (WHO).pdf
Similar to Temperature Mapping (WHO).pdf (20)
Recently uploaded
Recently uploaded (20)
Temperature Mapping (WHO).pdf
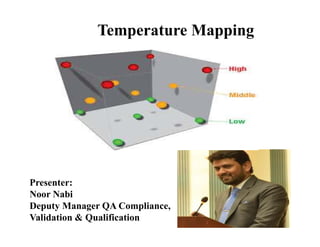
- 1. Presenter: Noor Nabi Deputy Manager QA Compliance, Validation & Qualification Temperature Mapping
- 2. CONTENTS Temperature Mapping (What and Why) GMP Requirements Regulations and Guidance Stages of temperature-mapping process Methodology Periodic requalification
- 3. Normal Human Hand ?
- 4. Is That Normal ?
- 5. If we have knowledge about the Normal then we can easily detect the Abnormal
- 6. What is Temperature Mapping Study? Temperature Mapping study is the process to identify the difference or changes in temperature (Where applicable) that occurs within a warehouse/walk in rooms & Chambers due to the influence of the system and / or Equipments and by the outside environment condition. TM identified Temperature distribution within the zone being mapped and it locates hot and cold spots. Why Temperature Mapping Study ? A temperature mapping exercise is required by regulatory bodies for any space allocated for the storage and handling of products with a specified labeled storage temperature. Freezer Rooms, Cold Rooms, Temperature-controlled Storage Areas, Quarantine Areas ,Receiving and Loading Bays.
- 7. WHO PIC/S Health Canada ISPE FDA TRS No. 961, 2011 – Temperature mapping of storage areas (For storage areas) PIC/S Guide to Good Distribution Practice for Medicinal Products PE 011-1, June 2014 Health Canada GUI-0069 – Guidelines for Temperature Control of Drug Products during Storage and Transportation (2011) ISPE Good Practice Guide – Cold Chain Management (2011) ISPE Controlled Temperature Chamber Mapping (2012) (Environmental chambers and other equipments) 21 CFR 210 Manufacturing Processing or Holding of Drugs 21 CFR Part 211 cGMP for Finished products References
- 8. General Consideration For TM HVAC system /Equipments which support the area should be qualified prior to temperature mapping study. For new Facility study conducted on both Empty & Loaded Condition For periodic Requalification study conducted on real time basis If storage areas are affected by seasonal temperature variations, at least two temperature-mapping studies may be needed. one during the warmest season and one during the coldest season. Typically, two-season mapping is not necessary for cold rooms and freezer rooms.
- 9. The Temperature-mapping process has four stages: Prepare a mapping protocol. Carry out the mapping exercise. Prepare a mapping report. Implement the recommendations
- 10. Methodology It is important to note that steps 1 to 5 must be completed before the mapping protocol can finally be approved. Step 1 – Select Electronic Data Logging monitor : Sufficient memory 3-point calibration completed and valid (within the current year), and have an error of no more than ― 0.5. Valid calibration certificates for each of the data loggers used in the study must be included in the mapping report. Calibration temperature points used for the calibration of EDLMs should cover the required temperature range One calibration point below the low end of the range, One calibration point in the middle of the range, One calibration point above the high end of the range.
- 11. To ensure consistency, use only one type of device per mapping study. It may be appropriate to include an EDLM device that is able to monitor door openings, programmed so that the readings on the temperature monitoring devices can be aligned with door opening times. Step 2 – Designate the mapping team: Identify and list the team members. Record their signatures and initials so that signed records can be traced back to the person who prepared the document. Ensure that all team members receive the training needed to perform their assigned tasks.
- 12. Step 3 – survey the site: Conduct a site survey of the area(s) to be mapped. The following information is required for each thermally separate area being mapped: Length, width and height; Drawing of each area, showing elements, such as shelving or pallet racking, that may have an effect on the even heating or cooling of the space and which may affect its temperature stability. The shelving or pallet racking will be used to place the EDLMs, so it is important to record these components accurately; The location of heating and cooling components, including air distribution outlets and/or ceiling fans; The location of existing temperature recording sensors and temperature controlling sensors.
- 13. Step 4 – Establish acceptance criteria: Type of TTSPPs time- and temperature-sensitive pharmaceutical product being stored. Example: + 2.0 °C to + 8.0 °C or + 15.0 °C to + 25.0 °C. However, some mapping studies may be performed without predefining any acceptance criteria. This type of study can be used to establish the types of product that can safely be stored in a specific space, and what remedial actions might have to be taken to improve the thermal performance of the space in order to optimize its use. If the temperature-mapping study is designed to include door opening(s), this should be stated in the study methodology and acceptance criteria. Also the door opening parameters (frequency and duration) should be defined. The temperature should be maintained within the defined temperature limits except for a maximum of 30 minutes following the door opening.
- 14. Step 5 – determine EDLM locations: Use the site survey to mark the required locations of the EDLMs. A risk-based approach can be applied to define these locations. Length and width: EDLMs should be arranged in a grid fashion along the width and length of the area so that the area is reasonably covered, with EDLMs located Every 5–10 meters. (In very large facilities, this can be up to 20 or 30 meters) The chosen sensor grid should take account of: the layout of the area (e.g. whether it is square or includes alcoves); the degree to which shelving and products may affect airflow;
- 15. Height: At each point on the grid, arrange EDLMs vertically as follows: If the ceiling height is 3.6 metres or less, position EDLMs directly above one another at high, medium and low level (e.g. one EDLM at floor level, one at 1.2 metres and one EDLM at 3.0 metres. If the ceiling height is greater than 3.6 metres, EDLMs can be arranged in vertical arrays at the bottom, middle (multiple) and top of the space. For instance, for a storage area 6 metres in height, EDLMs can be positioned in each grid location at heights of 0.3 metres, 1.8 metres, 3.6 metres and 5.4 metres.
- 16. Number of sensors for Warehouse
- 17. Number of sensors for Warehouse
- 18. Number of sensors for Walk in Rooms/Chambers
- 19. Number of sensors for Walk in Rooms/Chambers
- 20. There is no formal time limit for a mapping study. warehouses and other ambient storage areas, it should be run for a minimum of seven consecutive days – including five working days and two weekend days. (Data logging Interval 10-15 minutes) Temperature-controlled equipment ( Freezer rooms and cold rooms), the mapping study should be run for between 24 and 72hours, or longer if justified. (Data logging Interval 05-10 minutes)
- 21. Periodic requalification? When any significant change in system i.e. Performance of System change form its predetermined parameters Modification in Area Replacement of HVAC supporting system or Its parts When there is no change or abrupt behavior Study conducted after every 03 years (20 days Margin)
- 22. Cold Spot Lowest temperature(s) recorded in the space over the study period, but these lowest temperature(s) remain within the specified temperature range (e.g. cold spots identified between +15.0 °C and +17.5 °C in a room with a specified temperature range of +15.0 °C to +25.0 °C). Hot Spot Highest temperature(s) recorded in the area studied over the study period, but these highest temperature(s) remain within the specified temperature range (e.g. hot spots identified between +23.0 °C and +25.0 °C in a room with a specified temperature range of +15.0 °C to +25.0 °C). Mean Kinetic Temprature (MKT) The single calculated temperature at which the total amount of degradation over a particular period is equal to sum of the individual degradation that would occur at various temperature