Amazon Financial Performance
Introduction
Amazon is one of the biggest online retailing companies that provide Cloud Services and production of electronic gadgets.
It operates in different market segments which include media, Electronics and Gadget Merchandise, and Cloud.
Amazon operates under a monopolistic competition industry and it has rivals that offers substitute products.
Amazon is one of the largest online retailing companies who deals with manufacture of electronic gadgets, and offer cloud services. The company has a product mix as it deals with diversified products and market segments.
The company operates in three major market segments; Cloud, Electronics & Gadgets, Media,
Its posses the characteristics of a monopolistic competition market. It faces stiff competition from EBay, Alibaba Group Holdings, Apple, and AutoZone among others.
2
Selection of comparable groups of companies
The comparable group of companies was selected on the following basis;
Market Segment
Consistent financial performance trend.
Market share
The four companies include EBay, AutoZone, Best Buy, and Wal-Mart Stores, Inc.
The logic used to determine the comparable groups of companies revolved three factors.
Market segment – amazon operates in three different market segment which include Media, Electronics and Gadgets, and Cloud services.
All the four companies have been selected from the three market segments.
Wal-Mart stores, Inc. – Retail and wholesale business
eBay – Media
Best Buy Co, Inc. – Electronics and Gadgets.
AutoZone, Inc.- Online retailing.
3
Amazon’s competitors
The four major rivals include
eBay
AutoZone, Inc.
Best Buy Co, Inc.
Wal-Mart Stores, Inc.
The above four companies shares common market features and goals. Some of the characteristics include establishment of new outlets, maximizing sales, and pricing and competition strategies.
eBay, Inc. operates as a commerce leader company including Marketplace, StubHub, and Classifieds platforms. It deals with in the provision of acquisitions and investments to help enable commerce on platforms for buyers and sellers online or on mobile devices. It includes marketing services, including classifieds, and advertising.
AutoZone, Inc. engages in the provision of retail and a distribution of automotive replacement parts and accessories.
Best Buy Co., Inc. provides consumer electronics, home office products, entertainment products, appliances and related services.
Wal-Mart Stores, Inc. deals in retail and wholesale business
4
Data extraction strategy, process and methodology
The following procedure was utilized in data gathering and methodology.
Internet search on financial databases.
Importation of data to the excel working sheet
Editing
Analysis
Data extraction, process and methodology took four procedures. First, as a team we conducted an internet search on financial databases to gather data for the four companies. We used Yahoo Finance to gather the data for all the compa.
Amazon Financial PerformanceIntroduction Amazon is o.docx
1. Amazon Financial Performance
Introduction
Amazon is one of the biggest online retailing companies that
provide Cloud Services and production of electronic gadgets.
It operates in different market segments which include media,
Electronics and Gadget Merchandise, and Cloud.
Amazon operates under a monopolistic competition industry and
it has rivals that offers substitute products.
Amazon is one of the largest online retailing companies who
deals with manufacture of electronic gadgets, and offer cloud
services. The company has a product mix as it deals with
diversified products and market segments.
The company operates in three major market segments; Cloud,
Electronics & Gadgets, Media,
Its posses the characteristics of a monopolistic competition
market. It faces stiff competition from EBay, Alibaba Group
Holdings, Apple, and AutoZone among others.
2
Selection of comparable groups of companies
The comparable group of companies was selected on the
following basis;
Market Segment
Consistent financial performance trend.
2. Market share
The four companies include EBay, AutoZone, Best Buy, and
Wal-Mart Stores, Inc.
The logic used to determine the comparable groups of
companies revolved three factors.
Market segment – amazon operates in three different market
segment which include Media, Electronics and Gadgets, and
Cloud services.
All the four companies have been selected from the three market
segments.
Wal-Mart stores, Inc. – Retail and wholesale business
eBay – Media
Best Buy Co, Inc. – Electronics and Gadgets.
AutoZone, Inc.- Online retailing.
3
Amazon’s competitors
The four major rivals include
eBay
AutoZone, Inc.
Best Buy Co, Inc.
Wal-Mart Stores, Inc.
The above four companies shares common market features and
goals. Some of the characteristics include establishment of new
outlets, maximizing sales, and pricing and competition
strategies.
eBay, Inc. operates as a commerce leader company including
Marketplace, StubHub, and Classifieds platforms. It deals with
in the provision of acquisitions and investments to help enable
commerce on platforms for buyers and sellers online or on
3. mobile devices. It includes marketing services, including
classifieds, and advertising.
AutoZone, Inc. engages in the provision of retail and a
distribution of automotive replacement parts and accessories.
Best Buy Co., Inc. provides consumer electronics, home office
products, entertainment products, appliances and related
services.
Wal-Mart Stores, Inc. deals in retail and wholesale business
4
Data extraction strategy, process and methodology
The following procedure was utilized in data gathering and
methodology.
Internet search on financial databases.
Importation of data to the excel working sheet
Editing
Analysis
Data extraction, process and methodology took four procedures.
First, as a team we conducted an internet search on financial
databases to gather data for the four companies. We used Yahoo
Finance to gather the data for all the companies. Next, we
imported data to excel where selection of ratios was done.
Analysis followed where the average of all the ratios from the
four companies were averaged.
5
Share %
Ratio Analysis
We selected the following ratios to construct a comparative
4. analysis statement for the four companies.
Profitability Ratios Debt Management
Ratios Liquidity ratios
Profit Margin Total debt to total equity
Cash Ratio
Return on Assets Total debt to total Assets
Quick Ratio
Return on Equity Long-term debt to Equity
Current Ratio
The following ratios were selected due the following reasons
Profitability ratios
a) Profit margin measures the amount of net income
earned with respect to net sales.
b)Return on assets shows how profitable a company’s
assets can earn income.
c)Return on equity measures the amount of profit a
company generates from shareholder’s equity.
Debt management Ratios
a) Total debt to total equity - determines the company
leverage.
b) Total debt to total assets – indicates the percentages of
assess funded by liabilities.
c) Long-term debt to equity – Measures the financial
leverage.
Liquidity Ratios
a) Cash ratio – measures the amount of cash, invested
funds or cash equivalents present in current assets to cover up
current liabilities.
b) Quick ratio – indicates the ability of a company to meet
its short term financial liabilities.
5. c) Current ratio – measures the ability of a business to
meet its short-term and long-term needs.
6
Ratio analysis continuation
Asset Management ratios
Receiver turnover
Total Asset turnover
Revenue/Employer
Value creation ratios
P/E current
Price to Book ratio
Price to sale ratio.
Asset Management ratios
a) Receiver turn over – determines the company’s to
efficiently issue credit to its customers and collect funds from
them in a timely manner.
b)Total Asset turnover - indicates how a business efficiently
utilize its assets to generate sales.
c) Revenue/ Employee – Measures how a company utilizes its
employees.
Value creation ratios
a) P/E current – It measures the value of the company by
measuring its current price relative to per-share earnings
b) Price to book ratio – It compares a stock’s market value
with its book value.
c) Price to sale ratios – It is a valuation of metrics of stock.
7
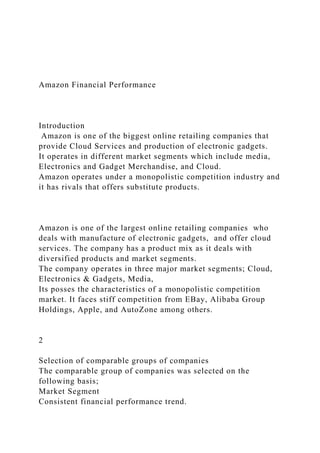
6. The above analysis has been extracted from excel. Its is clear
that, Amazon is not the leading company in the media,
electronics and gadgets, and Cloud industry. However, its has
an outstanding performance compared to some of the companies
in the industry.
8
The analysis above shows the performance of Amazon compared
to averaged performance of its rivals. It can be served that,
averaged performance of its rivals is higher than that of
amazon. It means that if the four companies merge, amazon
market share will reduce significantly.
9
References
Best Buy Co. Inc. (n.d.). Retrieved March 18, 2017, from
http://www.marketwatch.com/investing/stock/bby/profile
Market watch ( 2017). Alibaba Group Holding Ltd. ADR.
Retrieved March 18, 2017, from
http://www.marketwatch.com/investing/stock/baba/profile
EBay Inc. (n.d.). Retrieved March 18, 2017, from
http://www.marketwatch.com/investing/stock/ebay/profile
AMZN Key Statistics | Amazon.com, Inc. Stock - Yahoo
Finance. (n.d.). Retrieved March 12, 2017, from
https://finance.yahoo.com/quote/AMZN/key-statistics?p=AMZN
Financial Ratios Analysis
Amazon, Inc.Wal-Mart Stores, Inc.EbayAutoZone, IncBest Buy
7. Co.IncAveraged ratios
PROFITABILITY
Net Margin1.742.8181.1311.674.6125.055
Return on Assets3.086.853514.868.8216.3825
Return on Equity14.5217.2385.13026.5732.2325
DEBT MANAGEMENT
Total debt to total Equity105.8359.0585.02028.9943.265
Total debt to total assets23.7323.137.5757.789.8532.075
Long-term debt to Equity78.8954.0171.25154.7828.0577.0225
LIQUIDITY
Current Ratio1.040.862.310.91.481.3875
Quick Ratio0.780.222.310.130.790.8625
Cash Ratio0.590.11.860.040.550.6375
ASSET MANAGEMENT
Receivable turnover18.4284.814.8339.7231.4142.69
Total Asset turnover1.772.440.431.272.881.755
Revenue/employee398,3220712,619126,615.000209808.5
VALUE CREATION
P/E Current173.9415.965.3117.9612.0112.81
Price to Book Ratio18.5503.06000.765
Price to Sales Ratio2.670.433.782.160.361.6825
Comparative ratiosFinancial Ratios AnalysisAmazon, Inc.Wal-
Mart Stores, Inc.EbayAutoZone, IncBest Buy Co.IncAveraged
ratiosAmazon, Inc.Average
ratiosPROFITABILITYPROFITABILITYNet
Margin1.742.8181.1311.674.6125.055Net
Margin1.7425.055Return on
Assets3.086.853514.868.8216.3825Return on
Assets3.0816.3825Return on
Equity14.5217.2385.13026.5732.2325Return on
Equity14.5232.232500DEBT MANAGEMENTDEBT
MANAGEMENT0Total debt to total
Equity105.8359.0585.02028.9943.265Total debt to total
Equity105.8343.265Total debt to total
assets23.7323.137.5757.789.8532.075Total debt to total
assets23.7332.075Long-term debt to
8. Equity78.8954.0171.25154.7828.0577.0225Long-term debt to
Equity78.8977.02250LIQUIDITYLIQUIDITY0Current
Ratio1.040.862.310.91.481.3875Current Ratio1.041.3875Quick
Ratio0.780.222.310.130.790.8625Quick Ratio0.780.8625Cash
Ratio0.590.11.860.040.550.6375Cash Ratio0.590.63750ASSET
MANAGEMENTASSET MANAGEMENT0Receivable
turnover18.4284.814.8339.7231.4142.69Receiver
turnover18.4242.69Total Asset
turnover1.772.440.431.272.881.755Total Asset
turnover1.771.755Revenue/employee398,3220712,619126,615.0
00209808.5Revenue/employee398,322209808.50VALUE
CREATIONVALUE CREATION0P/E
Current173.9415.965.3117.9612.0112.81P/E
Current173.9412.81Price to Book Ratio18.5503.06000.765Price
to Book Ratio18.550.765Price to Sales
Ratio2.670.433.782.160.361.6825Price to Sales
Ratio2.671.6825
Amazon, Inc.Average ratios
PROFITABILITY
Net Margin1.7425.055
Return on Assets3.0816.3825
Return on Equity14.5232.2325
0
0
DEBT MANAGEMENT0
Total debt to total Equity105.8343.265
Total debt to total assets23.7332.075
Long-term debt to Equity78.8977.0225
0
LIQUIDITY0
Current Ratio1.041.3875
Quick Ratio0.780.8625
Cash Ratio0.590.6375
0
ASSET MANAGEMENT0
Receiver turnover18.4242.69
9. Total Asset turnover1.771.755
Revenue/employee398,322209808.5
0
VALUE CREATION0
P/E Current173.9412.81
Price to Book Ratio18.550.765
Price to Sales Ratio2.671.6825
Comparative ratiosFinancial Ratios AnalysisAmazon, Inc.Wal-
Mart Stores, Inc.EbayAutoZone, IncBest Buy Co.IncAveraged
ratiosAmazon, Inc.Average
ratiosPROFITABILITYPROFITABILITYNet
Margin1.742.8181.1311.674.6125.055Net
Margin1.7425.055Return on
Assets3.086.853514.868.8216.3825Return on
Assets3.0816.3825Return on
Equity14.5217.2385.13026.5732.2325Return on
Equity14.5232.232500DEBT MANAGEMENTDEBT
MANAGEMENT0Total debt to total
Equity105.8359.0585.02028.9943.265Total debt to total
Equity105.8343.265Total debt to total
assets23.7323.137.5757.789.8532.075Total debt to total
assets23.7332.075Long-term debt to
Equity78.8954.0171.25154.7828.0577.0225Long-term debt to
Equity78.8977.02250LIQUIDITYLIQUIDITY0Current
Ratio1.040.862.310.91.481.3875Current Ratio1.041.3875Quick
Ratio0.780.222.310.130.790.8625Quick Ratio0.780.8625Cash
Ratio0.590.11.860.040.550.6375Cash Ratio0.590.63750ASSET
MANAGEMENTASSET MANAGEMENT0Receivable
turnover18.4284.814.8339.7231.4142.69Receiver
turnover18.4242.69Total Asset
turnover1.772.440.431.272.881.755Total Asset
turnover1.771.755Revenue/employee398,3220712,619126,615.0
00209808.5Revenue/employee398,322209808.50VALUE
CREATIONVALUE CREATION0P/E
Current173.9415.965.3117.9612.0112.81P/E
Current173.9412.81Price to Book Ratio18.5503.06000.765Price
10. to Book Ratio18.550.765Price to Sales
Ratio2.670.433.782.160.361.6825Price to Sales
Ratio2.671.6825
SMGT 631
Outline example:
I. Title Page
II. Abstract
III. Introduction/Thesis
IV. Supporting Idea
A. First level headings
1. Second level headings or supporting ideas (does not
necessarily need to have a heading)
a) Additional levels (if necessary)
V. Second Supporting Idea
A. …
1. …
a) …
VI. Conclusion, etc.
11. A. …
1. …
a) …
VII. References
VIII. Appendices (if applicable)
In the same document as the outline, the student should list and
describe all of their key sources. Each source should first be
cited using the APA style. After the citation, a brief
summarization and justification for including that source should
be provided. For research articles, you should discuss the key
findings and practical applications of the research.
Page 1 of 1
FIN515: Week 6 Project – Calculating the Weighted Average
Cost of Capital
Once again, your team is the key financial management team for
your company. The company’s CEO is now looking to expand
its operations by investing in new property, plant, and
equipment. In order to effectively evaluate the project’s
effectiveness, you have been asked to determine the firm’s
weighted average cost of capital. To determine the cost of
capital, here is what you have been asked to do.
1. Go to Yahoo Finance (http://finance.yahoo.com) and capture
the income statement information for the company you selected.
(Be sure that your company has debt on their balance sheet.
This will be required in your project.)
12. a. Enter your company’s name or ticker symbol. Your
company’s information should appear.
b. Click on the Financials tab, and select the income statement
option. Three years’ worth of income statements should appear.
Copy and paste this data into a spreadsheet.
c. Repeat step b. above for the balance sheets of the company.
d. Click on “Historical Prices.” Capture the closing price of the
stock as of the balance sheet date for the three fiscal years used
in steps b and c above.
2. Calculate the Weighted Average Cost of Capital (WACC) for
the company:
a. Cost of Debt
i. Determine the market value of the firm’s debt issues. Be sure
to review the firm’s 10-K. Also, the website http://finra-
markets.morningstar.com/BondCenter may be of assistance.
ii. You will need to calculate the firm’s composite YTM on its
bonds. This can be achieved by calculating a weighted-average
YTM for its bond issues.
iii. After calculating the YTM for the bond issues, calculate the
firm’s after-tax cost of debt. If the firm’s marginal tax rate
cannot be identified in its 10-K, assume that the tax rate will be
35%.
b. Cost of Equity
i. Calculate the firm’s cost of equity using the capital asset
pricing model (CAPM). The formula for the CAPM is ri = rf +
βi × (RMkt - rf).
ii. Assume the risk-free rate (rf) is the current rate of 10-year
U.S. Treasury Bonds.
iii. Calculate the market rate (RMkt) by calculating the market
return on the Standard & Poor’s 500 for the past 2 calendar
years.
iv. The beta for the firm can be obtained from Yahoo! Finance.
c. Calculate the WACC
13. i. Determine the market capitalization of the firm’s common
equity and preferred equity, if any.
ii. Determine the firm’s capital structure based on the market
value of the firm’s equity and debt. The market value of the
firm’s debt can be obtained from the Morningstar website, listed
in the Cost of Debt section above.
iii. Calculate the WACC. As you recall, the formula for WACC
is rWACC = E ÷ (E + D) rE + D ÷ (E + D) rD (1 - TC).
Deliverable
Prepare a narrated PowerPoint presentation using VoiceThread
or WebEx that shows the steps you performed to calculate the
WACC for your firm. Feel free to embed your Excel
spreadsheets in the presentation to demonstrate your
calculations. Be sure to discuss how the values were obtained or
derived to arrive at your WACC result. Finally, be sure to
discuss any strengths or limitations in the calculations you
performed, and discuss your analysis about the overall validity
of your results. Both members of the team must be part of the
narration in the presentation.
Grading Rubric
Possible
Points
Criteria and Point Range
Calculation of Cost of Debt
12
0-3
4-6
14. 7-9
10-12
Incorrect data or no debt data provided.
Incorrect cost of debt calculations
Questionable data used. Some errors in calculations presented.
Data is mostly accurate. Correct calculations performed.
Accurate debt data collected and correct cost of debt
calculations made.
Calculation of Cost of Equity
12
0-3
4-6
7-9
10-12
Incorrect data or no equity data provided.
Incorrect cost of equity calculations
Questionable data used. Some errors in calculations presented.
Data is mostly accurate. Correct calculations performed.
Accurate equity data collected and correct cost of debt
calculations made.
WACC Calculation
8
15. 0-2
3-4
5-6
7-8
All elements of the WACC calculation are incorrect, or
calculation not performed.
Two errors noted in the calculation relating to either cost of
debt, cost of equity, or capital structure.
One error noted in the calculation relating to either cost of debt,
cost of equity, or capital structure.
WACC Calculation utilizes appropriate cost of debt and equity
and capital structure to arrive at a solid result.
Form
8
0-2
3-4
5-6
7-8
Poor writing and presentation skills, or no presentation
provided.
Several problems noted in regard to writing and presentation
skills.
Writing and presentation done well with a few minor errors
Virtually no errors in writing or presentation.
16. 1
FIN515: Week 6 Project
–
Calculating the Weighted Average Cost of
Capital
1
Once again, your team is the key financial management team for
your company.
The
company’s
CEO
is
now
20. eir balance sheet. This
will be required in your project.)
a.
Enter your company’s name or ticker symbol. Your company’s
information should
appear.
b.
Click on the
Financials
tab, and select the income statement option. Three years’ worth
of income statements sh
ould appear. Copy and paste this data into a spreadsheet.
c.
Repeat step b. above for the balance sheets of the company.
d.
Click on “Historical Prices.” Capture the closing price of the
stock as of the balance sheet
date for the three fiscal years used in steps
b and c above.
2.
Calculate the Weighted Average Cost of Capital (WACC) for
the company:
35. )
r
E
+
D
÷
(
E
+
D
)
r
D
(1
-
T
C
).
FIN515: Week 6 Project – Calculating the Weighted Average
Cost of
Capital
1
Once again, your team is the key financial management team for
your company. The company’s CEO is
now looking to expand its operations by investing in new
property, plant, and equipment. In order to
36. effectively evaluate the project’s effectiveness, you have been
asked to determine the firm’s weighted
average cost of capital. To determine the cost of capital, here is
what you have been asked to do.
1. Go to Yahoo Finance (http://finance.yahoo.com) and capture
the income statement information
for the company you selected. (Be sure that your company has
debt on their balance sheet. This
will be required in your project.)
a. Enter your company’s name or ticker symbol. Your
company’s information should
appear.
b. Click on the Financials tab, and select the income statement
option. Three years’ worth
of income statements should appear. Copy and paste this data
into a spreadsheet.
c. Repeat step b. above for the balance sheets of the company.
d. Click on “Historical Prices.” Capture the closing price of the
stock as of the balance sheet
date for the three fiscal years used in steps b and c above.
2. Calculate the Weighted Average Cost of Capital (WACC) for
the company:
a. Cost of Debt
i. Determine the market value of the firm’s debt issues. Be sure
to review the
firm’s 10-K. Also, the website http://finra-
markets.morningstar.com/BondCenter may be of assistance.
ii. You will need to calculate the firm’s composite YTM on its
bonds. This can be
achieved by calculating a weighted-average YTM for its bond
issues.
iii. After calculating the YTM for the bond issues, calculate the
firm’s after-tax cost
of debt. If the firm’s marginal tax rate cannot be identified in
37. its 10-K, assume
that the tax rate will be 35%.
b. Cost of Equity
i. Calculate the firm’s cost of equity using the capital asset
pricing model (CAPM).
The formula for the CAPM is r
i
= r
f
+ β
i
× (R
Mkt
- r
f
).
ii. Assume the risk-free rate (r
f
) is the current rate of 10-year U.S. Treasury Bonds.
iii. Calculate the market rate (R
Mkt
) by calculating the market return on the
Standard & Poor’s 500 for the past 2 calendar years.
iv. The beta for the firm can be obtained from Yahoo! Finance.
c. Calculate the WACC
i. Determine the market capitalization of the firm’s common
equity and preferred
equity, if any.
ii. Determine the firm’s capital structure based on the market
value of the firm’s
equity and debt. The market value of the firm’s debt can be
obtained from the
Morningstar website, listed in the Cost of Debt section above.
iii. Calculate the WACC. As you recall, the formula for WACC
38. is r
WACC
= E ÷ (E + D) r
E
+ D ÷ (E + D) r
D
(1 - T
C
).