Download as PDF, PPTX
![© M+W U.S., Inc. I July 2017 11
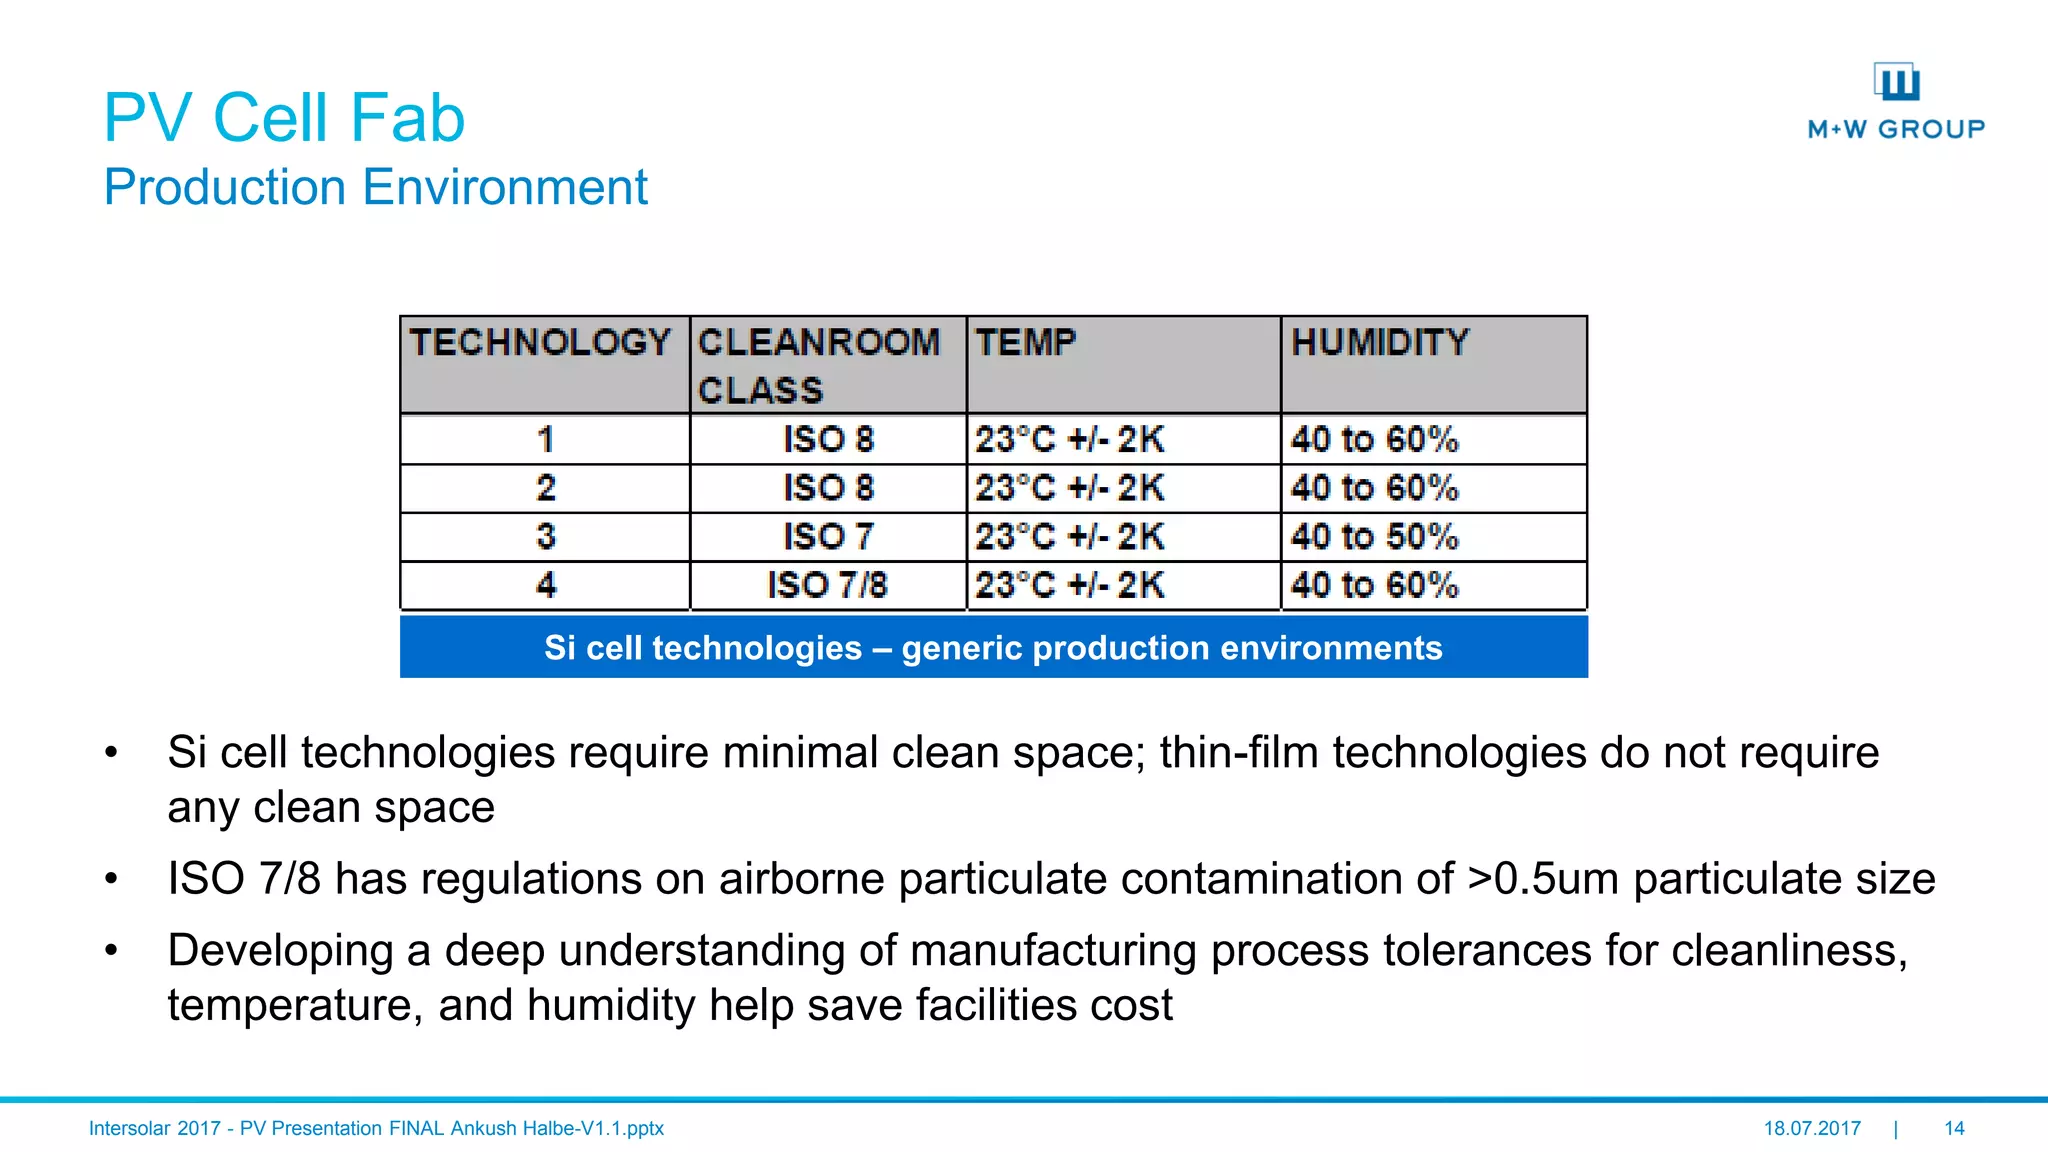
PV Cell Manufacturing
Sample Tool Utility Matrix
Utility consumption from process tools determines the type and capacity of facility systems for the
fab (e.g. for exhaust, abatement, water, bulk-gases, power, etc.)
Process
Category AF MF [kW] AF MF [kW] AF MF AF MF AF MF AF MF AF MF AF MF AF MF AF MF AF MF AF MF AF MF AF MF AF MF AF MF
Glass clean - substrate
20.00 230.00 0.5 1.0 2,500 2,500
3.0 3.0 12.2 0.50 2.00 15 50 2 10
0.50 2.00 10 30
3.0 3.0 12.2 2.00 500.00 0.50 2.00 15 50
15.80 80.00 20.00 230.00 0.5 1.0 2,500 2,500
3.0 3.0 12.2 0.50 2.00 15 50 2 10
0.50 2.00 10 30
3.0 3.0 12.2 2.00 500.00 0.50 2.00 15 50 2.00 500.00 2 10
Mo Sputter 12.0 12.0 41.8 1.00 3.00 50 250
400.00 400.00
18.5 18.5 107.4 1.00 3.00 20 80
12.0 12.0 41.8 1.00 3.00 50 250
11.0 11.0 63.9 1.00 3.00 20 80 600 600
P1-Laser 6 22 500 500
6 22 500 500
CIG Sputter 2.00 7.00 700.00 700.00 15 50 500 500
2.00 7.00 15 50 500 500
Selenization 12.00 12.00 41.8 28.00 40.00 50 80
12.00 12.00 41.8 28.00 40.00 0.06 0.12 50 80 1,000 1,000
0.06 0.12
CdS 1.00 1.00 24 70 n.a. n.a.
1.00 1.00 24 70 2.00 500.00 n.a. n.a.
1.50 1.50 28 82 2.00 500.00 n.a. n.a.
1.50 1.50 28 82 2.00 500.00 n.a. n.a.
Exhaust
PCW 1
[m3/h]
Liquids
IWD
[l/h]
Drain
CDA
Dew.P < -50°C
[Nm3/h]
SLA-D
[l/h]
Drain-OtherIndustrial Waste Drain
Electrical
CDA
Dew.P < -70°C
[Nm3/h]
NPS 220
[kVA]
General Exhaust
from Laser
N2
4.5
[Nm3/h]
Ar
5.0
[Nm3/h]
DI Water
< 10 µS/cm
[l/h]
Potable Water
[l/h]
General Exhaust
Bulkgases
GEEX
[Nm3/h]
H2S
5.0
[Nm3/h]
PCW 2
T in = 5°C (41°F)
[m3/h]
DEZ
5.0
[Nm3/h]
NPS 480
[kVA]
Laser-EX
[Nm3/h]](https://image.slidesharecdn.com/factoryinfrastructureforpvmanufacturing-170808082032/75/Factory-Infrastructure-for-PV-Manufacturing-11-2048.jpg)
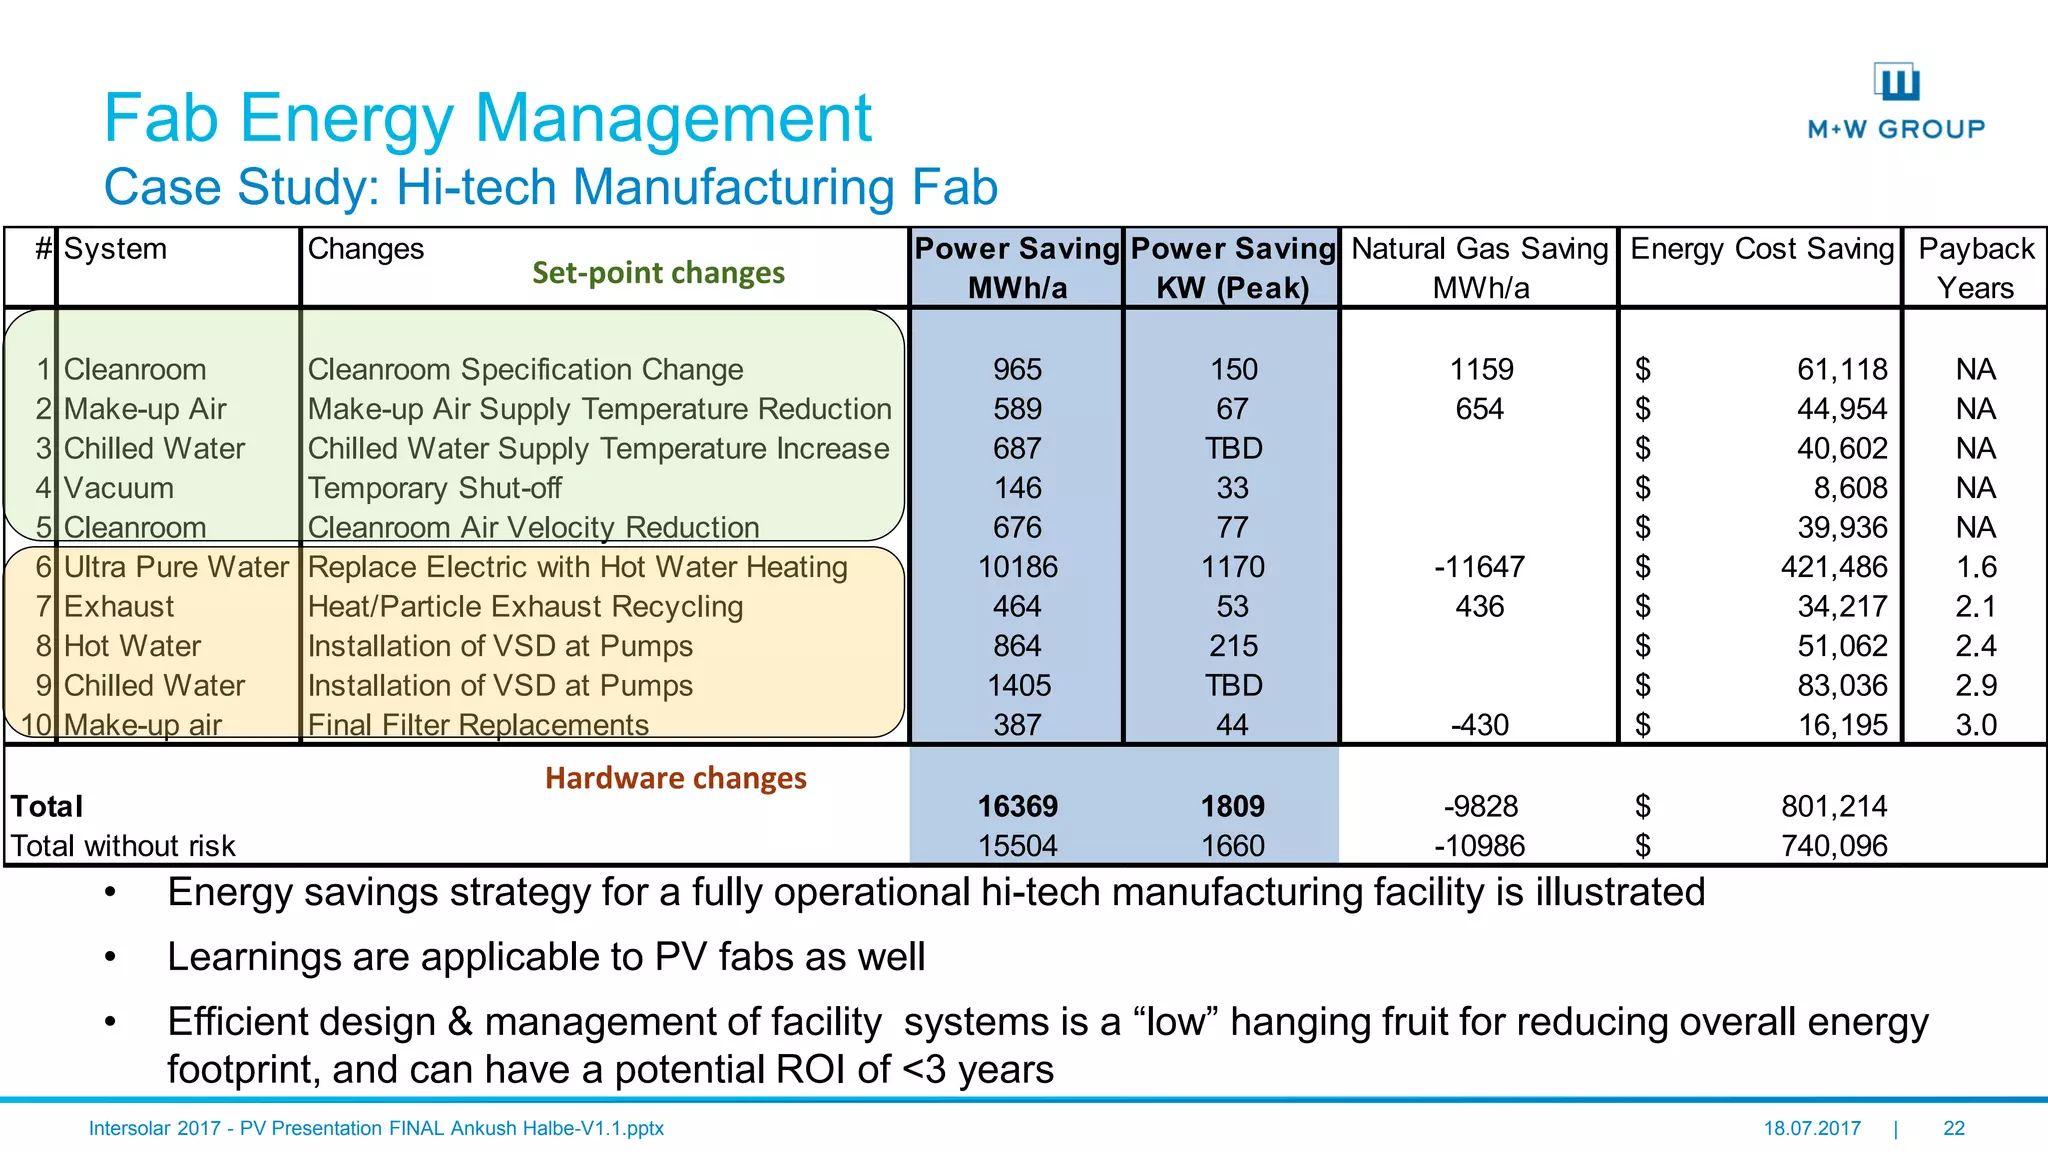
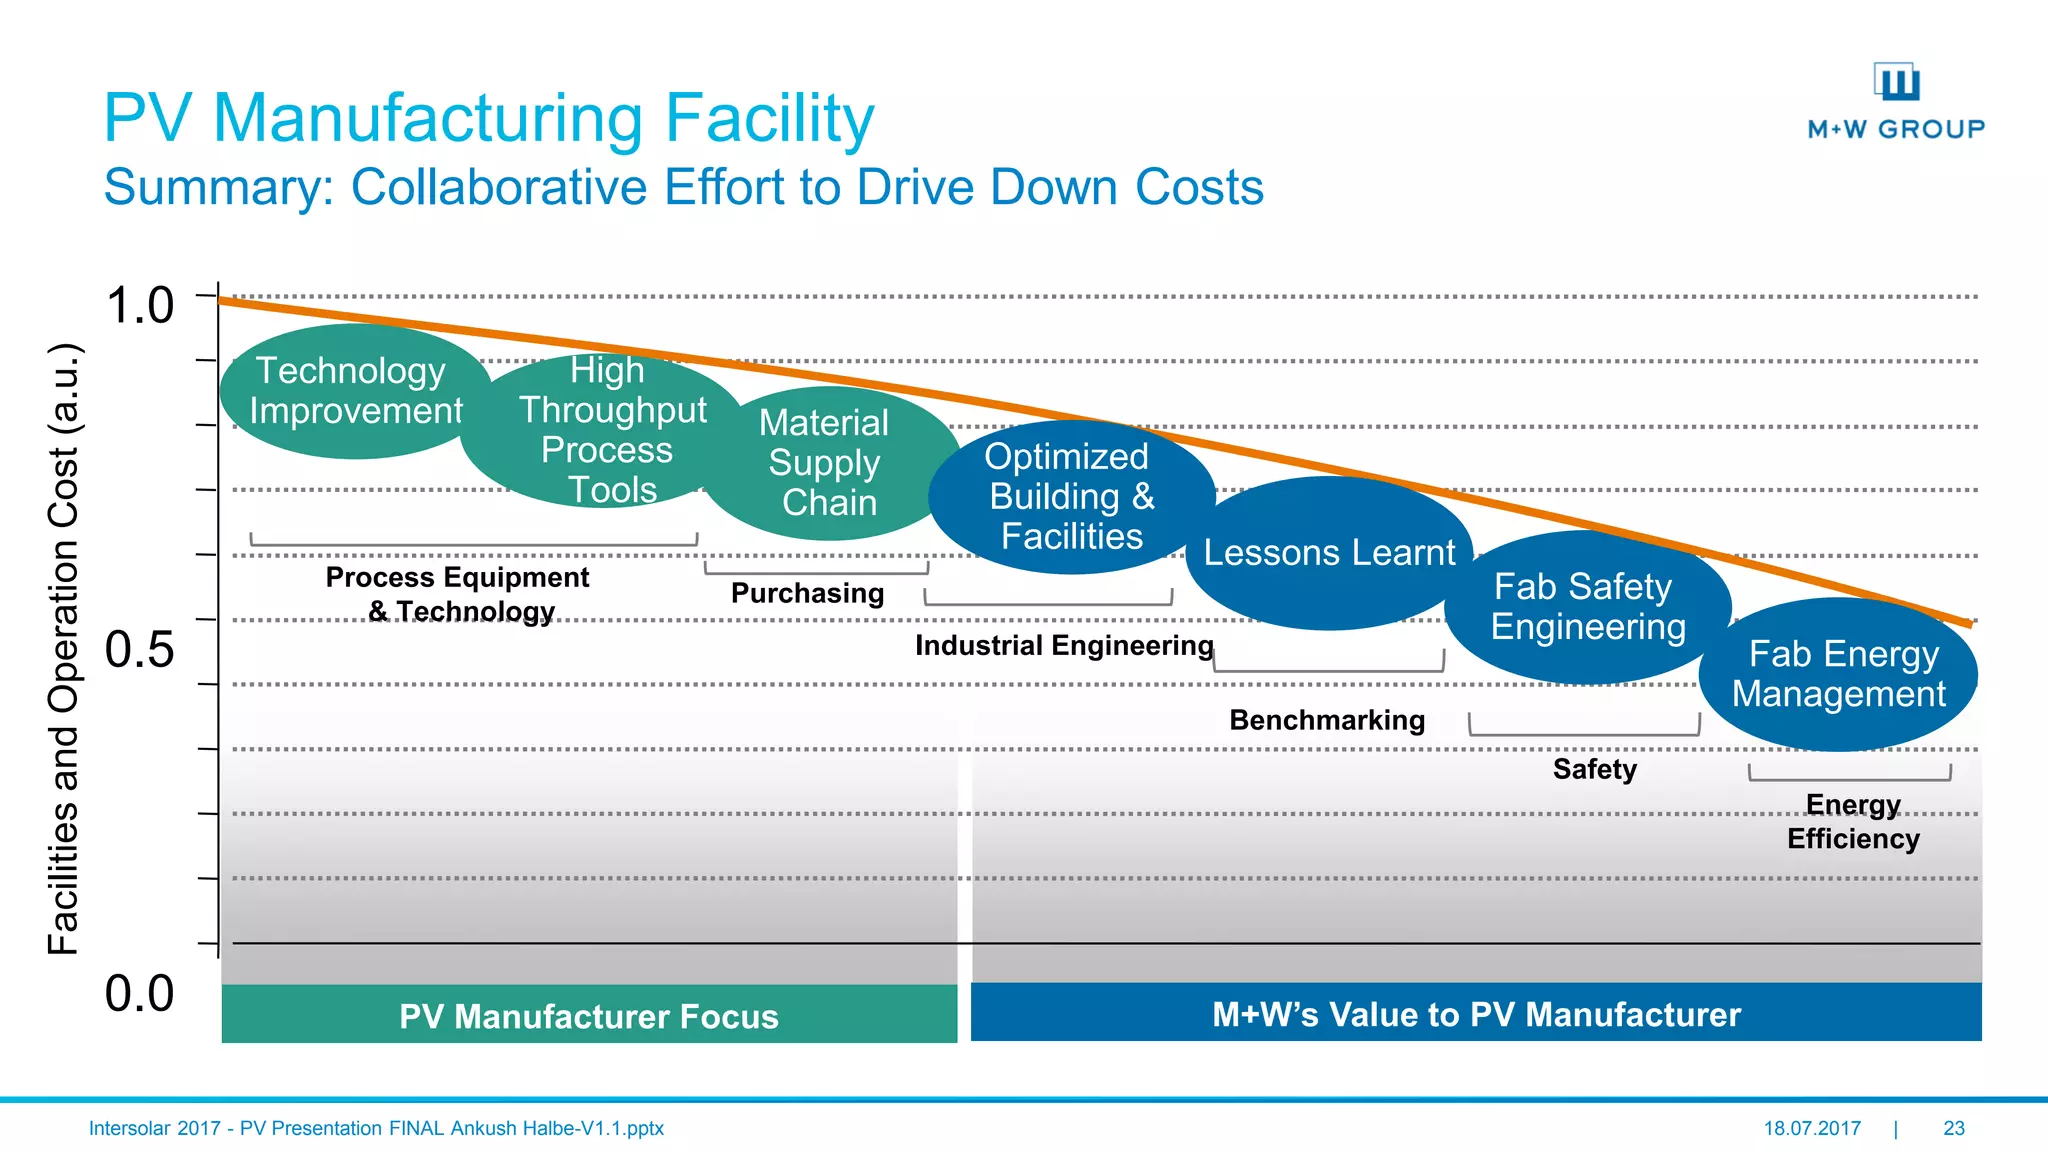

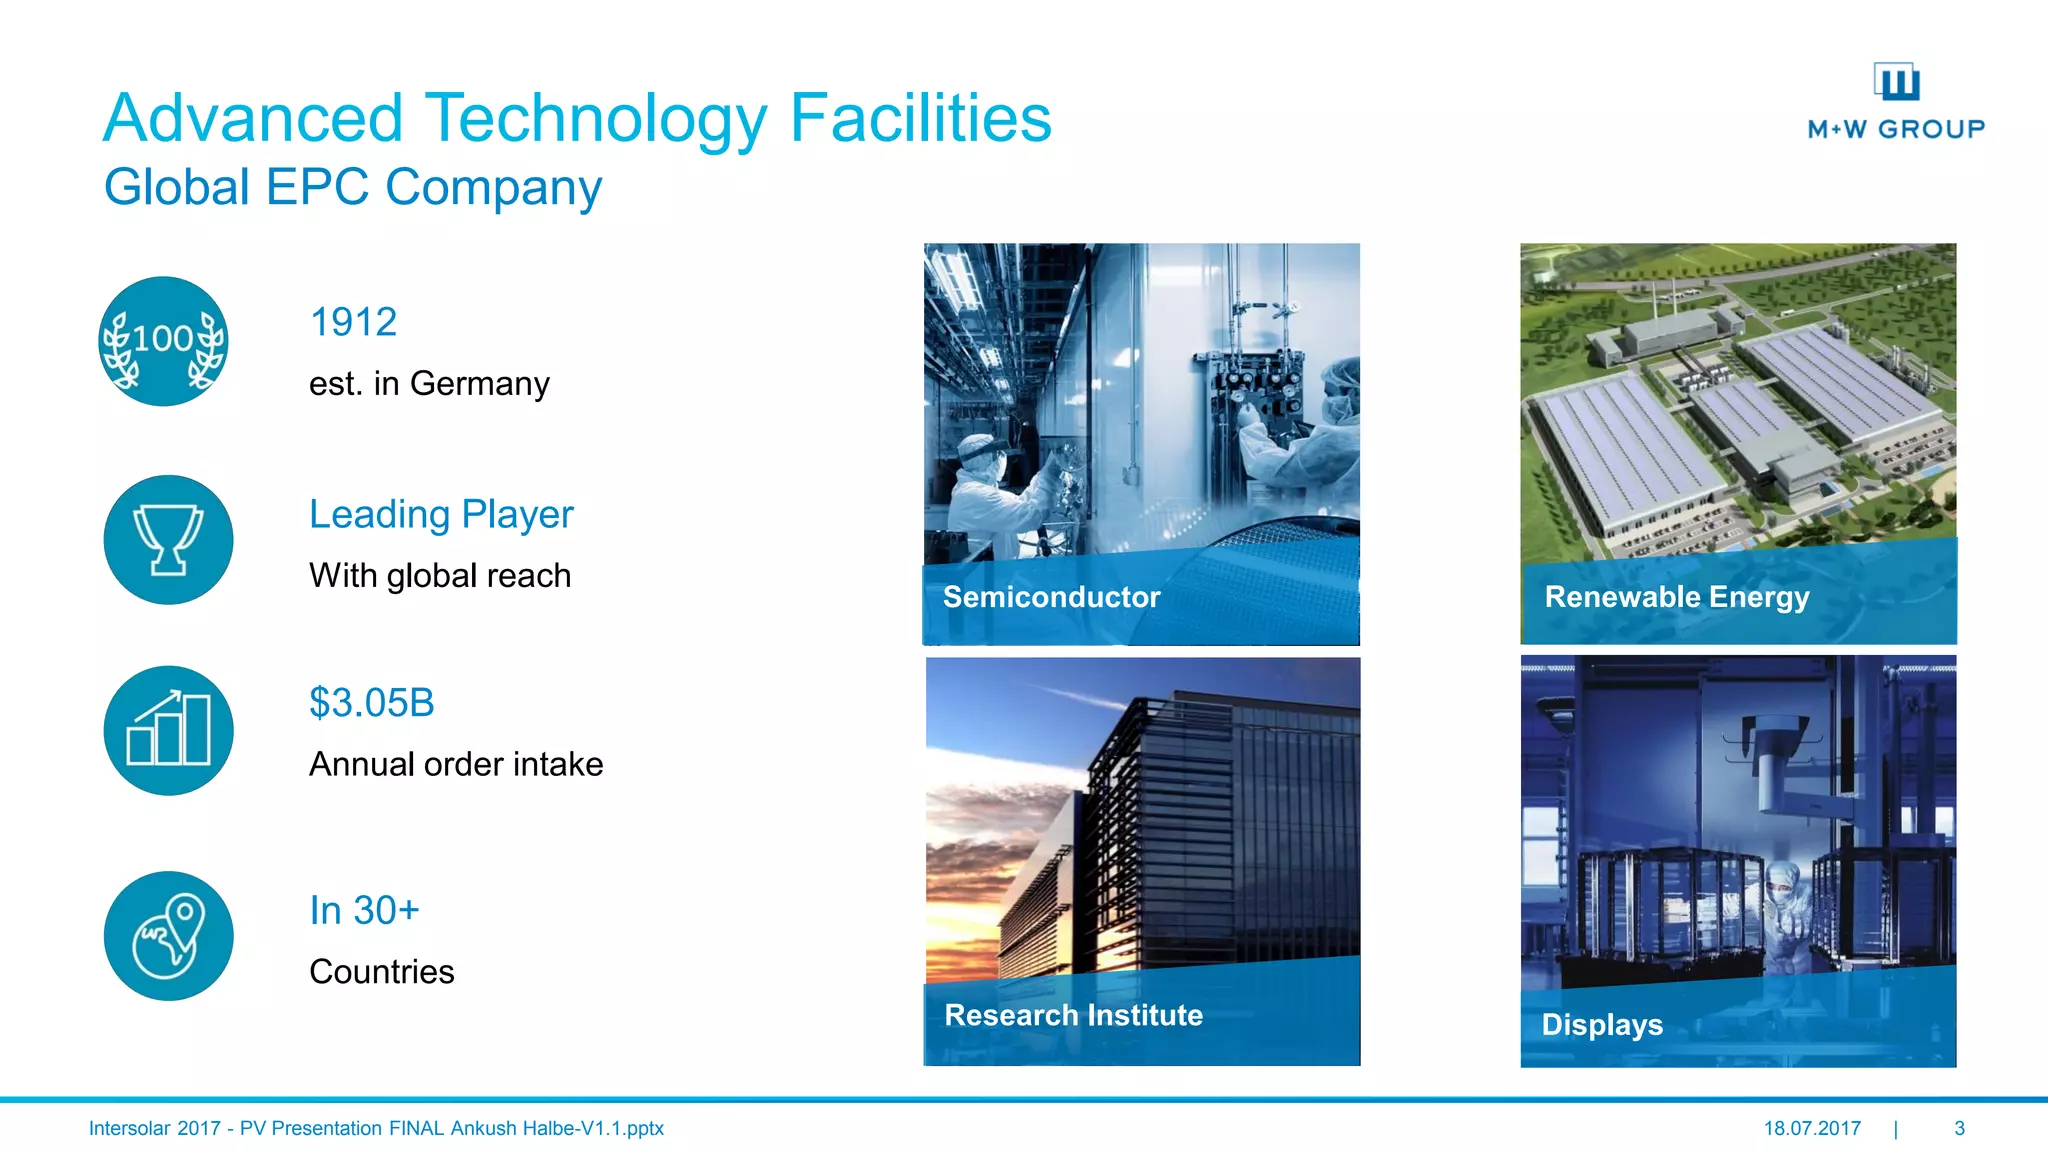
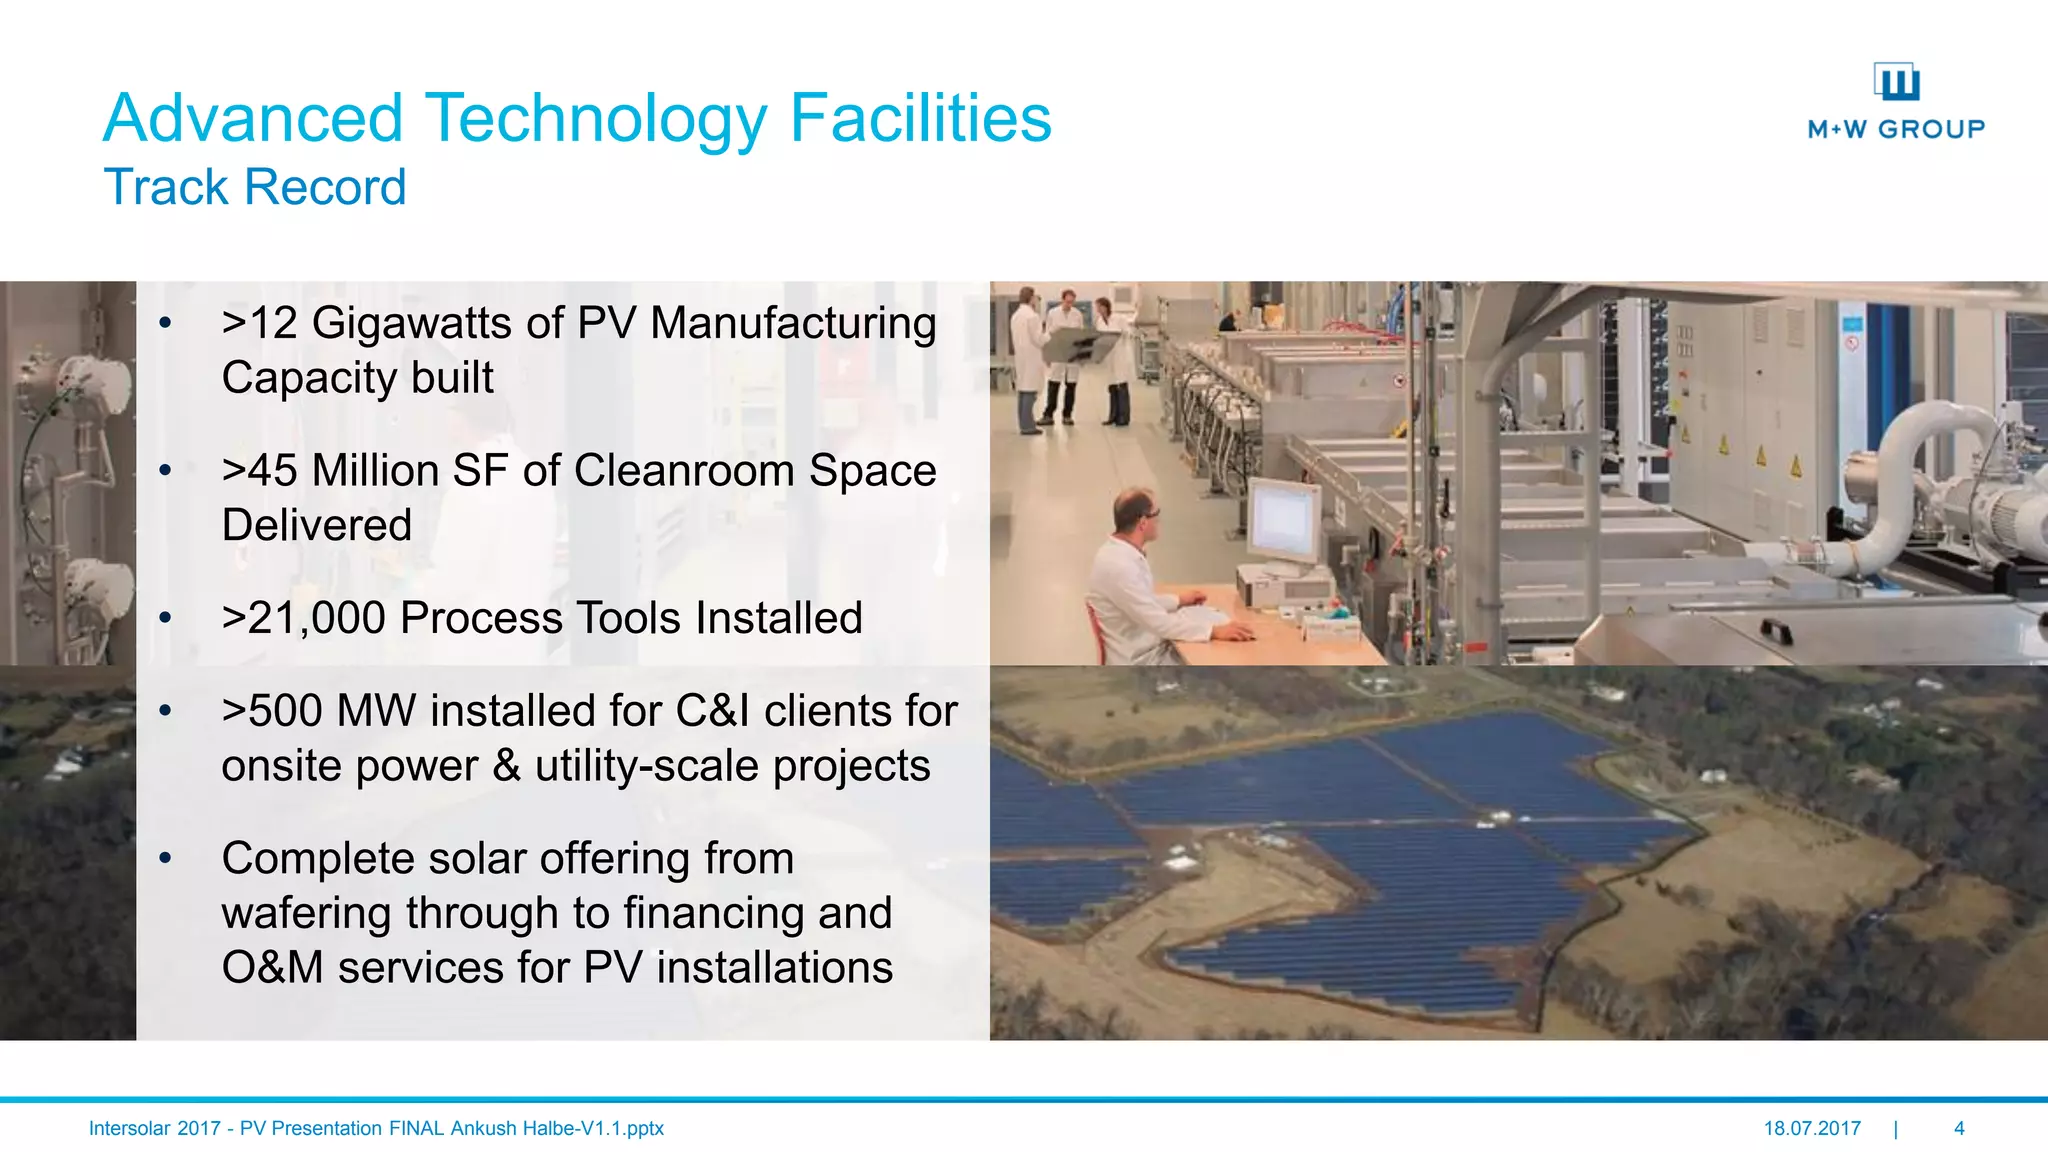
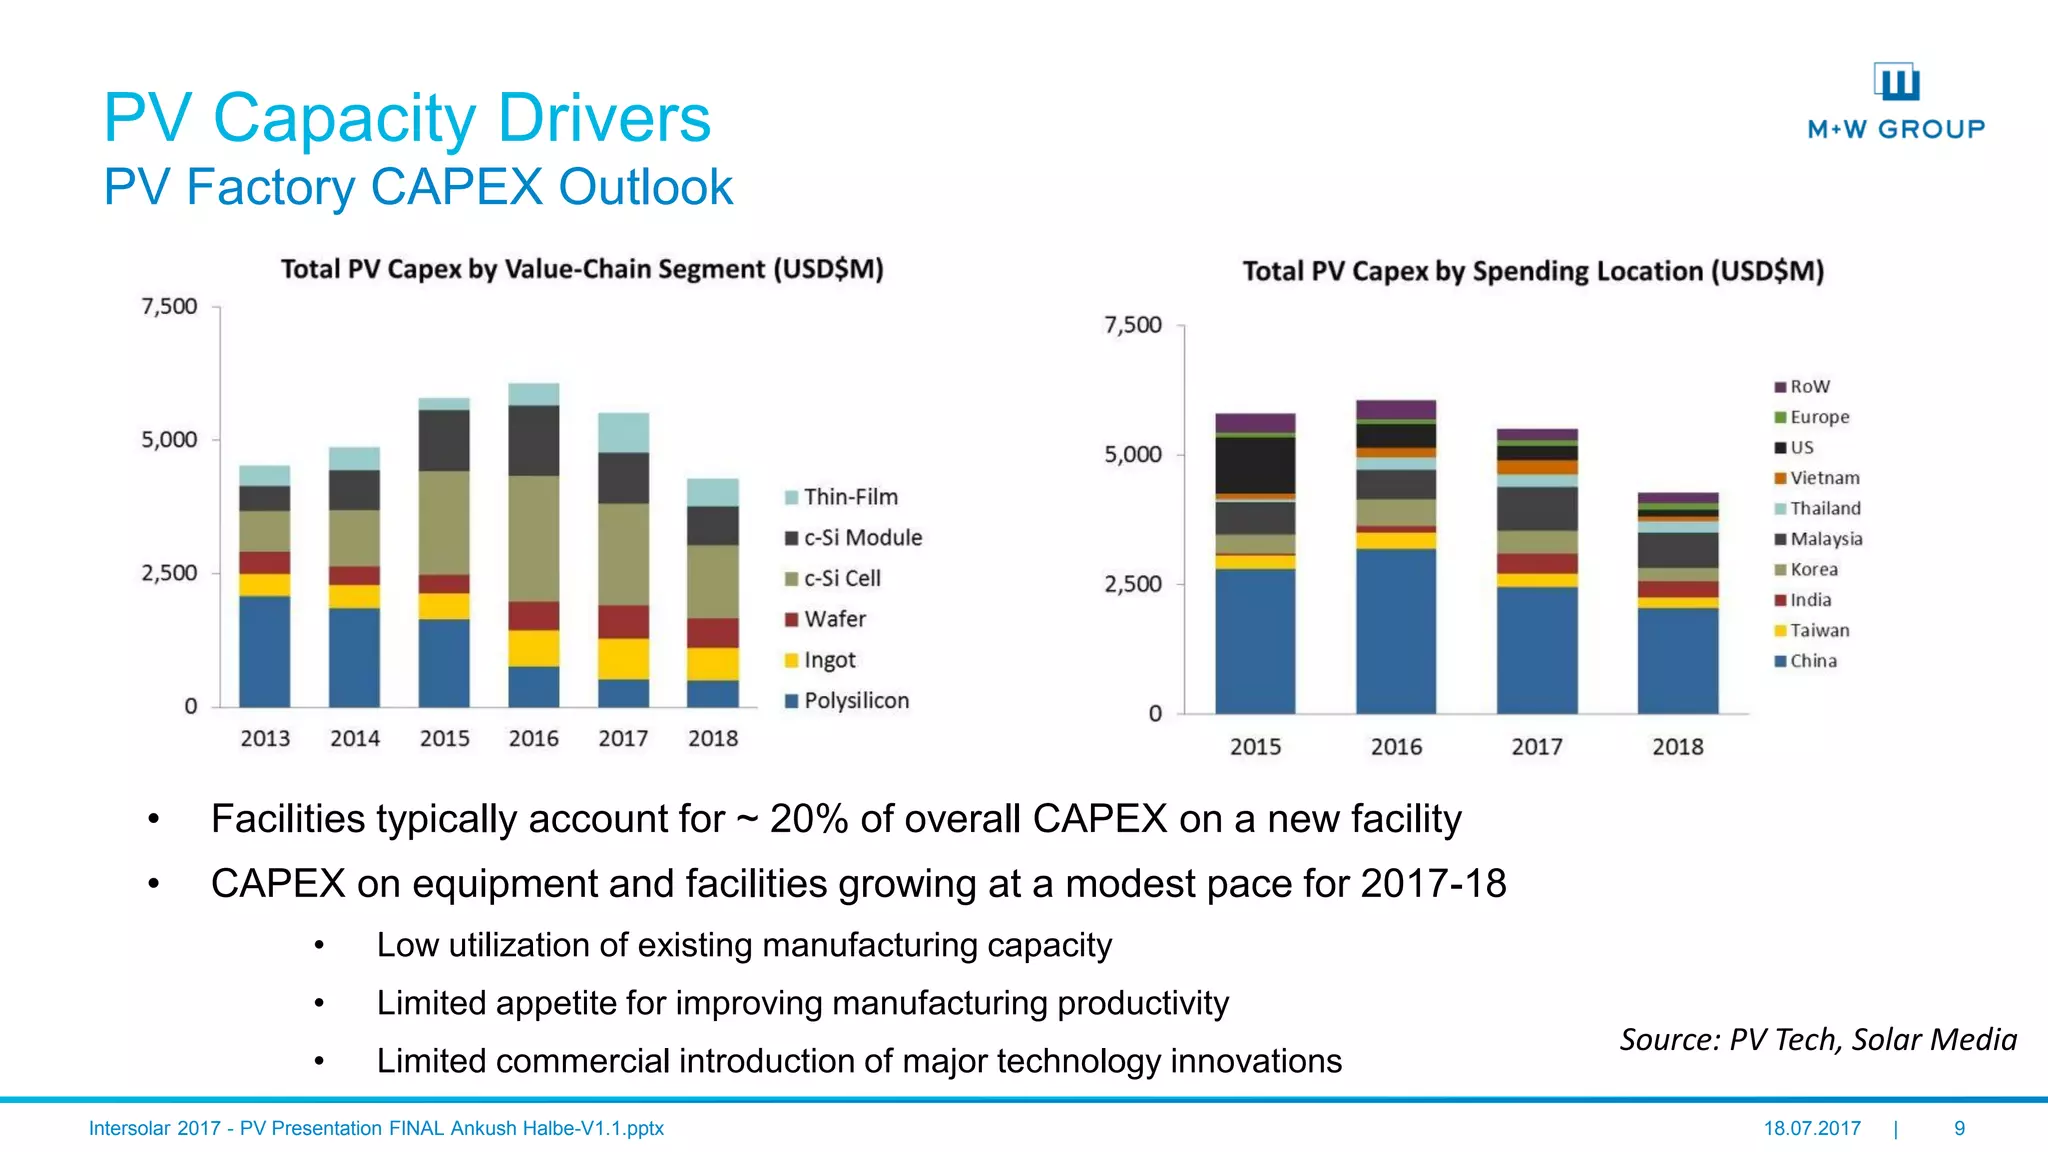
The document discusses the infrastructure and design considerations for photovoltaic (PV) manufacturing facilities, highlighting capacity drivers, environmental and safety considerations. It outlines M+W's extensive experience in building PV manufacturing capacity, their operational strategies, and a case study on energy management. The focus is on cost reduction, innovation in technology, and safety practices in PV manufacturing.


