Explore beautiful and ugly buildings. Mathematics helps us create beautiful d...
Langmiami
1. Center on Urban and Metropolitan Policy
Beyond Edge City:
Office Sprawl in
South Florida
“This analysis Robert E. Lang1
shows that South Findings
An analysis of office development in South Florida between 1987 and 2002 finds that:
Florida is per- s Of 13 large U.S. office markets In contrast, office space in Miami’s
studied, South Florida had the low- CBD increased just 4.7 percent over
est percentage of its office space this time period.
haps the most in its major downtown, Miami,
in 1999. Only 13 percent of South s Out of 13 office markets, South
Florida’s office space is located in its Florida has the largest percentage of
centerless large central business district (CBD), com- its office space located in “Edgeless
pared to a median of nearly 30 percent Cities”—a form of small-scale and
for all 13 markets. scattered office development that
office market never reaches the critical mass of an
s Virtually all office growth in Miami- Edge City. In 1999, two-thirds (66
Dade County in the past 15 years percent) of South Florida’s current
in the U.S.” occurred outside of Miami’s down- office space could be found in Edge-
town. From 1987 to 2002, Miami- less Cities. In Philadelphia—the only
Dade’s non-CBD market grew 60.3 other predominantly “edgeless” market
percent to include nearly 30 million of the 13—Edgeless Cities contain just
square feet of office space. 54 percent of the market’s office space.
I. Introduction 1999.2 While office buildings were the last
major element of central cities to suburbanize
he last 20 years brought a dramatic —following residences and retail establish-
T shift in the location of office employ-
ment in metropolitan America away
from central cities and into the sub-
urbs. The boom in suburban office
development occurred largely in the 1980s,
ments—by 1999, 42 percent of commercial
office space nationally was located in subur-
ban areas.3
The evolving geography of office location
has implications not only for the substantial
during which time over half (58 percent) of number of employees who go to work each
the suburban office space that exists today day in office buildings, but for the local lead-
was built. While the pace of office construc- ers who must grapple with the policy issues
tion slowed in the 1990s, the overall trend these new trends bring forth. For example,
toward suburbanization continued. In total, the dispersal of new office space can exacer-
almost four-fifths (79 percent) of the current bate a region’s jobs/housing mismatch, or
suburban stock was constructed from 1980 to widen the distance between economic oppor-
1
Cen March 2003 • The Brookings Institution • Survey Series
2. tunity and concentrations of minority three-county region that includes and Washington, D.C.9 It deploys sev-
households.4 Office location can also Miami-Dade, Broward, and Palm eral data sources to provide multiple
facilitate urban sprawl. If most new Beach counties. In essence, South perspectives on office space develop-
office space is constructed at the Florida really means—given the ment trends in both South Florida as a
regional edge, it extends commuter presence to the West of the Ever- whole, and in Miami-Dade County
sheds for many miles into undeveloped glades—Southeast Florida. And that specifically, and it compares the mar-
rural areas and fuels decentralization.5 encompasses Miami-Dade County and kets to the national sample of 13. In
Finally, the geography of office location Broward County—which together this fashion, the study first explores
figures prominently in transportation comprise the Miami-Fort Lauderdale differences in the distribution of cen-
analysis. If most new space is built Consolidated Metropolitan Statistical tral business district (CBD) and
in areas with no public transit access, Area (CMSA)—plus the separate MSA non-CBD office space. Then, it devel-
then reliance on automobiles will of Palm Beach County. ops a new, more specific,
continue to grow.6 All of South Florida has experienced categorization that segments the office
The distribution of urban and subur- rapid expansion for decades and con- space market into a downtown seg-
ban office space—and hence the tinues this fast population growth. ment, an Edge City segment, and one
appropriate policy responses to it—is Most of the building has taken place in that encompasses Edgeless Cities.
not uniform across all regions, how- the past half century, making it, along (See the appendix for more detail on
ever. The majority of office space in with such other Sunbelt boom metrop- data and sources.)
the Chicago and New York metropoli- olises as Phoenix and Las Vegas, one of
tan areas, for example, lies within their the newest places in America. CBD versus Non-CBD
respective core central cities, while The western parts of all three South Office Space
the suburbs boast a larger share in Florida counties developed later than The standard business categories for
Philadelphia and Detroit. This study those further east. That is because reporting office data are CBD and
seeks to provide a better understanding these western lands were once part of non-CBD. CBD space refers to down-
of the spatial structure of office the Everglades, which until recently town office buildings. Downtowns vary
development in one region—South covered most of Florida’s southern tip. in size and scale, but they typically
Florida—and how it compares with The newly developed parts of South contain the largest single concentra-
development patterns in metropolitan Florida include the western parts of tion of a region’s office space.10 In
areas around the nation. It concludes Broward and Palm Beach counties South Florida, that location is down-
with a discussion of how leaders in this that press up against the remaining town Miami.
region can address the policy concerns Everglades. Due to a federally man- Non-CBD office space is everything
that arise from the report’s findings. dated urban growth boundary, this else. Much of this non-CDB space lies
western expansion has now ended. in suburbs, although some offices may
II. South Florida Much of the region is now built out, be found within the central city out-
with some of the last new greenfield side the CBD. Non-CBD office space
nown for it beaches, tourist subdivisions popping up this past year varies tremendously in its size, scale,
K attractions, and retirees,
South Florida has grown into
a complicated multicultural
community with a major presence in
the international economy. 7 South
in Broward County. A regional plan-
ning movement has emerged around
the idea of encouraging new growth to
stay to the east—hence its name,
“Eastward Ho!”
density, location, age, and land use
characteristics. The category in this
sense captures every office location
type from low-rise, low-density office
buildings in the farthest reaches of the
Florida differs substantially from the exurbs to high-density “uptowns” that
northern parts of the state in that it is III. Definitions and arose as secondary business districts
culturally and demographically not Methodology within the central city. “Non-CBD” is
part of the American South.8 The thus a grab-bag category that captures
region has been settled by two major his report employs a unique all office space outside a CBD.
outside groups. The first group con-
sists of domestic immigrants from the
North, especially the New York region.
The other includes international immi-
grants from Latin America,
T method for classifying office
location that is based on a
study of 13 large metropolitan
office markets: Atlanta, Boston,
Chicago, Dallas, Detroit, Denver,
Cushman and Wakefield, the
nation’s largest full-service real estate
firm, tracks office development in
Miami-Dade County using the
CBD/non-CBD divide.11 This study
predominantly Cuba. Houston, Los Angeles, Miami, New uses the Cushman and Wakefield data
Geographically, South Florida is a York City, Philadelphia, San Francisco, to examine changes in the Miami-
2 March 2003 • The Brookings Inst itution • Survey Series CE N T E R ON UR B A N AND M E T R O P O L I TA N P O L I C Y
3. Dade market from 1987 to 2002. The
period of analysis captures a market Map 1. Miami Is a Downtown
peak in 1987 (a 1986 change in tax
laws, which eliminated the passive loss
provision, dampened much of the
financial fuel for the office boom), a
bust in the early 1990s, a recovery in
the mid-1990s, and a leveling-off
period in the early 2000s.
Downtowns, Edge Cities, and
Edgeless Cities
The complexity of commercial real
estate marketplaces, however, ensures
that the broad categories of CBD and
non-CBD do not permit analysis that
accurately reflects the shifts occur-
ring in metropolitan regions. For that
reason, this report conducts a finer- = one building
grained analysis that utilizes a new
categorization: downtown, Edge
Cities, and Edgeless Cities. Four Source: Black’s Guide
maps that accompany this section,
taken from Black’s Guide (a leading
resource in the commercial real
estate industry), illustrate the differ- Map 2. Ft. Lauderdale Is a Secondary Downtown
ences in office space concentration
that distinguish the various types of
office locale.
Downtowns lie at the center of the
region and are often the original site of
significant commercial development.
There are also “secondary downtowns,”
which often originated in the early 20th
century as satellite downtowns of the
primary downtown.12 In South Florida,
Miami is the primary downtown and
Fort Lauderdale a secondary one. (See
Maps 1 and 2.)
Edge Cities have a specific defini-
tion that appears in the literature on
suburban office development. Joel
Garreau first used the term “Edge
City” in his 1991 book Edge City: Life
on the New Frontier. Edge Cities as
defined by Garreau are places that
have the following characteristics:
• Five million square feet or more of = one building
office space
• 600,000 square feet or more of retail
space Source: Black’s Guide
• More jobs than bedrooms
C ENTER ON U RBAN AND M ETROPOLITAN P OLICY March 2003 • The Brookings Institution • Survey Series 3
4. • Are perceived by the population as
one place Map 3. Miami Airport Is an Edge City
• Were nothing like a “city” as recently
as thirty years ago13
This study deems any contiguous
concentration of office space that
exceeds five million square feet and is
less than 30 years old an Edge City.
Edge Cities, in practice, are sizable
office and retail concentrations that
sprang up in the 1970s and 1980s in
such locales as Tysons Corner (Fairfax,
VA), Post Oak (Houston, TX), and
Perimeter Center (Atlanta, GA). But
there is no requirement that these
office clusters contain significant
retail space. The developments around
Miami International Airport and Boca
Raton are the region’s only major Edge
Cities. (See Map 3.)
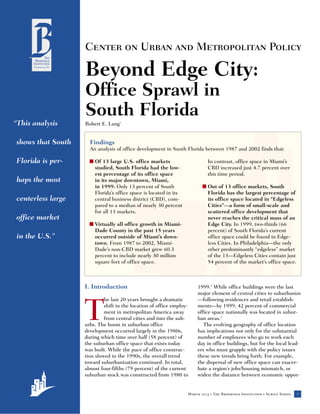
The report also employs another
non-CBD office location category—
the Edgeless City.14 Edgeless Cities, as
the term implies, lack a well-defined
boundary or edge. Edgeless Cities
extend over dozens of square miles of
urban space. Individual components of
Edgeless Cities often have an identity
(as “so-and-so” office park), but collec-
tively these places seldom strike a
casual observer as unified in any
meaningful way. Thus, unlike Edge
Cities, Edgeless Cities are not per-
ceived as one place. In effect, the term
“Edgeless City” refers to office sprawl.
Edgeless Cities capture all non-down-
town space that is not in an Edge City.
They scatter far and wide around the
region—some sweep around the met-
ropolitan edge, while others fill the
= one building
gaps between Edge Cities. In South
Florida, much of northern Broward
County constitutes an extended Edge- Source: Black’s Guide
less City, especially around Coconut
Creek. (See Map 4.)
This analysis uses 1999 data from IV. Findings In absolute square footage of office
Black’s Guide to describe downtown, space, Miami’s downtown is the small-
Edge City, and Edgeless City office A. Of 13 large U.S. office markets est primary downtown among the 13
development in the three counties that studied, South Florida had the low- downtowns compared in this study, and
comprise South Florida. est percentage of its office space Fort Lauderdale is the second smallest
located in its primary downtown, secondary downtown. In fact, at only
Miami, in 1999. 12.7 million square feet, downtown
4 March 2003 • The Brookings Institution • Survey Series C ENTER ON U RBAN AND M ETROPOLITAN P OLICY
5. In terms of office space per capita,
Map 4. Coconut Creek Is an Edgeless City South Florida compares fairly well,
coming in just below the median. But
compared to the other 13 metropolitan
regions, South Florida has the largest
disparity between its quantity of CBD
and non-CBD office space.
B. Virtually all office growth in
Miami-Dade County in the past 15
years has occurred outside of
Miami’s downtown.
In 1987, Miami’s CBD had 11.1
million square feet of office space
available and a 28 percent vacancy
rate. (See Table 2.) Fifteen years later,
Miami’s CBD had increased just 4.7
percent to include 11.7 million square
feet of available office space. At the
same time, however, the vacancy rate
fell 41.4 percent to 16.4 percent.
While very little office space was built
in Miami’s CBD, vacancy rates fell as
= one building businesses moved into already existing
office buildings. In other cases, busi-
nesses upgraded their space, moving
into new structures as their vacated
offices were phased out of the market.
The figures for non-CBD office
space in the past 15 years tell a very
different story. In 1987, Miami-Dade’s
non-CBD market had 18.2 million
square feet of office space available
and a 22.6 percent vacancy rate. By
2002, this market had grown 60.3 per-
cent to include nearly 30 million
square feet of office space, while
vacancy rates had dropped 17.7 per-
cent to 18.6 percent. Thus, the vast
majority of Miami-Dade’s office growth
Source: Black’s Guide over the last decade and a half
occurred in the non-CBD markets. The
disparity in growth rates between CBD
Miami has less office space than the largest regional shares of office space and non-CBD office space explains the
top dozen of the nation’s Edge Cities.15 in their downtowns, while the percent- considerable decrease in the overall
Not surprisingly, South Florida also age of downtown space in Dallas and share of CBD office space in the metro
has the smallest share of all office Detroit is very small (21 percent area during this time period.
space in its metro area located in its each). South Florida (13 percent) has Parallel to trends over the past 15
downtown. Table 1 shows the typology the smallest CBD relative to its metro- years, the 1997 to 2002 data shows
of metro areas by office space distribu- politan area market. Note that the office space growth in Miami-Dade’s
tion, using Black’s Guide data for total share of non-CBD office space in non-CBD market continuing to out-
1999. New York (57 percent) and the 13 metros exceeds that in the met- pace growth in the downtown. Table 3
Chicago (54 percent) maintain the ros’ CBDs by a factor of 70 to 30. provides a more fine-grained view of
C ENTER ON U RBAN AND M ETROPOLITAN P OLICY March 2003 • The Brookings Institution • Survey Series 5
6. Table 1. Typology of Metropolitan Areas by Office Space Distribution, 1999
Ranked by Share of Metro Areas’ Office Space in the CBD
Office Space
Office Space MSF Metro Share in: Per Capita
Metropolitan Area CBD non-CBD Total CBD non-CBD (square feet)
Majority of Office Space in CBD
New York 390.1 298.2 688.4 56.7 43.3 34.2
Chicago 134.3 114.8 249.1 53.9 46.1 28.3
Above a Quarter of Office Space in CBD
Boston 56.7 94.7 151.4 37.5 62.5 26.9
Philadelphia 54.8 105.3 160.1 34.2 65.8 26.7
San Francisco 60.1 117.2 177.3 33.9 66.1 26.0
Denver 23.5 53.8 77.3 30.4 69.6 32.7
Los Angeles 44.8 240.1 284.9 29.8 84.3 18.1
Washington 79.8 199.4 279.2 28.6 71.4 59.7
Below a Quarter of Office Space in CBD
Atlanta 31.1 101.1 132.2 23.5 76.5 35.3
Houston 38.0 127.1 165.1 23.0 77.0 37.5
Detroit 16.8 61.9 78.7 21.3 78.7 14.4
Dallas 30.6 118.4 149.0 20.5 79.5 31.0
South Florida 12.7 84.2 96.9 13.1 86.9 26.5
Total for all Markets 973.3 1,716.2 2,689.6 31.0 69.0 29.2
Median 44.8 114.8 29.8 71.4 28.3
Note: Manhattan data is from Cushman and Wakefield Research and the Real Estate Board of New York
MSF = millions of square feet
Sources: Black’s Guide and the U.S. Bureau of the Census Metropolitan Area Population Estimates, 1998 (MA-98-1)
Table 2. Miami-Dade Office Inventory, CBD versus Non-CBD, 1987 to 2002
1987 Office Space 2002 Office Space Percent
Market MSF MSF Change in Inventory
CBD 11.1 11.7 4.7
Non-CBD 18.2 29.2 60.3
CDB Share of Total Office Space 37.9% 28.6%
1987 Percent 2002 Percent Percent
Market Vacancy Rate Vacancy Rate Change in Vacancy
CBD 28.0 16.4 -41.4
Non-CBD 22.6 18.6 -17.7
Note: MSF = Millions of Square Feet
Source: Cushman and Wakefield
changes in Miami’s CBD and non- market, which lies just south of the Changes in Miami-Dade’s non-CBD
CBD submarkets during this period, Miami River from downtown, gained submarkets are more complicated.
however. Interestingly, a part of over a half million square feet since Overall they grew by over 27 percent,
Miami’s CBD actually grew 1997. By contrast, downtown barely but many submarkets are far off from
respectably—the Brickell Avenue sub- registered any growth. the cumulative rate. In fact, the Coral
6 March 2003 • The Brookings Institution • Survey Series C ENTER ON U RBAN AND M ETROPOLITAN P OLICY
7. Table 3. Miami-Dade Office Inventory, CBD versus Non-CBD Submarkets, 1997 to 2002
Market/Submarket 1997 Office Space 2002 Office Space Change Percent Change
CBD 11,092,272 11,645,736 553,464 5.0
Brickell Avenue 4,684,711 5,222,497 537,786 11.5
Downtown 6,407,561 6,423,239 15,678 0.2
Non-CBD 22,922,594 29,161,476 6,238,882 27.2
Coral Gables 3,856,022 4,781,169 925,147 24.0
Airport/West Dade 7,037,169 9,877,507 2,840,338 40.4
Coral Way 586,070 580,711 -5,359 -0.9
Kendall/South Dade 2,846,147 3,986,627 1,140,480 40.1
Northeast Dade 1,710,785 1,887,235 176,450 10.3
Biscayne Corridor 1,571,473 1,623,932 52,459 3.3
Miami Lakes 1,234,496 1,454,100 219,604 17.8
Coconut Grove 961,110 860,572 -100,538 -10.5
South Miami 1,318,445 1,410,224 91,779 7.0
East Airport 910,217 1,002,500 92,283 10.1
Miami Beach 827,660 1,696,899 869,239 105.0
Total 34,014,866 40,807,212 6,792,346 20.0
Source: Cushman and Wakefield
Table 4. South Florida: Downtowns, Edge Cities and Edgeless Cities, Pre-1980 to 1999
By Year Built
Total Office Space 1999 1990–1999 1980–1989 Pre-1980
Square SF % of Square SF % of Square SF % of Square SF % of
Footage Metro Area Footage Metro Area Footage Metro Area Footage Metro Area
Downtown 17,053,213 17.6% 3,542,330 15.5% 8,837,543 16.0% 4,673,340 24.8%
Miami 12,678,884 13.1% 1,451,558 6.4% 6,887,664 12.5% 4,339,662 23.0%
Fort Lauderdale 4,374,329 4.5% 2,090,772 9.2% 1,949,879 3.5% 333,678 1.8%
Edge Cities 16,077,609 16.6% 5,658,359 24.8% 9,253,906 16.8% 1,165,344 6.2%
Boca Raton 6,870,513 7.1% 2,757,411 12.1% 3,653,398 6.6% 459,704 2.4%
Miami Airport 9,207,096 9.5% 2,900,948 12.7% 5,600,508 10.1% 705,640 3.7%
Edgeless Cities 63,774,416 65.8% 13,625,873 59.7% 37,148,553 67.2% 12,999,990 69.0%
TOTAL 96,905,238 100% 22,826,562 100% 55,240,002 100% 18,838,674 100%
Source: Black’s Guide
Way and Coconut Grove submarkets C. Out of 13 office markets, South in Edgeless Cities. The two down-
actually lost some office space—0.9 Florida has the largest percentage of towns accounted for 15.5 percent, and
percent and 10.5 percent, respectively. its office space located in Edgeless the Edge Cities for one-quarter of the
The Biscayne Corridor, South Miami, Cities. inventory (24.8 percent). This growth
and East Airport submarkets only Table 4 shows the percentage of office was in fact small relative to the boom
faired slightly better with modest space in South Florida using the cate- of the 1980s, during which 55 million
gains, but the Kendall/South Dade and gories of Downtown, Edge Cities, and square feet of office space—over half
Miami Beach submarkets boomed, Edgeless Cities. It indicates that of the of the South Florida’s total in 1999—
with gains of 40 and 105 percent, nearly 23 million square feet of office was constructed, 67.2 percent within
respectively. space added in South Florida in the Edgeless Cities.
1990s, almost 60 percent was located By 1999, two-thirds (66 percent) of
C ENTER ON U RBAN AND M ETROPOLITAN P OLICY March 2003 • The Brookings Institution • Survey Series 7
8. Table 5. Typology of Metropolitan Areas, Core versus Edgeless Office Space, 1999
% Office Space % Office Space % Difference Between
in Primary in Secondary % Office Space % Office Space Primary Downtowns
Metropolitan Area Downtown Downtown in Edge Cities in Edgeless Cities and Edgeless Cities
Core Dominated
Chicago 53.9 19.5 26.6 27.3
New York 56.7 7.2 6.2 29.9 26.8
Balanced
Boston 37.4 4.6 18.8 39.2 -1.8
Washington 28.6 12.5 27.1 31.8 -3.2
Denver 30.4 4.2 29.4 35.9 -5.5
Los Angeles 29.8 7.8 25.4 37.0 -7.2
San Francisco 33.9 8.8 13.9 43.4 -9.5
Dispersed
Dallas 20.5 4.5 40.3 34.6 -14.1
Houson 23.0 37.9 39.1 -16.1
Atlanta 23.6 9.9 25.3 41.2 -17.6
Detroit 21.3 39.5 39.2 -17.9
Edgeless
Philadelphia 34.2 3.2 8.9 53.6 -19.4
South Florida 13.1 4.5 16.6 65.8 -52.7
Source: Black’s Guide
South Florida’s current office space Table 4.) This indicates that Miami Environmental/Land Use
could be found in Edgeless Cities. The may have reached its limits of edge- There is a possible link between Edge-
rest was about evenly split between lessness, and that as the region shifts less City expansion and lower density
downtown (18 percent) and Edge City from greenfield to infill development, development or urban sprawl—espe-
(17 percent) space. In fact, in 1999 bigger centers are finally emerging. cially in Eastern-U.S. metropolitan
South Florida was the most edgeless areas.17 To the extent urban space
metropolis of the 13 regions studied, V. Policy Implications of sprawls into habitat areas, it increases
standing in sharp contrast to core- Office Sprawl in South the scale of environmental impact. In
dominated areas like Chicago and Florida South Florida edgeless expansion has
New York, where Edgeless office space resulted in the loss of thousands of
makes up less than 30 percent of the o what does all this office data acres of Everglades. South Florida
area total. (See Table 5.) No other
region—even those with relatively dis-
persed patterns of office
development—comes close to the per-
centage of office space South Florida
S mean for public policymakers
in South Florida? The policy
relevance of these findings is so
broad that a full exploration lies beyond
the scope of this report. However, a
faces water quality issues as the result
of the loss.18 On the positive side, this
edgeless expansion finally has reached
an edge that was mandated by the fed-
eral government.
maintains in its Edgeless Cities. number of general ramifications associ-
The good news is that the tide in ated with the dominance of the Public Transportation
South Florida may be shifting some- Edgeless City pattern of office growth When it comes to public transit oppor-
what. While Edgeless Cities continue in South Florida cannot be ignored. tunities, Edgeless Cities fall far short
to dominate South Florida’s office The list below hardly exhausts the pos- of even Edge Cities. One can imagine
market, they lost some ground in the sible impacts of Edgeless Cities, but it that a dense, maturing Edge City
1990s to South Florida’s two Edge does include many of the major issues could be well integrated into a bus or
Cities at the Miami Airport and Boca that have been at the center of South even light rail transit system. And they
Raton, and to Fort Lauderdale’s Florida’s public policy debate over have been in certain cases.19 But Edge-
recently revitalized downtown. (See sprawl.16 less Cities provide no such prospect.
8 March 2003 • The Brookings Institution • Survey Series C ENTER ON U RBAN AND M ETROPOLITAN P OLICY
9. As the percentage of regional office Public Costs improve the distribution of the tax base
space located in Edgeless Cities rises, Office development has costs as well across a region (even though they may
the percentage of people that can as benefits. Given that Edgeless Cities also increase traffic some and require
commute by mass transit drops. One are by their very nature centerless, the additional infrastructure). Even so,
could argue that while some public costs in roads and other infrastructure though, regional revenue sharing
transportation systems exist in South may be higher than if such develop- would likely prove a better method of
Florida, they have little benefit to most ment were concentrated.25 These distributing tax resources among
South Floridians who commute from higher costs are often borne at all lev- municipalities than having office devel-
one suburb to another. Operating pub- els of government. Many localities opment sprawl. According to Myron
lic transportation between suburbs is hesitate to charge impact fees to office Orfield’s analysis, much of Broward
too inefficient and costly. Even “para- developments because they are such a County lost fiscal capacity as measured
transit” service to most of these places high ratable. However, some regions, on a per capita basis from 1993 to
is at best difficult. such as the Bay Area, where job 1998.28 This is because population
growth has far outpaced housing growth outpaced new ratables. The
Private Transportation development, are more resistant to expansion of Edgeless Cities in such
As the percentage of regional office new office development.26 Florida, a places could improve this capacity.
space in Edgeless Cities expands, state with no income tax, relies heavily
reliance on automobiles for work com- on local taxes. Additionally, unlike San VI. Conclusion
mutes grows, as does commuting Francisco, South Florida has been
distance. As edgeless office space adding houses and jobs in more equal his analysis shows that South
grows, vehicle miles traveled (VMT)
increase.20 In a study done by the Sur-
face Transportation Policy Project in
2000, South Florida ranked fourth in
the nation among the regions with the
proportion and hence has less incen-
tive to resist new office development.
Fiscal Equity
Because most Edgeless City growth
T Florida is perhaps the most
centerless large office market
in the U.S.29 Like much of the
Sunbelt, South Florida’s downtown
centers have never been as big or
largest percentage (19 percent) of occurs outside central cities, it pulls dense as Northeast and Midwest
household income spent on trans- resources from the regional core. downtowns. At the same time, South
portation.21 However, there are those Research has shown that the metro- Florida has developed few of the large-
who argue that, while office sprawl politan periphery has received far scale suburban office centers, or Edge
may add to commuting lengths, it more investment than the center and Cities, commonly found in other Sun-
reduces congestion, increases speeds the inner ring of suburbs.27 The entire belt regions such as Atlanta, Houston,
and thereby little alters commuting region pays the public subsidies that and Dallas. Put it together, and this
time.22 Edgeless City expansion may are required for Edgeless city infra- combination of modest downtowns
also lessen some of the congestion structure and road building projects. If and small dispersed suburban centers
problems around big Edge Cities.23 Edgeless Cities capture a growing makes South Florida the nation’s
share of a region’s office development, leader in office sprawl.
Jobs/Housing Balance they may add to existing regional At the moment, to be sure, South
The jobs/housing balance may actually inequalities with regard to public Florida is in flux. It does not appear
improve in many suburbs as Edgeless infrastructure expenditures. In the that the volume of office space in
Cities growth diffuses offices deeper case of South Florida, this would see South Florida’s Edgeless Cities is
into residential areas. The data in this the west draw resources away from the growing. Perhaps South Florida has
study shows that office space is in fact east as it develops. reached some outer limit of office
widely distributed throughout South sprawl, and some coalescence of new
Florida. But that may not translate into Fiscal Capacity development is occurring in its cen-
significant reductions of commuting Because Edgeless Cities distribute ters. But while the pace of this
distances.24 The paradox results from office space so widely, they may help edgeless growth may be abating, it is
the fact that the local Edgeless City some suburban municipal budgets by clear that leaders in South Florida
building may not be the destination for adding valuable ratables to the tax need to understand the development
a particular commuter. Given that base. Office development, especially patterns of the past 20 years, and
Edgeless Cities are not concentrated high-tech research parks, enhances fis- anticipate where growth will occur in
employment centers or “destinations,” cal capacity. If Edgeless Cities are built the future. Only by doing so will they
it is doubtful that the people living in less affluent municipalities than be prepared to respond to the many
near them actually work there. Edge Cities, their presence may even policy challenges these trends portend.
CE N T E R ON UR B A N AND M E T R O P O L I TA N P O L I C Y March 2003 • The B rookings Institution • Survey Series 9
10. Appendix. Measuring and Cushman and Wakefield Office Data nificant share) in 13 of the nation’s
Mapping Office Data Cushman and Wakefield’s survey of largest metropolitan areas. While retail
office buildings is based on a two-tier space is not specifically tracked, the
Sources of Office Data market categorization. A distinction is presence or absence of large regional
Government agencies do not collect made between Class A space, or the malls amid office development was
office market statistics. Instead, a vari- primary market, and Class B offices, noted.
ety of real estate brokers, consulting the secondary market. Class A build- Also missing from the study were
firms, realty and building associations, ings generally have 200,000 or more small office buildings, such as those
and office guide publishers gather this rentable square feet, are professionally occupied by local professionals (e.g.,
data. Given the diversity of sources, managed, have prime locations, are dentists and tax preparers). These
with correspondingly varied foci and finished with superior materials (such services have long been dispersed
interests, no uniform guidelines exist as marble in lobbies), and command because they fill local needs and thus
for determining even basic attributes higher rents. Class B offices are of any followed people to the suburbs. This
of office markets such as total size. In size, even as small as 15,000 square study instead zeros in on the type of
fact, there is not even a general agree- feet. Further, they are not located in office buildings that used to be almost
ment as to what should be categorized prime areas and have moderate rents. exclusively found in large commercial
as an office building. Therefore, any Cushman and Wakefield does survey centers and housed businesses such as
compilation of office statistics must to both A and B space, however its advertising and financial services
an extent be customized and data research is geared toward the higher firms.
selected on the basis of relevance to end of the market and thus A space is Had all local businesses been
the task at hand. over represented in its reports. included in this analysis, the region
The major source for office data in Like Black’s Guide, Cushman and would have appeared so radically
this study is Black’s Guide, an impor- Wakefield also surveys only multi-ten- decentralized that the region’s extreme
tant reference in the commercial real anted offices. Inventory calculations job sprawl would have obscured the
estate industry published in Gaithers- additionally exclude owner-occupied recent shift of higher-order economic
burg, MD. Data from Cushman and buildings, government and medical activity from the center to the edge.
Wakefield, a national commercial real- facilities, and proposed projects.
tor, was also used. Buildings under construction are
included if they have a certificate of
Black’s Guide Office Data occupancy as of November 15 of the
Black’s Guide lists multi-tenanted year they are reported.
rental office buildings of 15,000 Black’s Guide and Cushman and
square feet or more that are identified Wakefield’s survey of rental offices
as either existing, under construction, both include, in addition, occupied
or proposed. Inventory data, by which properties that are also partially leased
total market size is determined, out to other companies. In such
includes buildings under construction instances, the entire building, not just
at the time of the survey but not those the leased portion, factors into the
proposed, even if a starting date is inventory of rental-office space.
given. Black’s Guide surveys even the
smallest suburban office markets, mak- Limits of Office Data
ing it possible to compare data across While office data is an important indi-
regions. Buildings are listed in the pub- cator of metropolitan change, it
lication at no cost to owners or cannot convey the whole picture. The
developers, and the guide is distributed offices documented in the study are
free to companies and institutions leased, multi-tenanted buildings that
involved in the office-leasing process. exclude such other major employment
Black’s Guide’s primary source of rev- facilities as government offices, ware-
enue is display advertising. houses, flex space (offices combined
with light manufacturing), hospitals
and universities. That means this
study reports on only a portion of the
white-collar employment (albeit a sig-
10 March 2003 • The Brookings Inst itution • Survey Series C ENTER ON UR B A N AND M E T R O P O L I TA N P O L I C Y
11. 11. Cushman and Wakefield does not report 27. Myron Orfield, Metropolitics: A Regional
Endnotes on Broward and Palm Beach Counties, Agenda for Community and Stability
1. Robert Lang directs the Metropolitan Insti- thus analysis of this data focuses only on (Washington: Brookings Institution Press,
tute at Virginia Polytechnic Institute and Miami-Dade County. 1997).
State University. He is the author of Edge-
less Cities: Exploring the Elusive Metropolis 12. Robert M. Fogelson, Downtown: Its Rise 28. Myron Orfield, American Metropolitics
(Brookings Institution Press). and Fall, 1880–1950 (New Haven: Yale (Washington: Brookings Institution Press,
University Press, 2001). 2002).
2. Robert Lang, “Office Sprawl: The Evolving
Geography of Business” (Washington: 13. Joel Garreau, Edge City: Life on the New 29. Lang, Edgeless Cities. See also Lang
Brookings Institution, 2000). Frontier (New York: Doubleday, 1991). “Office Sprawl.”
3. Christopher B. Leinberger and Charles 14. Lang, “Office Sprawl.” See also, Lang,
Lockwood, “How Business is Reshaping Edgeless Cities.
America,” The Atlantic 258(10)(1986): 15. Lang, Edgeless Cities.
43–52. See also Robert Lang, “Office
Sprawl: The Evolving Geography of Busi- 16. Robert Burchell and others, The Costs of
ness.” Sprawl—Revisited (Washington: National
Academy Press, 1998). See also Reid
4. Robert Cervero, “Unlocking Suburban Ewing, “Characteristics, Causes and
Gridlock,” Journal of the American Plan- Effects of Sprawl: A Literature Review,”
ning Association 52(4)(1986): 389–406. Environmental and Urban Issues (Winter)
See also John Kain, “The Spatial Mismatch (1994): 1–15.
Hypothesis: Three Decades Later,” Hous-
ing Policy Debate 3(2)(1991): 371–459. 17. Lang, Edgeless Cities.
5. Richard D. Bingham. et al., Beyond Edge 18. Robert E. Lang, “Open Spaces, Bounded
Cities (New York: Garland, 1997). See also Place: Does the West’s Arid Environment
Chengri Ding and Richard D. Bingham. Yield Dense Metropolitan Growth?” Hous-
“Beyond Edge Cities: Job Decentralization ing Policy Debate 13(4)(2002).
and Urban Sprawl,” Urban Affairs Review 19. L.D. Frank and Gary Pivo, “The Relation-
35(6)(2000): 837–855. ship Between Land Use and Travel
6. Robert Cervero. “Jobs-Housing Balance Behavior in the Puget Sound Region” WA-
Revisited,” Journal of the American Plan- RD351.1 (Olympia, WA: Washington State
ning Association 62(4)(1996): 492–511. Department of Transportation, 1994).
See also Robert Cervero, America’s Subur- 20. Cervero, America’s Suburban Center. See
ban Center: The Land Use Transportation also Cervero, “Unlocking Suburban Grid-
Link (Boston: Unwin, 1989). lock.”
7. In fact, analysis of “World City” connectiv- 21. Barbara MaCann, “Driven to Spend:
ity in financial flows finds that South Sprawl and Household Transportation
Florida is more connected with Latin Expenses” (Washington, D.C.: Surface
America than with the rest of the United Transportation Policy Project and Center
States. The region is also the main link for Neighborhood Technology, 2002).
between financial centers in Latin America
22. Peter Gorden and Harry Richardson, “Con-
and the rest of the world. See Edward
gestion Trends in Metropolitan Areas.” In
Brown, George Catelano, and Peter J. Tay-
Curbing Gridlock: Peaking Period Fees to
lor, “Beyond World Cities: Central America
Relieve Traffic Congestion (Washington:
in a Global Space of Flows,” Area
National Academy Press, 1994).
34(2)(2002): 139–148.
23. Randall Crane, “Cars and Drivers in the
8. See Wilbur Zelinsky. The Cultural Geogra-
New Suburb: Linking Access to Travel in
phy of the United States (Englewood Cliffs,
Neo-Traditional Planning,” Journal of
NJ: Prentice Hall, 1973).
American Planning Association 62
9. This analysis is based on Consolidated (1)(1996): 51–65.
Metropolitan Statistical Areas (CMSAs),
24. Cervero, “Jobs-Housing Balance Revis-
except for Washington—which includes
ited.” See also Robert Cervero and Robert
only the PMSA—and South Florida, which
Gorham, “Commuting in Transit versus
includes the CMSA of Miami-Fort Laud-
Automobile Neighborhoods,” Journal of the
erdale, plus the MSA of Palm Beach
American Planning Association
County. For more details on the data and
61(2)(1995): 210–225.
methods used in this study, see Robert E.
Lang, Edgeless Cities: Exploring the Elusive 25. Robert W. Burchell, South Carolina Infra-
Metropolis (Washington: Brookings Institu- structure Study: Projections of Statewide
tion Press, 2003). Infrastructure Costs 1995–2015 (New
Brunswick, NJ: Rutgers University Center
10. Ibid.
for Urban Policy Research, 1997).
26. Patrick A. McGovern, “Contra Costa
County Edge Cities: The Political Econ-
omy of Planning.” Ph.D. dissertation,
University of California, Berkeley, 1994.
CE N T E R ON UR B A N AND M E T R O P O L I TA N P O L I C Y March 2003 • The B rookings Institution • Survey Series 11
12. Acknowledgments:
The author is grateful for the advice of Jennifer Vey and Rob Puentes of the
Brookings Institution Center on Urban and Metropolitan Policy. He would
also like to thank Jared Lang for help with the data.
The Brookings Institution Center on Urban and Metropolitan Policy would
like to thank the MacArthur Foundations for its support of this project.
Brookings would also like to thank the Fannie Mae Foundation for its
founding support of the urban center and its work.
For More Information:
Robert Lang
Director, Metropolitan Institute
Virginia Polytechnic Institute and State University
Phone: (703) 535-8325
rlang@vt.edu
The Brookings Institution
1775 Massachusetts Avenue, NW • Washington D.C. 20036-2188
Tel: 202-797-6000 • Fax: 202-797-6004
www.brookings.edu
Direct: 202-797-6139 • Fax/direct: 202-797-2965