Lecture - ANCOVA 4 Slides.pdf
•
0 likes•166 views

This document discusses analysis of covariance (ANCOVA) and provides an example to illustrate its use. ANCOVA involves comparing group means after controlling for a continuous covariate variable. The example analyzes data from an experiment testing four glue formulations, with tensile strength as the dependent variable and thickness as the covariate. ANCOVA is conducted since thickness is related to strength. The results show the covariate (thickness) has a significant effect on strength, but the factor (formulation) does not have a significant effect on strength after controlling for thickness. The adjusted group means from ANCOVA are closer together than the unadjusted means, indicating ANCOVA was necessary to properly analyze the data.

Recommended
More Related Content
What's hot
What's hot (20)
Similar to Lecture - ANCOVA 4 Slides.pdf
Similar to Lecture - ANCOVA 4 Slides.pdf (20)
More from muhammad shahid
More from muhammad shahid (12)
Recently uploaded
Recently uploaded (20)
Lecture - ANCOVA 4 Slides.pdf
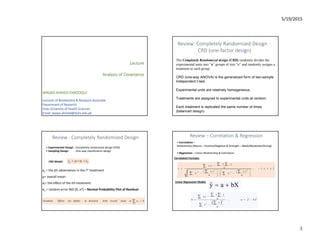
- 1. 5/19/2015 1 WAQAS AHMED FAROOQUI Lecturer of Biostatistics & Research Associate Department of Research Dow University of Health Sciences Email: waqas.ahmed@duhs.edu.pk Review: Completely Randomized Design ‐ CRD (one‐factor design) The Completely Randomized design (CRD) randomly divides the experimental units into “a” groups of size “n” and randomly assigns a treatment to each group. CRD (one-way ANOVA) is the generalized form of two-sample Independent t-test. Experimental units are relatively homogeneous. Treatments are assigned to experimental units at random. Each treatment is replicated the same number of times (balanced design). Review ‐ Completely Randomized Design • Experimental Design ‐ Completely randomized design (CRD) • Sampling Design ‐ One‐way classification design CRD Model: ij i ij y 0 1 t i i so mean overall from deviation as defines are Effects Treatment yij = the jth observation in the ith treatment µ= overall mean αi= the effect of the ith treatment eij = random error NID (0, σ2) – Normal Probability Plot of Residual Review – Correlation & Regression • Correlation – Relationship (Nature – Positive/Negative & Strength – Weak/Moderate/Strong) • Regression – Linear Relationship & Estimation Correlation Formula: 2 2 2 2 x y x y n r ; 1 1 ( x ) ( y ) x . y n n r bX a ŷ 2 2 b ; x y x y n a y b x x x n Linear Regression Model:
- 2. 5/19/2015 2 INTRODUCTION: The Analysis of covariance (ANCOVA) is another technique that occasionally useful for improving the precision of an experiment. Suppose in a experiment with a response variable Y there is another variable, such as X, and that Y is linearly dependent to X. Further more X cannot be controlled by the experimenter but can be observed along with Y. The variable X is called covariate. The ANCOVA involves adjusting the observed response variable for the effect of covariate. Analysis of Covariance (ANCOVA) is a statistical test related to ANOVA It tests whether there is a significant difference between groups after controlling for variance explained by a covariate A covariate is a continuous variable that correlates with the dependent variable Analysis of Covariance ANCOVA is the combination of linear regression model and the model employed in the ANOVA Can be used to compare g treatments, after controlling for quantitative factor believed to be related to response (e.g. pre‐treatment score) Can be used to compare regression equations among g groups (e.g. common slopes and/or intercepts) Advantage: Analysis of Covariance Example Nineteen rats are assigned at random among four experimental groups. Each group is fed a different diet. The data are rat body weights, in kilograms, after being raised on these diets. We wish to ask whether rat weights are the same for all four diets. Fed at Different Diet Feed 1 Feed 2 Feed 3 Weight Age Weight Age Weight Age 60.8 3 68.7 4 61.9 3 67.0 3.5 67.7 2 64.2 3.7 65.0 3.2 75.0 3 63.1 3.5 68.6 3.3 73.3 5.5 66.7 4 61.7 1.2 71.8 5 60.3 2.9 Question? In determining how different Diets will affect a weight, it may be essential to take age into account. ANOVA One way ANCOVA with single factor and a covariate Involves one qualitative variable (factor), One continuous (Y, response, dependent) variable Involves one qualitative variable (factor) , one continuous( Y, response, dependent) variable and an other continuous variable (X, covariate)
- 3. 5/19/2015 3 Analysis of Covariance Model Assume that there is a linear relationship between the response and the covariate, an appropriate statistical model is .. 1, 2,....., ( ) 1, 2,...., ij i ij ij i a Y X X j n Where Y ij is the j th observation on the response variable taken under the i th treatment or level of the single factor. X ij is the measurement made on the covariate, is the mean of the X ij µ is the overall mean τ is the effect of the i th treatment. β is the linear regression coefficient(common slop) indicating the dependency of Yij on X ij ε ij are random error component. .. X We assume that ε ij are NID(0, σ2 ), that the slop β ≠ 0 and the relationship between Yij and X ij is linear, that the regression coefficients for each treatment are identical, that the treatment effects sum to zero, and the covariates X ij is not affected by the treatment. Notice immediately previous equation, that the analysis of covariance model is a combination of the models employed in analysis of variance and regression. That is we have treatment effect {τ} as in a single factor analysis of variance and a regression coefficient β as in regression analysis. We can rewrite previous model as 1, 2 , ..... , ' 1, 2 , .... , ij i ij ij i a Y X j n Where µ` is a constant not equal to the overall mean, which for this model is .. X Analysis of Covariance Model (Cont..) Assumptions for ANCOVA ANOVA Assumptions: • The response variable (data) are randomly sampled (Run Test) • Group are normally distributed (Kalmogrov Simrnov (ni≥50)/ Shapiro Walk (ni<50) Test) • Variance is equal between groups (Homogeneity of Variance Test) • All measurements are independent (No Trend or Funnel Shape) • The residuals (error) are normally distributed (Q‐Q Plot for Error) Also, for ANCOVA: Linearity: relationship between covariate and dependent variable is linear Independence : covariate and treatment effect are independent (treatment do not effect covariates X because technique remove the effect of variation in) Homogeneity: Assuming that there is a common slope for the covariate effect with all levels of the experimental factor regression slops Hypotheses for ANCOVA • H0 and H1 need to be stated slightly differently for an ANCOVA than a regular ANOVA • H0: the group means are equal after controlling for the covariate • H1: the group means are not equal after controlling for the covariate The model allows to estimate the factor effects through estimation of the µ. One can also test for significant differences in the effects due to the factor levels by testing 0 1 2 3 : . . . . : a a i H H a t l e a s t t w o d i f f e r Testing for Treatment Effect
- 4. 5/19/2015 4 Testing for Regression Coefficient Likewise, one can estimate the effect of the covariate on the response through the estimation of β. One can also test whether the covariate has a statistically significant effect on the response by testing 0 : 0 : 0 a H H If we fail to reject null hypothesis then we no need to run ANCOVA But if null hypothesis is rejected then the adjustment provided by the ANCOVA is necessary . . . .. ˆ( ) i i i Adjusted Y Y X X 23‐14 Example Four different formulations of an industrial glue are being tested. The tensile strength (response) of the glue is known to be related to the thickness as applied. Five observations on strength (Y) in pounds, and thickness (X) in 0.01 inches are made for each formulation. Here: • There are t=4 treatments (formulations of glue). • Covariate X is thickness of applied glue. • Each treatment is replicated n=5 times at different values of X. Formulation Strength (Pounds) Thickness (Inches) 1 46.5 13 1 45.9 14 1 49.8 12 1 46.1 12 1 44.3 14 2 48.7 12 2 49.0 10 2 50.1 11 2 48.5 12 2 45.2 14 3 46.3 15 3 47.1 14 3 48.9 11 3 48.2 11 3 50.3 10 4 44.7 16 4 43.0 15 4 51.0 10 4 48.1 12 4 46.8 11 First we look is there any relationship between strength (Y) and thickness (X). For this purpose we made scatter plot between strength (Y) and thickness (X). There is a strong suggestion of a linear relationship between strength and thickness, and seems appropriate to remove the effect of thickness on strength by ANCOVA Analysis of Covariance (SPSS Data) ANCOVA.sav
- 5. 5/19/2015 5 Analysis of Covariance (Scatter Plot) ANCOVA.sav Now we run ANCOVA WHY ? Because there is relationship between dependent variable (strength) and a covariate (thickness) Analysis of Covariance (ANCOVA) ANCOVA.sav These are the unadjusted means of strength (dependent variable) Analysis of Covariance (ANCOVA)
- 6. 5/19/2015 6 Also Effect size for Formulation is 0.103 (10%) so we can say there is no large contribution of different formulation levels in increasing or decreasing glue strength. 0 1 2 3 4 : : a i H H a t l e a s t t w o d i f f e r Testing for Formulation Level of significance : α = 0.05 We will reject null hypothesis if Fcal > Ftab or P‐value ≤ α Results : P‐value = 0.640 Analysis of Covariance (ANCOVA) Since P‐value for Formulation is 0.640 so we can not reject the null hypothesis of no effect of formulation, hence there is no strong evidence that the industrial glue by formulation differ in strength. Confirmation of Non significance of formulation by Post Hoc (LSD) tests Non of the pair is significant confirming the over all non significance of factor formulation. Also Effect size for thickness is 0.685 (68.5%) so we can say there is a large contribution of thickness in increasing or decreasing glue strength. Testing for Regression Coefficient ( Slope ; β1) Level of significance : α = 0.05 We will reject null hypothesis if Fcal > Ftab or P‐value ≤ α Results : P‐value = 0.000 (< 0.001) Analysis of Covariance (ANCOVA) Since P‐value for thickness is less than 0.001 so we reject the null hypothesis β1=0, hence there is a linear relationship between strength and thickness. 0 1 1 : 0 : 0 a H H Adjusted means of strength (dependent variable) Adjusted means of Dependent variable These adjusted means can also be obtained manually by using the equation . . . .. ˆ( ) i i i Adjusted Y Y X X unadjusted Now the adjustment provided by the ANCOVA is necessary.
- 7. 5/19/2015 7 . . . .. ˆ( ) i i i Adjusted Y Y X X Unadjusted Unadjusted Mean Strength Adjusted Mean Strength 46.520 47.045 48.300 47.680 48.160 47.921 46.720 47.054 Comparing the adjusted mean with unadjusted mean, we note that the adjusted means are much closer together, another indication that the ANCOVA was necessary. THANK YOU