Change Your Space, Change Your Culture Real Estate Fact Sheet
•
1 like•807 views

This document summarizes research on performance metrics and trends in 21st century real estate for corporate America. Key findings include: - Case studies of CBRE and Cousins Properties found that renovating workspaces to be more collaborative and open floor plan led to significant cost savings over the life of the leases and increased productivity despite using less total space. - CoreNet data shows the average space per worker is declining as companies adopt more collaborative spaces and open floor plans enabled by new technologies. - A new paradigm in office design incorporates smaller workstations, open floor plans, and amenities to promote chance interactions and collaboration between employees.

Recommended
Recommended
More Related Content
Similar to Change Your Space, Change Your Culture Real Estate Fact Sheet
Similar to Change Your Space, Change Your Culture Real Estate Fact Sheet (20)
More from GomindSHIFT
More from GomindSHIFT (20)
Recently uploaded
Recently uploaded (20)
Change Your Space, Change Your Culture Real Estate Fact Sheet
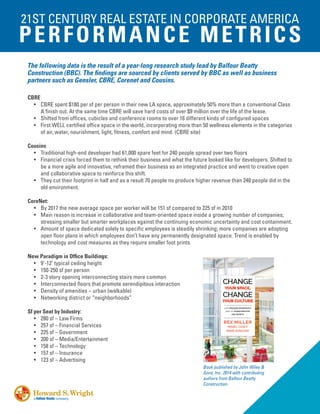
- 1. 21ST CENTURY REAL ESTATE IN CORPORATE AMERICA PERFORMANCE METRICS The following data is the result of a year-long research study co-led by Balfour Beatty Construction. The findings are sourced from the resulting book – Change Your Space, Change Your Culture, reports and articles as well as business partners such as Gensler, CBRE, CoreNet and Cousins. CBRE CASE STUDY • CBRE spent $180 per rentable square foot per person in their new LA space, approximately 50% more than a conventional Class A finish out; at the same time CBRE will save hard costs of over $9 million over the life of the lease • They shifted from offices, cubicles and conference rooms to more than 16 different kinds of configured spaces • First WELL certified office space in the world, incorporating more than 50 wellness elements in the categories of air, water, nourishment, light, fitness, comfort and mind COUSINS CASE STUDY • Traditional high-end developer had 61,000 rentable square feet for 240 people spread throughout two floors • The financial crisis forced Cousins to rethink their business and what the future looked like for developers; they shifted to be more agile and innovative, thus reframed their business as an integrated practice and went to creative, open and collaborative space to reinforce this shift • Cousins cut their footprint in half and as a result 70 people now produce higher revenue than 240 people did in the old environment CORENET DATA • By 2017 the new average space per worker will be 151 usable square feet compared to 175 usable square feet in 2012 • Main reason is the increase in collaborative and team-oriented space inside a growing number of companies; stressing smaller but smarter workplaces against the continuing economic uncertainty and cost containment • Amount of space dedicated solely to specific employees is steadily shrinking; more companies are adopting open floor plans in which employees don’t have any permanently designated space; this trend is enabled by technology and cost measures as they require smaller foot prints NEW PARADIGM IN OFFICE BUILDINGS: • 9’-12’ typical ceiling height • 150-250 usable square feet per person • 2-3 story opening interconnecting stairs more common • Interconnected floors that promote serendipitous interaction • Density of amenities – urban (walk-able) • Networking district or “neighborhoods” USABLE SQUARE FEET PER SEAT BY INDUSTRY: • 280 sf – Law Firms • 257 sf – Financial Services • 225 sf – Government • 200 sf – Media/Entertainment • 158 sf – Technology • 157 sf – Insurance • 123 sf – Advertising Book published by John Wiley & Sons, Inc. 2014 with contributing authors from Balfour Beatty Construction.
- 2. HARVARD BUSINESS REVIEW – “WORKSPACES THAT MOVE PEOPLE” • Creative ideas aren’t going to come while sitting in front of your monitor • New buildings should be designed not just to spark collaboration but innovation you experience when you collide with people • Emerging evidence: face-to-face interactions are by far the most important activity in an office; data suggest that creating collisions – chance encounters and unplanned interactions between knowledge workers inside and outside the organization improves performance • When collisions occur, regardless of their content, improvement typically follows • Study: a company invested several hundred thousand dollars to rip out the coffee stations and build fewer, bigger ones – just one for every 120 employees; also created a large cafeteria for all employees in place of a much smaller one. In the quarter after the switch, sales rose by 20% or $200 million • One size doesn’t fit all – companies must understand what behaviors they’re trying to achieve and design space that will foster those behaviors HAPPINESS BY DESIGN: An on-going study looking into companies investing in ways to measure how happy employees are and how to make them happier and how workspaces contribute: • Happy workers are 22% more productive • Happy workers 28% less absent; means 12.3 days and $619/year per happy employee ENGAGEMENT FACTS FROM CHANGE YOUR SPACE, CHANGE YOUR CULTURE: Companies with low engagement suffer from: • A 32% decrease in operating income • Almost 4% decline in net income • 11% reduction in earning • Up to 3% of a company’s gross revenue is lost in turnover